

One barrier to cataract surgery is its high price in some countries. This study aims to understand to what extent the price of cataract surgery is over- or undervalued and whether it varies in relation to GDP using The Economist newspaper Big Mac Index (BMcI) methodology, which measures the purchasing power parity between different currencies.
MethodsPeer-reviewed articles containing information on cataract surgery prices were searched from 1993 to June 2012 in databases. Ophthalmologists in different countries were also contacted to provide prices. Phacoemulsification prices were adjusted to 2012 US dollars and were weighted depending on the source and year that they were obtained. Big Mac prices in different countries were obtained at The Economist website.
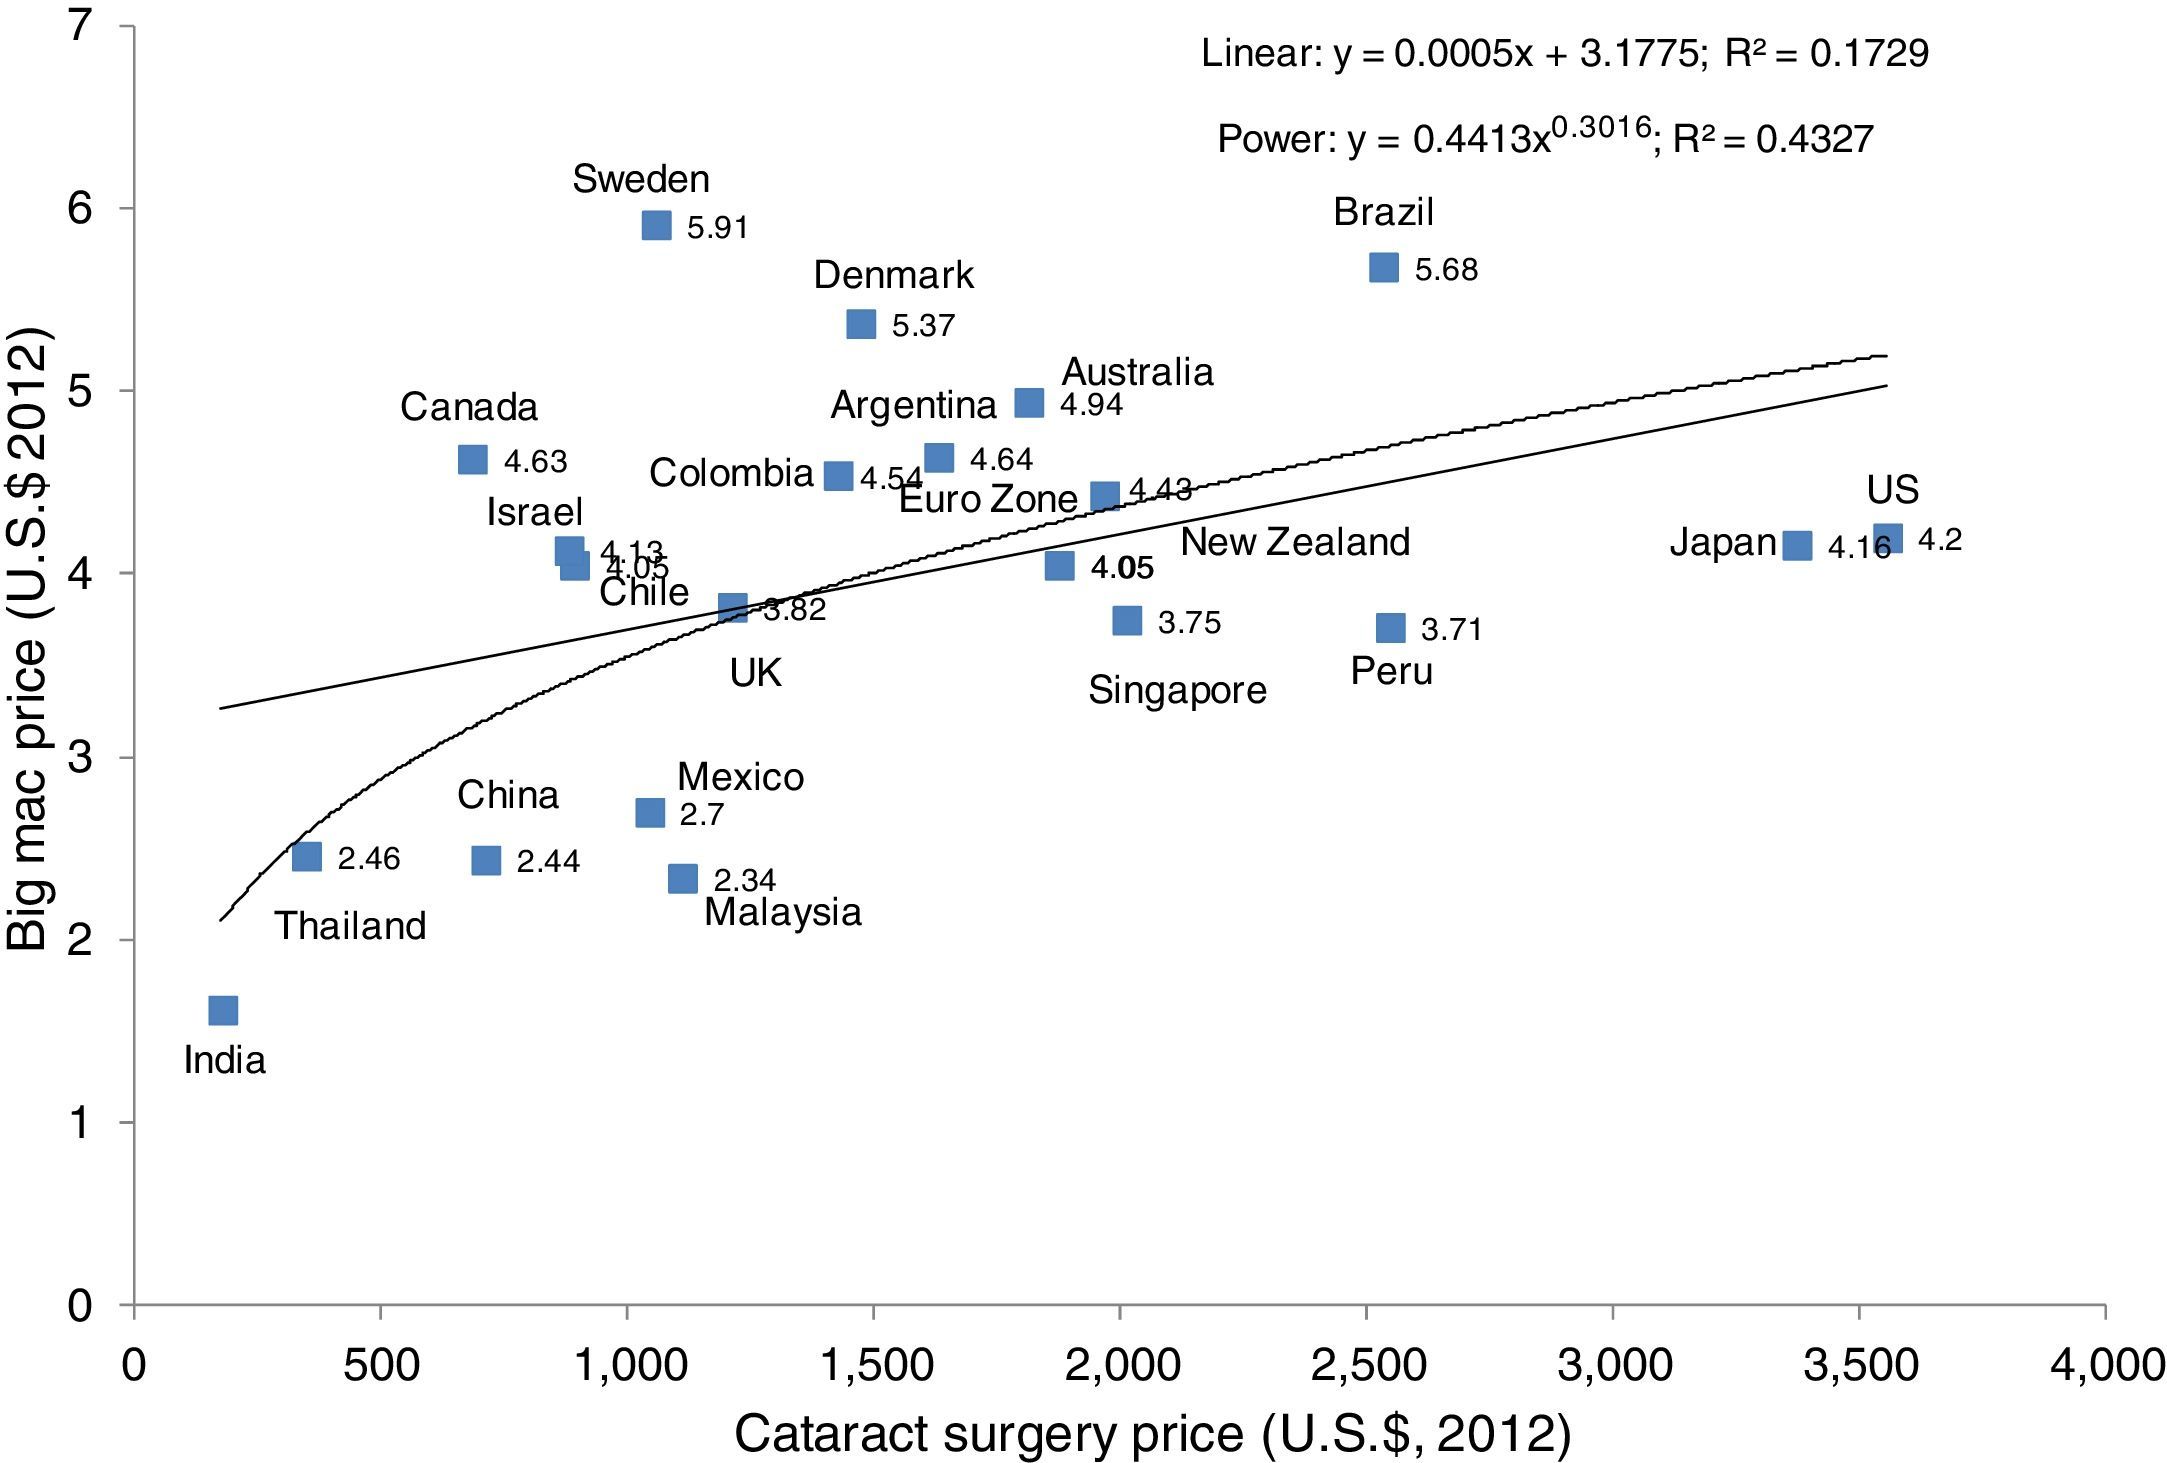
ResultsData were collected from 20 countries and the Euro Zone. Cataract surgical prices varied from USD 178 (India) to USD 3557 (US). Big Mac prices ranged from USD 1.62 (India) to $5.91 (Sweden). There was no linear correlation between Big Mac prices and cataract surgical prices; best fit was a power curve with an R squared of 0.433 (p=0.001).
ConclusionThe price of cataract surgery does not consider the patient's capacity to pay, based on a simple tool such as the BMcI. This suggests affordability issues, particularly when patients work for minimum wages and/or do not have access to free health care.
Una barrera para la cirugía de catarata es su alto precio en algunos países. Este estudio tiene como objetivo comprender en qué medida el precio de la cirugía de catarata está super o infravalorada y si varía en relación con el PIB utilizando la metodología del Índice Big Mac (BMCI) del diario The Economist, la cual mide la paridad del poder adquisitivo entre las distintas monedas.
MétodosSe buscaron artículos revisados por pares que contienen información sobre los precios de la cirugía de catarata en el período 1993 hasta junio de 2012 en diferentes bases de datos. También se contactó a oftalmólogos en diferentes países para obtener un rango habitual de precios. Los precios de facoemulsificación se ajustaron a la cotización del dólar americano de junio del 2012 y se ajustaron en función del origen y año en que se obtuvieron. Los precios del Big Mac en diferentes países se obtuvieron en el sitio web de The Economist.
ResultadosSe obtuvieron datos de 20 países y de la Euro Zona. El precio varió de USD 178 (India) a USD 3,557 (EE.UU.). Los precios del Big Mac oscilaron entre USD 1.62 (India) a $ 5,91 (Suecia). No hubo correlación lineal entre los precios del Big Mac y los precios de cirugía de catarata; obteniendo un mejor ajuste con una curva de potencia con un R cuadrada de 0.433 (p=0.001).
ConclusiónEl precio de la cirugía de cataratas no considera la capacidad de pago del paciente sobre la base de una herramienta simple como el BMCI. Esto sugiere problemas de asequibilidad, especialmente cuando los pacientes tienen salarios mínimo y/o no tienen acceso a la atención médica gratuita.
Cataract is the second leading cause of visual impairment (33%) and the leading cause of blindness (51%) worldwide.1 Although cataract surgery is the most common operation in ophthalmology and one of the most cost effective methods of restoring sight in avoidable blindness, the relatively high price of cataract surgery is one of the key surgical barriers of cataract patients in some countries.2,3
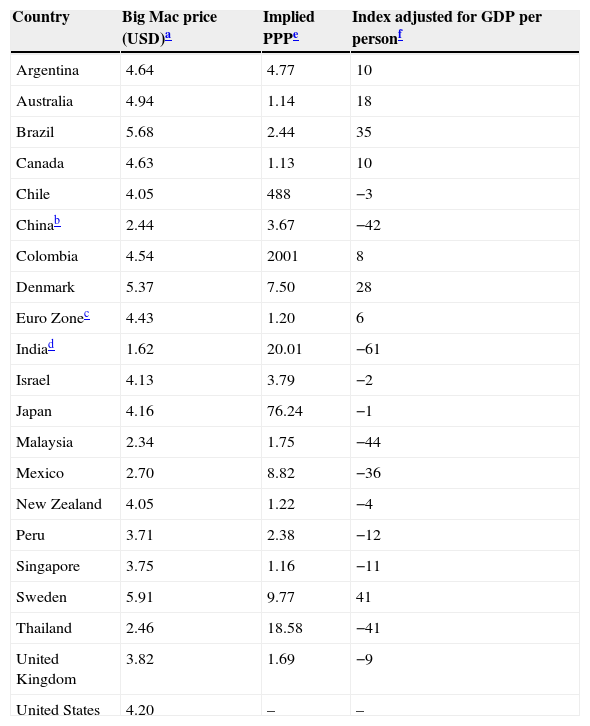
This study considers the affordability of cataract surgery in selected countries across regions through a cross-analysis of cataract surgery prices with The Economist's Big Mac Index (BMcI).4 The BMcI is an informal economic indicator for comparing currency values that has been updated annually by The Economist newspaper since 1986. The BMcI compares the prices of Big Mac hamburgers between countries based on the theory of purchasing-power parity (PPP), the notion that in the long run, exchange rates should move toward the rate that would equalize the prices of a basket of goods and services (in this case, a McDonald's hamburger) around the world.5,6 Average prices should be lower in poor countries than in rich ones, because labor prices are lower. To estimate the current fair value of a currency, researchers at The Economist used linear regression to determine the line of best fit between Big Mac prices and gross domestic product (GDP) per person. The difference between the price predicted for each country, given its average income, and its actual price offers a better guide for currency under- and overvaluation than the “raw” index. The 2012 BMcI (Table 1) would suggest that the Swiss franc is 62% overvalued, since the exchange rate of the Swiss franc to the American dollar was 1.55:1 based on the value of the hamburger, but the actual exchange rate is only 0.96.6 Likewise, the same comparative currency analysis implies that the India rupee is 60% undervalued. Under- or over-valuation of a currency can potentially impact the affordability of cataract surgery by changing the pricing of imported intraocular lenses or whether a person might choose to have cataract surgery performed in another country. Moreover, large currency changes in the long term can make cataract surgery more or less expensive (along with many other services) depending on how much the country imports goods and how the currency changes affect the national economy.
2012 Big Mac Index with prices given in USD per country and implied purchasing power parity (PPP).
| Country | Big Mac price (USD)a | Implied PPPe | Index adjusted for GDP per personf |
|---|---|---|---|
| Argentina | 4.64 | 4.77 | 10 |
| Australia | 4.94 | 1.14 | 18 |
| Brazil | 5.68 | 2.44 | 35 |
| Canada | 4.63 | 1.13 | 10 |
| Chile | 4.05 | 488 | −3 |
| Chinab | 2.44 | 3.67 | −42 |
| Colombia | 4.54 | 2001 | 8 |
| Denmark | 5.37 | 7.50 | 28 |
| Euro Zonec | 4.43 | 1.20 | 6 |
| Indiad | 1.62 | 20.01 | −61 |
| Israel | 4.13 | 3.79 | −2 |
| Japan | 4.16 | 76.24 | −1 |
| Malaysia | 2.34 | 1.75 | −44 |
| Mexico | 2.70 | 8.82 | −36 |
| New Zealand | 4.05 | 1.22 | −4 |
| Peru | 3.71 | 2.38 | −12 |
| Singapore | 3.75 | 1.16 | −11 |
| Sweden | 5.91 | 9.77 | 41 |
| Thailand | 2.46 | 18.58 | −41 |
| United Kingdom | 3.82 | 1.69 | −9 |
| United States | 4.20 | – | – |
At currency exchange rates January 11, 2012. Source: The Economist, published January 12th, 2012 (http://www.economist.com/blogs/graphicdetail/2012/01/daily-chart-3) and for full set of data: http://www.scribd.com/fullscreen/78055840?access_key=key-15f8eo0bvuir2hz6zsja.
This study aims to understand to what extent the price of cataract surgery paid directly by the patient is over- or undervalued using a simple method that compares the price to essential goods (in this case, the price of the Big Mac or equivalent) and whether cataract surgery price varies in relation to GDP. This study does not attempt to evaluate the cost of all cataract surgeries, but rather, the direct, out-of-pocket payment made by patients seeking private care, or who are not able to access public, free, or subsidized care. In many countries, but not all, a proportion of cataract surgeries are provided without any direct payment at the point of care. This proportion varies widely, as well as additional out-of-pocket costs that may still be borne by the patients, in the countries examined in this study. Thus, the research question presented is whether the direct payment correlates to the cost of living in each country with the hypothesis that the higher the GDP is in a country, the higher price the cataract surgery should be.
Materials and methodsPeer-reviewed articles were searched from 1993 to June 2012 containing information on cataract surgery “cost”, “price”, and “expense”, using a combination of the terms “cataract surgery” with these quoted phrase or keywords in the following databases: Pubmed, Lilacs, Bireme, Google Scholar, WebMD, Healthline, LATINDEX, PUBLINDEX, as well as Scholars Portal, DOAJ Directory of Open Access Journals, Free E-journals, Elsevier Science Direct, Ovid, and Scielo. For various countries, up to 3 cataract surgeons, who are active in blindness prevention and/or work in both the public and private sectors, were also contacted via phone and email to furnish information on the price of phacoemulsification in their respective countries. Those who volunteered to further investigate were acknowledged in this study.
Prices generally reflect what the patient is charged directly in a private care setting. However, in some countries, such as Canada and Thailand, where data were more limited, the price is inclusive of the total expenses of carrying out the surgery for both the individual patients and for the health system. In Argentina, the average price of cataract surgery was based on what the most popular private insurance would pay for cataract surgery and what the private-paying patients and the most expensive private insurance would likewise pay for cataract surgery. In Guandong Province, China, the price was based on the average of what the private-paying patients pay in the city of Guangzhou and what the basic price is for cataract surgery covered by insurance in the countryside. It should be emphasized that the prices included in this study are sample prices from each country and may not be representative of the overall average price of surgery in each country.
Using the methodology specified in our previous study,2 the prices of surgery researched in this current study (based on what must be paid in order to get phacoemulsification on one eye) were first converted to dollars using the currency exchange rate for the corresponding year and then adjusted to estimated 2012 prices by using the Consumer Price Index.7
When averaging multiple prices collected per country, the prices were weighted depending on source and, more importantly, the year in which the prices were obtained. Estimates of reliability were based on whether the source was peer-reviewed or by an individual ophthalmic surgeon and the assumption that the more recent data, the more reliable the actual price of surgery. This assumption derives from economics, in which, the older the price is, the more inaccurate is the compounded change. Similarly, when cost-structure is peer-reviewed, it is afforded a much higher level of reliability than personal communications, which are less reliable or representative in a general context. Likewise, prices from an old study are likely to be less liable compared to a study carried out a year ago, due to inflation, and changes in techniques, equipment, and consumables. Arbitrary weights were used, which were spaced equally on a scale. Lower weighting was applied to prices from individual surgeons, and progressively lower weighting was applied for prices older than 5 or 10 years. Prices quoted from the past 5 years were assigned an A for reliability of estimates. Prices from 5 to 10 years ago were assigned a B, and those from more than 10 years ago and from non-peer-reviewed sources (individual surgeons) were assigned a C. The weights applied to the calculations were: 1.0 for an A, 0.75 for a B, and 0.5 for a C. An example calculation follows for Canada, which had surgery priced (and adjusted to 2012 dollars) at $502 in 2003/2004 and at $823 in 2010 (Table 2) for an average of $685 (Table 3). The 2010 price was considered an A (Table 3), and the 2003/2004 price a B. The sum of the weight was 1.75 (A+B, or 1+0.75). Each price was divided by the sum of the weight to obtain their proportional weight (502/1.75=0.43, 823/1.75=0.57). The average was then obtained by adding the sum of the prices multiplied by their proportional weight ((502×0.43)+(823×0.57)=685).
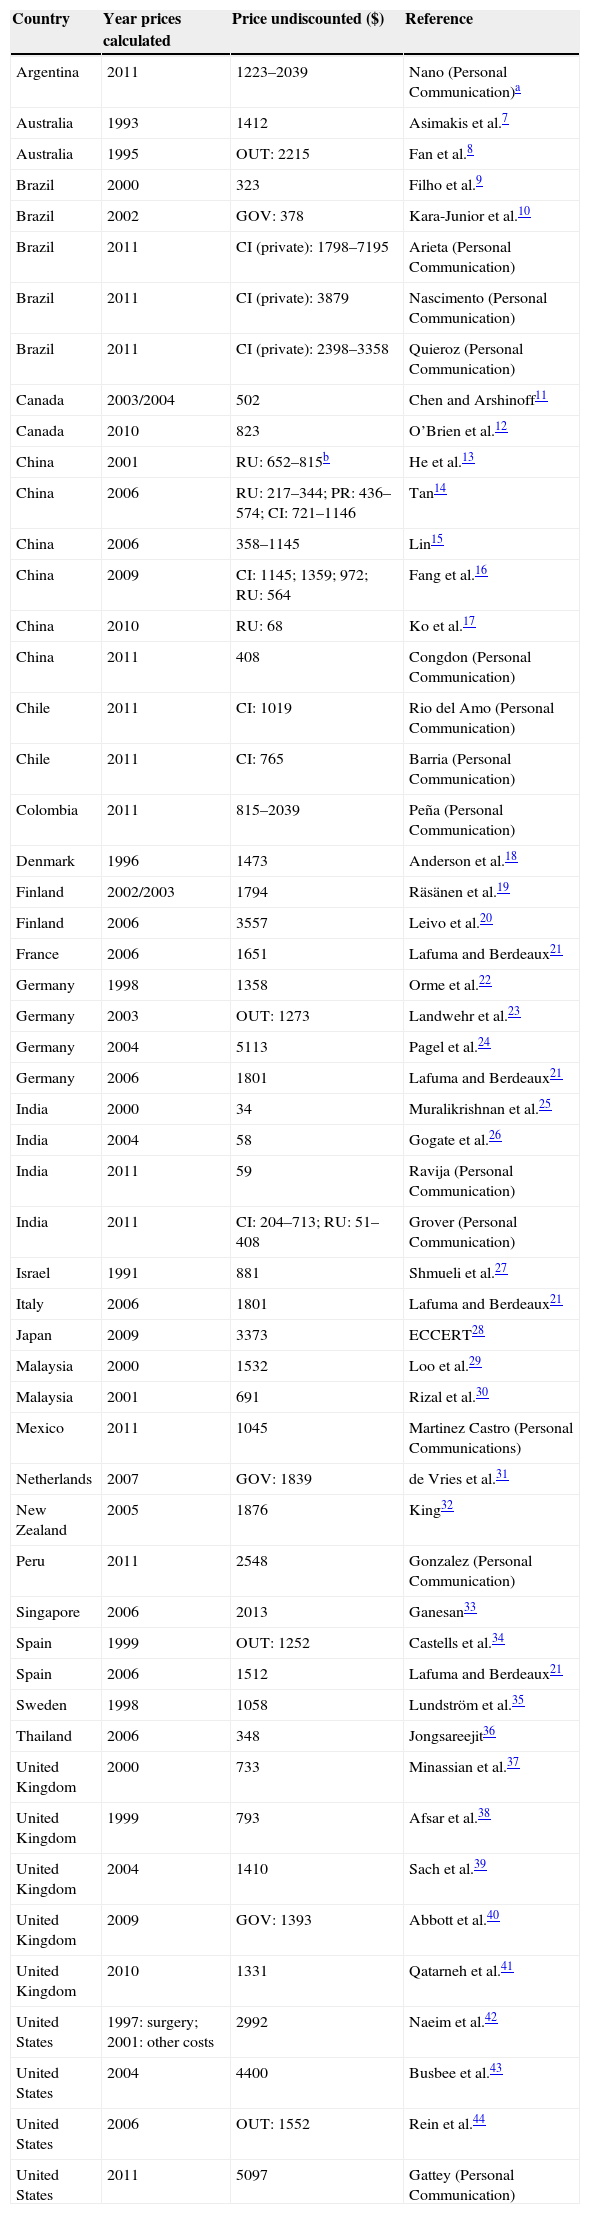
Price of cataract surgery for the first eye calculated for different countries. Prices are standardized to USD 2012 and are for phacoemulsification.
| Country | Year prices calculated | Price undiscounted ($) | Reference |
|---|---|---|---|
| Argentina | 2011 | 1223–2039 | Nano (Personal Communication)a |
| Australia | 1993 | 1412 | Asimakis et al.7 |
| Australia | 1995 | OUT: 2215 | Fan et al.8 |
| Brazil | 2000 | 323 | Filho et al.9 |
| Brazil | 2002 | GOV: 378 | Kara-Junior et al.10 |
| Brazil | 2011 | CI (private): 1798–7195 | Arieta (Personal Communication) |
| Brazil | 2011 | CI (private): 3879 | Nascimento (Personal Communication) |
| Brazil | 2011 | CI (private): 2398–3358 | Quieroz (Personal Communication) |
| Canada | 2003/2004 | 502 | Chen and Arshinoff11 |
| Canada | 2010 | 823 | O’Brien et al.12 |
| China | 2001 | RU: 652–815b | He et al.13 |
| China | 2006 | RU: 217–344; PR: 436–574; CI: 721–1146 | Tan14 |
| China | 2006 | 358–1145 | Lin15 |
| China | 2009 | CI: 1145; 1359; 972; RU: 564 | Fang et al.16 |
| China | 2010 | RU: 68 | Ko et al.17 |
| China | 2011 | 408 | Congdon (Personal Communication) |
| Chile | 2011 | CI: 1019 | Rio del Amo (Personal Communication) |
| Chile | 2011 | CI: 765 | Barria (Personal Communication) |
| Colombia | 2011 | 815–2039 | Peña (Personal Communication) |
| Denmark | 1996 | 1473 | Anderson et al.18 |
| Finland | 2002/2003 | 1794 | Räsänen et al.19 |
| Finland | 2006 | 3557 | Leivo et al.20 |
| France | 2006 | 1651 | Lafuma and Berdeaux21 |
| Germany | 1998 | 1358 | Orme et al.22 |
| Germany | 2003 | OUT: 1273 | Landwehr et al.23 |
| Germany | 2004 | 5113 | Pagel et al.24 |
| Germany | 2006 | 1801 | Lafuma and Berdeaux21 |
| India | 2000 | 34 | Muralikrishnan et al.25 |
| India | 2004 | 58 | Gogate et al.26 |
| India | 2011 | 59 | Ravija (Personal Communication) |
| India | 2011 | CI: 204–713; RU: 51–408 | Grover (Personal Communication) |
| Israel | 1991 | 881 | Shmueli et al.27 |
| Italy | 2006 | 1801 | Lafuma and Berdeaux21 |
| Japan | 2009 | 3373 | ECCERT28 |
| Malaysia | 2000 | 1532 | Loo et al.29 |
| Malaysia | 2001 | 691 | Rizal et al.30 |
| Mexico | 2011 | 1045 | Martinez Castro (Personal Communications) |
| Netherlands | 2007 | GOV: 1839 | de Vries et al.31 |
| New Zealand | 2005 | 1876 | King32 |
| Peru | 2011 | 2548 | Gonzalez (Personal Communication) |
| Singapore | 2006 | 2013 | Ganesan33 |
| Spain | 1999 | OUT: 1252 | Castells et al.34 |
| Spain | 2006 | 1512 | Lafuma and Berdeaux21 |
| Sweden | 1998 | 1058 | Lundström et al.35 |
| Thailand | 2006 | 348 | Jongsareejit36 |
| United Kingdom | 2000 | 733 | Minassian et al.37 |
| United Kingdom | 1999 | 793 | Afsar et al.38 |
| United Kingdom | 2004 | 1410 | Sach et al.39 |
| United Kingdom | 2009 | GOV: 1393 | Abbott et al.40 |
| United Kingdom | 2010 | 1331 | Qatarneh et al.41 |
| United States | 1997: surgery; 2001: other costs | 2992 | Naeim et al.42 |
| United States | 2004 | 4400 | Busbee et al.43 |
| United States | 2006 | OUT: 1552 | Rein et al.44 |
| United States | 2011 | 5097 | Gattey (Personal Communication) |
Key: CI, city; GOV, national hospital; OUT, day surgery; PR, provincial; RU, rural.
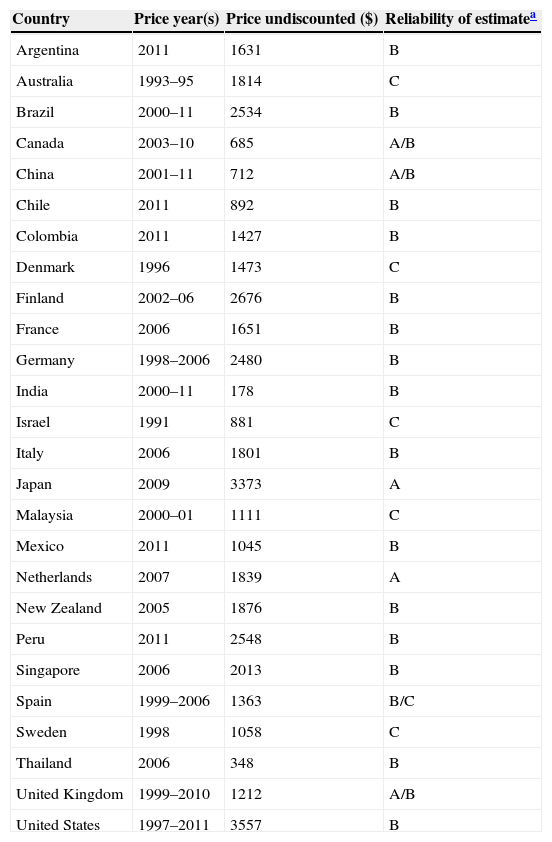
Mean price of cataract surgery (in USD).
| Country | Price year(s) | Price undiscounted ($) | Reliability of estimatea |
|---|---|---|---|
| Argentina | 2011 | 1631 | B |
| Australia | 1993–95 | 1814 | C |
| Brazil | 2000–11 | 2534 | B |
| Canada | 2003–10 | 685 | A/B |
| China | 2001–11 | 712 | A/B |
| Chile | 2011 | 892 | B |
| Colombia | 2011 | 1427 | B |
| Denmark | 1996 | 1473 | C |
| Finland | 2002–06 | 2676 | B |
| France | 2006 | 1651 | B |
| Germany | 1998–2006 | 2480 | B |
| India | 2000–11 | 178 | B |
| Israel | 1991 | 881 | C |
| Italy | 2006 | 1801 | B |
| Japan | 2009 | 3373 | A |
| Malaysia | 2000–01 | 1111 | C |
| Mexico | 2011 | 1045 | B |
| Netherlands | 2007 | 1839 | A |
| New Zealand | 2005 | 1876 | B |
| Peru | 2011 | 2548 | B |
| Singapore | 2006 | 2013 | B |
| Spain | 1999–2006 | 1363 | B/C |
| Sweden | 1998 | 1058 | C |
| Thailand | 2006 | 348 | B |
| United Kingdom | 1999–2010 | 1212 | A/B |
| United States | 1997–2011 | 3557 | B |
The prices of the Big Mac (in 2012 US dollars) in different countries were obtained at The Economist website (published online on January 12th, 2012).6 All countries, for which both prices of cataract surgery and Big Mac could be obtained, were included in this study. For India, the price of the Maharaja Mac was used, which is the local version of the Big Mac that is made of chicken instead of beef. Correlations were modeled using curve-fitting regression procedures for both the BMcI and the 2011 GDP per capita figures (International dollars, PPP method obtained on the International Monetary Fund website). Power curves (equations) and linear equations were fitted using Excel. Thus, one model demonstrates the correlation between Big Mac prices and cataract surgical prices, and the other model demonstrates the correlation between GDP per capita and cataract surgical prices. The intent was to observe whether the relationship between the variables was linear or not. It should be noted that while Big Mac prices and cataract prices given were based on the 2012 prices, the most recent GDP data available for comparison with the 2012 BMcI prices were from 2011. That said, the BMcI was updated in mid-January 2012, when prices, for all intents and purposes, would have been more related to 2011 GDP data than the projected 2012 GDP.
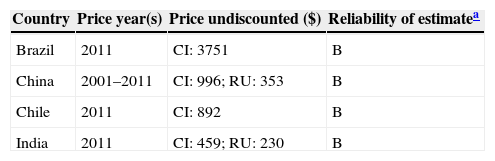
ResultsThere were a total of 56 sources of cataract surgery prices from 26 countries that were included in this study (Table 2). There were 38 sources from peer-reviewed journals and other publications,7–44 and 15 were from individual ophthalmic surgeons. The 2012-adjusted prices were based on prices from 1991 (Israel) to 2011 (Argentina, Brazil, China, India, Mexico, Peru and the United States). When taking the weighted average of prices in each country (Table 3), the cheapest cataract surgery was found to be in India at $178, and the most expensive was in the US at $3557. Within some countries, studies showed that prices varied greatly by location (Table 4). In India, the average city price of $459 per surgery was approximately twice as much as the price in rural areas of $230. In China, the price in urban areas was nearly 3 times as much as that in rural areas, or $996 versus $353 respectively.
Price of cataract surgery by location: city (CI) or rural (RU) (in USD).
| Country | Price year(s) | Price undiscounted ($) | Reliability of estimatea |
|---|---|---|---|
| Brazil | 2011 | CI: 3751 | B |
| China | 2001–2011 | CI: 996; RU: 353 | B |
| Chile | 2011 | CI: 892 | B |
| India | 2011 | CI: 459; RU: 230 | B |
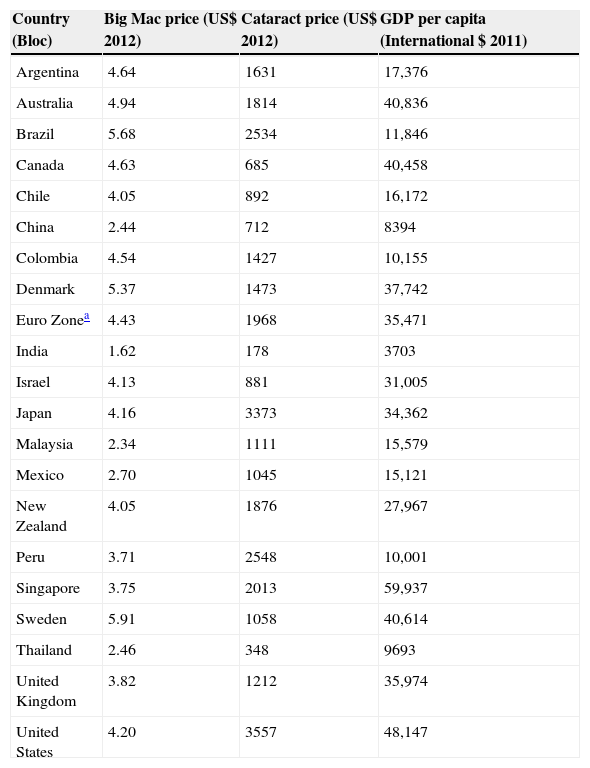
When analyzing the prices of surgery in comparison with the Big Mac prices and the GDP per capita (Table 5), it should be noted that the price data from Finland, France, Germany, Italy, and Spain were averaged as the price for the Euro zone. Prices from Denmark, Sweden, and the United Kingdom were each counted separately in the BMcI. India is shown to not only have the cheapest cataract surgery price at $178, but also the cheapest burger priced at $1.62 and the lowest GDP at $3703. The highest GDP was $59,937 in Singapore, which had a higher mid-range price of surgery at $2013 and an average burger price at $3.75. The most expensive burger priced at $5.91 was found in Sweden, which although had a higher range GDP of $40,614, it had a lower price of surgery ($1058), even in comparison with the Euro zone average price of $1968.
Comparison of Big Mac price, cataract price, and gross domestic product (GDP) data.
| Country (Bloc) | Big Mac price (US$ 2012) | Cataract price (US$ 2012) | GDP per capita (International $ 2011) |
|---|---|---|---|
| Argentina | 4.64 | 1631 | 17,376 |
| Australia | 4.94 | 1814 | 40,836 |
| Brazil | 5.68 | 2534 | 11,846 |
| Canada | 4.63 | 685 | 40,458 |
| Chile | 4.05 | 892 | 16,172 |
| China | 2.44 | 712 | 8394 |
| Colombia | 4.54 | 1427 | 10,155 |
| Denmark | 5.37 | 1473 | 37,742 |
| Euro Zonea | 4.43 | 1968 | 35,471 |
| India | 1.62 | 178 | 3703 |
| Israel | 4.13 | 881 | 31,005 |
| Japan | 4.16 | 3373 | 34,362 |
| Malaysia | 2.34 | 1111 | 15,579 |
| Mexico | 2.70 | 1045 | 15,121 |
| New Zealand | 4.05 | 1876 | 27,967 |
| Peru | 3.71 | 2548 | 10,001 |
| Singapore | 3.75 | 2013 | 59,937 |
| Sweden | 5.91 | 1058 | 40,614 |
| Thailand | 2.46 | 348 | 9693 |
| United Kingdom | 3.82 | 1212 | 35,974 |
| United States | 4.20 | 3557 | 48,147 |
Analysis of the correlation between Big Mac prices and cataract surgery prices (Fig. 1) demonstrated that there was no linear correlation between Big Mac price and cataract surgical prices with an R2 of 0.173 (p=0.061). The best fit was a power curve with an R2 of 0.433 (p=0.001). However, R2, the proportion of variance explained by the model, was still low for this correlation to be considered meaningful (values of 0.4–0.5 would be considered poor to fair correlations). The graph suggests reasonable pricing for the UK with regard to its currency value and price of a Big Mac. Sweden's price of surgery is cheap. The graph shows that India is still expensive for surgery, even though it is the country with the lowest price.

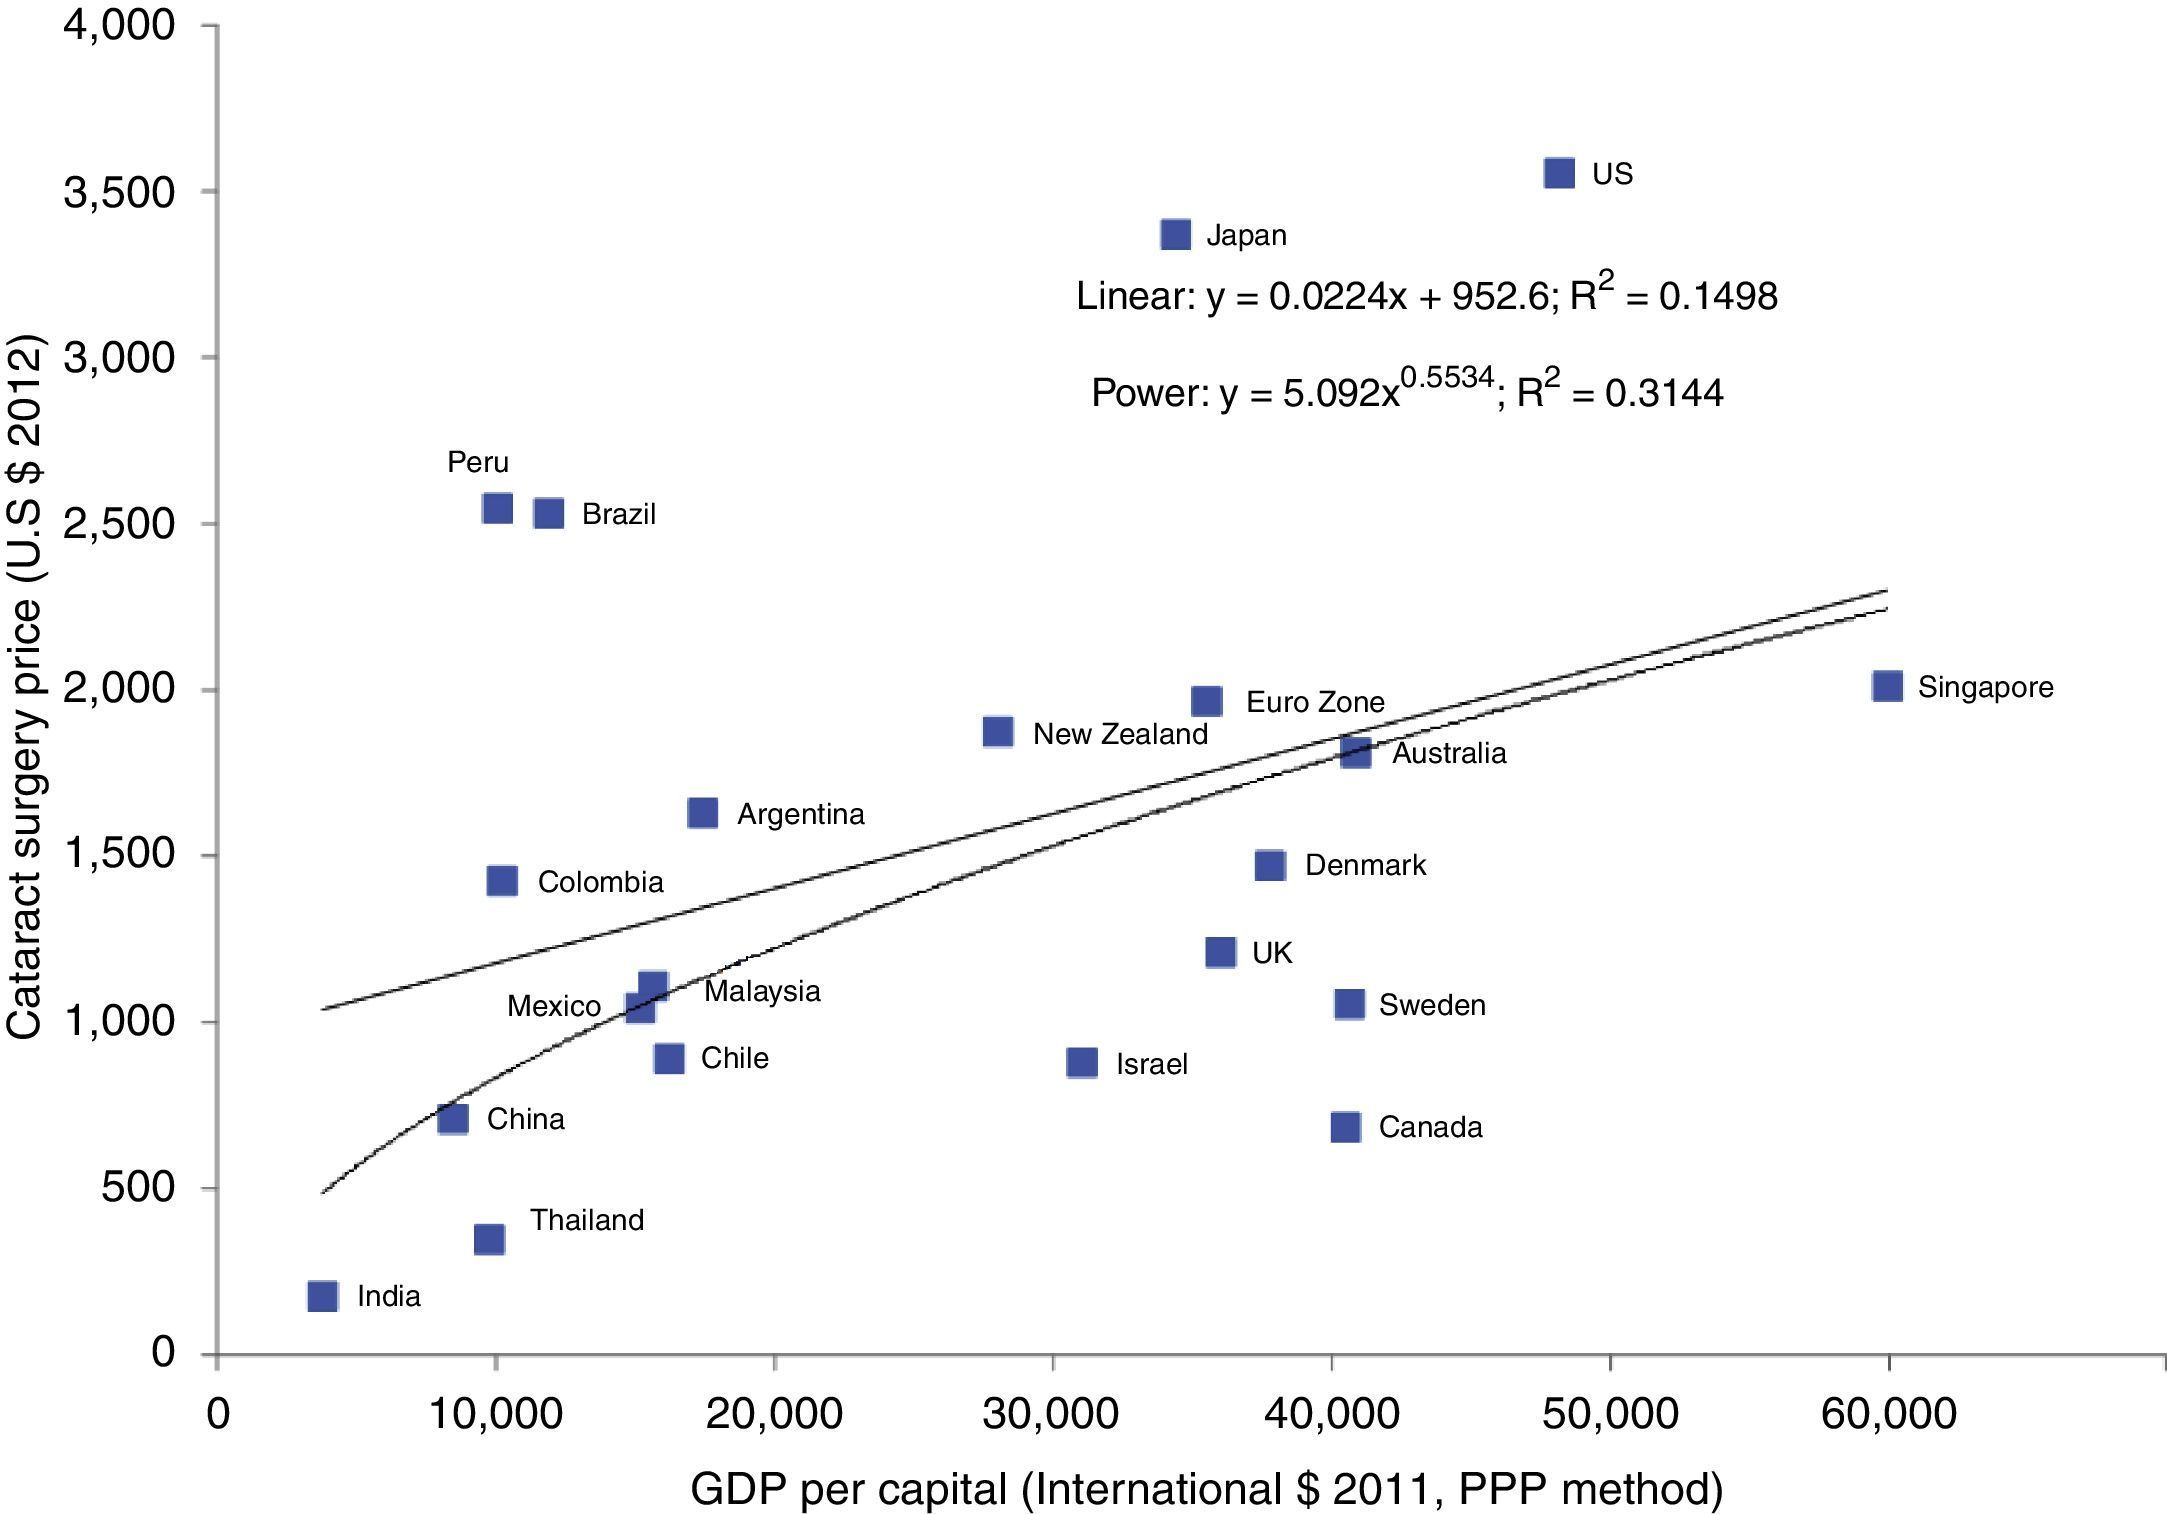
Using 2011 GDP per capita figures (International $) obtained from the PPP method, correlations were plotted similarly to see how appropriate cataract pricing might be with the assumption that the higher the countries’ GDP, the higher would be the price of cataract surgery (Fig. 2). The power curve indicates a weaker correlation than the power curve for cataract vs. Big Mac prices with R2 equal to 0.314 (p=0.008), but the linear correlation is similar (R2=0.150). Looking at the graph, it suggests that pricing for China, Mexico, Malaysia, and Australia is as expected, but for India it is far too low (even more so if a linear correlation is used). Likewise for Thailand, Israel, UK, Canada, and Sweden, prices are too low. Slightly cheaper are prices in Chile, Denmark, and Singapore. For Peru, Brazil, Japan, and the USA, the graph indicates that prices are far too high. Colombia, Argentina, New Zealand, and the Euro zone are slightly expensive. Overall, the correlation between the price of cataract surgery and GDP appears to be weaker than the prices of cataract surgeries and hamburgers in the different countries. However, the results vary for some countries, such as India, Thailand, Brazil, and the UK, where cataract surgery prices are not consistently expensive, cheap, or on target, based on Big Mac prices and GDP per capita in both graphs.
Discussion per capita (purchasing power parity, or PPP method).")
The price of cataract surgery, in general terms, is not related to cost of living in different countries and does not take into consideration the capacity of the patient to pay based on purchasing power using a simple tool such as the Big Mac Index. This study further confirms that cataract pricing would not be a comparable unit to that of hamburger prices throughout the world in determining whether currencies are under- or over-valued, because the correlation for GDP and cataract surgical prices would have to be as good as the correlation between GDP and Big Mac prices. Although Figs. 1 and 2 indicate that the relationship between Big Mac prices and cataract surgery prices may be slightly stronger than the relationship between GDP per capita (PPP) and cataract surgery prices, the best correlation appears to be non-linear; whether this is artifactual or has some underlying basis is unknown.
However, there are quite a few limitations to bear in mind with regard to the conclusions of this study. The prices of cataract surgeries and Big Macs used in this study were for 2012, and do not include updated pricing for 2013. GDP per capita is not an exact measure of personal income, but rather a proxy measure. Therefore, GDP per capita is not an exact metric, but likewise a proxy, of the average person's ability to pay, because distribution of income is skewed and inequality exists in every country. For example, the top 1% of American earners earned 21.3% of all income in the US in 2006 and owned 34.6% of privately held wealth in 2007, while the bottom 80% owned only 15% of privately held wealth.45 The analysis of affordability would be strengthened if there were data available on median income which would better address distribution of income in different countries, but this study is unfortunately limited to only the availability of GDP per capita.
India is the only lower-middle income country represented in this study, and although it has the cheapest BMcI price, the Maharaja Mac is made of (cheaper) chicken. Furthermore, the comparison of cataract surgery to the Maharaja Mac may not be as relevant in India, where the vast majority of the population does not consume the Maharaja Mac. Another consideration is that in India, up to 50% of the cataract surgeries are offered at no charge to the population by the government and non-governmental organizations (Ravija, Personal Communications). However, it was beyond the scope of the paper to evaluate the impact of the proportion of free cataract surgeries in each country included, and the data and results do not take into consideration the percentage of the population in each country who may be eligible for free cataract surgery as further explained below.
Through follow-up consultation with the ophthalmologists who contributed to cataract price data in this study, it was discovered that it is very difficult to factor in the proportion of free cataract surgeries in the analysis of affordability. Until there is a better method to define what is meant by free cataract surgery, quantifying the other costs associated with surgery (such as consumables), and determining the context of free surgery in universal health coverage, the average prices in this study cannot be weighted with the free cataract surgeries in each country. In Malaysia, up to 40% of the cataract surgeries are free, but patients who can afford it have to pay for the intra-ocular lens (IOL), and only the first eye is operated at no charge (Subrayan, Personal Communications). The second eye is paid for out-of-pocket by the patient. Similarly in Argentina, where up to 2.4% of the cataract surgeries are free, patients still must pay for the consumables, including the IOLs (Nano, Personal Communications). The cost of the IOL can drastically influence the cost of surgery in these countries, in which patients pay out-of-pocket for consumables as further exemplified by Colombia. In Colombia, technically 90% of the patients can receive free cataract surgery from the government. However, up to one-third of these patients will pay as much as $500 for a premium IOL (Peña, Personal Communications). Furthermore, due to the long waitlists for government surgeries, many patients will end up not receiving the free surgery. The above examples from just some of the countries included in this study provide insight into just how complex and complicated the issue of “free” cataract surgery is across the globe.
With the exception of Japan, where there are no free cataract surgeries and prices are set by the Japanese Social Insurance Medical Fee Payment (Munehitasuka, Personal Communications), there is no single price for cataract surgery at the country level. Therefore, only the price of the private, out-of-pocket, phaco-surgery was considered in this affordability analysis. The prices of extracapsular extraction and manual incision cataract surgical procedures were not included in the data, although they tend to be significantly lower than that of phacoemulsification and, in some countries, the preferred method for public eye care. Therefore, the cataract prices worldwide are priced high in this study, and they are sample prices from each country that may not be representative of the overall average price of cataract surgery. However, the question of affordability of cataract surgery in this study is targeting the lower-to-low income cataract patients – those who might be working at minimum wage and/or are without access to free government health care. With the exception of India, all the other countries in this study are upper middle or high income, where cataract blindness is not such a high burden. Still, the data suggest affordability issues for some countries, particularly when patients work for minimum wages and/or do not have access to free cataract surgery.
If universal health coverage indicators were to be determined in the future, a similar exercise could perhaps be done considering the average prices charged to each patient that perhaps would give a more realistic picture of the affordability of cataract surgery as it compares the out-of-pocket expenditures and accessibility of health care in countries. This research could be likewise expanded, based on availability of data, to include correlation between price of cataract surgery and disposable income in different countries.
Finally, it should be taken into consideration that this study does not attempt to provide an in-depth economic analysis, nor does it aim to find a mathematical model for cataract price structure. A simple method is applied to assess the affordability of cataract surgery, which could assist eye care professionals and program managers in advocacy and planning for cataract activity. It is beyond the scope of this paper to develop or validate the data; the data and statistical analysis presented merely attempt to understand if there is a relationship between the price of cataract surgery and the price of the Big Mac and GDP.
Limitations aside, the results in Figs. 1 and 2 demonstrate that there may be some correlation between Big Mac prices and the costs of cataract surgeries, but the price of surgery is not correlated to GDP regardless of whether one uses a power or linear model. Cataract surgery appears to be expensive in some countries, indicating that the direct payment of cataract surgery does not necessarily correlate to the cost of living. Perhaps, future studies could further research the comprehensive in-country cost data needed to better understand the affordability of cataract surgery in different countries.
Ethical disclosuresProtection of human and animal subjectsThe authors declare that no experiments were performed on humans or animals for this study.
Confidentiality of dataThe authors declare that no patient data appear in this article.
Right to privacy and informed consentThe authors declare that no patient data appear in this article.
FundingPreparation of this manuscript was funded by ORBIS and the International Agency for the Prevention of Blindness.
Conflict of interestVCL is employed by the IAPB; MJC is a consultant for the IAPB; KAE is a consultant for the IAPB.
The authors thank the following individuals for their contributions on price of cataract surgery in this study:
Maria Eugenia Nano, Argentina; Fernando Peña, Colombia; Devin Gattey, Portland, Oregon, United States; Francisco Martinez Castro, Mexico; Nathan Congdon, China; Miguel Rio del Amo, Santiago, Chile; Fernando Barria, Concepcion, Chile; Carlos Arieta, Sao Paulo, Brazil; Fabio M. Nascimento, Sao Jose dos Campos, Brazil; Wilian Quieroz, Ribeirão Preto, Brazil; Cesar Gonzalez, Peru; Thulasiraj Ravija, India; Ashok Grover, India; Yoshi Munehitasuka, Japan; Visvaraja Subrayan, Malaysia.
