


The role of antimicrobial susceptibility testing is to aid in selecting the best agent for the treatment of bacterial and fungal diseases. This has been best achieved by the setting of breakpoints by Clinical Laboratory Standards Institute (CLSI) for prevalent Candida spp. versus anidulafungin, caspofungin, micafungin, fluconazole, and voriconazole. The European Committee on Antimicrobial Susceptibility Testing (EUCAST) also has set breakpoints for prevalent and common Candida and Aspergillus species versus amphotericin B, itraconazole, and posaconazole. Recently, another interpretive category, the epidemiological cut off value, could aid in the early identification of strains with acquired resistance mechanisms. CLSI has postulated that epidemiological cut off values may, with due caution, aid physicians in managing mycosis by species where breakpoints are not available. This review provides (1) the criteria and statistical approach to establishing and estimating epidemiological cut off values (ECVs), (2) the role of the epidemiological cut off value in establishing breakpoints, (3) the potential role of epidemiological cut off values in clinical practice, (4) and the wide range of CLSI-based epidemiological cut off values reported in the literature as well as EUCAST and Sensititre Yeast One-ECVs. Additionally, we provide MIC/MEC (minimal inhibitory concentrations/minimum effective concentrations) ranges/modes of each pooled distribution used for epidemiological cut off value calculation. We focus on the epidemiological cut off value, the new interpretive endpoint that will identify the non-wild type strains (defined as potentially harboring resistance mechanisms). However, we emphasize that epidemiological cut off values will not categorize a fungal isolate as susceptible or resistant as breakpoints do, because the former do not account for the pharmacology of the antifungal agent or the findings from clinical outcome studies.
Las pruebas de sensibilidad a los antimicrobianos tienen como finalidad ayudar en la selección del mejor fármaco para el tratamiento de las infecciones fúngicas y bacterianas. El establecimiento de puntos de corte para la anidulafungina, la caspofungina, la micafungina, el fluconazol y el voriconazol en las especies de Candida más prevalentes por parte del Clinical and Laboratory Standards Institute (CLSI) permite alcanzar este objetivo. El European Committee on Antimicrobial Susceptibility Testing (EUCAST) también ha establecido puntos de corte para la anfotericina B, el itraconazol y el posaconazol en las especies más comunes de Candida y Aspergillus. En los últimos tiempos se ha propuesto una nueva categoría, la de los puntos de corte epidemiológicos, que puede ayudar a identificar de manera temprana los aislamientos que han adquirido mecanismos de resistencia. Según el CLSI los puntos de corte epidemiológicos podrían, con la debida cautela, ayudar a los médicos en la selección del tratamiento en aquellas micosis causadas por especies para las que no se han establecido puntos de corte. Esta revisión repasa: 1) los criterios y la aproximación estadística seguida para establecer y estimar los puntos de corte epidemiológicos, 2) el papel de los puntos de corte epidemiológicos para establecer los puntos de corte, 3) el papel de los puntos de corte epidemiológicos en la práctica clínica, y 4) el amplio rango de puntos de corte epidemiológicos que aparecen en la literatura establecidos mediante los métodos del CLSI, EUCAST o Sensititre® YeastOne®. Se muestran también los rangos de las concentraciones mínimas inhibitorias (CMI) y concentraciones mínimas efectivas (CME) utilizados para el cálculo de los puntos de corte epidemiológicos. Incidimos de manera especial sobre estos últimos por tratarse de una nueva interpretación de los CMI y los CME que permite identificar aquellos aislamientos que no son salvajes y potencialmente resistentes. No obstante, insistimos en que los puntos de corte epidemiológicos no pueden utilizarse para calificar como resistente o sensible a un determinado aislamiento, como lo hacen los puntos de corte, puesto que los puntos de corte epidemiológicos no se rigen por las características farmacológicas de los agentes antifúngicos ni por la evolución clínica de los pacientes.
Although most fungi associated with disease are considered opportunistic pathogens (in particular the yeasts), irrespective of the species, fungi cause a great deal of morbidity and mortality worldwide, especially among the increasing number of immunocompromised patients.27,34 Such patients are at high risk for life-threatening mycoses. Despite the available antifungal agents (amphotericin B and its lipid formulations, the triazoles and the echinocandins), the mortality rates and emergence of resistance have increased, especially among patients suffering invasive infections due to Aspergillus and other filamentous fungi (moulds) infections; e.g., the survival rates could be below 30% depending on the infecting isolate and the immunological status of the host in invasive fusariosis.1,33 There is therefore a strong motivation to ensure that antifungal therapy is optimized, and consequently that susceptibility testing maximizes its capacity to predict outcome.
Advances have been made in understanding the molecular mechanisms of resistance in some Candida spp., Cryptococcus spp. and Aspergillus spp. and the triazoles as well as in Candida spp. with the echinocandins. For example, the emergence of triazole resistance among patients with aspergillosis has been reported where isolates with CYP51A gene mutations have reduced azole affinity or increased target quantity that confers azole resistance; this problem has increased significantly in some European countries.47 However, the genetics of other important species (e.g., Fusarium spp. and the Mucorales) are yet to be investigated. Therefore, there is a need to identify these resistant isolates with reduced antifungal susceptibility.
Currently the best predictors of patient outcome with antifungal therapy are the formal breakpoints (BPs) established by the standards setting organizations, the European Committee on Antimicrobial Susceptibility Testing (EUCAST) and the Clinical and Laboratory Standards Institute (CLSI). However, CLSI BPs are only available for some Candida spp. versus two triazoles and three echinocandins,6 while EUCAST had established BPs for the prevalent Candida spp. and some common Aspergillus spp. for three other antifungal agents (amphotericin B, itraconazole, posaconazole). BPs by definition are used to indicate those isolates that are likely to respond to (susceptible) or fail (resistant) treatment with a given antimicrobial agent administered at the approved dosing regimen for that agent (http://www.eucast.org/clinical_breakpoints/).5 They are established using a combination of in vitro, in vivo and clinical data, including the distribution of the minimal inhibitory concentrations (MICs) and/or minimal effective concentrations (MECs), in vitro, animal model pharmacokinetics/pharmacodynamics (PK/PD), and clinical/microbiological outcome data (EUCAST SOP 1.1 Setting breakpoints for new antimicrobial agents at http://www.eucast.org/documents/sops/).5
One of the first steps in establishing BPs is the determination of what constitutes wild-type (WT) strains, defined as strains without any phenotypically-expressed resistance mechanism(s). Rather than being a single value, MICs/MECs of WT strains follow a log-normally distribution. The upper end of that distribution is defined as the epidemiological cutoff value (ECV or ECOFF). Estimation of the ECV has the added benefit of acting as a sensitive indicator of the emergence of strains with reduced susceptibility to a given agent. Over the last few years, ECVs have been proposed for a variety of moulds and Cryptococcus spp. as well as for some of those species of Candida for which BPs have not been established. Recently, method-dependent ECVs for the commercial colorimetric Sensititre® YeastOne® assay (SYO) for Candida spp. have been estimated; these values have been integrated in the tables, given that the high degree of caspofungin MIC variability for Candida spp. has so far prevented reproducible testing of this agent by reference methodology.14 The CLSI has described guidelines and listed CLSI ECVs as per CLSI criteria, while the EUCAST publishes visual ECVs on their MIC distribution website when the data are of sufficient quality (http://mic.eucast.org/Eucast2/).
This review presents information regarding both interpretive categories or enpoints that encompass: (1) steps needed for statistical ECV estimation and/or establishment as per CLSI criteria, (2) the role of the ECV in establishing BPs, (3) the role of ECVs on clinical practice versus the BP's fundamental role, (4) and the wide range of CLSI ECVs reported in the literature as well as EUCAST and SYO-ECVs. Other interpretive endpoints that have been proposed as either BPs or ECVs especially for Aspergillus fumigatus species complex (SC) in the last few years are briefly discussed.
Epidemiological cutoff value estimationBasic requirements or criteriaIn order to ensure that clean and comparable data are included in the estimation of ECVs, there are a number of conditions/criteria that must be fulfilled. These include conditions that apply to the data generated in the contributing laboratory, as well as methods applied to accepting and rejecting particular distributions before pooling for analysis. The pooling of data for the estimation of the ECV (See Figs. 1 and 2) is built on the assumption that the WT of an individual species does not vary over time or place (e.g., anywhere in the world). The following are widely accepted criteria for generating, reviewing, excluding and pooling the data required for the estimation of ECVs; many of which were recently described by Kahlmeter:25
- (i)
ECVs can only be set for a single species/SC; molecular identification of certain fungal groups is essential for ECV calculations since it is widely recognized that some of these common pathogens represent species complexes that cannot be identified to the species/SC level by conventional methodologies alone (e.g., members of the Mucorales, Fusarium spp., the complexes of Candida glabrata, Candida parapsilosis and the various Aspergillus spp., among others);22
- (ii)
data should only be included from unique clinical isolates; MICs/MECs of repeat isolates from a single episode of infection should be excluded;
- (iii)
MICs/MECs must have been determined using reference methods (M27-A3; M38-A2; http://www.eucast.org/ast_of_fungi/methodsinantifungalsusceptibilitytesting/)3,4;
- (iv)
MICs/MECs must conform to the standard two-fold dilution series based on powers of 2;
- (v)
MIC/MEC distributions from contributing laboratories must be accompanied by MICs/MECs within established ranges for quality control (QC) isolate(s) obtained during the testing period;
- (vi)
MIC/MEC data must be generated by a minimum of 3 and preferably 5 independent and geographically distinct laboratories (to allow for interlaboratory variation which is quite common – see Tables 1 and 2);
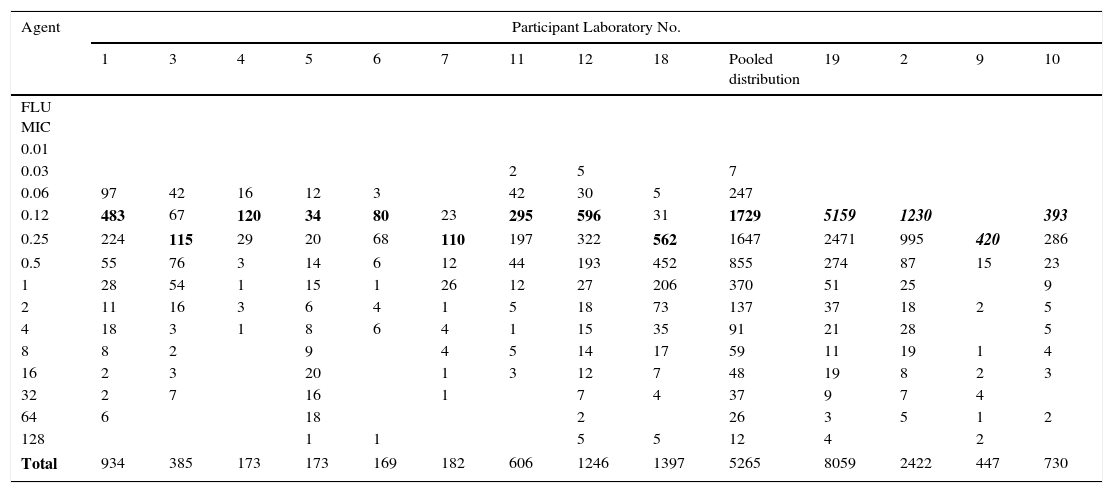
Table 1.Single fluconazole MIC distributions of C. albicans from 13 laboratories.
Agent Participant Laboratory No. 1 3 4 5 6 7 11 12 18 Pooled distribution 19 2 9 10 FLU MIC 0.01 0.03 2 5 7 0.06 97 42 16 12 3 42 30 5 247 0.12 483 67 120 34 80 23 295 596 31 1729 5159 1230 393 0.25 224 115 29 20 68 110 197 322 562 1647 2471 995 420 286 0.5 55 76 3 14 6 12 44 193 452 855 274 87 15 23 1 28 54 1 15 1 26 12 27 206 370 51 25 9 2 11 16 3 6 4 1 5 18 73 137 37 18 2 5 4 18 3 1 8 6 4 1 15 35 91 21 28 5 8 8 2 9 4 5 14 17 59 11 19 1 4 16 2 3 20 1 3 12 7 48 19 8 2 3 32 2 7 16 1 7 4 37 9 7 4 64 6 18 2 26 3 5 1 2 128 1 1 5 5 12 4 2 Total 934 385 173 173 169 182 606 1246 1397 5265 8059 2422 447 730 Pool of the 13 single fluconazole MIC distributions received for the calculation of the fluconazole ECV for C. albicans: On the left, the nine distributions selected for the ECV calculation (the graphical representation of the pool is seen in Figs. 1 and 2) and on the right, the four truncated distributions (modes [bolded/italics] at the lowest concentration tested) that were not included in the analysis.15
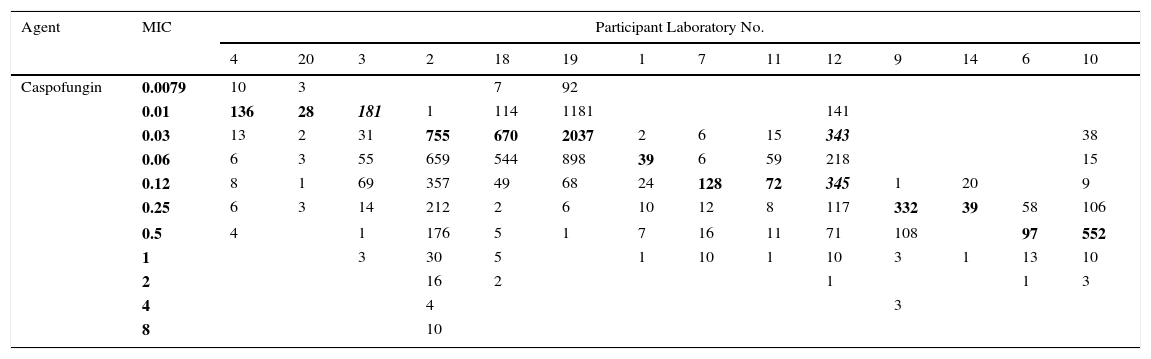
Table 2.Single caspofungin MIC distributions of C. albicans from 14 laboratories.
Agent MIC Participant Laboratory No. 4 20 3 2 18 19 1 7 11 12 9 14 6 10 Caspofungin 0.0079 10 3 7 92 0.01 136 28 181 1 114 1181 141 0.03 13 2 31 755 670 2037 2 6 15 343 38 0.06 6 3 55 659 544 898 39 6 59 218 15 0.12 8 1 69 357 49 68 24 128 72 345 1 20 9 0.25 6 3 14 212 2 6 10 12 8 117 332 39 58 106 0.5 4 1 176 5 1 7 16 11 71 108 97 552 1 3 30 5 1 10 1 10 3 1 13 10 2 16 2 1 1 3 4 4 3 8 10 Pool of the 14 single caspofungin MIC distributions received for the calculation of the caspofungin ECV for C. albicans:
The examination of modes (bolded) in each participant laboratory indicated interlaboratory variability (up to five dilutions) which precluded the calculation of the ECV for this agent and Candida spp; similar phenomenon was observed for other species. Distribution from laboratory 3 was truncated and distribution from laboratory 12 was bimodal (The total number of caspofungin MICs is 11,550).14
- (vii)
there should be at least data for five isolates in each single distribution as well as a minimum of 100 MIC/MEC values after pooling (assuming it includes relatively few or no strains with acquired resistance mechanisms);
- (viii)
if the mode of a distribution is at the lowest concentration tested (e.g., truncated distributions: laboratories 2, 9, 10 and 19 in Table 1), this distribution must be excluded from pooling; distributions which appear truncated before the upper end of the presumptive WT distribution should also be excluded from pooling; truncation beyond the presumptive WT is to be expected for some fungal groups depending on intrinsic susceptibility and the prevalence of high-level resistance;
- (ix)
distributions with aberrant modes also must be excluded from pooling; these are defined as either having modes that are two or more two-fold dilutions above or below the most frequent WT mode of the individual distributions, or distributions where the mode is not obvious (e.g., laboratory 12 in Table 2);
- (x)
in situations where there is no obvious common mode amongst the range of distributions, data should not be pooled or analyzed (e.g., data shown in Table 2)14;
- (xi)
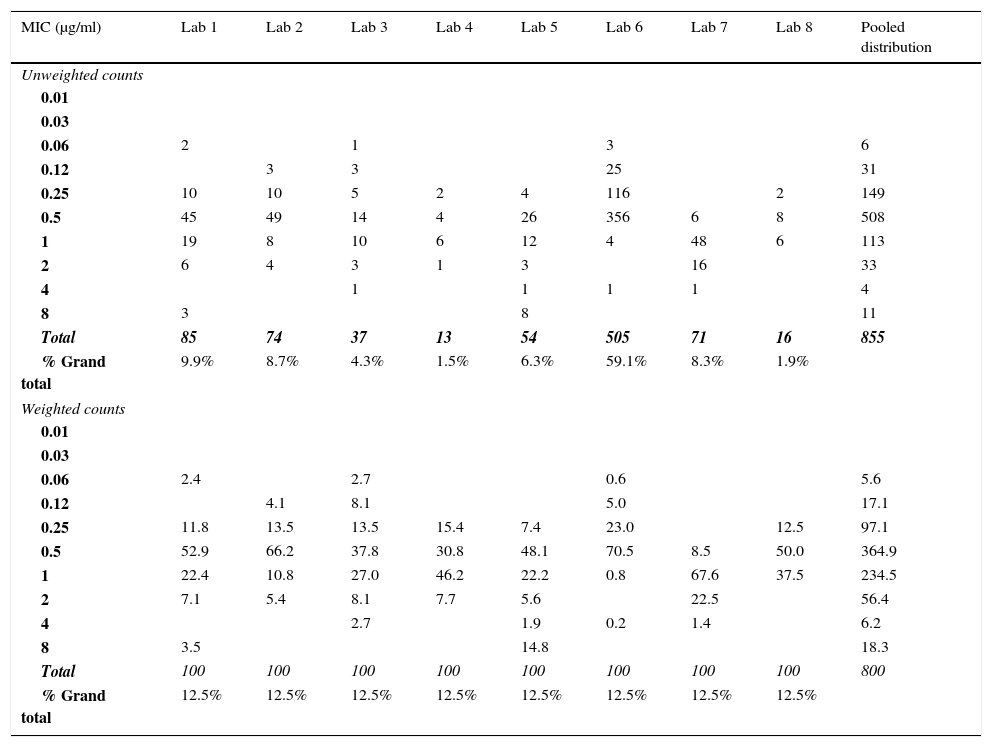
if one of the contributing distributions contributes more than 50% of the values to the pooled data, consideration should be given to giving equal weighting to all contributing distributions, to minimize bias, where different ECVs can be calculated (See Tables 3, 10 and 11). However, it is fine when both values are the same after normalizing the (weighting analysis; see example, Table 3) and the ECV is acceptable, but what steps should be taken when the two values are different is under consideration.
Table 3.Example of weighting applied to the raw data to enable ECV estimation when one distribution accounts for more than 50% of the values for isavuconazole versus Aspergillus fumigatus species complex. For these data, the unweighted ECV estimated at the 97.5% level by ECOFFinder was 1μg/ml,13 while the weighted ECV was 2μg/ml.
MIC (μg/ml) Lab 1 Lab 2 Lab 3 Lab 4 Lab 5 Lab 6 Lab 7 Lab 8 Pooled distribution Unweighted counts 0.01 0.03 0.06 2 1 3 6 0.12 3 3 25 31 0.25 10 10 5 2 4 116 2 149 0.5 45 49 14 4 26 356 6 8 508 1 19 8 10 6 12 4 48 6 113 2 6 4 3 1 3 16 33 4 1 1 1 1 4 8 3 8 11 Total 85 74 37 13 54 505 71 16 855 % Grand total 9.9% 8.7% 4.3% 1.5% 6.3% 59.1% 8.3% 1.9% Weighted counts 0.01 0.03 0.06 2.4 2.7 0.6 5.6 0.12 4.1 8.1 5.0 17.1 0.25 11.8 13.5 13.5 15.4 7.4 23.0 12.5 97.1 0.5 52.9 66.2 37.8 30.8 48.1 70.5 8.5 50.0 364.9 1 22.4 10.8 27.0 46.2 22.2 0.8 67.6 37.5 234.5 2 7.1 5.4 8.1 7.7 5.6 22.5 56.4 4 2.7 1.9 0.2 1.4 6.2 8 3.5 14.8 18.3 Total 100 100 100 100 100 100 100 100 800 % Grand total 12.5% 12.5% 12.5% 12.5% 12.5% 12.5% 12.5% 12.5%
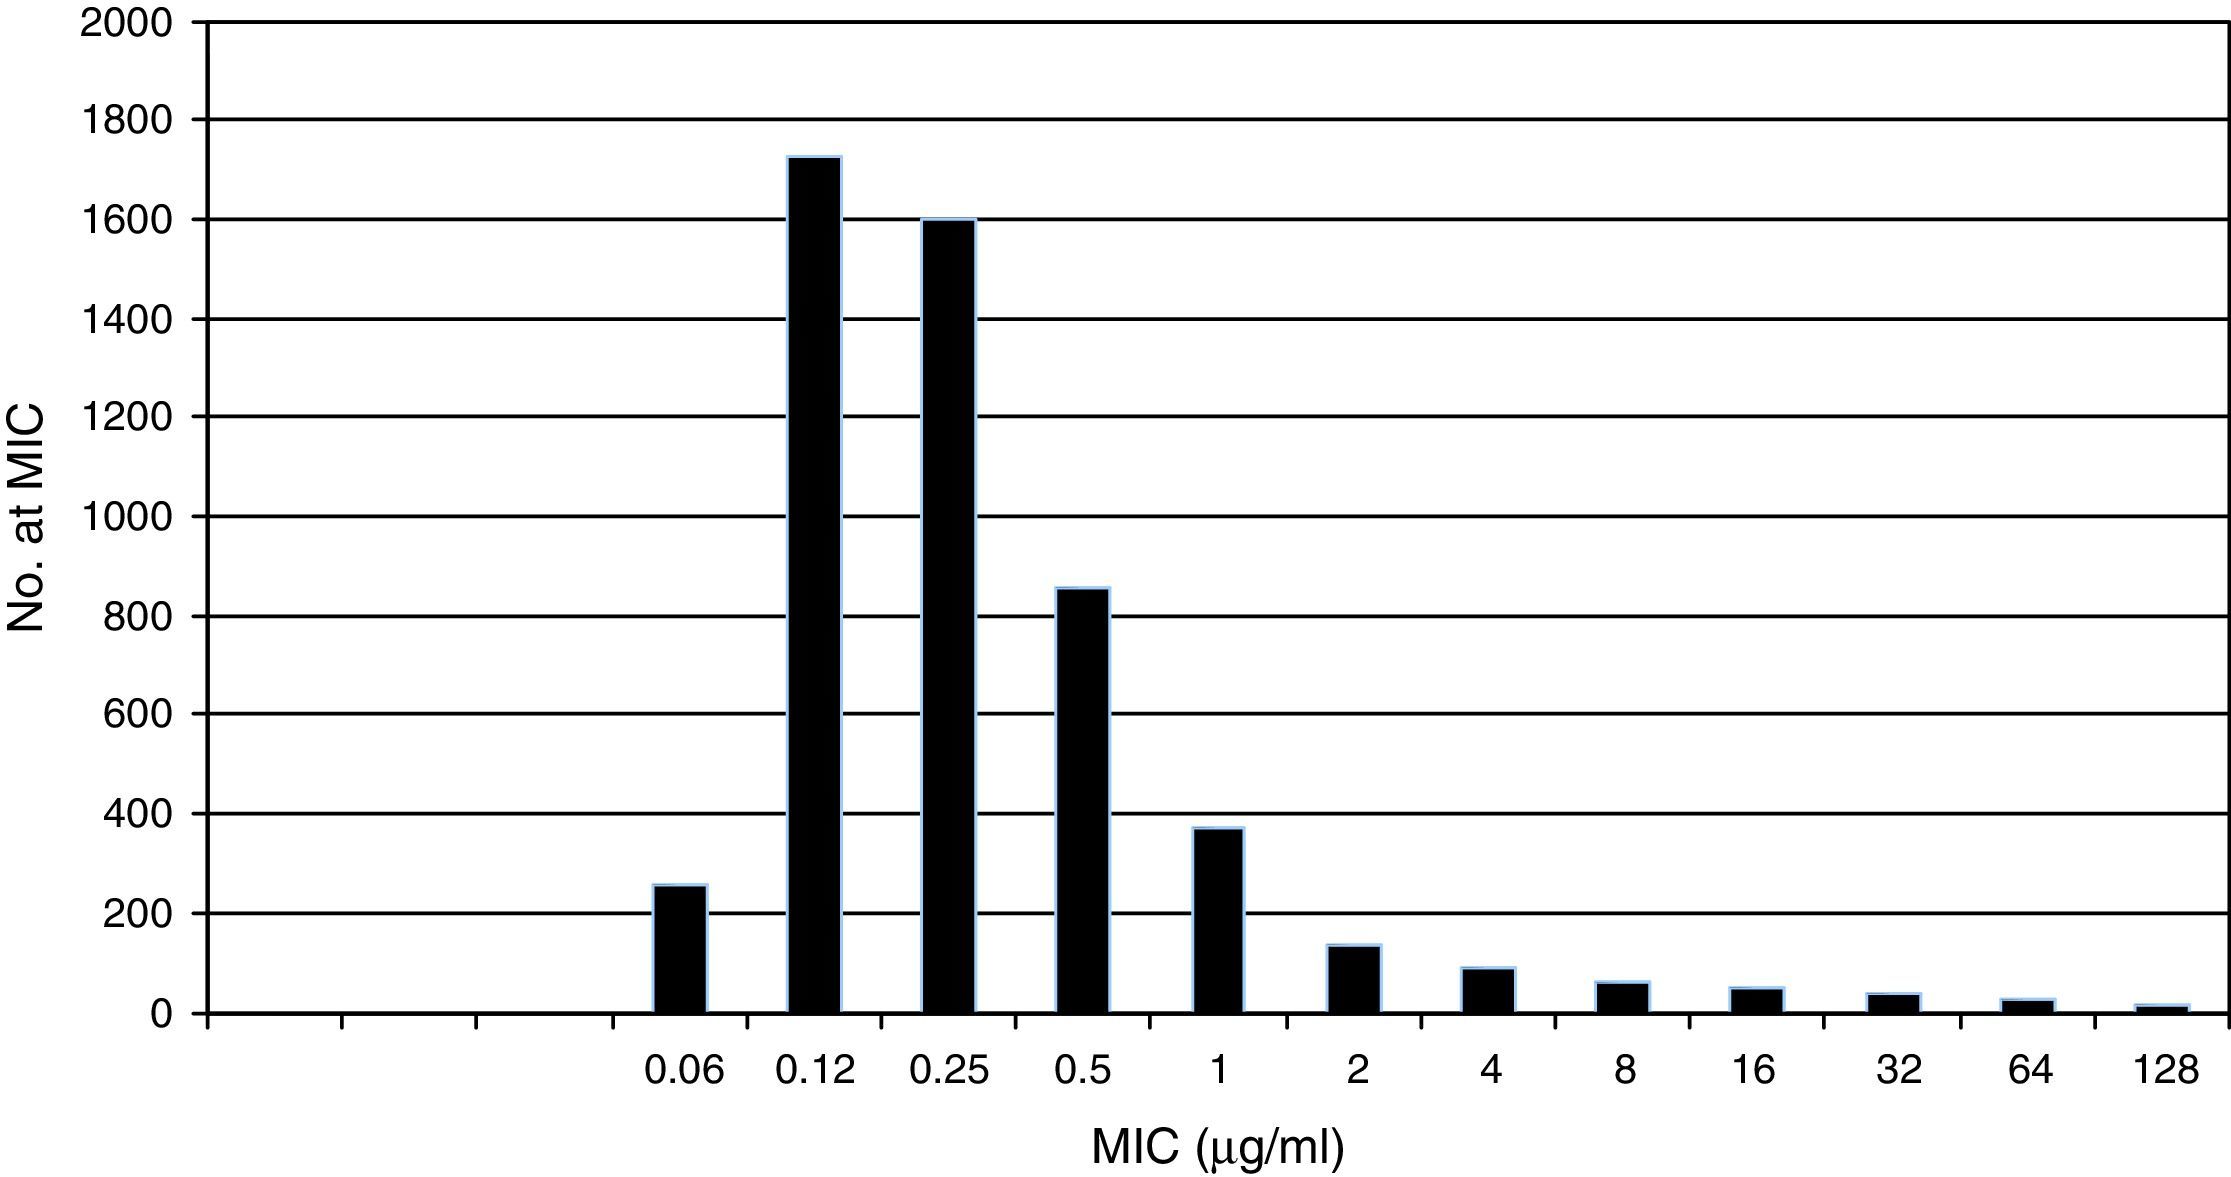
 selected for the calculation of the CLSI ECV for C. albicans and fluconazole showing a shoulder on the left and similar bars between fluconazole concentrations 0.12 and 0.25μg/ml; the mode is 0.12μg/ml.15")
Pooled fluconazole MIC distribution of Candida albicans from 9 laboratories. Graphical representation of the pooled nine distributions (single distributions are provided in Table 1) selected for the calculation of the CLSI ECV for C. albicans and fluconazole showing a shoulder on the left and similar bars between fluconazole concentrations 0.12 and 0.25μg/ml; the mode is 0.12μg/ml.15
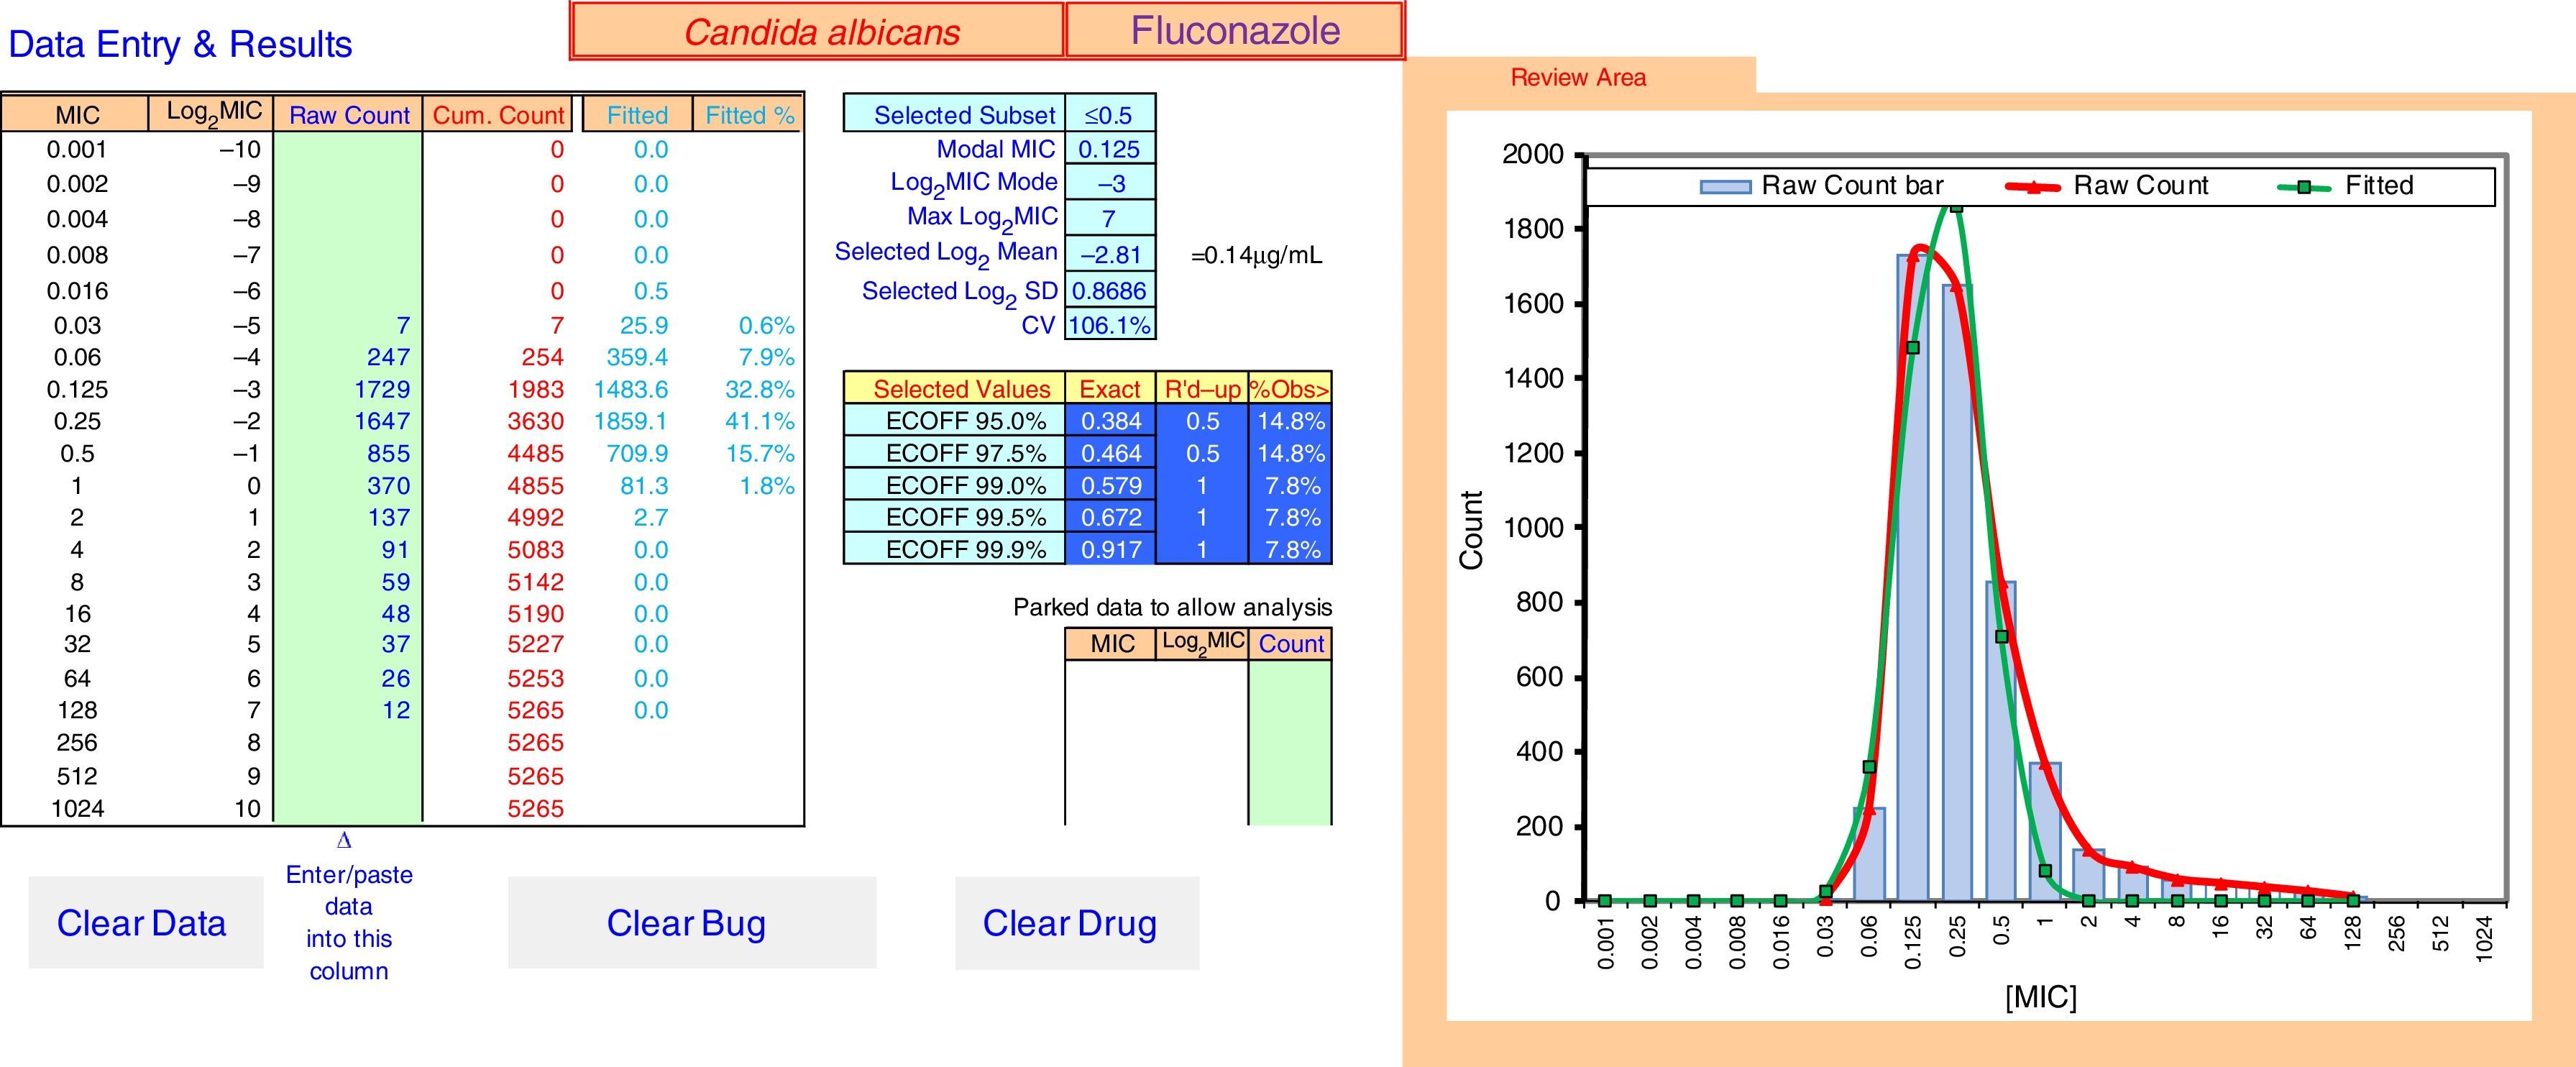
, and the curve (in green) of the estimated best fit wild-type population. The “Parked Data to Allow Analysis” section in the lower center is used when there is a mode in the high non-wild-type population that is greater than the mode in the wild-type population. Data at this high mode and above are moved here to retain their visibility but allow the analysis to precede, because the analysis relies on the mode of the data to run efficiently. The buttons “Clear Data”, “Clear Bug” and “Clear Drug” are form controls that activate macros to clear the worksheet of some or all data entry elements for re-use of ECOFFinder.")
ECOFFinder results for fluconazole MIC distribution of C. albicans from 9 laboratories. The analysis is done on a worksheet separate to that displayed and the results carried back to the Data Entry & Results sheet displayed here. The four left hand columns tabulate the pooled MIC distribution data. The “Fitted” and “Fitted %” columns show the numbers and percentage of isolates at each MIC in the estimated wild-type distribution. The central area of the screen shows, at the top, the subset of the raw data that gave the best fit and the statistical parameters that defined the log-normal distribution with the best fit. Below that are the range of ECVs that might be chosen according to the percentage of the wild-type that the user might wish to include, including the “exact” ECV, the ECV rounded up to the next two-fold dilution, and the percentage of isolates in the observed raw data that were above that rounded-up ECV. On the right is a graph displaying the raw data in both column and curve format (curve in red), and the curve (in green) of the estimated best fit wild-type population. The “Parked Data to Allow Analysis” section in the lower center is used when there is a mode in the high non-wild-type population that is greater than the mode in the wild-type population. Data at this high mode and above are moved here to retain their visibility but allow the analysis to precede, because the analysis relies on the mode of the data to run efficiently. The buttons “Clear Data”, “Clear Bug” and “Clear Drug” are form controls that activate macros to clear the worksheet of some or all data entry elements for re-use of ECOFFinder.
Table 1 shows a working example of raw MIC distributions obtained from 13 laboratories around the world. It can be seen that data from 4 laboratories (numbers 2, 9, 10 and 19) were excluded from the pooling because their modes were at the lowest dilution/concentration tested.15 All criteria were met for the remaining 9 datasets. Fig. 1 shows the histogram of the same data after pooling. The figure shows that the distribution of the presumptive WT is approximately log-normal, and that choosing an ECV based on observation alone is likely to be quite subjective, because there is obvious skewing to the right of the distribution.
By contrast, Table 2 shows an example of a situation where, and as mentioned above, there is no obvious common mode among the distributions/laboratories (criterion x); this precludes the establishment of an ECV based on the current data.14 Indeed, the modes span 5 dilutions, suggesting that there are significant methodological issues with testing the antifungal-species combination. Such problems are rare. In addition, and as also mentioned under criterion ix, laboratory 12 shows an aberrant mode problem, with seemingly two modes at 0.12 and 0.06μg/ml.
Phenotype versus genotypeApplication of the above criteria is done in the growing knowledge that fungal taxonomy is undergoing rapid changes at present, especially since the advent of MALDI-TOF identification and whole genome sequencing.22 What defines a species or a SC is, in many cases, in a state of flux. Another important consideration is that acquired resistance mechanisms can frequently be detected using modern molecular techniques, and can be used to validate ECVs that have been estimated from phenotypic data. From this can follow the temptation to discard a phenotypically-determined ECV in favor of an inference of acquired resistance based solely on molecular results46. However, mutations in genes encoding antifungal target enzymes, by far the most common mechanism of acquired resistance to antifungal agents, may not always alter the phenotype. This could be because the mutations are ‘silent’, e.g., do not affect the target site of the enzyme, or because the resistance gene is not expressed. Ultimately, antifungal agents attack target enzymes, not the genes encoding them, and that is the phenotype that the drug “sees”.
However, there is still great utility in examining molecular mechanisms of resistance. This may lead to improvements in ECVs by estimating the sensitivity and specificity of both phenotypic and genotypic assays. In doing so, it is necessary to undertake molecular testing of all isolates at the top of the WT range so that any overlap between resistance mechanisms and the ECV can be determined.
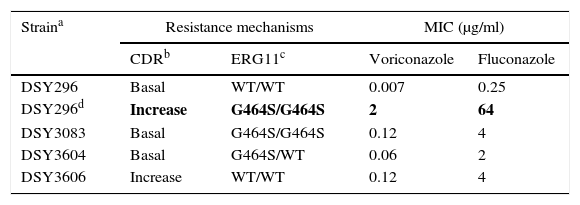
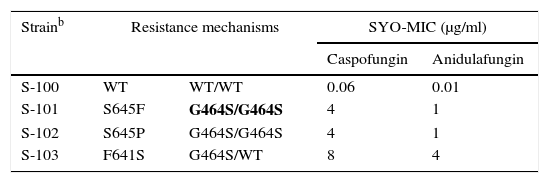
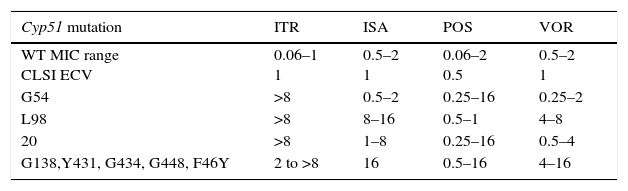
As previously discussed, molecular mechanisms of resistance have been described mostly for Candida spp. and both triazoles and echinocandins as well as for Aspergillus spp. and the triazoles. Azole resistance has been investigated since the 1990s when relapses among AIDS patients were associated with suboptimal fluconazole doses and high or increased fluconazole MICs; azole resistance mechanisms have been reported mostly for Candida albicans, C. glabrata and A. fumigatus. The relationship or influence of known azole resistance mechanisms with MICs for C. albicans and A. fumigatus are depicted in Tables 4–6 and Fig. 3. In Table 4, mutations in the ERG11 gene or the increased level of expression of the efflux pumps elevated both fluconazole and voriconazole MICs from WT to non-WT/resistant levels in C. albicans.15,31,35,37 The same impact is evident on SYO-caspofungin and anidulafungin MICs for strains of C. albicans harboring fks1 gene mutations (Table 5).18Table 6 provides the elevated triazole MICs for A. fumigatus isolates harboring Cyp51 mutations and usually lower values for WT isolates as reported in multiple studies.21,26,28–30 Results shown in Table 6 also suggest the differential effect on triazole activity/MICs by the Cyp51 mutation in A. fumigatus.
Impact of resistance mechanisms on in vitro susceptibility of C. albicans to voriconazole and fluconazole.
| Straina | Resistance mechanisms | MIC (μg/ml) | ||
|---|---|---|---|---|
| CDRb | ERG11c | Voriconazole | Fluconazole | |
| DSY296 | Basal | WT/WT | 0.007 | 0.25 |
| DSY296d | Increase | G464S/G464S | 2 | 64 |
| DSY3083 | Basal | G464S/G464S | 0.12 | 4 |
| DSY3604 | Basal | G464S/WT | 0.06 | 2 |
| DSY3606 | Increase | WT/WT | 0.12 | 4 |
Mutations (G464S) in each of 2 ERG11 alleles.31,35
MICs of strain DSY296 increased to resistant levels: RBP of ≥1μg/ml and ≥8μg/ml for voriconazole and fluconazole, respectively.6
MICs of the other strains would be classified as non-WT but below the resistant level: voriconazole and fluconazole ECVs are 0.03μg/ml and 0.5μg/ml respectively.6,15,35,37
Relationship of triazole MICs (μg/ml) for A. fumigatus SC and molecular mechanisms of resistance.
| Cyp51 mutation | ITR | ISA | POS | VOR |
|---|---|---|---|---|
| WT MIC range CLSI ECV | 0.06–1 1 | 0.5–2 1 | 0.06–2 0.5 | 0.5–2 1 |
| G54 | >8 | 0.5–2 | 0.25–16 | 0.25–2 |
| L98 | >8 | 8–16 | 0.5–1 | 4–8 |
| 20 | >8 | 1–8 | 0.25–16 | 0.5–4 |
| G138,Y431, G434, G448, F46Y | 2 to >8 | 16 | 0.5–16 | 4–16 |
ITR, itraconazole; ISA, isavuconazole; POS, posaconazole; VOR, voriconazole.
Adapted from refs: [21,26,28–30].
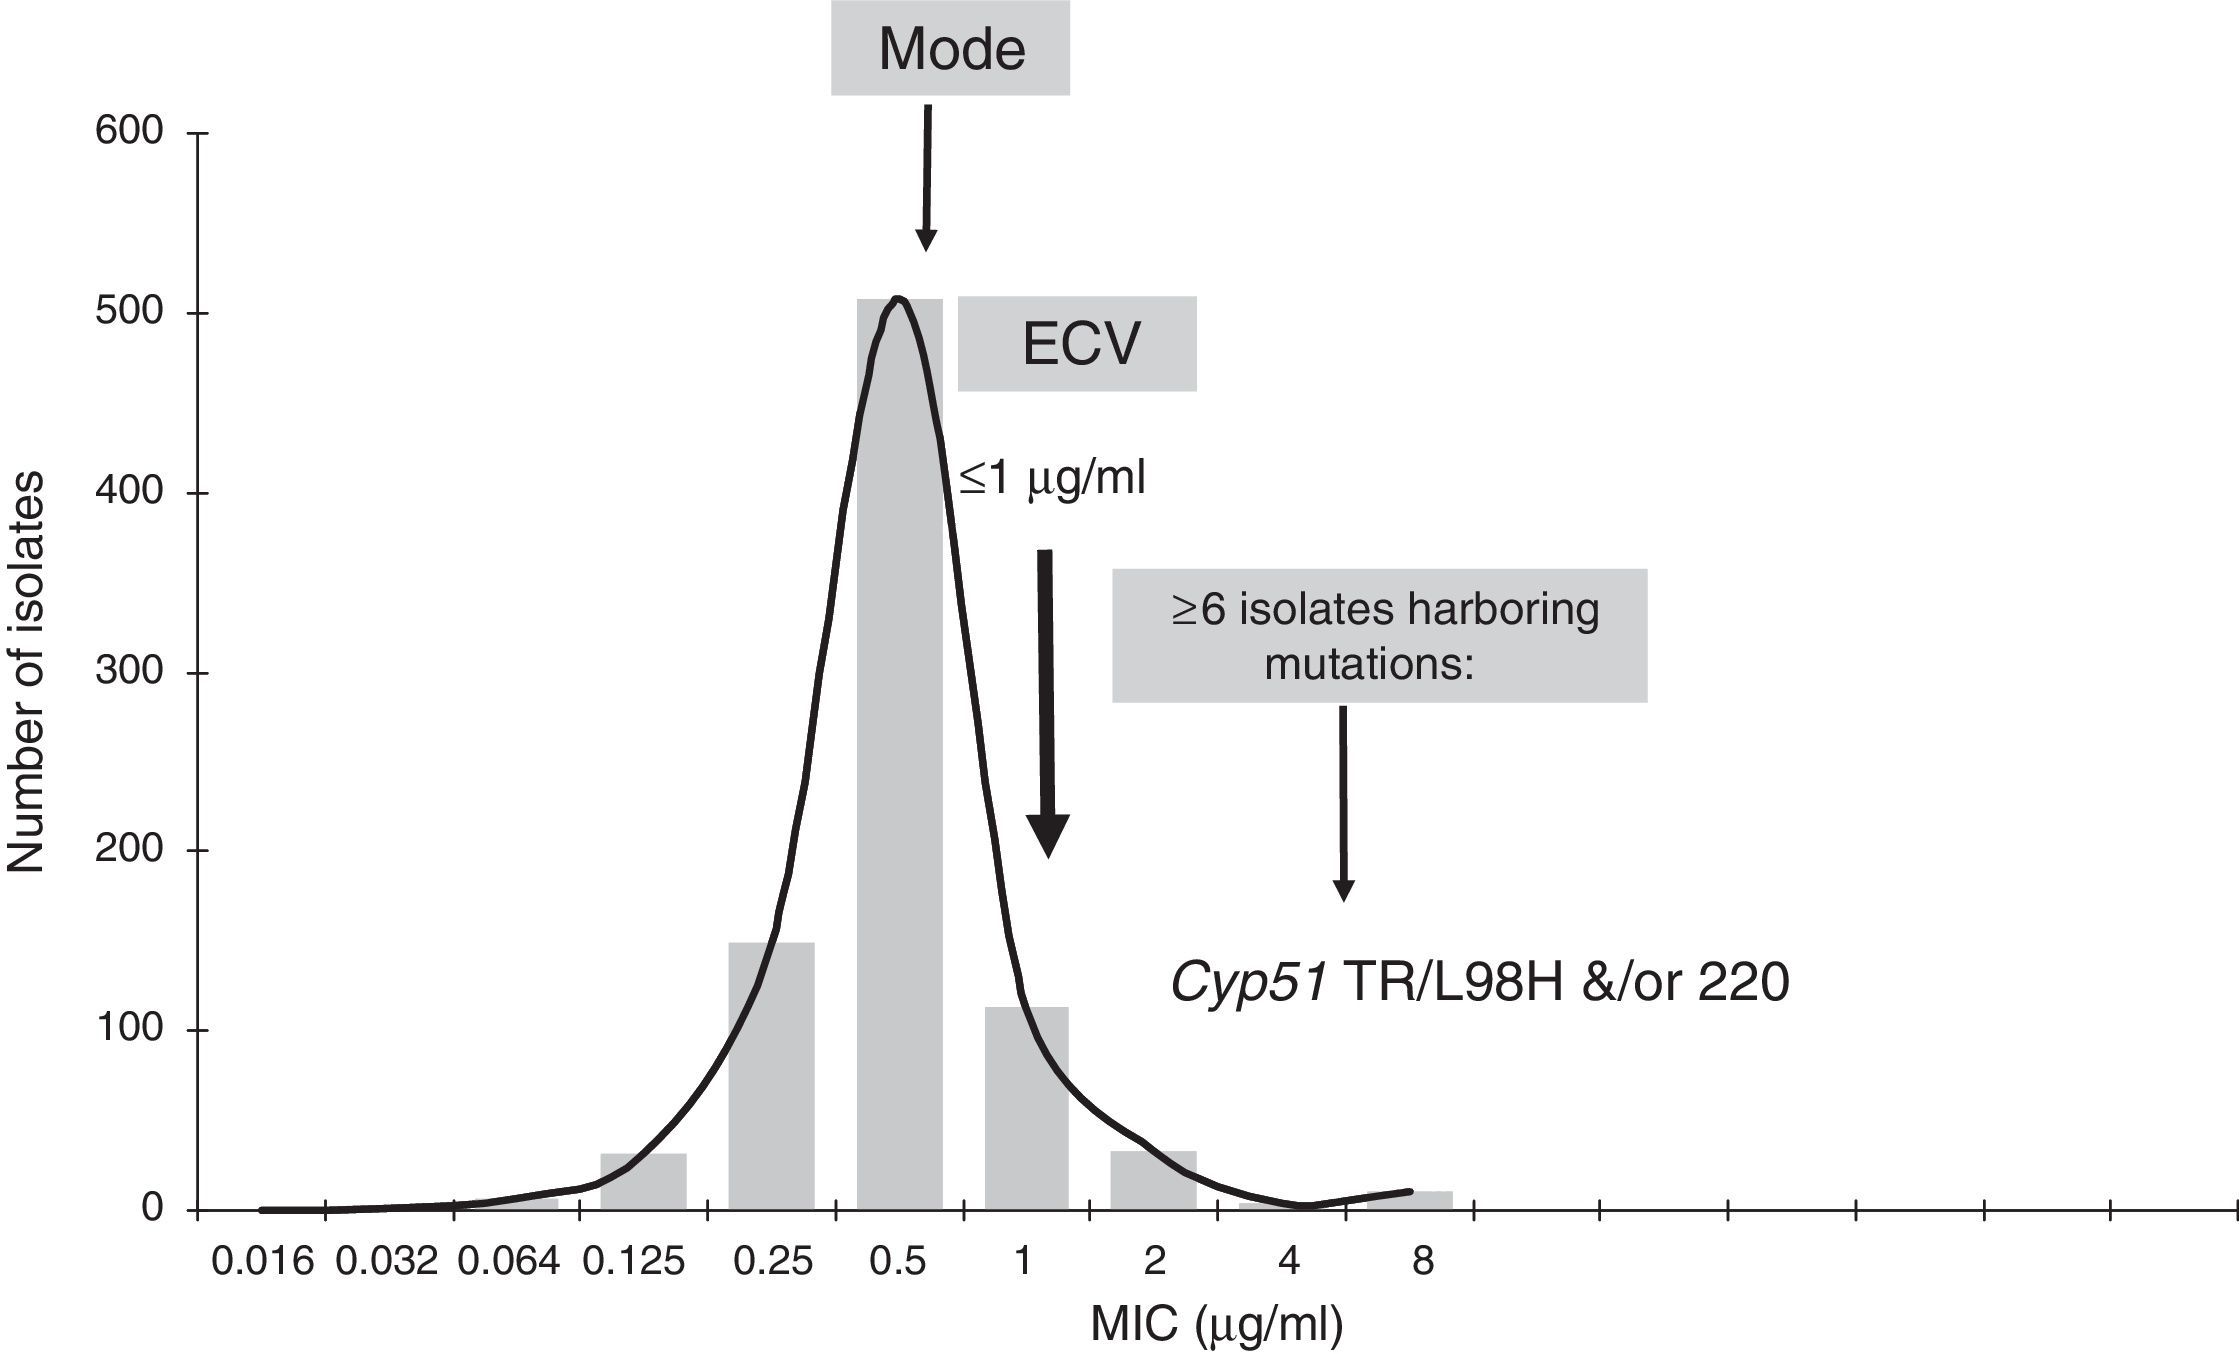
. Graphical representation of the pooled MIC distribution from eight laboratories used for the calculation of the CLSI ECV of A. fumigatus SC and isavuconazole.")
Isavuconazole ECV for A. fumigatus complex (Note: isolates harboring gene mutations have MICs of 4μg/ml.13). Graphical representation of the pooled MIC distribution from eight laboratories used for the calculation of the CLSI ECV of A. fumigatus SC and isavuconazole.
The application of CLSI ECVs to identify mutant isolates has provided encouraging results, e.g., echinocandin and triazole ECVs for Candida spp. would have identified >80% of the reported mutants evaluated in each ECV study.15,39 That is the main role of the ECV, to identify non-WT isolates. Unfortunately, the molecular biology of resistance for many other important fungal species needs to be investigated, e.g., most non-Aspergillus moulds including both Mucorales and Fusarium spp. as well as less prevalent yeast species.
Methods for estimating ECVs from pooled dataA range of methods for estimating ECVs have been developed over the years, as summarized and added to by Cantón et al.2 The methods can be categorized as either observational or statistical. A particular hazard with the observational methods is that they do not account for the fact that a MIC value, as it is currently determined, is actually the upper end of the MIC interval, rather than the midpoint of the interval. This can lead to overestimation of the location of the WT population as a whole. For instance, a MIC value of a single isolate recorded as 2μg/ml actually means that the MIC for that isolate is somewhere in the range of >1μg/ml and ≤2μg/ml. The average MIC of a collection of isolates when the MIC/MEC is recorded as 2μg/ml is in fact the geometric mean of 1 and 2μg/ml, e.g., half way on a logarithmic scale between 20 and 21=20.5 or ∼1.414μg/ml. Thus, the conventional histogram of MICs or MECs used for observational estimation is shifted to the right by one half of a two-fold dilution.
For the many publications referred to in this review, we have elected to use the statistical method described by Turnidge et al.,44 which attempts to fit a log-normal distribution to the presumptive WT counts iteratively – the so-called iterative statistical method (ISM). It is implemented in a Microsoft Excel® workbook (ECOFFinder) that can be downloaded freely from the CLSI website (http://clsi.org/standards/micro/ecoffinder/). We prefer this method because it minimizes the subjectivity when compared to observational methods, and does not require the presence of a population of MICs/MECs above the WT to be effective. Other statistical methods may be equally suitable, although the ECVs generated with them may differ slightly and at most by a single two-fold dilution.2
The estimation performed using the ISM is implemented in such a way that it accounts for the fact that MICs are actually the values at the upper end of the two-fold interval. When the iterations have been completed, it selects the log-normal distribution with the closest fit to the observed counts, and then creates a range of possible ECVs. This range is created by selecting a desired percentage to be captured in the WT, calculating the exact ECV, and then rounding it up to the next highest two-fold dilution. The reason for this is that the fitted log-normal distribution is a probability distribution, and as such the appropriate percentage of that distribution that can be used is subject to needs. Employing a lower percentage of the modeled WT population increases the probability that all isolates less than or equal to that MIC are true WT and reduces the risk of including MICs associated with acquired resistance mechanisms. Conversely, employing a higher percentage reduces the risk of true WT isolates being misclassified as likely to possess an acquired resistance mechanism (non-WT), but increases the probability of misclassifying non-WT as WT. Ultimately, it is a trade-off, and the selected percentage should be chosen according to need. Employing a lower percentage will potentially increase the requirement to test WT isolates for acquired mechanisms that they do not possess, while employing a higher percentage will increase the risk of missing important emerging resistance mechanisms. There is currently no consensus on the most appropriate percentage, although the CLSI Antifungal Susceptibility Testing Subcommittee is using 97.5% of the modeled distribution as a starting point (CLSI documents on ECVs).
Therefore, it is important to understand that an ECV can never be guaranteed to divide WT and non-WT perfectly. Assay variation and the coarseness of the two-fold dilution scale will always leave a small chance of misclassification.
Fig. 2 shows an explanation of the application of the IDN to the pooled data from Table 1 using ECOFFinder. Here the estimated WT population has a mean MIC on the log2 scale of −2.81μg/ml and a standard deviation of 0.87.
Other types of ECVsThe conditions for establishing ECVs described above result in what might be called “reference” ECVs. A slightly less stringent condition, that of also using data generated by susceptibility testing methods calibrated to the reference method, is employed by EUCAST.25 Until further data are forthcoming, both the authors’ papers presented in this review and the CLSI have elected to apply the more stringent condition in generating ECVs from data obtained using the reference methodology only.
With this in mind, it is possible to apply the principles of ECV setting to other data types. For instance, if multiple datasets are available from another susceptibility testing method, exactly the same rules for estimating ECVs can be applied. We calculated ECVs for data generated by the Sensititre® YeastOne® (SYO) system, widely used for antifungal susceptibility testing internationally, for some Candida spp. and the echinocandins.18 We call the ECVs created in this way “method-dependent”.
The ECV-setting rules (criteria i to v) can also be used for a dataset from a single laboratory. The output might be described as a “local” ECV that should only be applied to the testing performed in that laboratory. Some laboratories may choose to set a “local” ECV for quality assurance purposes and/or to maximize their chances of detecting emerging resistance.
ECVs: their role in establishing breakpointsThe generation and examination of MIC/MEC distributions is the obvious first step in the development of BPs. It is now agreed by CLSI and EUCAST that the next step is to determine the ECVs according to the criteria described above. This is important because it is considered undesirable to establish a BP that cuts into the WT distribution. The WT distribution is in fact a distribution built up from a combination of biological disparity and assay (intra- plus inter-laboratory) variation. Because assay variation is a large component of the distribution, as QC range studies demonstrate,3,6 setting a BP that cuts into the WT will result in frequent categorization and reporting errors attributable to assay variation, but with no biological significance.
The establishment of BPs requires more steps and much more data than those for ECV calculation as follows5,7,25,45: (1) calculation of ECVs for each species/agent according to the steps or criteria listed above; (2) available knowledge of resistance mechanisms of the agent and their correlation with MICs/MECs and/or in vivo outcomes; (3) investigation of PK and PD parameters of the agent in animals and in human trials where possible; and (4) the correlation of MICs and clinical outcome to therapy for patients treated with the specific agent from clinical trials. The latter step is the major impediment for both moulds and less prevalent yeast species given that formal clinical trials have not been conducted or the infecting isolates are mostly non-WT. For example, the Aspergillus isolates from voriconazole clinical trials were WT and efficacy was associated with the site of infection.40
Given the comparative rarity of infections caused by moulds and other less prevalent yeast species, it may take many years or decades before sufficient reliable data will be available to establish BPs for the less common yeasts, and almost all moulds. This was the principal motivation for considering ECVs an option for reporting the results of susceptibility tests
ECVs: their potential use in clinical practiceThe role of the ECV is to separate or distinguish WT from non-WT isolates.44 Non-WT isolates harbor acquired resistance mechanisms, which most often correlate with high MICs or MECs, that are above the ECV for the species/agent being evaluated.15,18,24,26,29–32,39 Categorization of an isolate as non-WT indicates a decreased susceptibility to the agent evaluated or potential phenotypic resistance; therefore, ECVs also have an important role in tracking the emergence of resistance. The sustained use of antifungal agents would continue to increase selection pressure for resistance. On the other hand, BPs categorize the isolate as either treatable (susceptible) or non-treatable (resistant) and therefore is the most accurate predictor of patient response to therapy.7,25,45 BPs are not available for many antifungal agent/fungal species combinations because the data requirements for establishing BPs;5 (EUCAST SOP 1.1 Setting breakpoints for new antimicrobial agents at http://www.eucast.org/documents/sops/) are beyond the available MIC/MEC data. In particular, the lack of clinical trials showing a relationship between low and high MICs/MECs and response to therapy, as well as knowledge regarding molecular resistance mechanisms, have hampered the establishment of BPs. However, where there are sufficient MIC/MEC data, it is possible to calculate ECVs. Because ECVs are solely based on those in vitro data, ECVs cannot be used to predict clinical response to treatment with that antifungal agent. Therefore, categorization of an isolate as WT or non-WT is not equivalent to being “susceptible” or “resistant” respectively. Instead, the role of the ECV is to identify those non-WT isolates that potentially harbor acquired resistance mechanisms. Consequently, when there is a formal BP, this is the MIC/MEC value that must be used to report “S”, “SDD” or “R” to the treating clinician. In some instances the ECV is higher than anything achievable with the expected drug exposure; for example, most high ECVs for Fusarium spp. indicate the resistant nature of those species to available agents.
When BPs are not available, the question arises as to whether an ECV can be used to convey information to a treating clinician. Opinions vary, but at present the CLSI are considering applying ECVs where BPs are not available and reporting to the clinician whether the isolate is WT or Non-WT as a comment, without an “S” or “R” interpretation. Should the test indicate that the isolate is Non-WT, the comment would include a statement that, if the patient is undergoing treatment with that agent, the clinician should review the patient's clinical response. How this might play out in the clinical context has yet to be determined as new clinical data are available.
Established CLSI and other ECVsECVs established for the CLSI reference methodsUsing the rules and techniques described above, we have estimated a wide range of ECVs based on the CLSI reference methods and guidelines to define them for important species of Aspergillus, Mucorales and Fusarium, and various species of Candida and Cryptococcus. (Tables 7–11)8–13,15–17,19 A brief description of each group is given below; Annex 1 lists the contributors to the numerous single MIC/MEC distributions used for the calculation of both CLSI and SYO ECVs.
- •
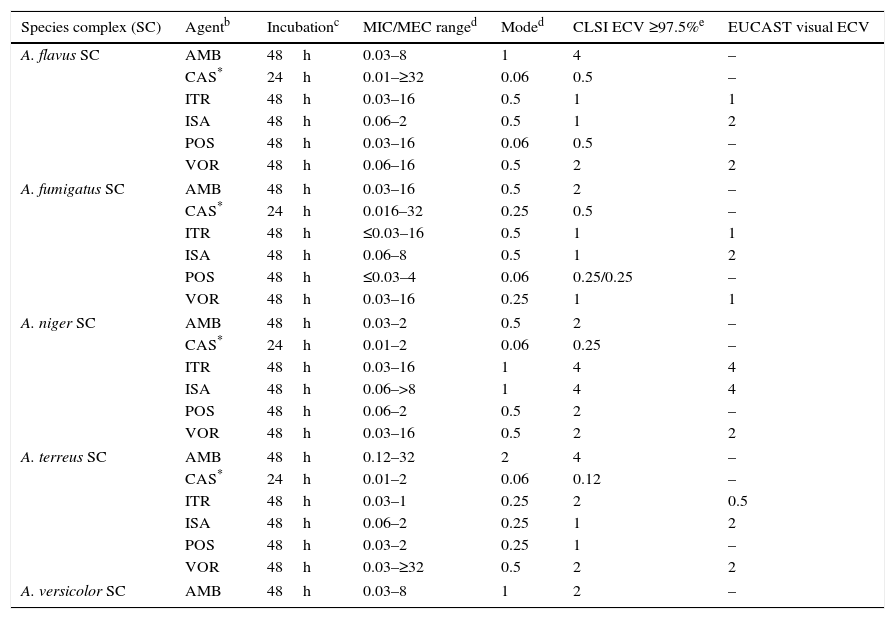
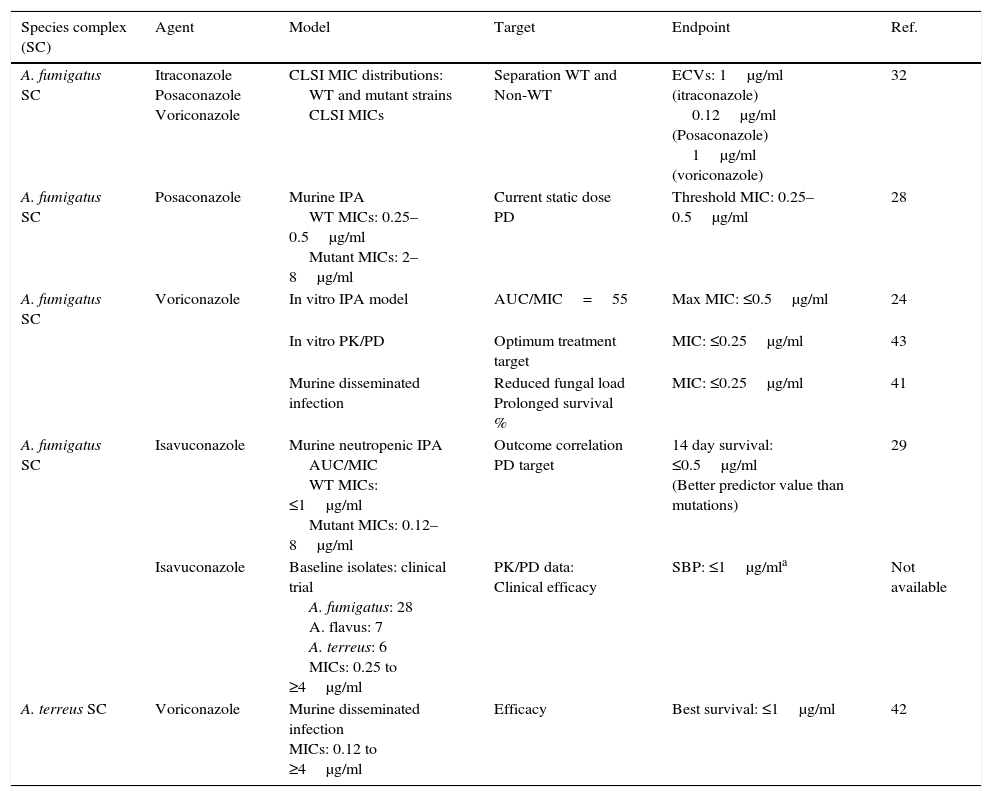
Aspergillusspecies complex. Table 7 provides CLSI ECVs for five Aspergillus SC and the agents more frequently used or potentially useful in the treatment of aspergillosis.8–10,13 Data that corroborate the results in Table 7 have appeared in the literature regarding CLSI itraconazole and voriconazole ECVs of 1μg/ml for A. fumigatus SC (Table 7a) as genetic examination indicated that MICs of 1μg/ml separated mutants (with cyp51A gene mutations) from WT strains.32 However, in the same study, a high percentage of isolates for which CLSI posaconazole MICs were 0.25μg/ml harbored cyp51A gene mutations. In a murine invasive aspergillosis and PD target model, the posaconazole clinical MIC threshold was between 0.25 and 0.5μg/ml or the same values as for the four WT isolates evaluated.28 This apparent mismatch between phenotype and genotype may well be an example of where certain genetic mutations do not have an impact on the phenotype as described in Section “Phenotype versus genotype”. Table 7a also summarizes additional susceptibility endpoints as reported in other studies for voriconazole and isavuconazole versus A. fumigatus SC and for Aspergillus terreus SC versus voriconazole.24,29,41–43 In two in vitro invasive pulmonary aspergillosis and PK/PD models (to simulate clinical voriconazole data) as well in a murine model of disseminate infection, drug efficacy correlated with voriconazole MICs between 0.25 and 0.5μg/ml for the infecting A. fumigatus strains.29,41,43 Both animal and clinical data indicated susceptible endpoints ∼1μg/ml for isavuconazole.29 In the murine model of A. terreus SC, drug efficacy correlated with MICs of ≤1.0μg/ml,42 which is the CLSI ECV for this species and antifungal combination (Tables 7 and 7a). Overall, all these studies generally show alignment with the proposed CLSI triazole ECVs for Aspergillus spp., despite the fact that those animal models also include the drugs pharmacology. Comparable data are not available for either amphotericin B or caspofungin and/or other moulds.
Table 7.Available epidemiologic cutoff values (ECVs) in μg/ml of amphotericin B, caspofungin, itraconazole, isavuconazole, posaconazole, and voriconazole for clinically relevant Aspergillus species complexes and the CLSI and EUCAST broth microdilution methods.a
Species complex (SC) Agentb Incubationc MIC/MEC ranged Moded CLSI ECV ≥97.5%e EUCAST visual ECV A. flavus SC AMB 48h 0.03–8 1 4 – CAS* 24h 0.01–≥32 0.06 0.5 – ITR 48h 0.03–16 0.5 1 1 ISA 48h 0.06–2 0.5 1 2 POS 48h 0.03–16 0.06 0.5 – VOR 48h 0.06–16 0.5 2 2 A. fumigatus SC AMB 48h 0.03–16 0.5 2 – CAS* 24h 0.016–32 0.25 0.5 – ITR 48h ≤0.03–16 0.5 1 1 ISA 48h 0.06–8 0.5 1 2 POS 48h ≤0.03–4 0.06 0.25/0.25 – VOR 48h 0.03–16 0.25 1 1 A. niger SC AMB 48h 0.03–2 0.5 2 – CAS* 24h 0.01–2 0.06 0.25 – ITR 48h 0.03–16 1 4 4 ISA 48h 0.06–>8 1 4 4 POS 48h 0.06–2 0.5 2 – VOR 48h 0.03–16 0.5 2 2 A. terreus SC AMB 48h 0.12–32 2 4 – CAS* 24h 0.01–2 0.06 0.12 – ITR 48h 0.03–1 0.25 2 0.5 ISA 48h 0.06–2 0.25 1 2 POS 48h 0.03–2 0.25 1 – VOR 48h 0.03–≥32 0.5 2 2 A. versicolor SC AMB 48h 0.03–8 1 2 – aCLSI ECVs were defined using pooled MIC/MEC distributions for ≥100 isolates and from ≥3 laboratories by the CLSI document M38-A2 methodology.3,8–10,13
bAMB, amphotericin B; CAS, caspofungin; ITR, itraconazole; ISA, isavuconazole; POS, posaconazole; VOR, voriconazole.
dMIC range and mode (most frequent MIC/MEC) for pooled distributions used for the definition of each set of ECVs.8–10,13
Table 7a.Other proposed triazole susceptibility endpoints by using different approaches for A. fumigatus SC and A. terreus SC.
Species complex (SC) Agent Model Target Endpoint Ref. A. fumigatus SC Itraconazole
Posaconazole
VoriconazoleCLSI MIC distributions:
WT and mutant strains
CLSI MICsSeparation WT and
Non-WTECVs: 1μg/ml (itraconazole)
0.12μg/ml (Posaconazole)
1μg/ml (voriconazole)32 A. fumigatus SC Posaconazole Murine IPA
WT MICs: 0.25–0.5μg/ml
Mutant MICs: 2–8μg/mlCurrent static dose PD Threshold MIC: 0.25–0.5μg/ml 28 A. fumigatus SC Voriconazole In vitro IPA model AUC/MIC=55 Max MIC: ≤0.5μg/ml 24 In vitro PK/PD Optimum treatment target MIC: ≤0.25μg/ml 43 Murine disseminated infection Reduced fungal load
Prolonged survival %MIC: ≤0.25μg/ml 41 A. fumigatus SC Isavuconazole Murine neutropenic IPA
AUC/MIC
WT MICs: ≤1μg/ml
Mutant MICs: 0.12–8μg/mlOutcome correlation
PD target14 day survival: ≤0.5μg/ml
(Better predictor value than mutations)29 Isavuconazole Baseline isolates: clinical trial
A. fumigatus: 28
A. flavus: 7
A. terreus: 6
MICs: 0.25 to ≥4μg/mlPK/PD data:
Clinical efficacySBP: ≤1μg/mla Not available A. terreus SC Voriconazole Murine disseminated infection
MICs: 0.12 to ≥4μg/mlEfficacy Best survival: ≤1μg/ml 42 WT, wild type (no cyp51 gene mutations); non-WT, mutants or harboring cyp51 gene mutations; IPA, invasive pulmonary aspergillosis; PD, pharmacodynamic parameters; PK, pharmacokinetic parameters; AUC, area under the curve; AUC/MIC, PD target for best outcome;
- •
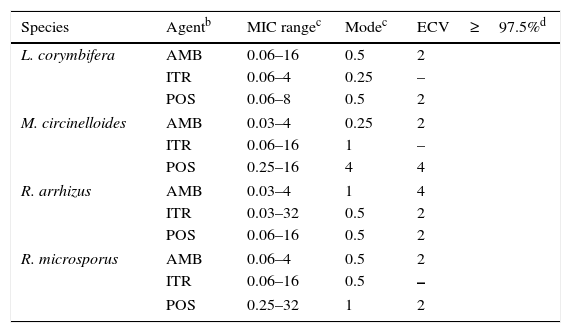
Mucorales andFusarium. Table 8 depicts CLSI amphotericin B and posaconazole ECVs for Lichtheimia corymbifera, Mucor circinelloides, Rhizopus arrhizus, and Rhizopus microsporus and a CLSI ECV of itraconazole for Rhizopus arrhizus; insufficient data for the latter species precluded calculation of ECVs for the other two agents.17Table 9 lists recently reported CLSI ECVs of Fusarium verticillioides, Fusarium oxysporum SC, and Fusarium solani SC and amphotericin B, itraconazole and posaconazole; again insufficient data precluded the calculation of an ECV of itraconazole for F. verticillioides.19 All isolates included in both studies were identified by currently accepted molecular methodologies to either the species or SC level. Again, no genetic information is available for these species/agents combinations. As previously stated in Section “ECVs: Their potential use in clinical practice”, some of the ECVs, especially those for Fusarium spp., are quite high and suggest that they would be unresponsive to treatment with the relevant antifungal agent. It is important to emphasize again that, especially for the latter species, a categorization of an isolate as WT is not equivalent to being susceptible (treatable). CLSI ECVs have not been calculated for any other mould/agent combination, but useful MIC distributions and modes for less prevalent Mucorales and Fusarium spp. can be found in references 17 and 19.
Table 8.Available epidemiologic cutoff values (ECVs) in μg/ml of amphotericin B, itraconazole, and posaconazole for four species of Mucorales and the CLSI broth microdilution method.a
Species Agentb MIC rangec Modec ECV≥97.5%d L. corymbifera AMB 0.06–16 0.5 2 ITR 0.06–4 0.25 – POS 0.06–8 0.5 2 M. circinelloides AMB 0.03–4 0.25 2 ITR 0.06–16 1 – POS 0.25–16 4 4 R. arrhizus AMB 0.03–4 1 4 ITR 0.03–32 0.5 2 POS 0.06–16 0.5 2 R. microsporus AMB 0.06–4 0.5 2 ITR 0.06–16 0.5 – POS 0.25–32 1 2 Table 9.Available epidemiologic cutoff values (ECVs) in μg/ml of amphotericin B, itraconazole, posaconazole, and voriconazole for two clinically relevant Fusarium species complexes and F. verticillioides and the CLSI broth microdilution method.a
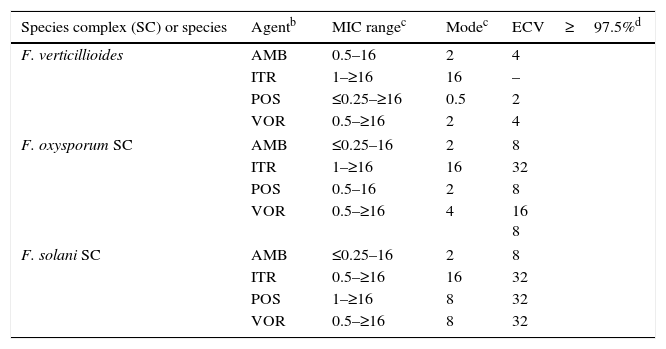
Species complex (SC) or species Agentb MIC rangec Modec ECV≥97.5%d F. verticillioides AMB 0.5–16 2 4 ITR 1–≥16 16 – POS ≤0.25–≥16 0.5 2 VOR 0.5–≥16 2 4 F. oxysporum SC AMB ≤0.25–16 2 8 ITR 1–≥16 16 32 POS 0.5–16 2 8 VOR 0.5–≥16 4 16
8F. solani SC AMB ≤0.25–16 2 8 ITR 0.5–≥16 16 32 POS 1–≥16 8 32 VOR 0.5–≥16 8 32 aCLSI ECVs were defined using pooled distributions for ≥100 isolates and from >3 laboratories by the CLSI document M38-A2 methodology.3,19
cMIC range and mode (most frequently MIC) for pooled distributions used for the definition of each set of ECVs.19
dCalculated ECVs using the iterative statistical method and comprising ≥97.5% of the statistically modeled population as per CLSI criteria.19
- •
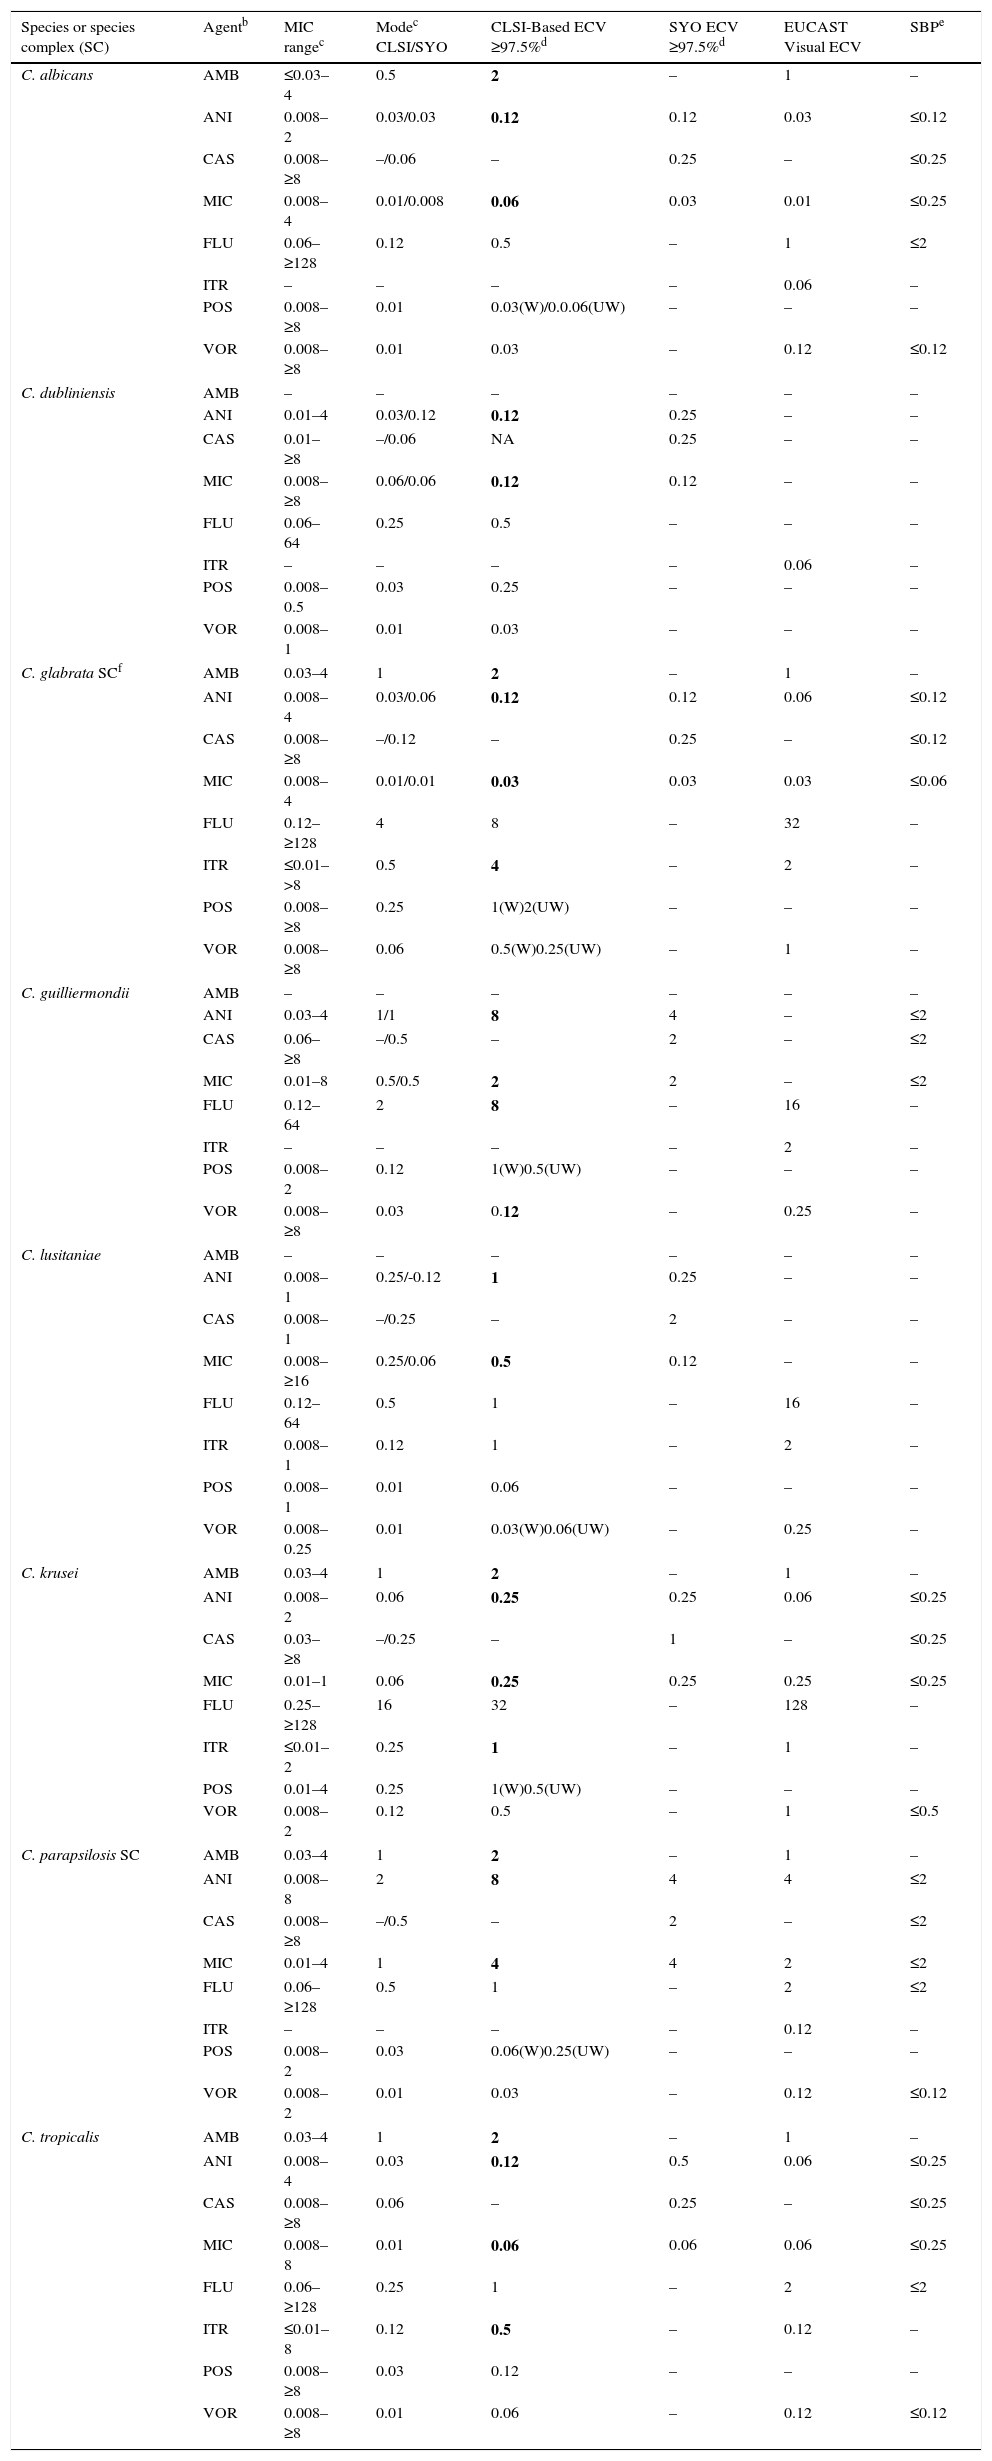
Candida. Given that Candida cause the majority of severe fungal infections, more information has accumulated regarding MIC distributions, molecular mechanisms of resistance, and correlation of in vitro versus in vivo results from formal clinical trials. Because of that, BPs are available for more prevalent Candida spp. and two triazoles (fluconazole and voriconazole) and echinocandins.6,35–37 ECVs also have been defined for less prevalent species, including ECVs of amphotericin B and itraconazole for various prevalent Candida spp.15,38,39Table 10 depicts CLSI approved, ECV (bolded) and the parallel available SBP (right column) for eight Candida spp. Due to interlaboratory variation (high degree of modal differences among 14 laboratories) of CLSI caspofungin MICs for Candida spp., the definition of CLSI-ECVs for Candida spp. and caspofungin was precluded (Table 2).14When BPs have been established for the species/agent combination evaluated, the value that should be used is the BP. Visual EUCAST ECVs and SYO ECVs are also incorporated in Table 10.
Table 10.CLSI and other epidemiologic cutoff values (ECVs) in μg/ml of amphotericin B, anidulafungin, caspofungin, micafungin, fluconazole, itraconazole, posaconazole, and voriconazole for clinically relevant Candida species/complexes and the CLSI, EUCAST and SYO broth microdilution methods.a
Species or species complex (SC) Agentb MIC rangec Modec CLSI/SYO CLSI-Based ECV ≥97.5%d SYO ECV ≥97.5%d EUCAST Visual ECV SBPe C. albicans AMB ≤0.03–4 0.5 2 – 1 – ANI 0.008–2 0.03/0.03 0.12 0.12 0.03 ≤0.12 CAS 0.008–≥8 –/0.06 – 0.25 – ≤0.25 MIC 0.008–4 0.01/0.008 0.06 0.03 0.01 ≤0.25 FLU 0.06–≥128 0.12 0.5 – 1 ≤2 ITR – – – – 0.06 – POS 0.008–≥8 0.01 0.03(W)/0.0.06(UW) – – – VOR 0.008–≥8 0.01 0.03 – 0.12 ≤0.12 C. dubliniensis AMB – – – – – – ANI 0.01–4 0.03/0.12 0.12 0.25 – – CAS 0.01–≥8 –/0.06 NA 0.25 – – MIC 0.008–≥8 0.06/0.06 0.12 0.12 – – FLU 0.06–64 0.25 0.5 – – – ITR – – – – 0.06 – POS 0.008–0.5 0.03 0.25 – – – VOR 0.008–1 0.01 0.03 – – – C. glabrata SCf AMB 0.03–4 1 2 – 1 – ANI 0.008–4 0.03/0.06 0.12 0.12 0.06 ≤0.12 CAS 0.008–≥8 –/0.12 – 0.25 – ≤0.12 MIC 0.008–4 0.01/0.01 0.03 0.03 0.03 ≤0.06 FLU 0.12–≥128 4 8 – 32 – ITR ≤0.01–>8 0.5 4 – 2 – POS 0.008–≥8 0.25 1(W)2(UW) – – – VOR 0.008–≥8 0.06 0.5(W)0.25(UW) – 1 – C. guilliermondii AMB – – – – – – ANI 0.03–4 1/1 8 4 – ≤2 CAS 0.06–≥8 –/0.5 – 2 – ≤2 MIC 0.01–8 0.5/0.5 2 2 – ≤2 FLU 0.12–64 2 8 – 16 – ITR – – – – 2 – POS 0.008–2 0.12 1(W)0.5(UW) – – – VOR 0.008–≥8 0.03 0.12 – 0.25 – C. lusitaniae AMB – – – – – – ANI 0.008–1 0.25/-0.12 1 0.25 – – CAS 0.008–1 –/0.25 – 2 – – MIC 0.008–≥16 0.25/0.06 0.5 0.12 – – FLU 0.12–64 0.5 1 – 16 – ITR 0.008–1 0.12 1 – 2 – POS 0.008–1 0.01 0.06 – – – VOR 0.008–0.25 0.01 0.03(W)0.06(UW) – 0.25 – C. krusei AMB 0.03–4 1 2 – 1 – ANI 0.008–2 0.06 0.25 0.25 0.06 ≤0.25 CAS 0.03–≥8 –/0.25 – 1 – ≤0.25 MIC 0.01–1 0.06 0.25 0.25 0.25 ≤0.25 FLU 0.25–≥128 16 32 – 128 – ITR ≤0.01–2 0.25 1 – 1 – POS 0.01–4 0.25 1(W)0.5(UW) – – – VOR 0.008–2 0.12 0.5 – 1 ≤0.5 C. parapsilosis SC AMB 0.03–4 1 2 – 1 – ANI 0.008–8 2 8 4 4 ≤2 CAS 0.008–≥8 –/0.5 – 2 – ≤2 MIC 0.01–4 1 4 4 2 ≤2 FLU 0.06–≥128 0.5 1 – 2 ≤2 ITR – – – – 0.12 – POS 0.008–2 0.03 0.06(W)0.25(UW) – – – VOR 0.008–2 0.01 0.03 – 0.12 ≤0.12 C. tropicalis AMB 0.03–4 1 2 – 1 – ANI 0.008–4 0.03 0.12 0.5 0.06 ≤0.25 CAS 0.008–≥8 0.06 – 0.25 – ≤0.25 MIC 0.008–8 0.01 0.06 0.06 0.06 ≤0.25 FLU 0.06–≥128 0.25 1 – 2 ≤2 ITR ≤0.01–8 0.12 0.5 – 0.12 – POS 0.008–≥8 0.03 0.12 – – – VOR 0.008–≥8 0.01 0.06 – 0.12 ≤0.12 aCLSI and SYO ECVs were defined using pooled distributions for ≥100 isolates and from ≥3 laboratories by the CLSI document M27-A3 and/or SYO methodologies.4,15,18,38,39
bAMB, amphotericin B; ANI, anidulafungin; CAS, caspofungin, MIC, micafungin; FLU, fluconazole; ITR, itraconazole; POS, posaconazole; VOR, voriconazole.
cMIC range and mode (most frequently MIC) for pooled distributions used for the definition of each set of ECVs.15,18,38,39
dCalculated ECVs using the iterative statistical method and comprising ≥97.5% of the statistically modeled population as per CLSI criteria.
W (weighted) and UW (unweighted) ECV: At least one of the distributions comprised ≥50% of the pooled values which led to the need for the weighting analysis (See Table 3). See criterion xi regarding the unresolved issue when the values are different following normalization of the data (W analysis).
fSBPs are not available for the combination of C. glabrata SC and fluconazole, only susceptible dose dependent (≤ 32μg/ml) and resistant BPs (≥ 64 μg/ml) are listed in the CLSI document.6
ECVs are not available for flucytosine and various species and itraconazole due to truncated distributions and/or insufficient data as per CLSI criteria.
EUCAST ECVs were set by visual examination of the data (http://mic.eucast.org/Eucast2/).
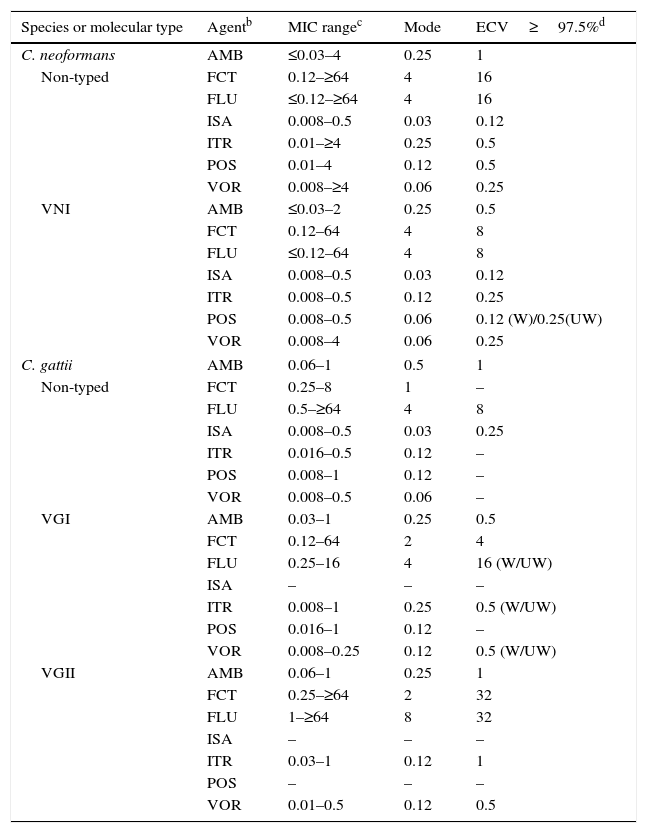
Table 11.Available epidemiologic cutoff values (ECVs)a in μg/ml of amphotericin B, flucytosine, fluconazole, isavuconazole, itraconazole, posaconazole, and voriconazole for Cryptococcus neoformans-Cryptococcus gattii species complex and the CLSI broth dilution microdilution method.
Species or molecular type Agentb MIC rangec Mode ECV≥97.5%d C. neoformans AMB ≤0.03–4 0.25 1 Non-typed FCT 0.12–≥64 4 16 FLU ≤0.12–≥64 4 16 ISA 0.008–0.5 0.03 0.12 ITR 0.01–≥4 0.25 0.5 POS 0.01–4 0.12 0.5 VOR 0.008–≥4 0.06 0.25 VNI AMB ≤0.03–2 0.25 0.5 FCT 0.12–64 4 8 FLU ≤0.12–64 4 8 ISA 0.008–0.5 0.03 0.12 ITR 0.008–0.5 0.12 0.25 POS 0.008–0.5 0.06 0.12 (W)/0.25(UW) VOR 0.008–4 0.06 0.25 C. gattii AMB 0.06–1 0.5 1 Non-typed FCT 0.25–8 1 – FLU 0.5–≥64 4 8 ISA 0.008–0.5 0.03 0.25 ITR 0.016–0.5 0.12 – POS 0.008–1 0.12 – VOR 0.008–0.5 0.06 – VGI AMB 0.03–1 0.25 0.5 FCT 0.12–64 2 4 FLU 0.25–16 4 16 (W/UW) ISA – – – ITR 0.008–1 0.25 0.5 (W/UW) POS 0.016–1 0.12 – VOR 0.008–0.25 0.12 0.5 (W/UW) VGII AMB 0.06–1 0.25 1 FCT 0.25–≥64 2 32 FLU 1–≥64 8 32 ISA – – – ITR 0.03–1 0.12 1 POS – – – VOR 0.01–0.5 0.12 0.5 aECVs were defined using pooled distributions for ≥100 isolates and from ≥3 laboratories by the CLSI document M27-A3 methodology.4,11,12,16
bAMB, amphotericin B; FCT, flucytosine; FLU, fluconazole; ISA, isavuconazole; ITR, itraconazole; POS, posaconazole; VOR, voriconazole.
cMIC range and mode (most frequent MIC) for pooled distributions used for the definition of each set of ECVs.11,12,16
dCalculated ECVs using the iterative statistical method and comprising ≥97.5% of the statistically modeled population as per CLSI criteria.1,11,12
W (weighted) and UW (unweighted) analysis, respectively: At least one of the distributions comprised ≥50% of the pooled values which led to the need for the weighting analysis (See Table 3).
- •
Cryptococcus. CLSI ECVs of seven agents used or potentially useful in the treatment of cryptococcal infections also have been calculated for Cryptococcus neoformans (including molecular type VNI) and Cryptococcus gattii (including molecular types VGI and VGII; Table 11).11,12,16 Although data were available in those studies for other molecular types (VNII, VNIII and VNIV and VGIIb, VGIIc, VGIII and VGIV), insufficient data (<100 isolates and/or originating in only two laboratories) precluded ECV calculation; however, their MIC distributions and modes can be found in references 11, 12, and 16. It is noteworthy that VGII and VGIII genotypes can include at least three and two subtypes, respectively (VGIIa, VGIIb, and VGIIc and VGIIIa and VGIIIb). Given that BPs are not available for this important fungal group, these CLSI ECVs can be useful since the incidence of infections caused by these two species complexes continues to increase.
- •
Method-dependent SYO-based ECVs. Method-dependent ECVs based on Sensititre® YeastOne® (SYO) susceptibility testing data for several species of Candida spp. and the echinocandins have been published and are listed in Table 10.18 Since no major inter-laboratory variation in caspofungin MIC distributions was evident with SYO panels, it has been possible to estimate method-dependent ECVs for this agent.18 When echinocandin SYO and CLSI ECVs are available for the same species, modes and MIC ranges by both methods are listed; similar SYO MIC information for less prevalent Candida spp. are found in reference 18. In general, CLSI and SYO ECVs of anidulafungin and micafungin ECVs are the same or only one dilution different with several exceptions, some ECVs for Candida lusitaniae, Candida tropicalis and Candida parapsilosis. These differences emphasize the importance of using the interpretive endpoint for which it was established.
EUCAST's reference methods for antifungal susceptibility testing differ in a small number of ways from those by CLSI methods (http://www.eucast.org/ast_of_fungi/methodsinantifungalsusceptibilitytesting/susceptibility/testing of yeasts/), sufficiently in some cases to yield different MICs/MECs.20 ECVs by both methods tend to be similar, mostly two-fold dilutions of each other, with the differences attributable to differences in testing methods and/or ECV estimation (Tables 7 and 10). EUCAST ECVs for a number of organism/antifungal combinations using visual inspection are published on the EUCAST wild-type distribution website (http://mic.eucast.org/Eucast2/).
ConclusionsFor the first same time in the field of antifungal chemotherapy, interpretive endpoints (BPs and ECVs) are available for the more prevalent yeast and mould species that cause serious infections, especially in the immuno-compromised host. Although the new interpretive categories (ECVs) do not predict clinical response as BPs do, they would identify non-WT or less susceptible isolates. These non-WT isolates are less likely to respond to therapy. Since excessive variability is still present in reference method susceptibility testing of caspofungin for Candida spp., SYO ECVs are now available for this widely used commercial assay. As CLSI supplements may be revised yearly, it is expected that more of these values would be listed in future versions of these supplements as well as some of the listed ECVs in the present could be modified as new data or taxonomic issues are resolved. It is hoped that in the near future, EUCAST will provide ECVs that have been calculated in the similar statistically manner as those for the CLSI methods and that ECVs for other species and agent combinations as well as for the Etest also will be available.
Conflict of interestThe authors declare no conflict of interest.
Thanks are due to the principal investigators who provided or tested the mutant isolates that were used to evaluate the usefulness of triazoles and echinocandin ECVs as follows: G. Garcia-Effron, J. Guinea, D.S. Perlin, M. Sanguinetti, and R. Shields. We also thank M. Castanheira, R.N. Jones, and J. Rex for their assistance in the acquisition of some of the distributions used for ECV estimation.
List of the principal investigators who provided each single distribution for the estimation of each ECV.aa CLSI and SYO-ECVs published in references 8–13 and 15–19.
A.I. Aller, M. Alvarez-Fernandez, L.X. Bonfietti, N. Borrell Solé, B. Bustamante, E. Cantón, P. L. Carver, L.R. Castañón-Olivares, A. Chakrabarti, S. C-A. Chen, A. Chowdhary, A.L. Colombo, S. Cordoba, M. Cuenca-Estrella, D.J. Diekema, P.J. Dufresne, J. Echeverria, G. Eschenauer, J. Esperalba, A. Espinel-Ingroff, C. Lass-Flörl, A. Fothergill, J. Fuller, I. García García, D. L. Getsinger, M. Ghannoum, E. Gómez-G. de la Pedrosa, N. P. Govender, G. M. Gonzalez, A. Grancini, J. Guarro, F. Hagen, K. E. Hanson, M.T. Illnait-Zaragozi, E. Johnson, S. E. Kidd, K. Klinker, C. J. Kubin, J.V. Kus, C. Lass-Flörl, M. J. Linares, S. R. Lockhart, F. Marco, E. Martin-Mazuelos, M.A. Martins, J.F. Meis, J. Meletiadis, T,M.S.C. Melhem, J. P. Merino, A. J. Morris, P. Pappas, M. A. Pfaller, T. Pelaez, J. Pemán, L. Pérez del Molino, L. Ostrosky-Zeichner, G. Quindós, M. Rodriguez-Iglesias, E. Roselló Mayans, C. Rubio Calvo, M. Ruiz Pérez de Pipaon, F. Sánchez-Reus, W. A. Schell, S. Shoham, G. St-Germain, M.W. Szeszs, J.P. Takahaschi, G. R. Thompson, A.M. Tortorano, L. Trilles, N. L. Wengenack, N.P. Wiederhold, G. Yagüe

