


Hip fractures are the most common cause of hospital admission to orthopaedic departments in Europe and they generate a major health problem. Therefore, it is of great interest to identify additional risk factors that will help us to better understand the pathophysiology of these fractures and improve our preventive capacity.
There is sufficient data to support the theory of modulation of bone mass by gut microbiota (osteomicrobiology); however, there is a lack of human clinical studies directly linking microbiota to hip fracture risk.
Material and methodsObservational, analytical, case–control study.
The sample consisted of 50 patients and it was distributed as follows: 25 elderly patients with fragility hip fracture and 25 subjects without fracture. The intestinal microbiota was determined by DNA extraction from stool samples and 16S ribosomal DNA sequencing after generation of gene libraries.
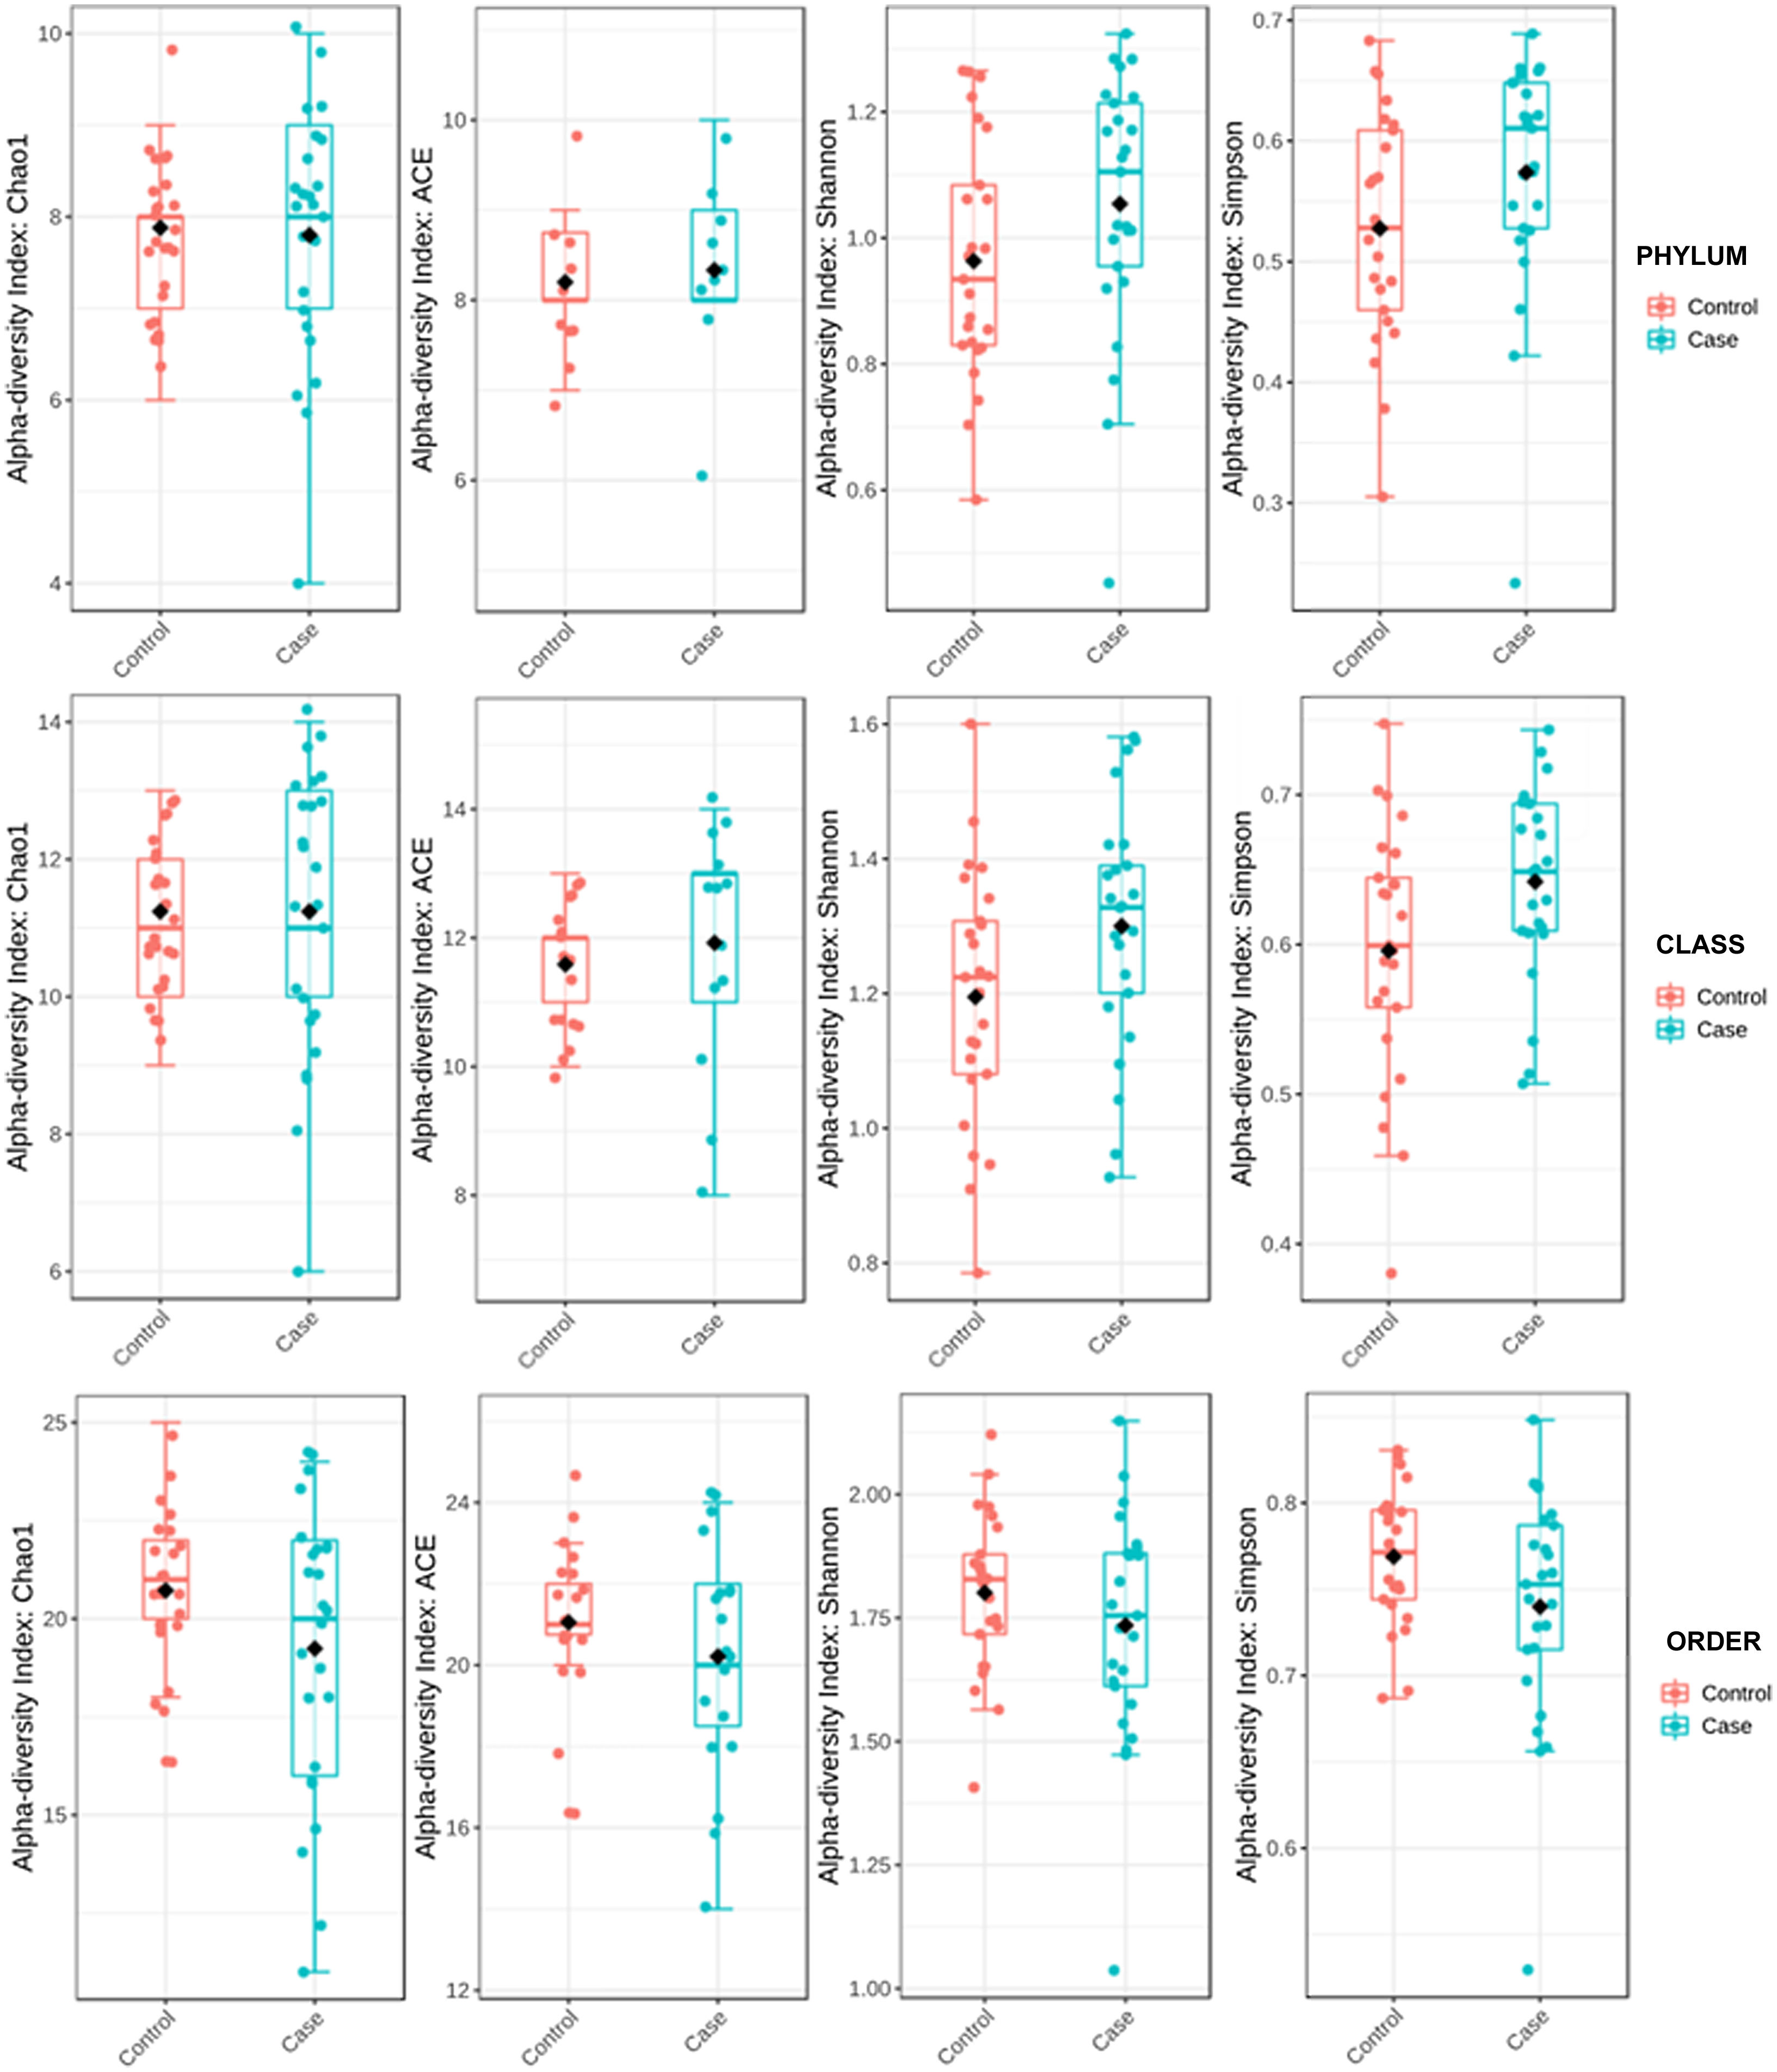
ResultsAlpha diversity revealed an elevation of the estimators for the taxonomic class level in the hip fracture group.
The orders Bacteroidales, Oscillospirales, Lachnospirales, Peptostreptococcales-Tissierellales and Enterobacterales were the dominant orders in both groups.
In patients with fracture, a significant percentage increase in the orders Bacteroidales (p<.001) and Peptostreptococcales-Tissierellales (p<.005) was observed, as well as a decrease in the orders Lachnospirales (p<.001) compared to controls.
ConclusionsThis study has found an association between a specific microbiota in elderly patients with fragility hip fracture. These findings open the door to new strategies to prevent hip fractures. Modification of the microbiota through probiotics may prove to be an effective method to reduce the risk of hip fracture.
Las fracturas de cadera son la causa más frecuente de ingreso hospitalario en los servicios de Ortopedia de Europa y suponen un importante problema sanitario. Por ello, es de gran interés identificar factores de riesgo adicionales que nos ayuden a comprender mejor la fisiopatología de estas fracturas y a mejorar nuestra capacidad preventiva.
Existen datos suficientes para apoyar la teoría de la modulación de la masa ósea por la microbiota intestinal (osteomicrobiología); sin embargo, faltan estudios clínicos en humanos que relacionen directamente la microbiota con el riesgo de fractura de cadera.
Material y métodosEstudio observacional, analítico, de casos y controles.
La muestra consta de 50 pacientes y se distribuye de la siguiente manera: 25 pacientes ancianos con fractura de cadera por fragilidad y 25 controles sanos sin fractura. Se analizó la microbiota intestinal mediante extracción de ADN de muestras de heces y secuenciación del ADN ribosómico 16S tras la generación de bibliotecas de genes.
ResultadosLa diversidad alfa reveló una elevación de los estimadores para el nivel taxonómico de clase en el grupo de fracturas de cadera.
Los órdenes Bacteroidales, Oscillospirales, Lachnospirales, Peptostreptococcales-Tissierellales y Enterobacterales fueron los órdenes dominantes en ambos grupos.
En los pacientes con fractura, se observó un aumento porcentual significativo del orden de Bacteroidales (p < 0,001) y Peptostreptococcales-Tissierellales (p < 0,005), así como una disminución de las del orden Lachnospirales (p < 0,001) respecto a los controles.
ConclusionesEste estudio ha encontrado una asociación entre una microbiota específica en pacientes ancianos con fractura de cadera por fragilidad. Estos hallazgos abren la puerta a nuevas estrategias para prevenir las fracturas de cadera. Es posible que la modificación de la microbiota mediante probióticos se revele como un método eficaz para reducir el riesgo de fractura de cadera.
Fragility hip fractures are the most frequent cause of hospital admission to orthopaedic services in Spain and the rest of Europe; they are therefore regarded as a major healthcare problem.1 In addition to their marked impact on patient mortality, they pose a major social burden and high cost to national healthcare systems.1
Osteoporosis is a chronic systemic disorder of the skeleton that is mediated by inflammatory factors and leads to increased bone fragility and risk of fracture. Age, being female, and a history of fracture are the two major clinical risk factors associated with fracture2; nevertheless, they are of little predictive value. Measuring bone mineral density by bone densitometry is the method of choice to assess fracture risk, but its low sensitivity is one of the reasons why it is not recommended for widespread population screening.3 Thus, there is a need to identify additional risk factors that will contribute to a better understanding of the pathophysiology of these fractures and to enhance our preventive capacity.
The human microbiome is the set of microbial species (microbiota) and their metabolites that are associated with the human body. Each region of the body has a habitat that conditions the species residing in it and that evolves on the basis of age and physiological status.4 In particular, the gut microbiota (GM) gradually develops in our body beginning at birth; it achieves the composition of the adult between 2 and 3 years of age, and is made up of trillions of microorganisms belonging more than 1000 species, mostly bacteria belonging to the phyla Firmicutes and Bacteroidetes.4 Unfortunately, many of them have not been successfully cultured in the laboratory or remain taxonomically uncharacterised.4
A clear association has been demonstrated between the microbiome and several chronic conditions in humans, including inflammatory bowel diseases, obesity, metabolic diseases, malnutrition, neurological disorders, cancer, and cardiovascular disease.5 However, its relationship with bone diseases, such as osteoporosis, is less well known. There are data that indicate that bone mass is modulated by GM, although the mechanism is complex and poorly understood.5 Several experimental studies in mice have examined the impact of the microbiome on bone structure and density.6 There is evidence that osteoclastic function can be altered in mice whose intestinal microbiome is anomalous, which might correlate to an altered immune status of the bone in these animals.7 Nonetheless, to date, only studies in the experimental phase have been performed in vitro or in modified animals, free of microorganisms. That being said, there is currently sufficient data to support the theory that bone mass is modulated by GM (osteomicrobiology).5 However, clinical studies carried out in humans are still lacking that directly relate microbiota to the risk of hip fracture.
We hypothesise that individuals with fragility hip fracture have a specific GM that fosters bone loss and the development of fracture. The present study seeks to identify the predominant GM in elderly patients with fragility hip fracture in comparison with the microbiota present in healthy individuals by sequencing the 16S rRNA gene.
Material and methodsIn accordance with the provisions of the STROBE statement, an observational, analytical, case-control study was undertaken to identify possible differences in the composition of GM in elderly patients with fragility hip fracture in comparison with elderly patients without hip fracture. This study was approved by the Ethics Committee of our institution (CEim 07/19) and informed consent was requested from all subjects recruited.
Study sampleFifty individuals from the health department attached to our hospital centre were included. The cohort with pathology consisted of 25 patients diagnosed with acute hip fracture as a consequence of low-impact trauma or a fall from a height equal to or less than his/her own height, who were admitted to undergo surgical treatment. Separately, 25 controls with no history of hip fracture were recruited from the community. In both groups the following inclusion criteria were specified: age over 70 years, Barthel scale score≥30 points, and no prior hip fracture. Participants who had received antibiotic treatment in the 2 weeks prior to study admission or active treatment (chemotherapy or radiotherapy) for any neoplasm, those with moderate–severe cognitive impairment defined as a score≥5 on the Global Deterioration Scale (GDS), and those undergoing surgery or who were hospitalised for any reason in the preceding three months prior to inclusion in the study were excluded.
Sample sizeTo calculate the sample size, we have arbitrarily assumed the study's capacity to detect an odds ratio of more than three, as this figure is the one currently reported as the predictive capacity of bone densitometry for hip fracture. With the intention of proceeding conservatively, it has been assumed that the hypothetical proportion of exposed cases is 50% and that up to 10% of the controls may have the same exposure as the cases. A 2-tailed alpha significance level of .05 and a beta power of .8 were used in a 1:1 ratio of cases to controls. The Kelsey method using Open Epi software versión 3.03.178 was used which yielded a result of 42 subjects (21 cases and 21 controls). Assuming a possible 20% loss rate, the final sample is set at 50 study subjects (25 cases and 25 controls).
Clinical variablesDemographic variables (age and sex) were collected in all cases. In the group of patients with fractures, the side and type of fracture were identified in accordance with the following classification: (1) Subcapital fractures when they occur in the area of the femoral neck, between the head and the intertrochanteric region. (2) Pertrochanteric fractures when the fracture line is between the greater and lesser trochanter, and (3) Persubtrochanteric, those that occur between the lesser trochanter and 5cm distal to it. The functional situation of the cases and controls was obtained by applying the Charlson Comorbidity Index,9 the Barthel Index,10 and the GDS.11
Sample collectionFaecal sampling in the case group was obtained prior to hip fracture repair surgery. The maximum time for taking samples was 24h after the fracture was sustained in order to minimise changes in the GM as a consequence of the fracture and bed rest. As for the controls, samples were obtained from healthy individuals from the community with no history of hip fracture or from patients who were to undergo orthopaedic surgical treatment at the time of admission. All faecal samples were procured following the 2016 Spanish Society of Infectious Diseases and Clinical Microbiology recommendations.12 Samples were attained by rectal swab prior to administration of prophylactic antibiotic doses and each was stored in a 2mL canister and immediately frozen at −80°.
For metagenome characterisation by mass sequencing, DNA was extracted from faecal samples of each subject following the procedures previously reported and published by the group of Bäuerl et al.13 Briefly put, we started with 200–300mg of faeces using a Qiagen faecal DNA extraction kit (QIAgen, Hilden, Germany), in accordance with the manufacturer's instructions. This method was modified by adding a previous step using a Bead Beater with 1-minute pulses at 2000 oscillations per minute. The DNA was quantified using the Qubit® fluorometer (Life Technologies, Grand Island, NY, USA). The meta-taxonomic study of the microbiota was based on the V3-V4 variable regions of the 16S rRNA gene by PCR, from which libraries labelled with “multiplex” identifiers were generated according to the MiSeq sequencing platform (Illumina).
Bioinformatic analysis of microbiotaNormalised and filtered sequences were analysed using MicrobiomeAnalyst software (https://www.microbiomeanalyst.ca/).14 Operational taxonomic units were generated by clustering with 97% similarity and aligned to fully sequenced genomes from public databases, as did Silva.15
Alpha diversity was estimated by distances using UniFrac16 platforms. UniFrac weighted (considers relative abundance) and unweighted (does not consider relative abundance) distances and sample metadata were used to perform Principal Coordinate Analysis (PCoA). Alpha diversity was used to quantify diversity within a sample. The two most commonly used measures of alpha diversity are richness (count) and evenness (distribution). MicrobiomeAnalyst has the α-diversity estimators Chao 1, Ace, Shannon, and Simpson. The Ace and Chao 1 indices assess observed operational taxonomic units and take into account unobserved species in terms of low abundance operational taxonomic units, thereby analysing richness. Shannon's and Simpson's indicators evaluate both richness and evenness of the sample.
To establish differences in taxonomic structure between groups quantitatively and statistically, the median abundance for each bacterial group and the non-parametric Wilcoxon rank sum test were plotted, respectively. Multivariate processing was performed using different programmes designed in R.
Statistical analysisAnalysis of the results and generation of figures based on clinical and pathological information, alpha estimators and relative bacterial abundance were carried out using MicrobiomeAnalyst and its statistical package designed in the R environment (MicrobiomeAnalystR). For all faecal samples, alpha diversity was calculated, which provides a summary of the microbial community in individual samples and can be compared across groups to judge the role of a particular factor (in this case the presence of fracture) on the richness (number of species) and evenness (degree of representation of each species) in the sample.17 Student's t-test and Wilcoxon rank sum test with a Benjamini–Hochberg correction (FDR) for multiple comparisons were performed. A p<.05 was used as the cut-off to establish significant intergroup differences.
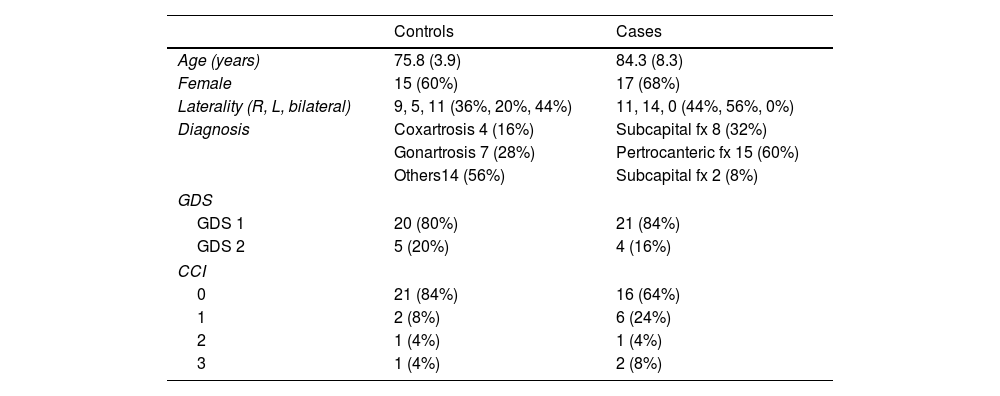
ResultsDemographic data are reported in Table 1. The sample consisted of 32 women (64%) and 18 men (36%), with a mean age of 80.9 years (SD±7.7). Eighty-two percent of the patients had no cognitive impairment (GDS1), while the rest exhibited mild cognitive deficits (GDS2). According to the Charlson comorbidity index, the degree of pathological involvement was low and the score obtained was 0–1 and 2–3 in 45 and 5 patients, respectively.
Values of age expressed as mean and standard deviation.
| Controls | Cases | |
|---|---|---|
| Age (years) | 75.8 (3.9) | 84.3 (8.3) |
| Female | 15 (60%) | 17 (68%) |
| Laterality (R, L, bilateral) | 9, 5, 11 (36%, 20%, 44%) | 11, 14, 0 (44%, 56%, 0%) |
| Diagnosis | Coxartrosis 4 (16%) | Subcapital fx 8 (32%) |
| Gonartrosis 7 (28%) | Pertrocanteric fx 15 (60%) | |
| Others14 (56%) | Subcapital fx 2 (8%) | |
| GDS | ||
| GDS 1 | 20 (80%) | 21 (84%) |
| GDS 2 | 5 (20%) | 4 (16%) |
| CCI | ||
| 0 | 21 (84%) | 16 (64%) |
| 1 | 2 (8%) | 6 (24%) |
| 2 | 1 (4%) | 1 (4%) |
| 3 | 1 (4%) | 2 (8%) |
GDS: Global Deterioration Scale; CCI: Charlson Comorbidity Index.
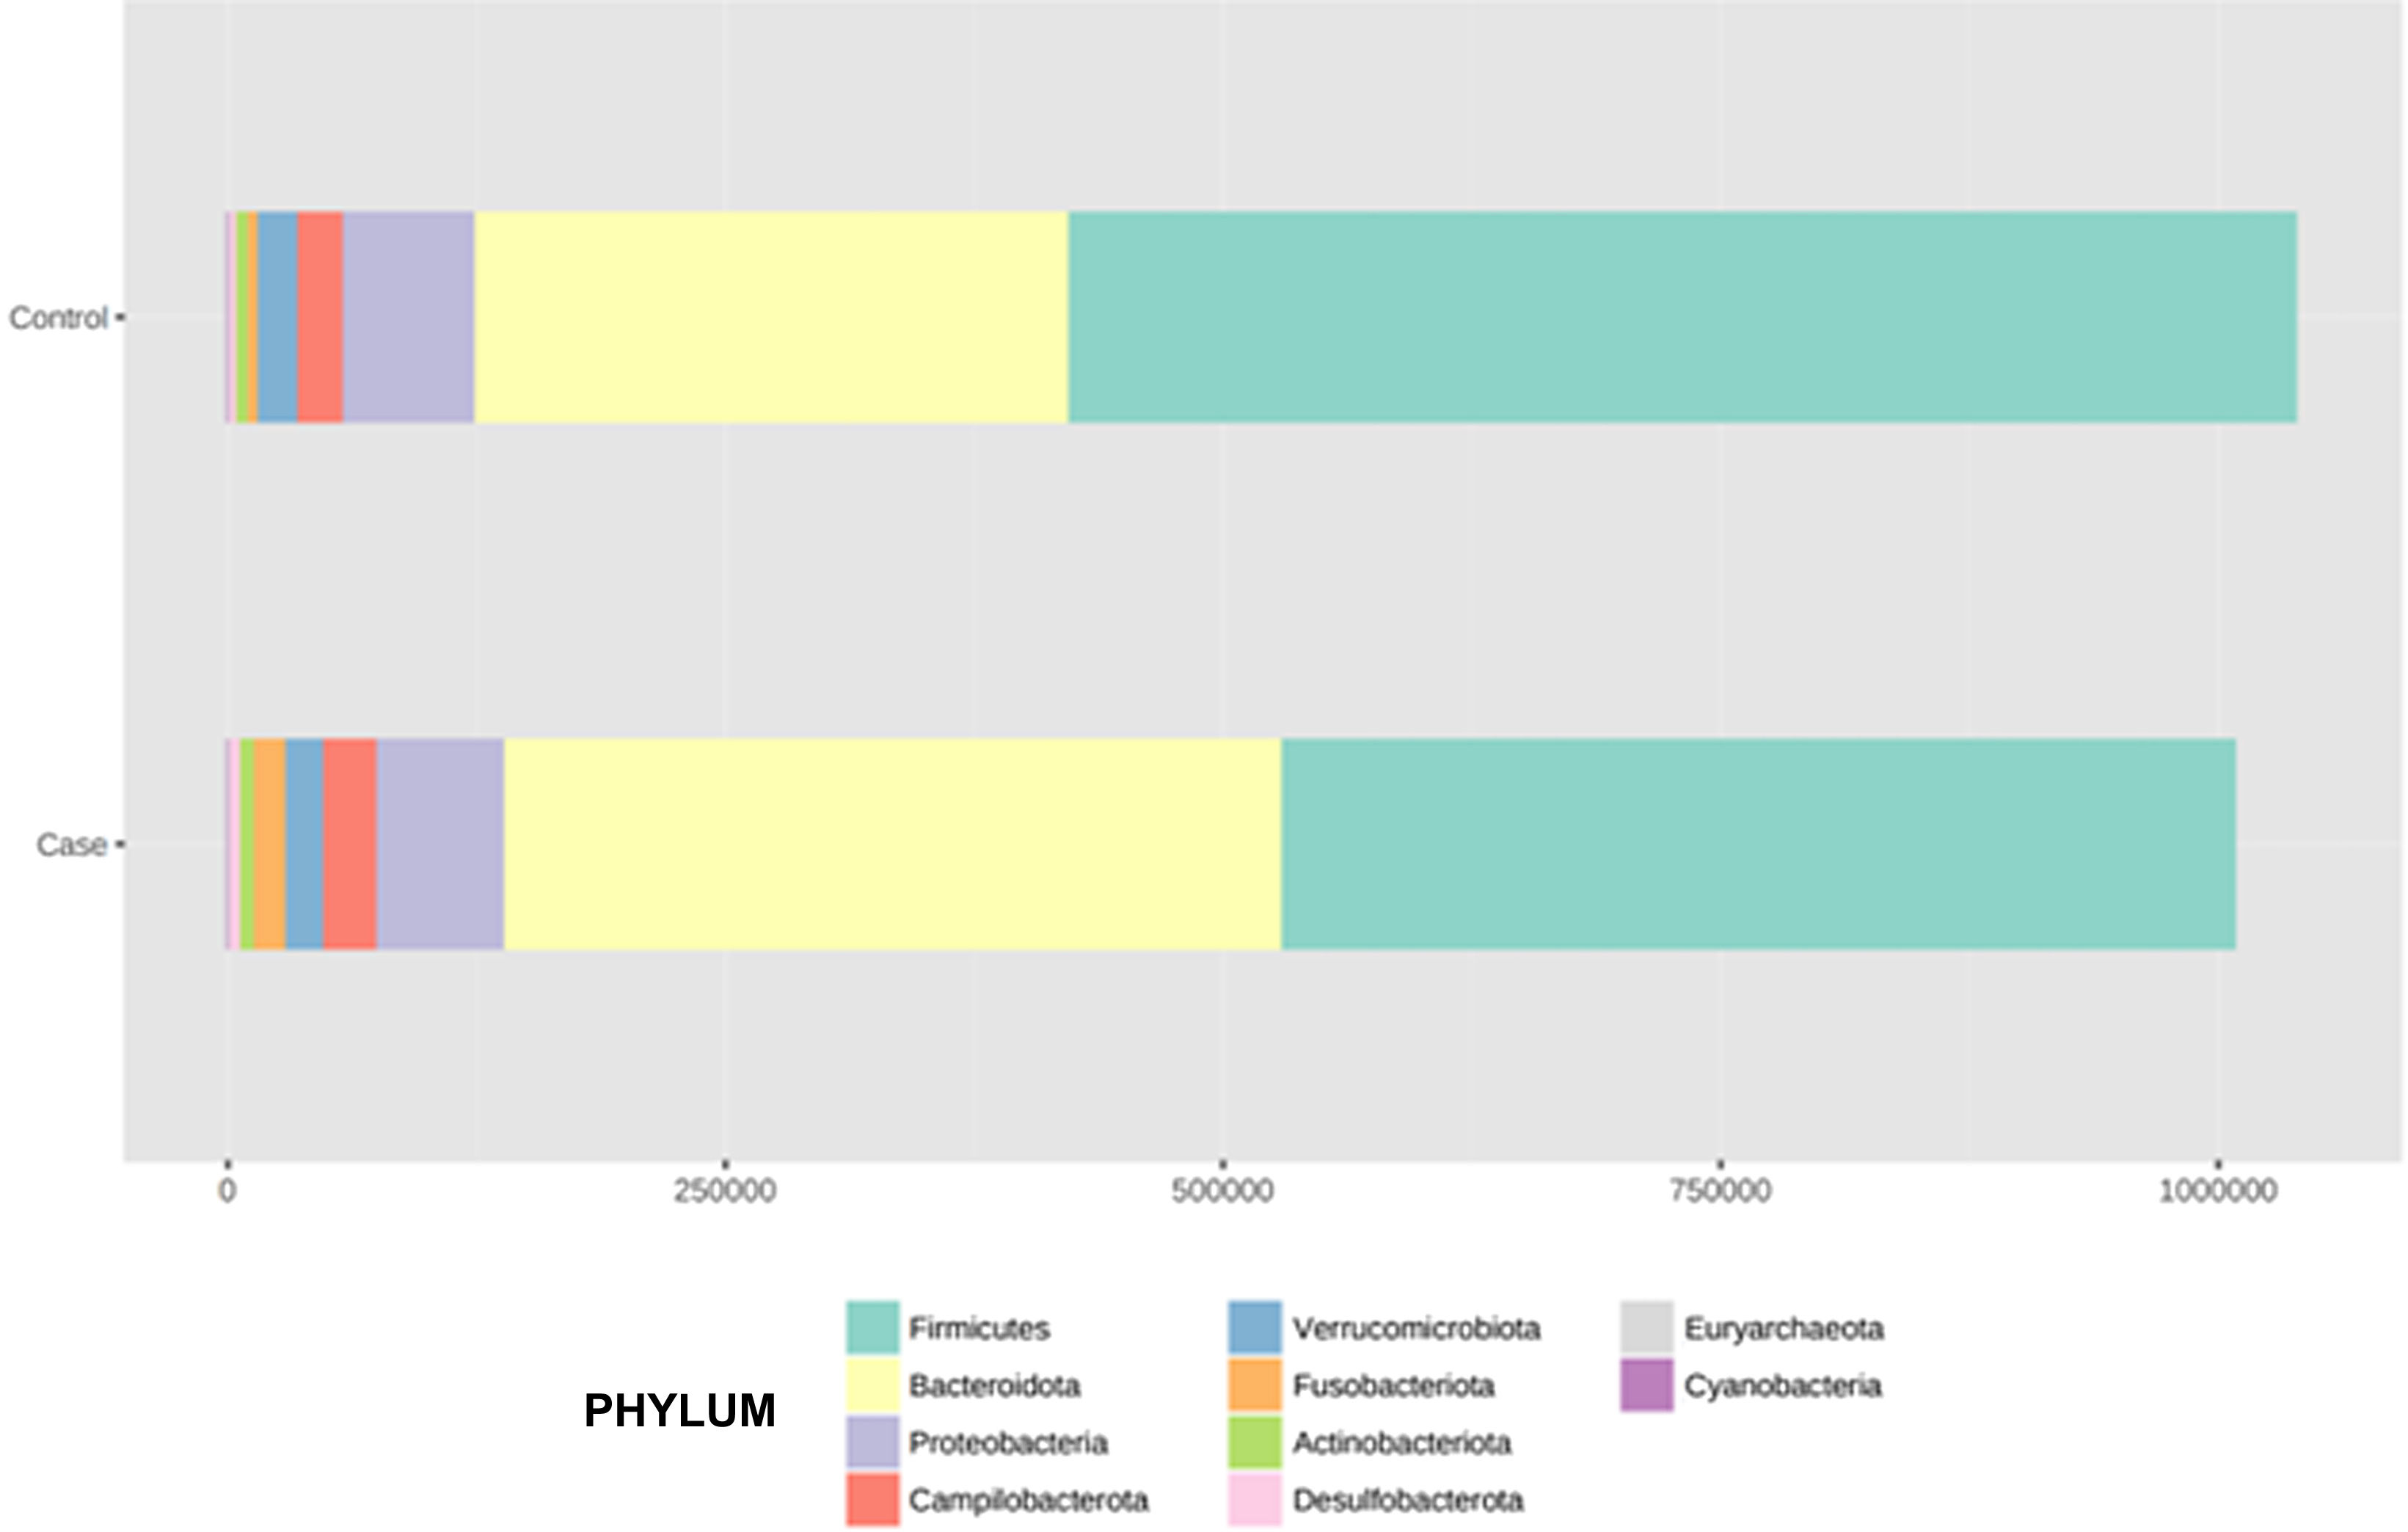
According to the sequencing data of all samples, the GM was classified into 10 phyla, 15 classes, and 29 orders. A total of 2,048,310 bacterial taxa were recorded, of which 1,039,915 were in the control group and 1,008,395 in the pathological group.
To determine the alpha diversity, the mean of Chao's index, Ace's index, Shannon's index, and Simpson's index were calculated. This procedure makes it possible to fully define the diversity of the bacterial community in the samples, so that higher values of the estimators reflect greater diversity. Detailed information on the estimators is reported in Table 2; statistical differences were found for Shannon's and Simpson's indices at the class levels -2.0258 and 2.1596 (p<.05), respectively (Fig. 1).

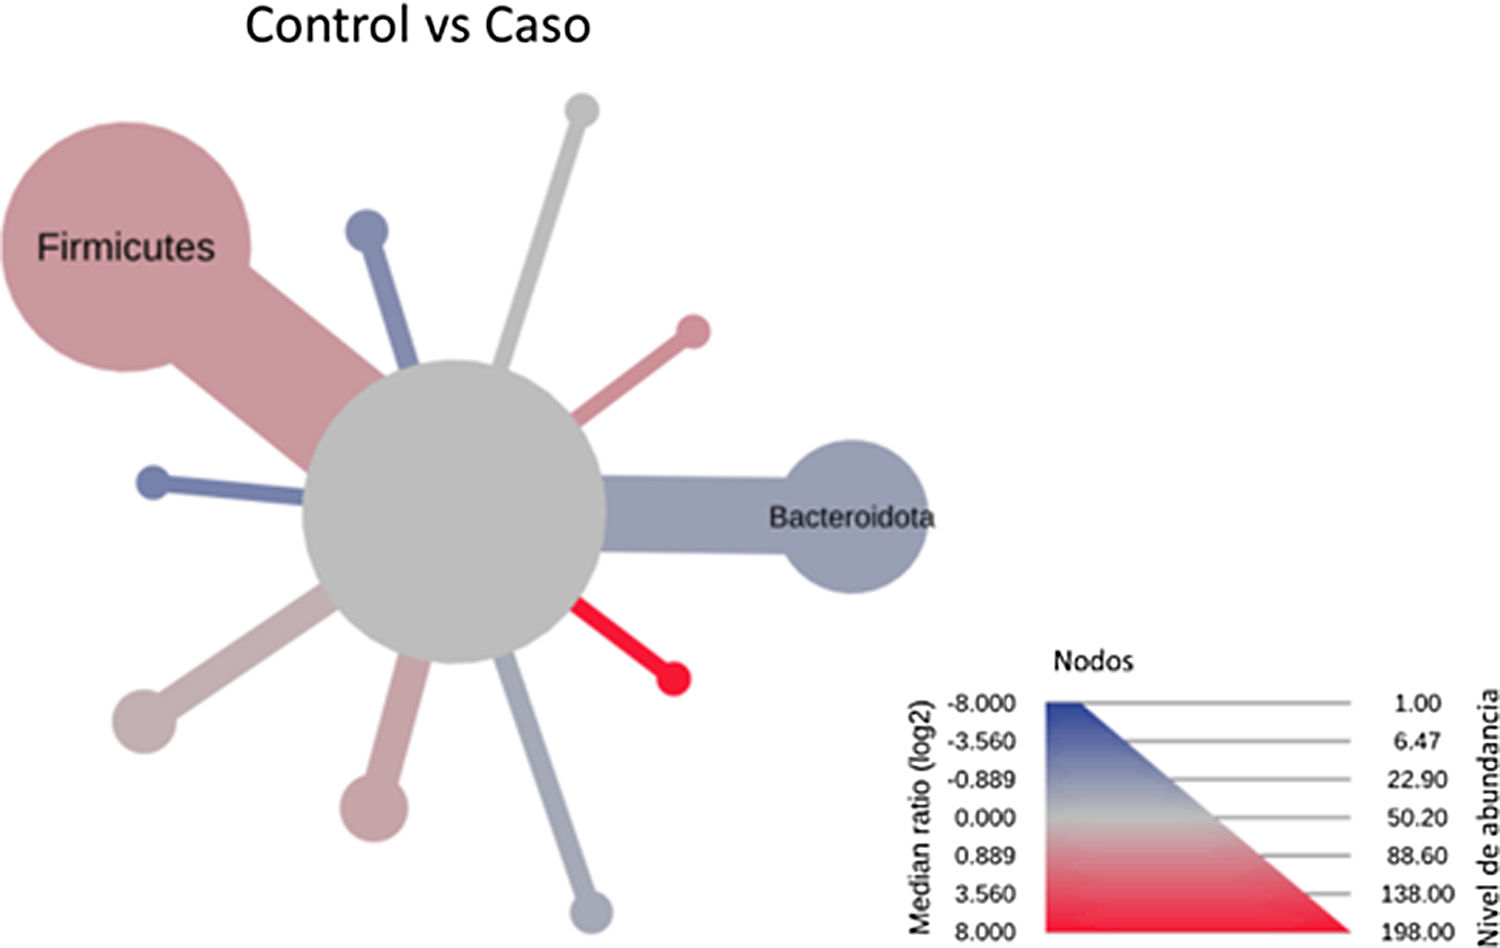
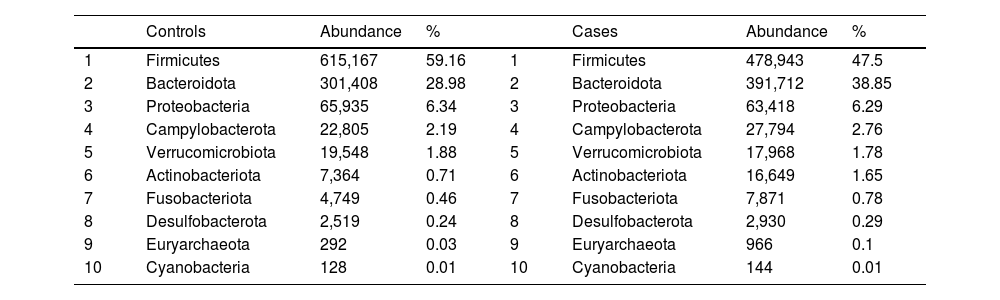
After performing the abundance significance analysis of the intestinal bacterial community, the bacterial groups Firmicutes, Bacteroidota, Proteobacteria, and Campylobacterota were found to be the four dominant phyla in all samples at the phylum level (Fig. 2). The mean Firmicutes/Bacteroidetes ratios are 2.041 and 1.223 in the control and case groups, respectively. The remaining phyla that constitute the total abundance of the microbial community in both groups are listed in Table 3. Significant differences were detected between Firmicutes (log 2 median ratio −.4021 and median difference .1452; p<.005) and Bacteroidetes (log 2 median ratio −.4743 and median difference −.1151; p<.002) between the control and the pathological group (Fig. 3).

Distribution of total and relative abundance (%) of taxa at the phylum level between both comparison groups.
| Controls | Abundance | % | Cases | Abundance | % | ||
|---|---|---|---|---|---|---|---|
| 1 | Firmicutes | 615,167 | 59.16 | 1 | Firmicutes | 478,943 | 47.5 |
| 2 | Bacteroidota | 301,408 | 28.98 | 2 | Bacteroidota | 391,712 | 38.85 |
| 3 | Proteobacteria | 65,935 | 6.34 | 3 | Proteobacteria | 63,418 | 6.29 |
| 4 | Campylobacterota | 22,805 | 2.19 | 4 | Campylobacterota | 27,794 | 2.76 |
| 5 | Verrucomicrobiota | 19,548 | 1.88 | 5 | Verrucomicrobiota | 17,968 | 1.78 |
| 6 | Actinobacteriota | 7,364 | 0.71 | 6 | Actinobacteriota | 16,649 | 1.65 |
| 7 | Fusobacteriota | 4,749 | 0.46 | 7 | Fusobacteriota | 7,871 | 0.78 |
| 8 | Desulfobacterota | 2,519 | 0.24 | 8 | Desulfobacterota | 2,930 | 0.29 |
| 9 | Euryarchaeota | 292 | 0.03 | 9 | Euryarchaeota | 966 | 0.1 |
| 10 | Cyanobacteria | 128 | 0.01 | 10 | Cyanobacteria | 144 | 0.01 |
 and statistically (using the non-parametric Wilcoxon rank sum test) taxonomic differences between microbial communities. The size and colour of nodes and edges are related to the abundance of organisms according to phylum. The colour of each taxon represents the log-2 ratio of the median proportions of readings observed in each study group. Only bacterial phyla showing significant differences determined by a Wilcox rank sum test followed by a Benjamini–Hochberg correction (FDR) for multiple comparisons are indicated.")
Heat tree that makes it possible to represent quantitatively (using median abundance) and statistically (using the non-parametric Wilcoxon rank sum test) taxonomic differences between microbial communities. The size and colour of nodes and edges are related to the abundance of organisms according to phylum. The colour of each taxon represents the log-2 ratio of the median proportions of readings observed in each study group. Only bacterial phyla showing significant differences determined by a Wilcox rank sum test followed by a Benjamini–Hochberg correction (FDR) for multiple comparisons are indicated.
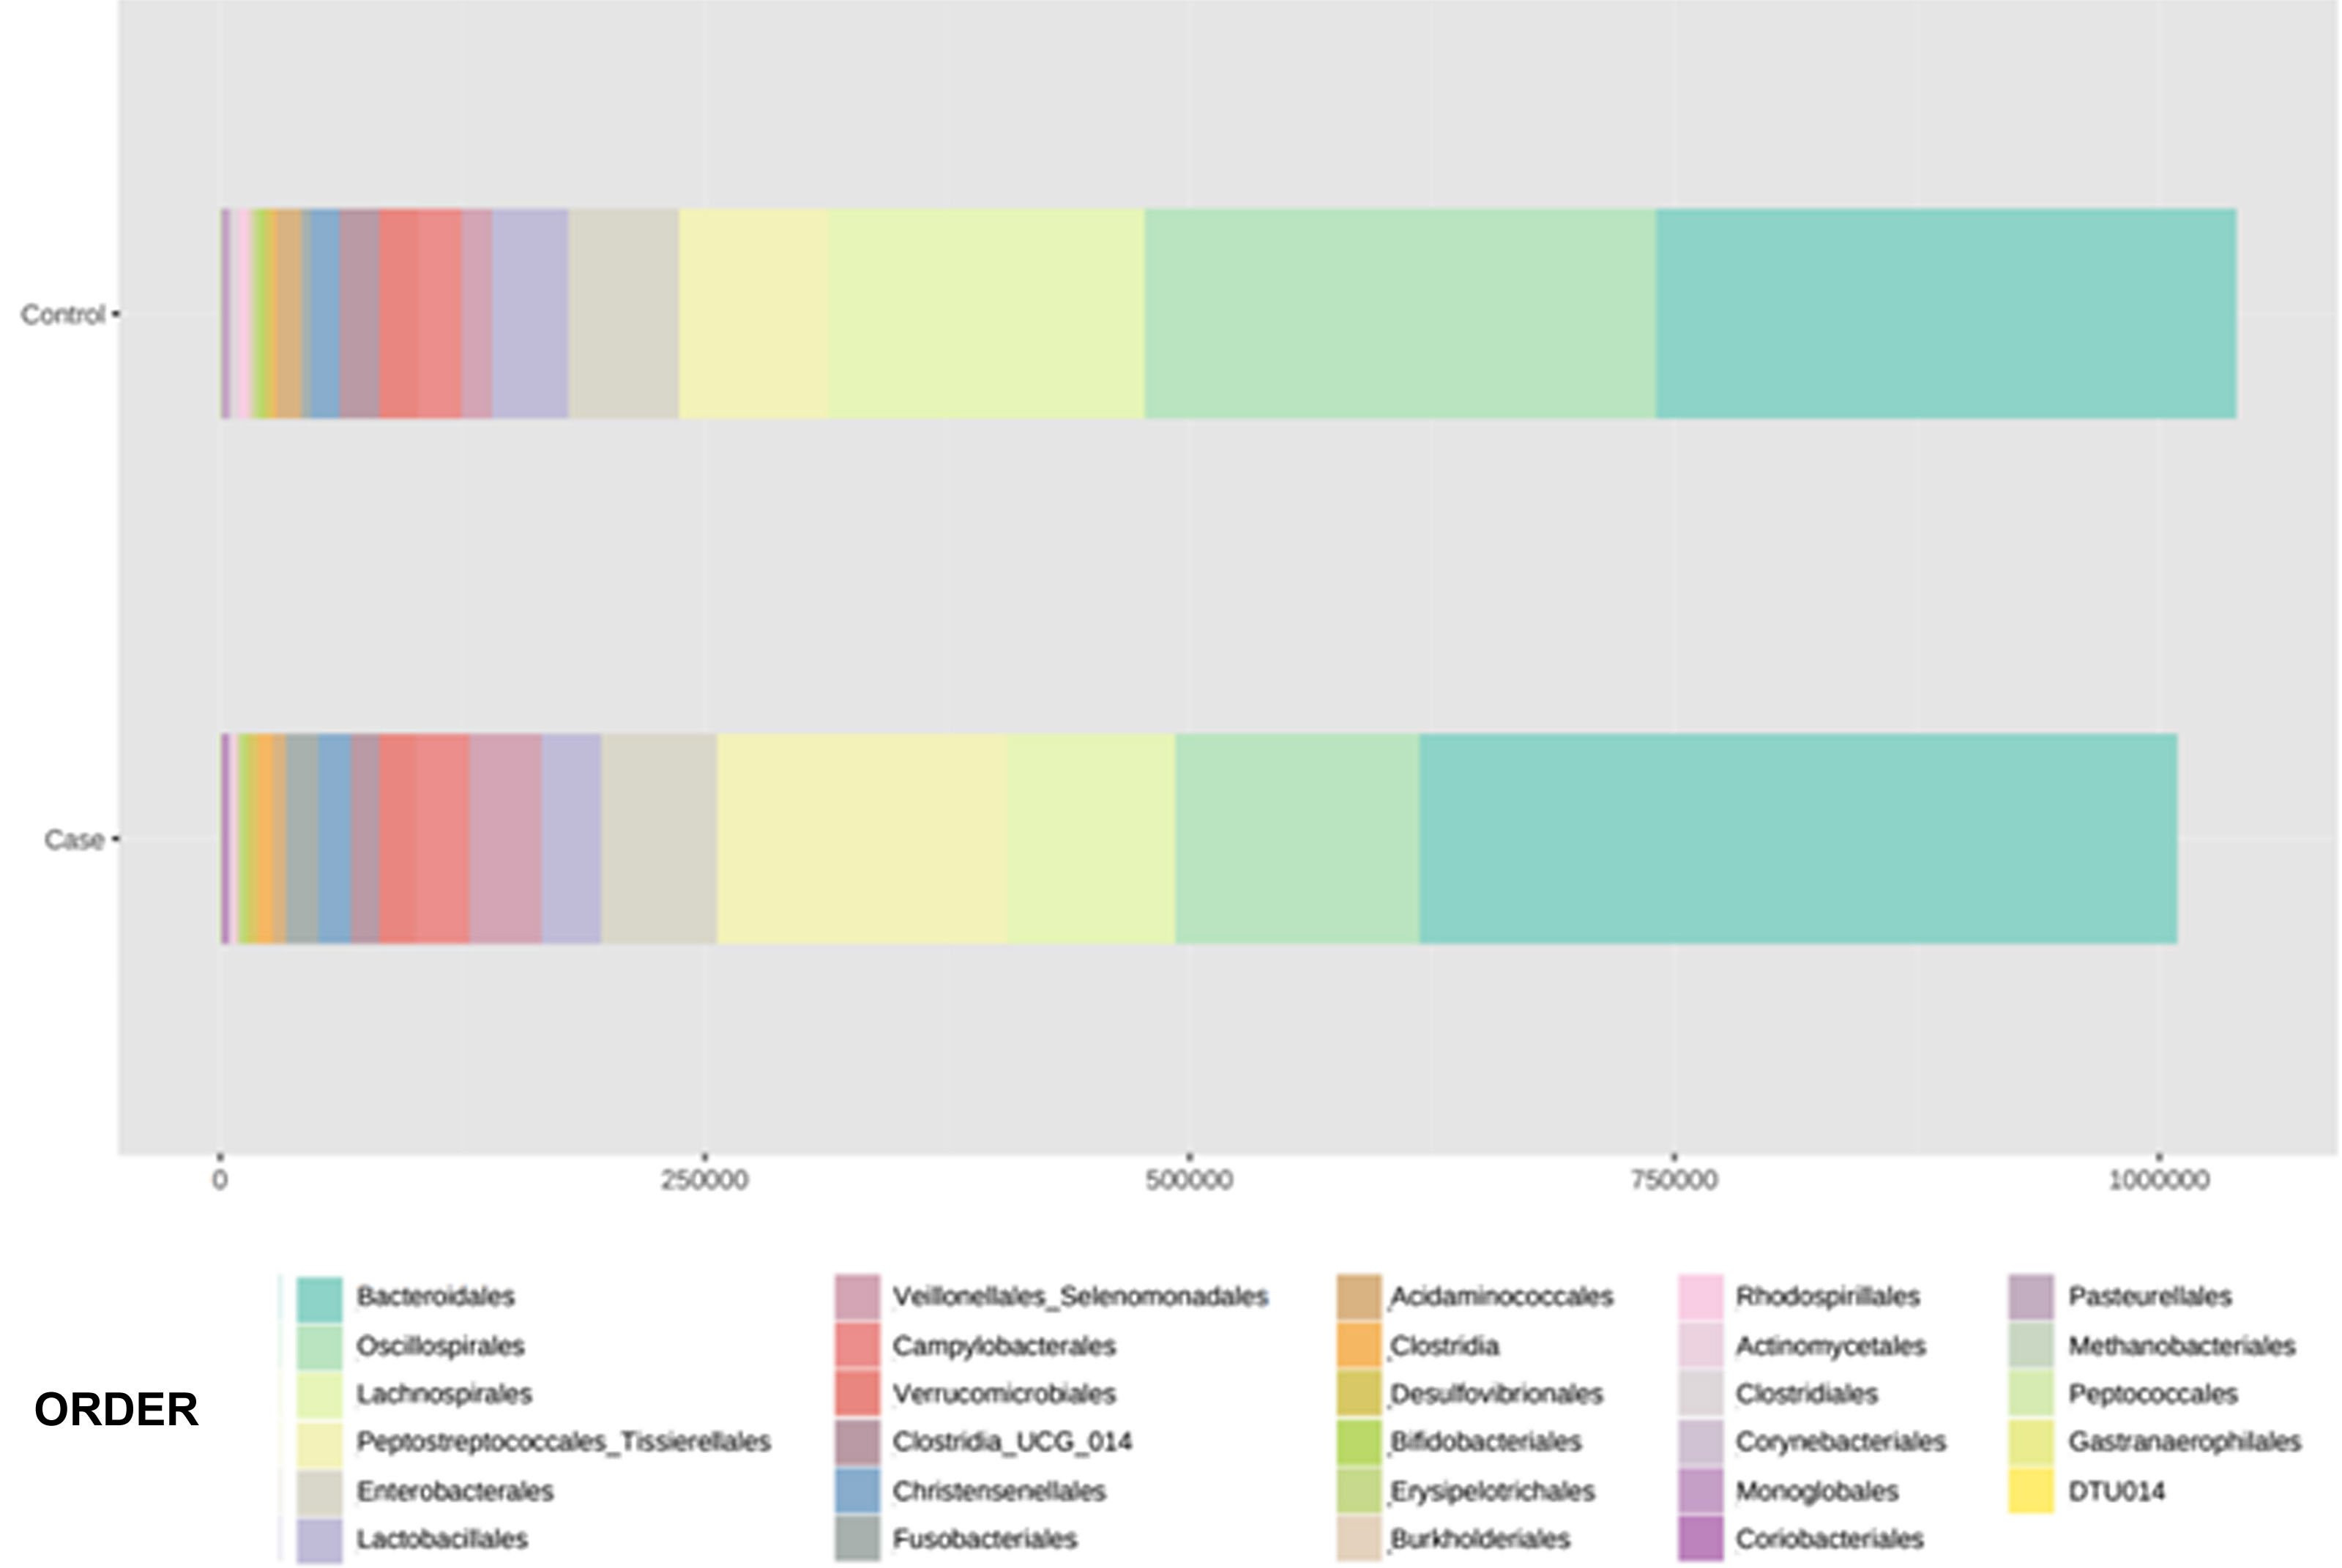
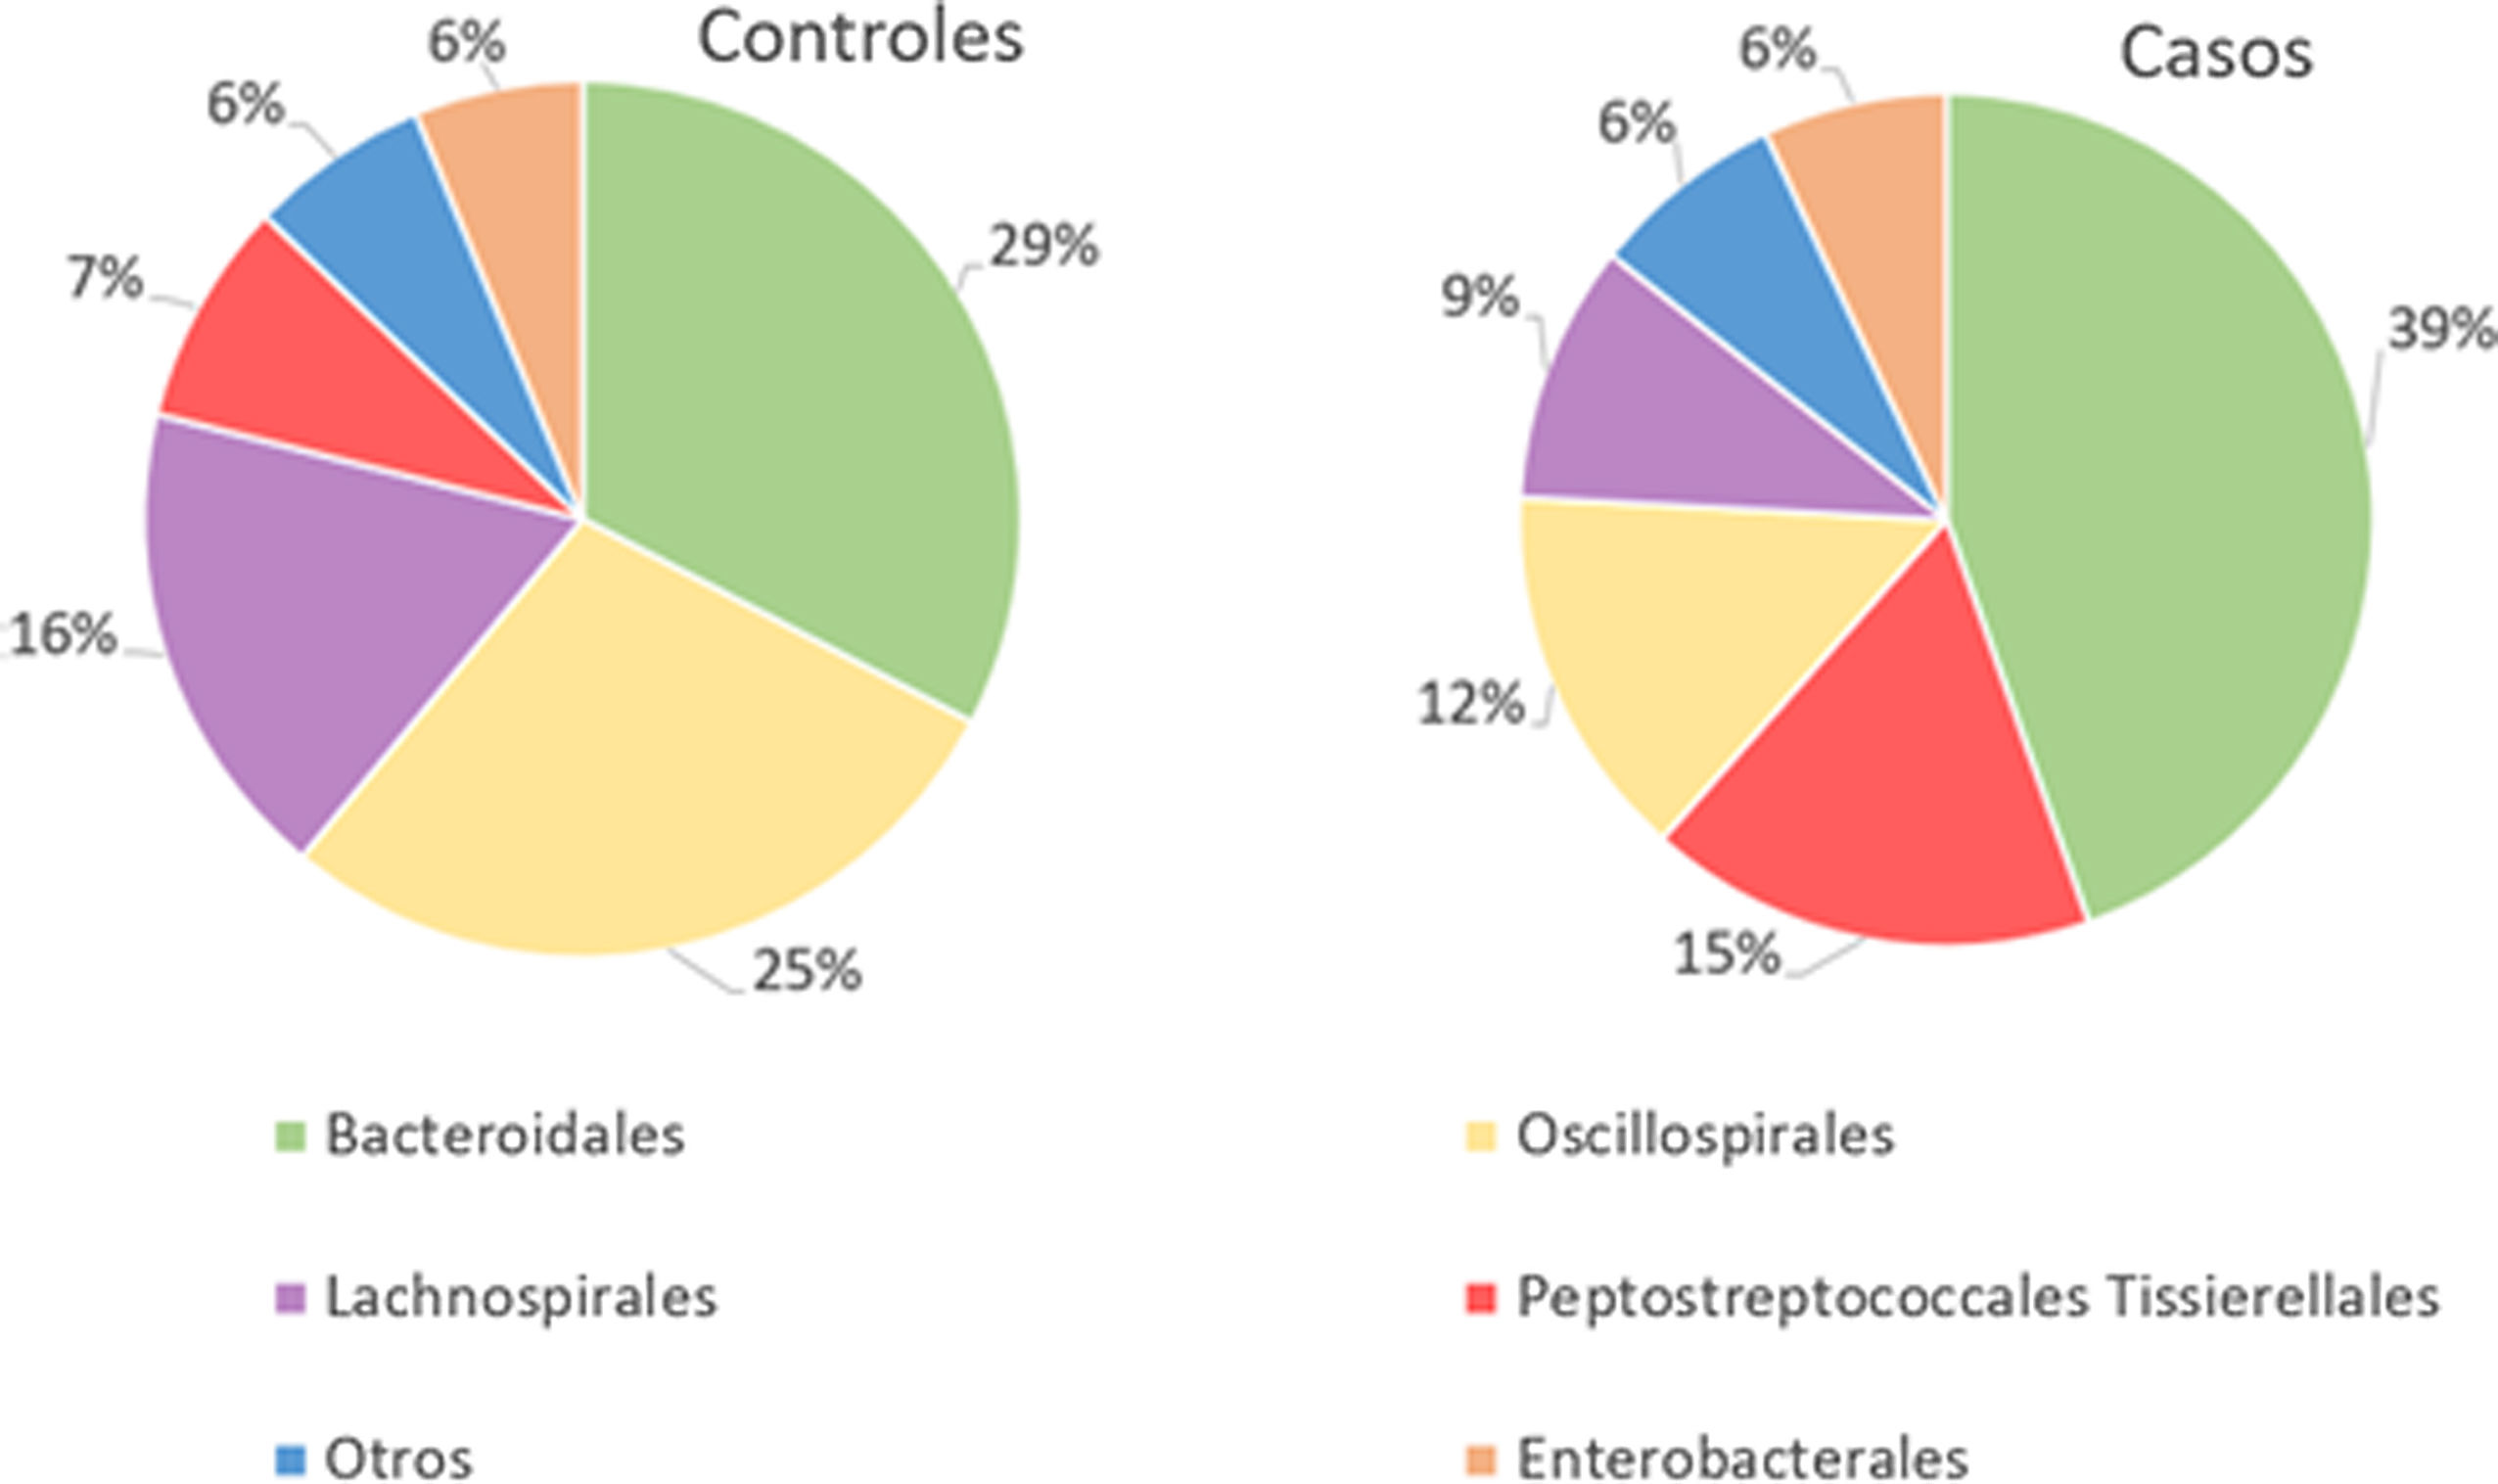
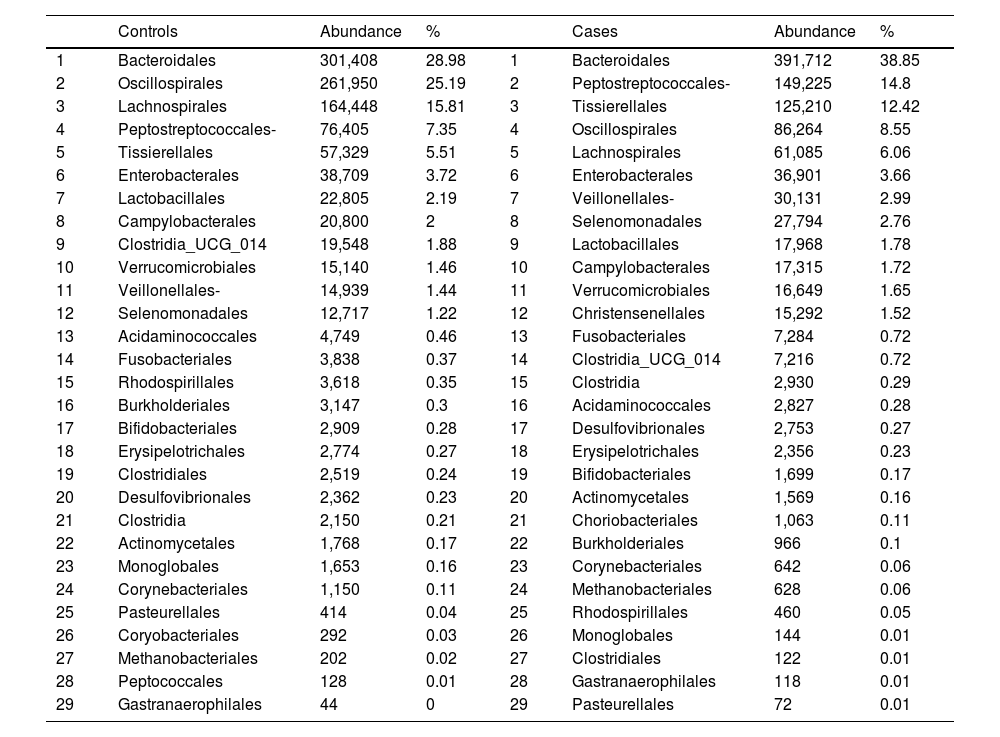
With regard to the order level, a total of 29 different orders of bacteria were detected (Fig. 4). The abundance of all microorganisms and their percentage is reflected in Table 4. Bacteroidales account for the largest proportion in all samples and five orders represent the most prevalent bacterial groups. Of these, only three orders (Bacteroidales, Oscillospirales, and Lachnospirales) contribute to more than two thirds of the bacterial community in the control group. In the pathological group, the three orders Bacteroidales, Peptostreptococcales-Tissierellales, and Oscillospirales make up more than 60% of the sample (Fig. 5).

Distribution of total and relative abundance (%) of taxa at the order level between both comparison groups.
| Controls | Abundance | % | Cases | Abundance | % | ||
|---|---|---|---|---|---|---|---|
| 1 | Bacteroidales | 301,408 | 28.98 | 1 | Bacteroidales | 391,712 | 38.85 |
| 2 | Oscillospirales | 261,950 | 25.19 | 2 | Peptostreptococcales- | 149,225 | 14.8 |
| 3 | Lachnospirales | 164,448 | 15.81 | 3 | Tissierellales | 125,210 | 12.42 |
| 4 | Peptostreptococcales- | 76,405 | 7.35 | 4 | Oscillospirales | 86,264 | 8.55 |
| 5 | Tissierellales | 57,329 | 5.51 | 5 | Lachnospirales | 61,085 | 6.06 |
| 6 | Enterobacterales | 38,709 | 3.72 | 6 | Enterobacterales | 36,901 | 3.66 |
| 7 | Lactobacillales | 22,805 | 2.19 | 7 | Veillonellales- | 30,131 | 2.99 |
| 8 | Campylobacterales | 20,800 | 2 | 8 | Selenomonadales | 27,794 | 2.76 |
| 9 | Clostridia_UCG_014 | 19,548 | 1.88 | 9 | Lactobacillales | 17,968 | 1.78 |
| 10 | Verrucomicrobiales | 15,140 | 1.46 | 10 | Campylobacterales | 17,315 | 1.72 |
| 11 | Veillonellales- | 14,939 | 1.44 | 11 | Verrucomicrobiales | 16,649 | 1.65 |
| 12 | Selenomonadales | 12,717 | 1.22 | 12 | Christensenellales | 15,292 | 1.52 |
| 13 | Acidaminococcales | 4,749 | 0.46 | 13 | Fusobacteriales | 7,284 | 0.72 |
| 14 | Fusobacteriales | 3,838 | 0.37 | 14 | Clostridia_UCG_014 | 7,216 | 0.72 |
| 15 | Rhodospirillales | 3,618 | 0.35 | 15 | Clostridia | 2,930 | 0.29 |
| 16 | Burkholderiales | 3,147 | 0.3 | 16 | Acidaminococcales | 2,827 | 0.28 |
| 17 | Bifidobacteriales | 2,909 | 0.28 | 17 | Desulfovibrionales | 2,753 | 0.27 |
| 18 | Erysipelotrichales | 2,774 | 0.27 | 18 | Erysipelotrichales | 2,356 | 0.23 |
| 19 | Clostridiales | 2,519 | 0.24 | 19 | Bifidobacteriales | 1,699 | 0.17 |
| 20 | Desulfovibrionales | 2,362 | 0.23 | 20 | Actinomycetales | 1,569 | 0.16 |
| 21 | Clostridia | 2,150 | 0.21 | 21 | Choriobacteriales | 1,063 | 0.11 |
| 22 | Actinomycetales | 1,768 | 0.17 | 22 | Burkholderiales | 966 | 0.1 |
| 23 | Monoglobales | 1,653 | 0.16 | 23 | Corynebacteriales | 642 | 0.06 |
| 24 | Corynebacteriales | 1,150 | 0.11 | 24 | Methanobacteriales | 628 | 0.06 |
| 25 | Pasteurellales | 414 | 0.04 | 25 | Rhodospirillales | 460 | 0.05 |
| 26 | Coryobacteriales | 292 | 0.03 | 26 | Monoglobales | 144 | 0.01 |
| 27 | Methanobacteriales | 202 | 0.02 | 27 | Clostridiales | 122 | 0.01 |
| 28 | Peptococcales | 128 | 0.01 | 28 | Gastranaerophilales | 118 | 0.01 |
| 29 | Gastranaerophilales | 44 | 0 | 29 | Pasteurellales | 72 | 0.01 |

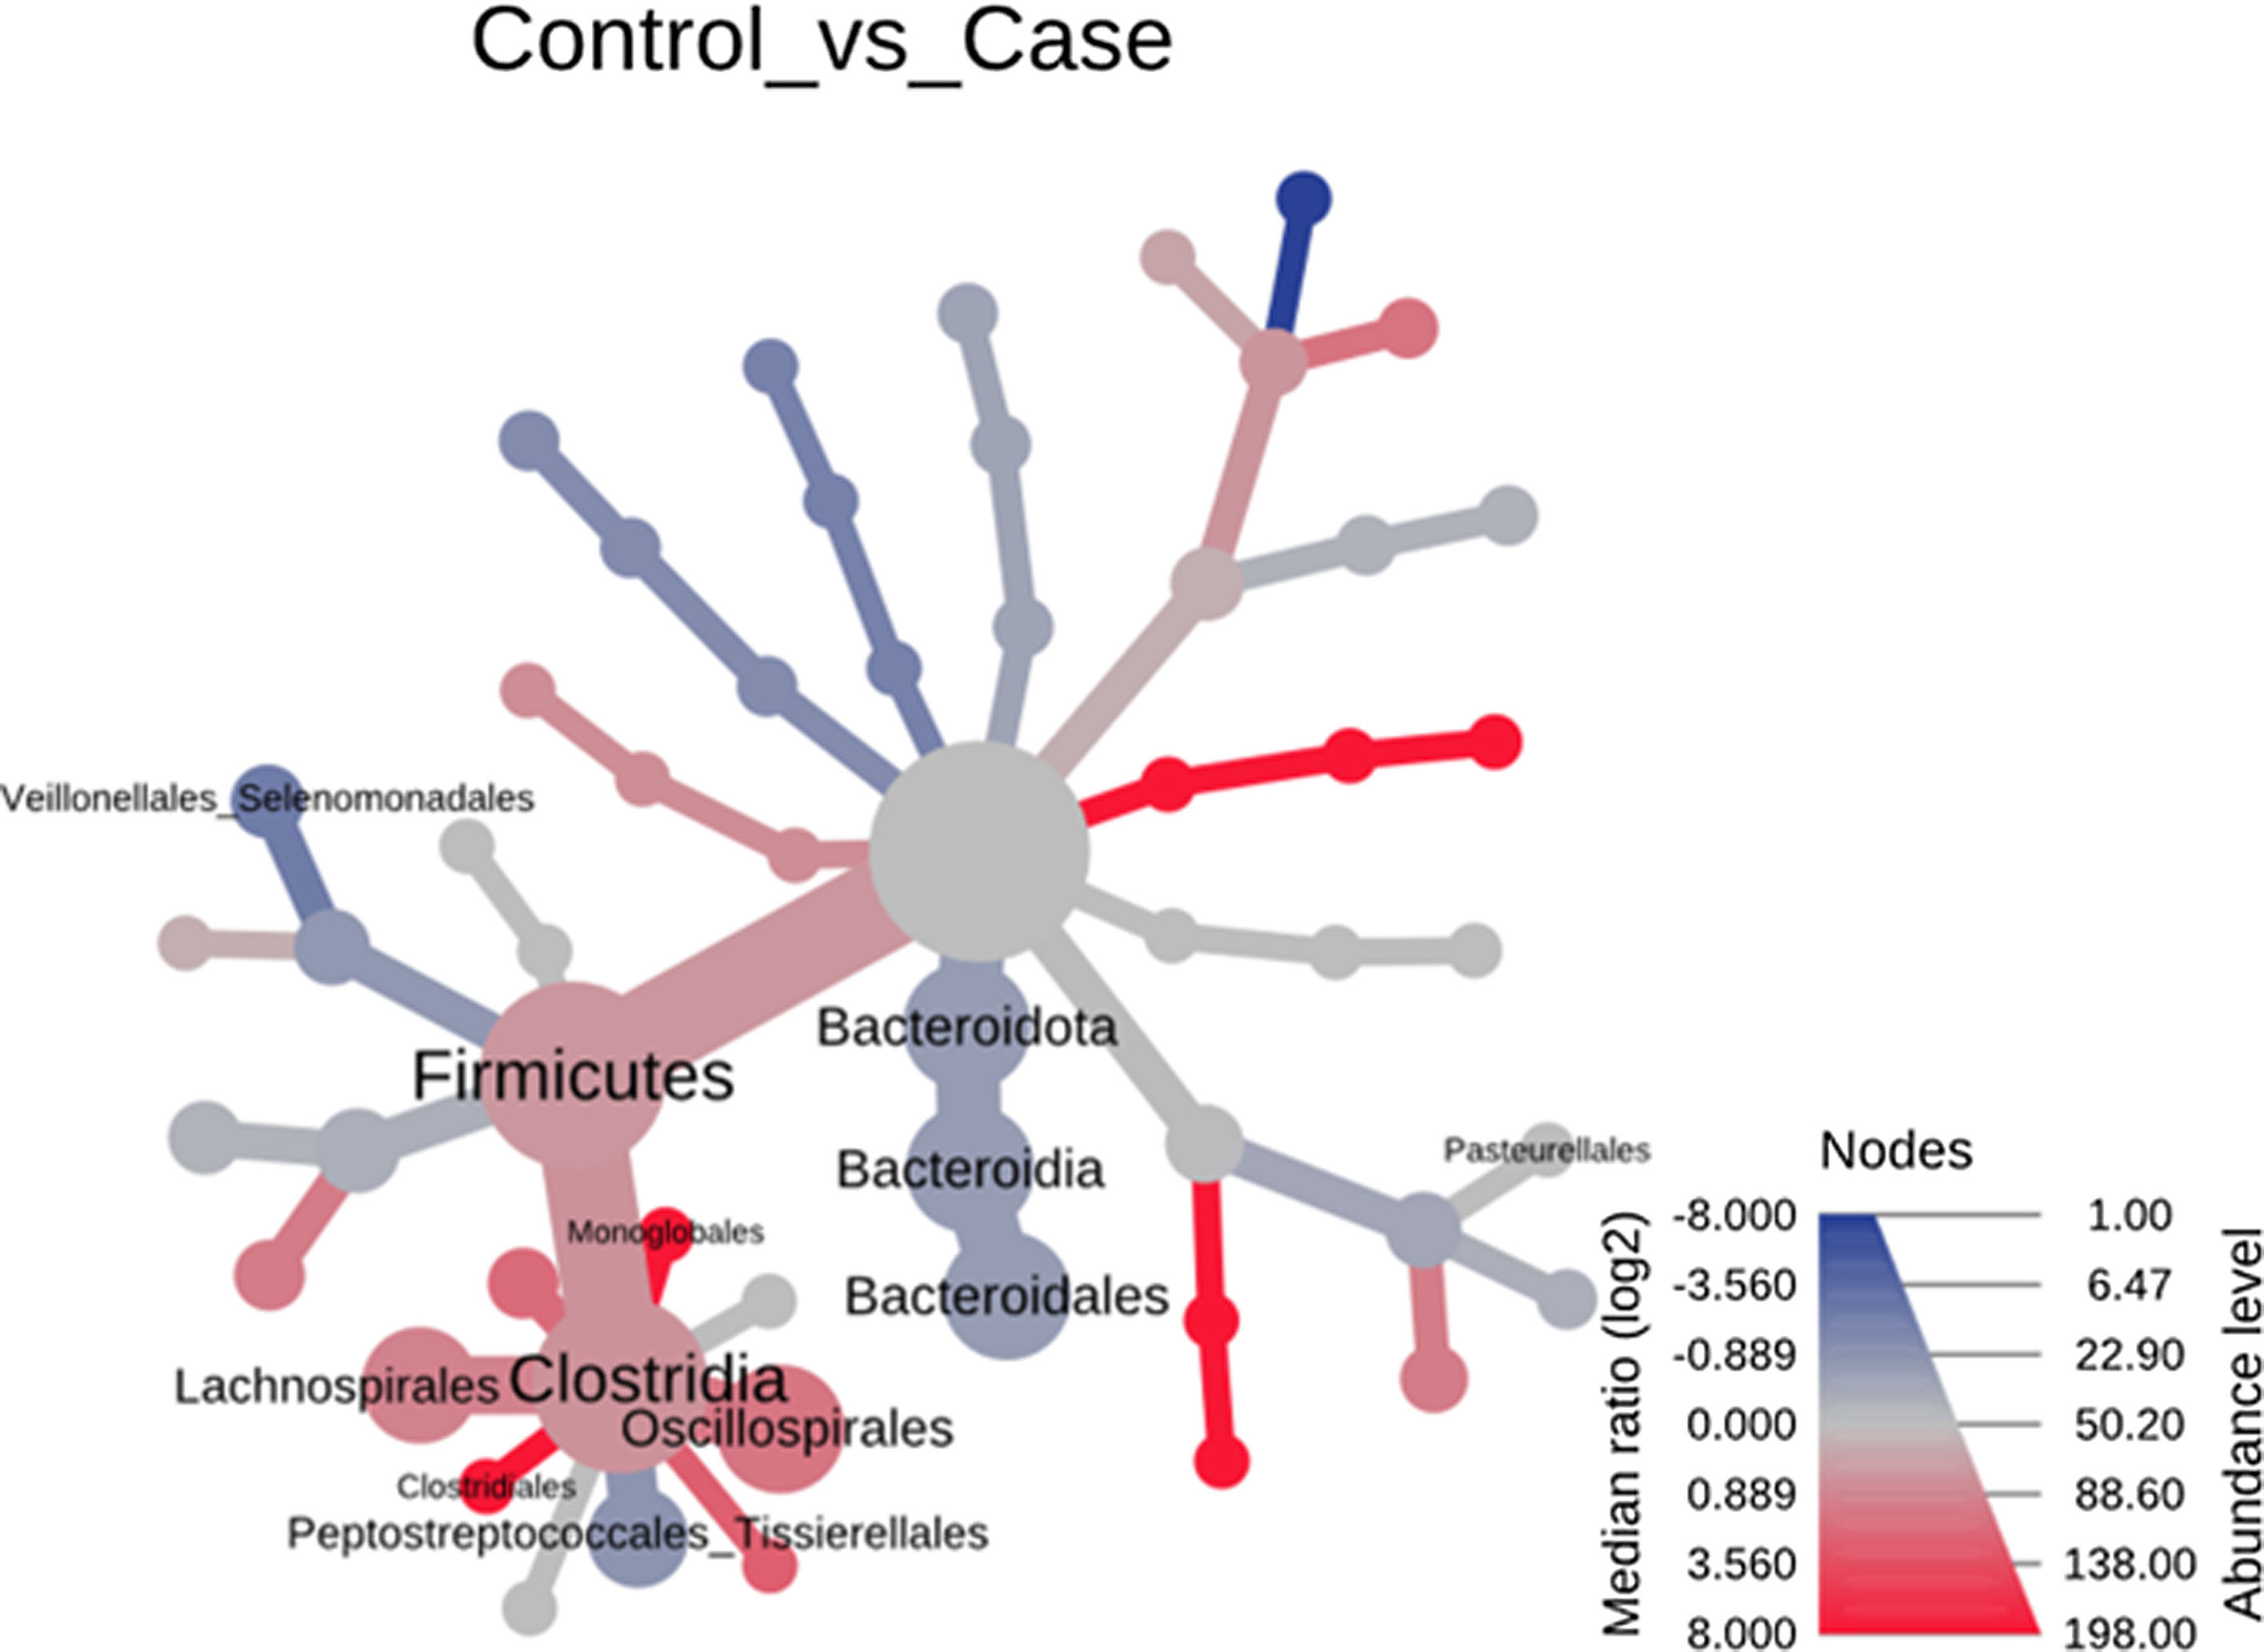
Significant differences were observed for the orders Oscillospirales (log 2 median ratio 1.4530 and median difference .1717; p<.001), Lachnospirales (log 2 median ratio .9422 and median difference .0734; p<.001), Bacteroidales (log 2 median ratio −.4743 and median difference −.1151; p<.001), and Peptostreptococcales-Tissierellales (log 2 median ratio −.9226 and median difference −.0599; p<.005) between the control and the pathological group (Fig. 6).
 and statistically (using the non-parametric Wilcoxon rank sum test) the taxonomic differences between microbial communities. The size and colour of nodes and edges are related to the abundance of organisms by order. The colour of each taxon represents the log-2 ratio of the median proportions of readings observed in each study group. Only bacterial orders showing significant differences determined by a Wilcox rank sum test followed by a Benjamini–Hochberg correction (FDR) for multiple comparisons are indicated.")
Heat tree that makes it possible to represent quantitatively (using median abundance) and statistically (using the non-parametric Wilcoxon rank sum test) the taxonomic differences between microbial communities. The size and colour of nodes and edges are related to the abundance of organisms by order. The colour of each taxon represents the log-2 ratio of the median proportions of readings observed in each study group. Only bacterial orders showing significant differences determined by a Wilcox rank sum test followed by a Benjamini–Hochberg correction (FDR) for multiple comparisons are indicated.
The human microbiome constitutes the second genome of our body and can act on the immune system (osteoimmunology),5 hormonal pathways, and the production of bacterial metabolites that act as signals to bone cells.18 Advances in genetic sequencing have made it possible to analyse bacterial samples that previously could not be cultured by conventional laboratory methods. Several experimental studies in mice have examined the impact of the microbiome on both bone structure and bone density.7,19 This study is the first to investigate the composition and diversity of the GM in subjects who have suffered a fragility fracture of the hip relative to healthy controls. The findings indicate that both gut bacterial structure and diversity are altered in fragility hip fracture patients. These findings contribute further evidence of the relationship between bone health and GM, and lend support to the existence of a microbial population that may predispose to osteopenia and the occurrence of fragility hip fractures.
In the hip fracture group, the proportion of Firmicutes phyla decreased and Bacteroidetes increased, with significant differences observed in both phyla (p<.05) relative to the control group. Approximately 60% of gut bacteria are considered to belong to the phyla Bacteroidetes and Firmicutes20 and maintaining a balanced ratio between the two phyla has been associated with maintaining homeostasis. In inflammatory bowel disease, the F/B ratio has been proven to be decreased.21 Certain bacteria belonging to the Firmicutes group play a key role in host nutrition and metabolism through the synthesis of short-chain fatty acids (SCFA), which, among other properties, act as anti-inflammatory factors. In contrast, components of certain bacteria of the phylum Bacteroidetes, such as lipopolysaccharides and flagellin, enhance immune reactions by synthesising cytokines.22 Postmenopausal osteoporosis presents numerous phenomena which link it to an inflammatory disease (increase in cytokines – IL-1, IL-6, IL-17, and TNF-α, and RANKL),23 in such a way that this estrogen deficit establishes a chronic inflammatory state, leading to bone loss. Moreover, ageing is accompanied by an increased inflammatory response that induces an increased sensitivity of the host's intestinal immune system to microorganism-associated molecular patterns.24 In this way, an intestinal inflammatory feedback loop is established which may explain why changes in the composition of the GM, such as those presented here, may be related to the genesis and/or progression of diseases such as osteoporosis.
Of the 29 orders of bacteria identified, five had proportions greater than 5%. The order Bacteroidales was the most abundant and a significantly higher percentage (p<.001) was noted in patients with fractures compared to controls. However, the increase in the proportion of Peptostreptococcales-Tissierellales bacteria (p<.005), as well as the decrease in the order Lachnospirales (p<.001) in the pathological group, is also worth highlighting. These results are particularly relevant inasmuch as the bacteria pertaining to the order Lachnospirales are associated with increased SCFA butyrate production.25 SCFA are produced by GM through fermentation of prebiotics and plant fibre that our bodies cannot digest, and among other characteristics, they can increase the solubility and absorption of calcium through acidification of the intestinal lumen.18 In addition, butyrate has been revealed to be capable of promoting bone formation and inhibiting osteoclastogenesis by suppressing the signalling pathway of the receptor activator of nuclear factor kB (RANKL), which, in turn, is known to induce the synthesis of pro-inflammatory cytokines.26 By the same token, SCFA may indirectly affect osteoclastogenesis by regulating the number and function of Treg lymphocytes in the colon.27 Therefore, the changes observed at this taxonomic level, especially the increase in Bacteroidales and decrease in Lachnospirales, indicate that an association does exist with reduced bone mass.
Microbiota diversity analysis is an important tool with which to quantify the relative richness and bacterial component of a given community. In this study, alpha diversity revealed elevated class level estimators in the hip fracture group. These results are consistent with those found in the only study that has analysed GM diversity in patients with reduced bone mass28 and endorses the idea that rich GM diversity may be related to bone loss, which in some cases has been linked to loss of intestinal homeostasis.
Despite drawing relevant conclusions, we surmise that this study has several limitations. While the sample size may appear to be small, it should be emphasised that it is the only study to establish an association between GM and patients who have suffered a hip fracture and, in addition, within the paucity of literature that examines the relationship between GM and osteoporosis in humans, it is the one that has recorded the most subjects. The present study was designed as a case–control study, so that the results can establish an association, but not causality. Nevertheless, a case–control study approach is the most suitable for an initial approach to researching an association and may open the door to cohort studies that confirm the hypothesis put forward by our study. Additionally, it is possible that, due to the nature of the study design (case–control), the association effects are magnified in patients admitted to the hospital (Berkson bias). Despite this, we believe that the impact of this bias on hip fracture will be minimal, since there is no grading of the intensity of the disease (hip fracture) in these patients, and it is unlikely that a hip fracture will have the symptomatic severity to preclude admission. Regardless of having followed a design with restrictive inclusion and exclusion criteria, we have found that the discrepancy in age may be a limitation when interpreting our results. However, given the large inter-individual differences in GM in the elderly, it is difficult to define what is typical GM in the elderly or to establish at which age intervals substantial changes in bacterial abundance occur.29 Finally, we have not taken into account other factors that may interfere with GM such as diet, medication other than antibiotics, or lifestyle, nor have we analysed taxonomic levels below the order of bacteria. Notwithstanding, we believe that, on the basis of the results obtained, this work can serve as a starting point to develop future studies that delve deeper and provide more evidence on this subject.
ConclusionOur results provide a description of the changes in the composition and diversity of GM that are associated with patients who have suffered a hip fracture due to bone fragility. In this way, we have identified bacterial groups at different taxonomic levels that may shed new light on the possible mechanisms by which GM affects bone health and lay the groundwork for the search for new microbial biomarkers. It is possible that altered microbiota may be revealed as a prognostic marker in the appearance of hip fractures and that modification of the microbiota by means of probiotics may be defined as a strategy by which to lower the risk of fragility fractures. Further studies are needed following this line of work/research, in order to uncover new evidence that can be transposed to our routine clinical practice.
Level of evidenceLevel of evidence iii.
FundingThis study has been funded by the Grant for Research Projects in Orthopaedic Surgery and Traumatology, 2019, endowed with €12,500. The ID of the grant is the author J. Doménech Fernández.
Conflict of interestsThe authors have no conflict of interests to declare
