
The upward of the Spanish real estate sector (2000–2007) caused the excessive growth of many companies mainly through acquisitions. This study aimed to identify behaviour patterns for takeover bids in the Spanish real estate industry, which was particularly hard hit by the last financial crisis. Considering that in bubble growing/burst periods, economic and financial variables are considered the most useful measures (market variables can have reliability problems), a set of 20 economic and financial variables was analysed, along with their relationship with listed companies’ participation in this type of operations over the period 2000–2012. Both acquiring and target companies were included in the 354 cases studied here.
A two-stage methodology was used. Firstly, the principal component method was applied to identify the variables with greatest explanatory capacity. That was followed by the construction of a decision tree-based predictive model, more specifically a CHAID, which categorised the set of companies analysed to establish behaviour patterns.
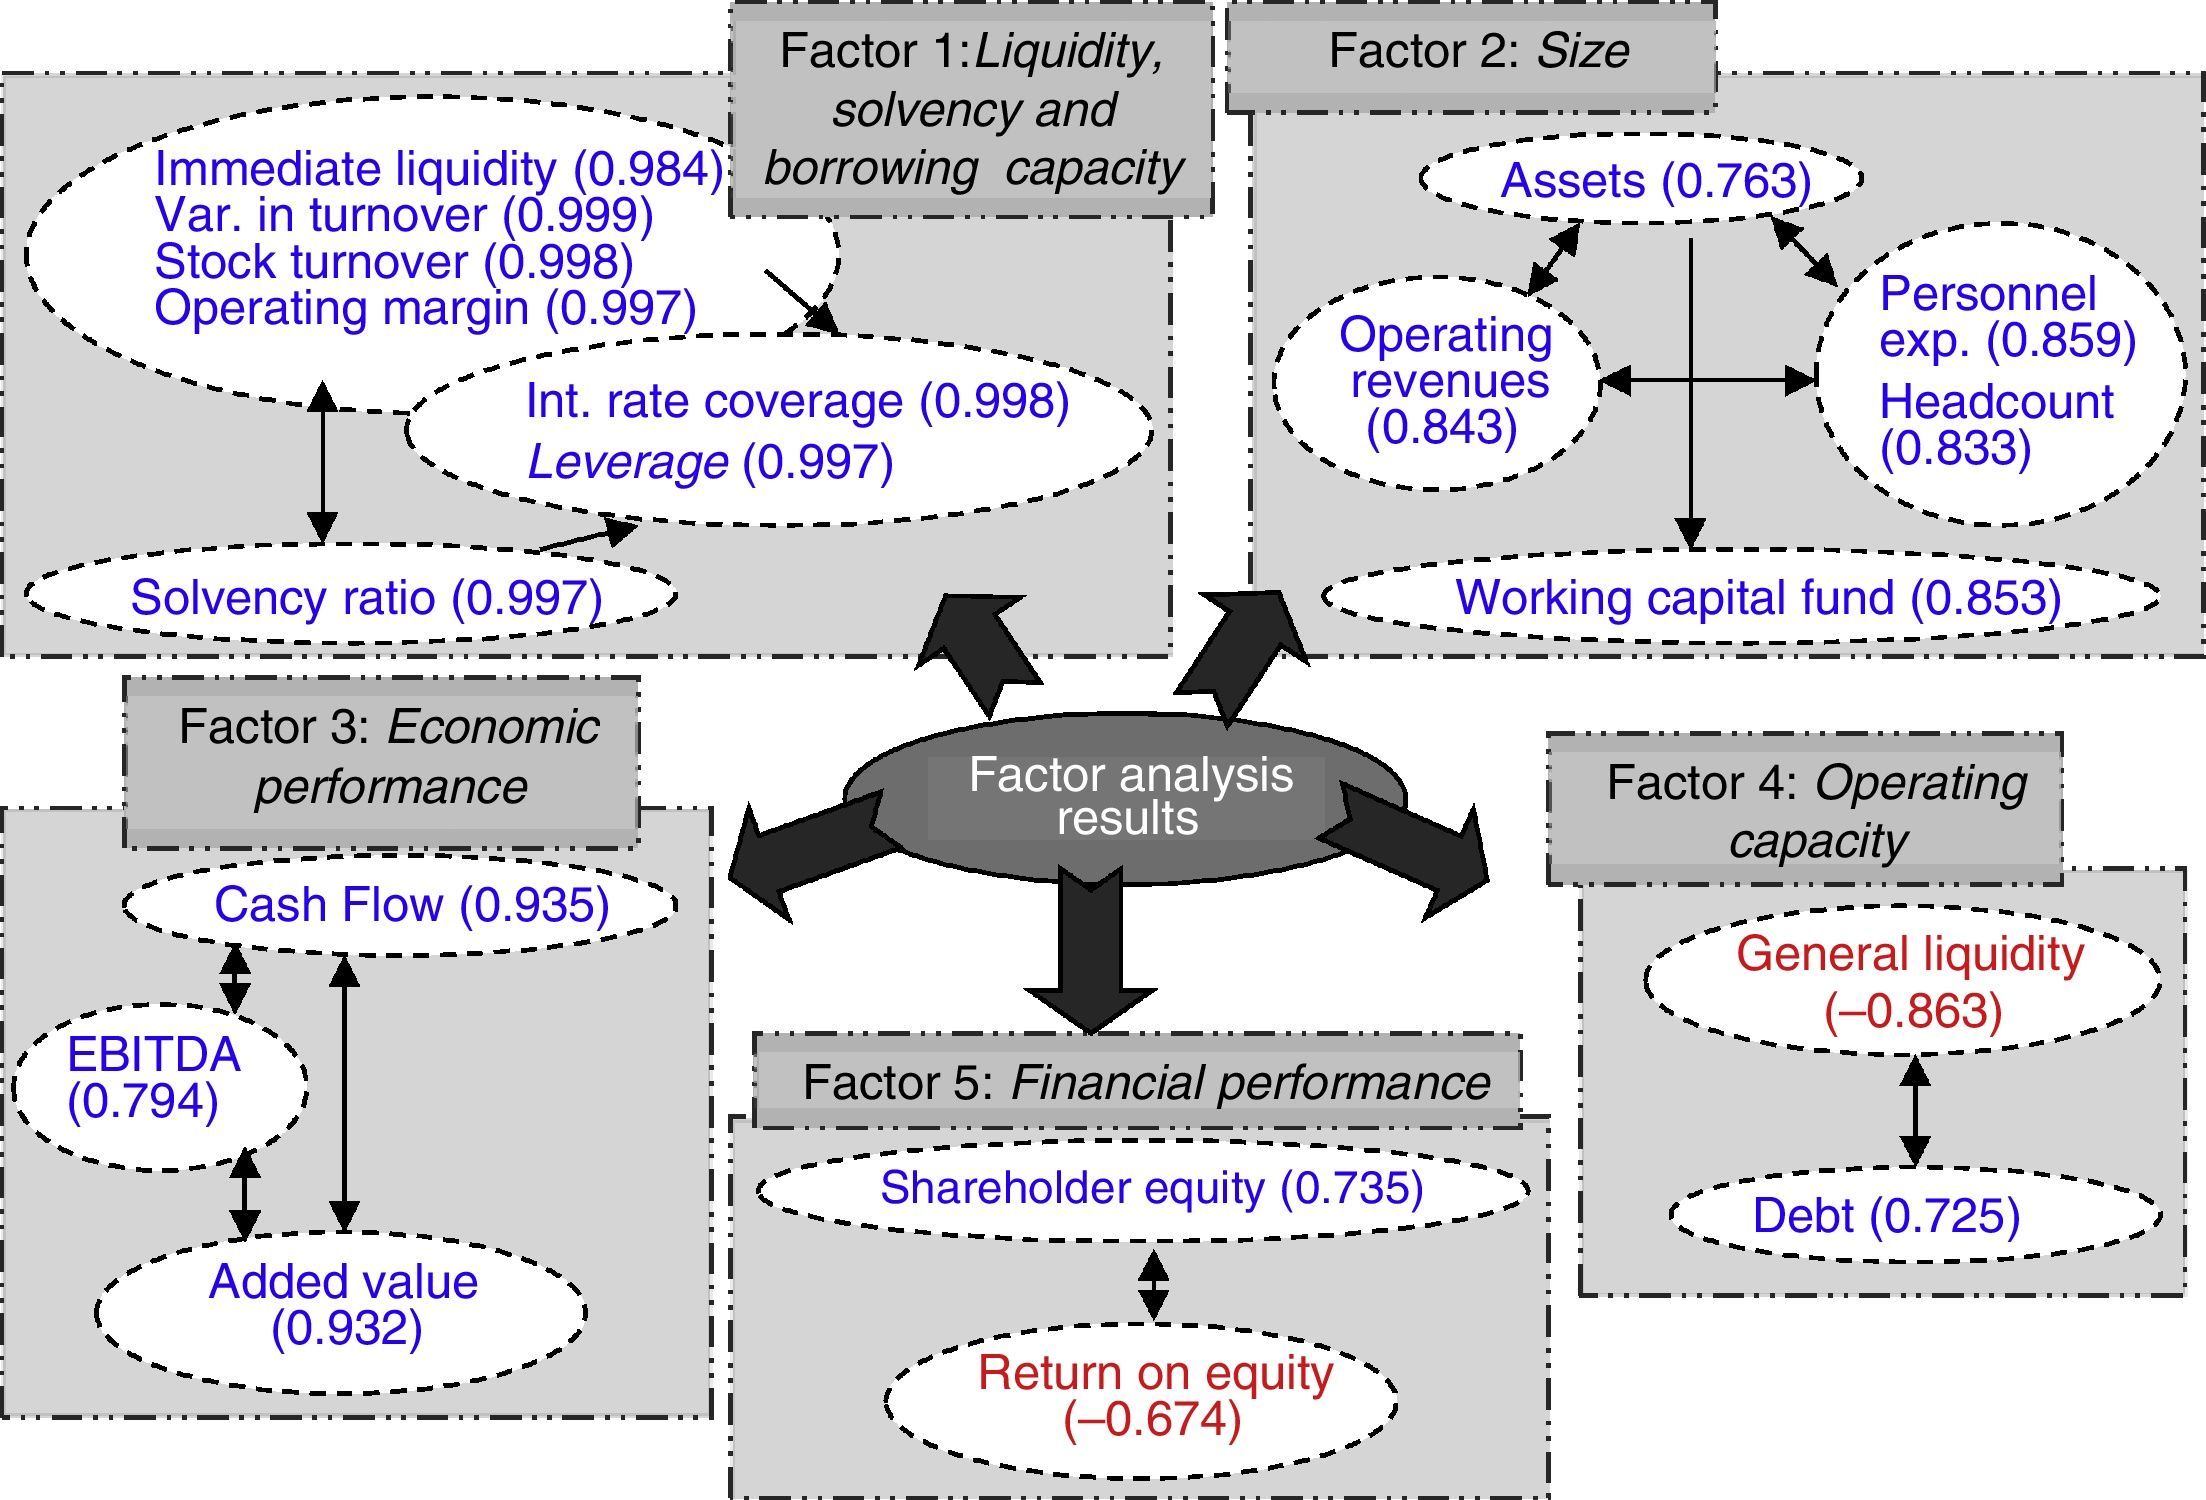
The findings of this study show that the five principal components found to afford the greatest explanatory capacity were: (a) liquidity, solvency and borrowing capacity; (b) size; (c) economic performance; (d) operating capacity; and (e) financial performance. Taken together, the first two components explained 70% of dependent variable behaviour, primarily relative to buyers.
Overall, the model proposed explained on the order of 80% of dependent variable behaviour. The percentage not explained by the model was attributed essentially to strategic issues, financial speculation and private interests, among other factors present in decision-making.
La tendencia alcista del sector inmobiliario español (2000-2007) provocó el crecimiento excesivo de muchas empresas, principalmente mediante adquisiciones. Esta investigación pretende identificar patrones de comportamiento para la realización de OPAs en el sector inmobiliario español, particularmente castigado por la crisis financiera. Para ello, se ha analizado un conjunto de 20 variables económico-financieras y su relación con la participación de las compañías cotizadas del sector en este tipo de operaciones, para un total de 354 casos para el periodo 2000-2012, como adquirentes y adquiridas.
Para ello, se ha empleado una metodología en dos etapas. En primer lugar, se ha aplicado el Método de Componentes Principales para acotar las variables de estudio consideradas con mayor capacidad explicativa. En segundo lugar, se ha construido un modelo predictivo basado en árboles de decisión, concretamente de tipo CHAID, que permite categorizar el conjunto de empresas analizadas y discriminar patrones de comportamiento.
Los cinco factores principales con mayor capacidad explicativa son: a)liquidez, solvencia y capacidad de endeudamiento; b)tamaño; c)resultado económico; d)capacidad operativa, y e)resultado financiero. De hecho, los dos primeros explican conjuntamente en torno al 70% de la variable dependiente, considerando principalmente a empresas adquirentes.
El modelo propuesto cuenta con un nivel de explicación global cercano al 80%. El porcentaje restante que no explica el modelo responde fundamentalmente a cuestiones de tipo estratégico, de especulación financiera e intereses particulares, entre otros factores que concurren en la toma de decisiones.
Since the onset of the international financial crisis, the convergence of the sovereign debt, banking and real estate crises in Spain has altered the former economic structure. With the collapse of prices, the Spanish property market, for decades the primary driver of national GDP and employment, has played a significant role in this process. The demanding provisions imposed by the Government on banks holding these assets has led to drastic adjustments in the industry, a rising flow of international investors seeking speedy returns and the sale of a number of financial institutions’ real estate platforms.
These crisis-induced corrections reminded all Spanish industries and the real estate sector in particular of the existence of business cycles and the need to adopt measures in good years to ensure survival in unfavourable circumstances. Symptoms of better prospects for the country's real estate industry initially appearing in late 2014 have been consolidated in 2015 (KPMG, 2015, p. 8). The business opportunities that have begun to arise, particularly in cities such as Madrid and Barcelona (PWC, 2015, pp. 21 and 51), are visible in: the volume of assets sold by the Spanish “bad bank” or Sareb (Sociedad de Gestión de Activos Procedentes de la Reestructuración Bancaria en España) and other financial institutions, with a growing number of interested buyers; the upturn in the number of leases, which enhances property values; and the heavy inflow of foreign investment (BME, 2015). Nonetheless, as Carbó and Rodríguez (2015, p. 22) observe, “risks persist, in light of high unemployment and the weakness of some European economies...”. Malo de Molina (2015, p. 13) identifies additional risks, namely the high level of household debt and demographic factors that will affect demand in the long run.
Given the dependence of the number of acquisitions on factors such as market liquidity, affordability, interest rates and business prospects, industry recovery may be expected to induce further acquisitions. Modelling past behaviour is consequently useful for identifying the features of decisions that lead to better takeover results. The lessons learnt from the notorious errors committed in Spanish real estate majors’ business plans (Martín, González, & Mendoza, 2011, pp. 244–245) must not be overlooked, however. During the years of economic expansion, size became a key variable to gain a competitive edge, prompting any number of concentration operations that restructured the business.
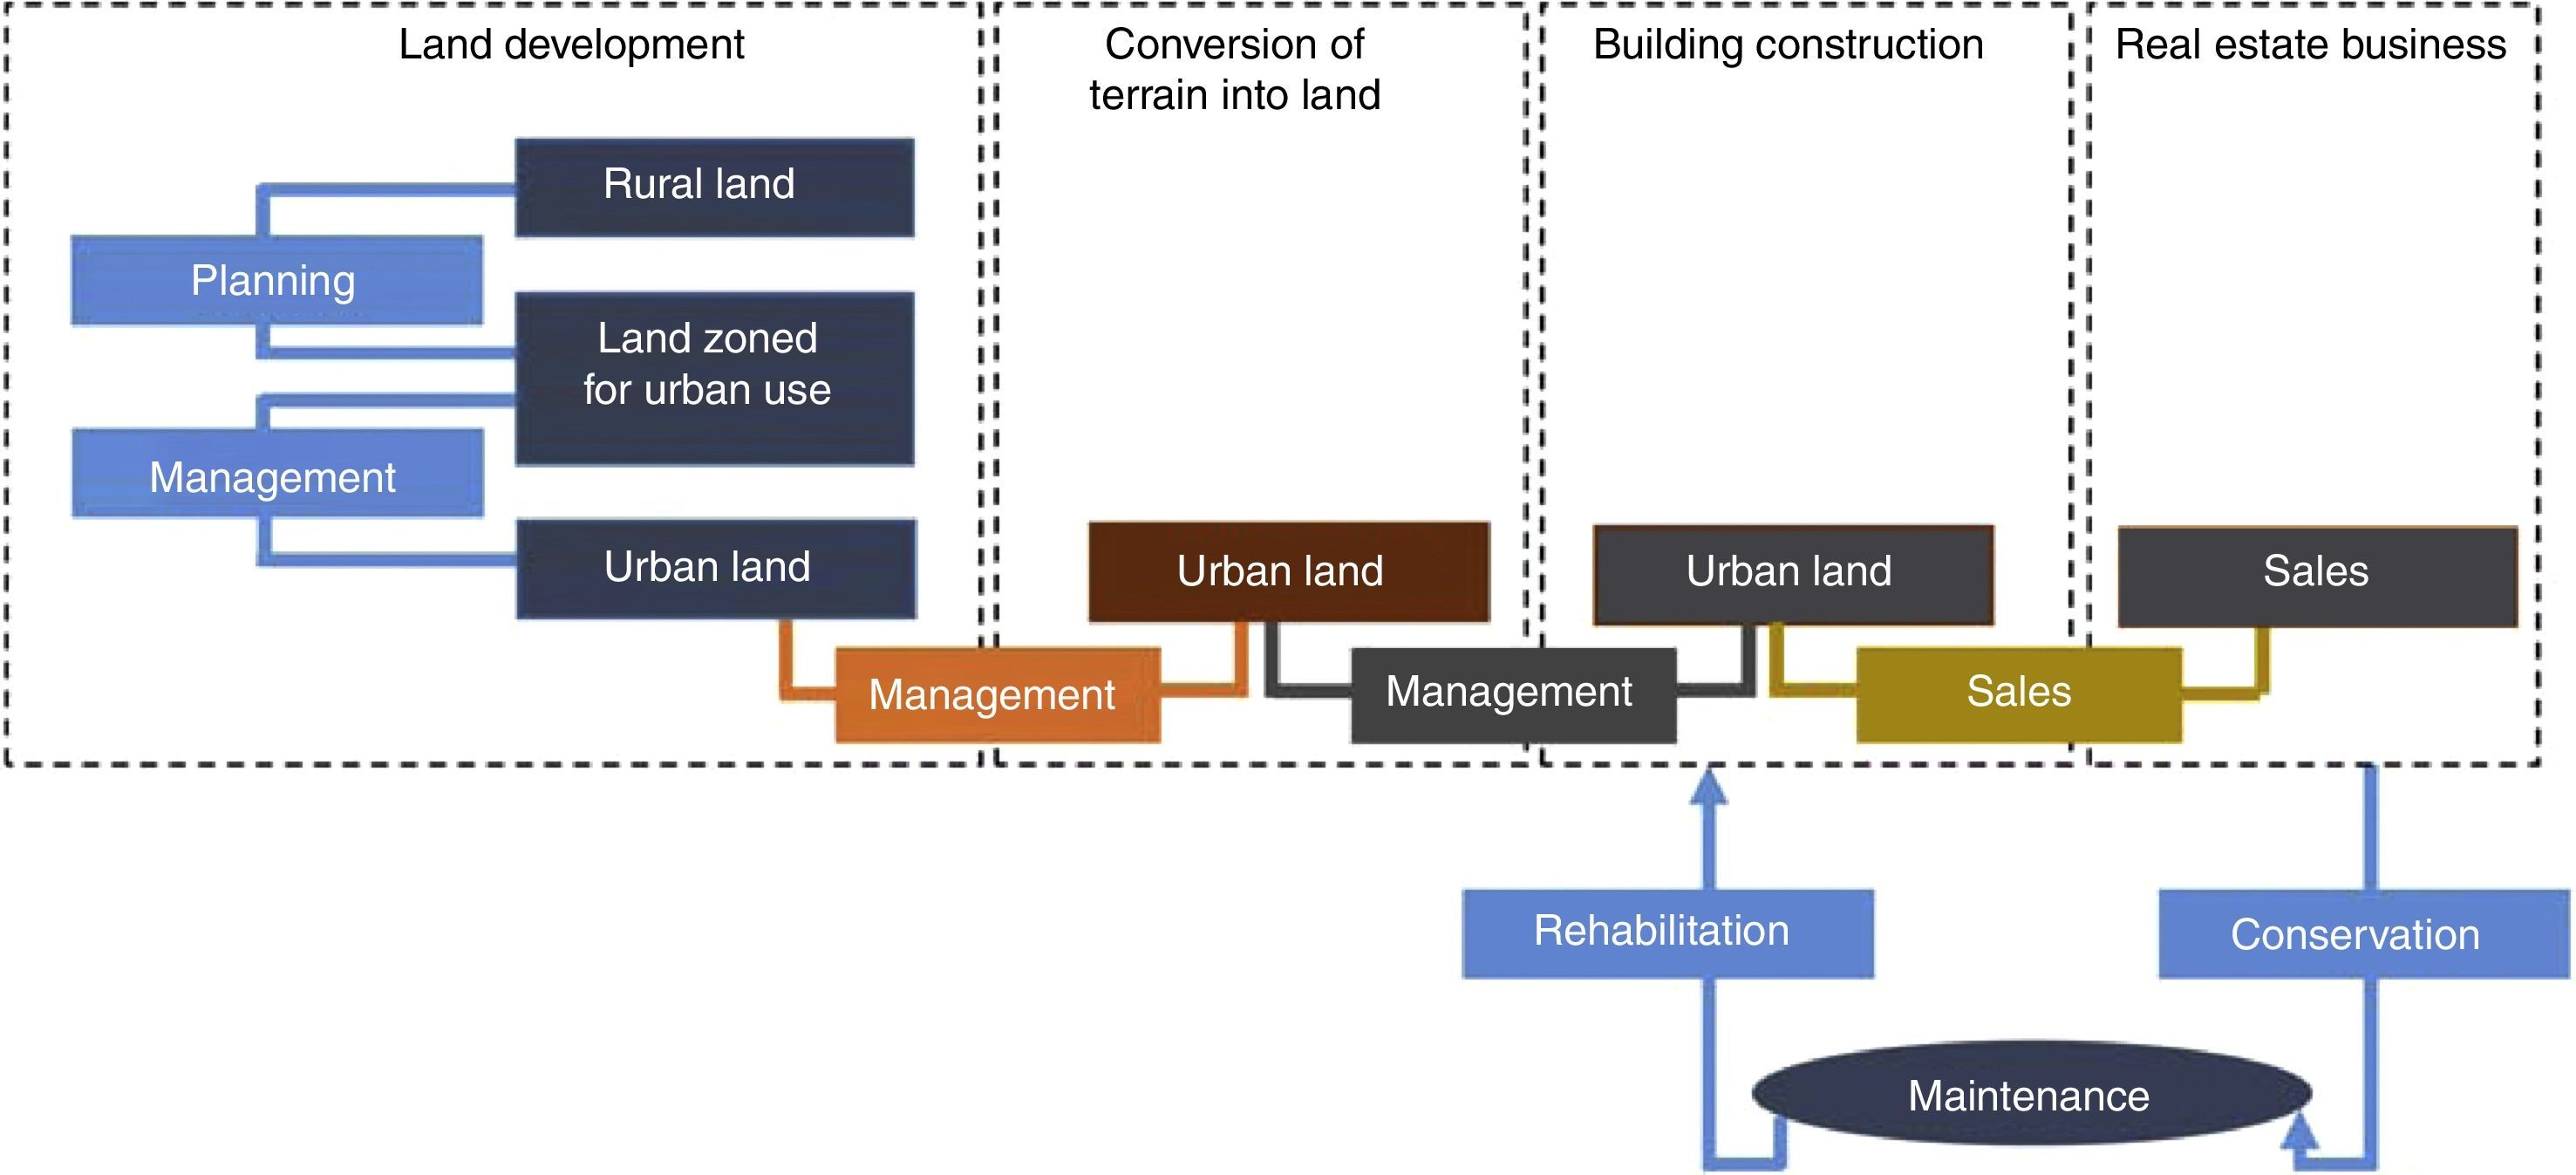
An analysis of the real estate industry revealed variability in the behaviour of its component businesses (Fig. 1). Whilst development exhibited essentially linear production (from land development to building sales), the real estate holding business followed a primarily recurrent pattern (with initially low asset turnover in the investment portfolio combined with real property rehabilitation and conservation, where appropriate).
.")
Real estate industry production. Source:Instituto de Estudios Económicos (2014).
For decades, real estate companies engaged in many such complex operations, most adopting the form of takeover bids. The proliferation of this type of operations also had knock-on effects for other industries and their entrepreneurial architecture, in which even production models and business plans were modified. The foregoing induced substantial legislative change in Spain, the most recent of which calls for a new takeover bid system designed to protect minority shareholders and encourage this type of operations. Both factors will be decisive for the industry.
The present paper analyses takeover bids in the Spanish real estate industry from 2000 to 2012. More specifically, it explores a total of 354 data items generated over the 13 years studied by 29 listed companies, divided into two major groups: companies participating in takeover bids (as buyers or sellers) and companies that did not engage in such operations (irrespective of their possible participation in other types of concentration, such as private mergers or acquisitions).
The research includes two aspects absent in prior papers on the subject. Firstly, the empirical analysis encompasses a very large number of economic and financial variables for all the companies analysed. Secondly, the model proposed is characterised by its ability to discriminate and categorise based on decision trees that define a characteristic behaviour pattern among companies involved in takeover bids.
The statistical study conducted drew from an exhaustive economic, financial and strategic analysis. The combination of these three analyses determined the factors or sets of variables with positive significance in takeover bidding. The resulting model will facilitate decision-making, the anticipation of possible operations and the prediction of the value of such operations on the grounds of the financial statements of the companies concerned.
The analysis is of current significance, given real estate companies’ need to gain size through new national and international alliances and slacken the rigidities of the model that shackled the industry during the financial crisis.
Review of the literatureSince the beginning of the 20th century several waves of corporate M&As have led to significant industrial restructuring worldwide (Ahern & Harford, 2014; Alexandridis, Mavrovitis, & Travlos, 2011; Gugler, Mueller, Weichselbaumer, & Yurtoglu, 2012; Wang & Moini, 2012). Many studies have been published on significance of factors that may prompt business concentration. According to Farinós, Herrero, Latorre (2010, p. 7), “... the nature, objectives and expectations [of takeover bids] are issues to be borne in mind for they will condition the [company's] financial future, performance and results...” The most representative papers identify many reasons for engaging in takeover bids. Manne (1965) showed synergies and inefficient management to be the main reasons, to which Gaughan (2015) added a growth potential and tax issues. For Jensen and Ruback (1983), improved target company management is the key, whereas for Denis, Denis, and Yost (2002), the aim is to branch into new businesses or geographies in pursuit of growth. That concurs with Palepu's (1986) findings to the effect that the takeover of companies with low performance and prospects are used by high growth companies as an expansion tool.
The reasons for such operations might also lie in their use by managers as defensive factors to conceal inefficient management or engage in acquisitions in pursuit of their own personal goals. Examples of the latter would be attempts to purchase growth to enhance their power and hence their remuneration, to ensure the continuity of the buyer's management staff (Amihud & Lev, 1981; Marris, 1964; Mueller, 1969) or merely to acquire the prestige attached to participating in the management of a larger company (Roll, 1986).
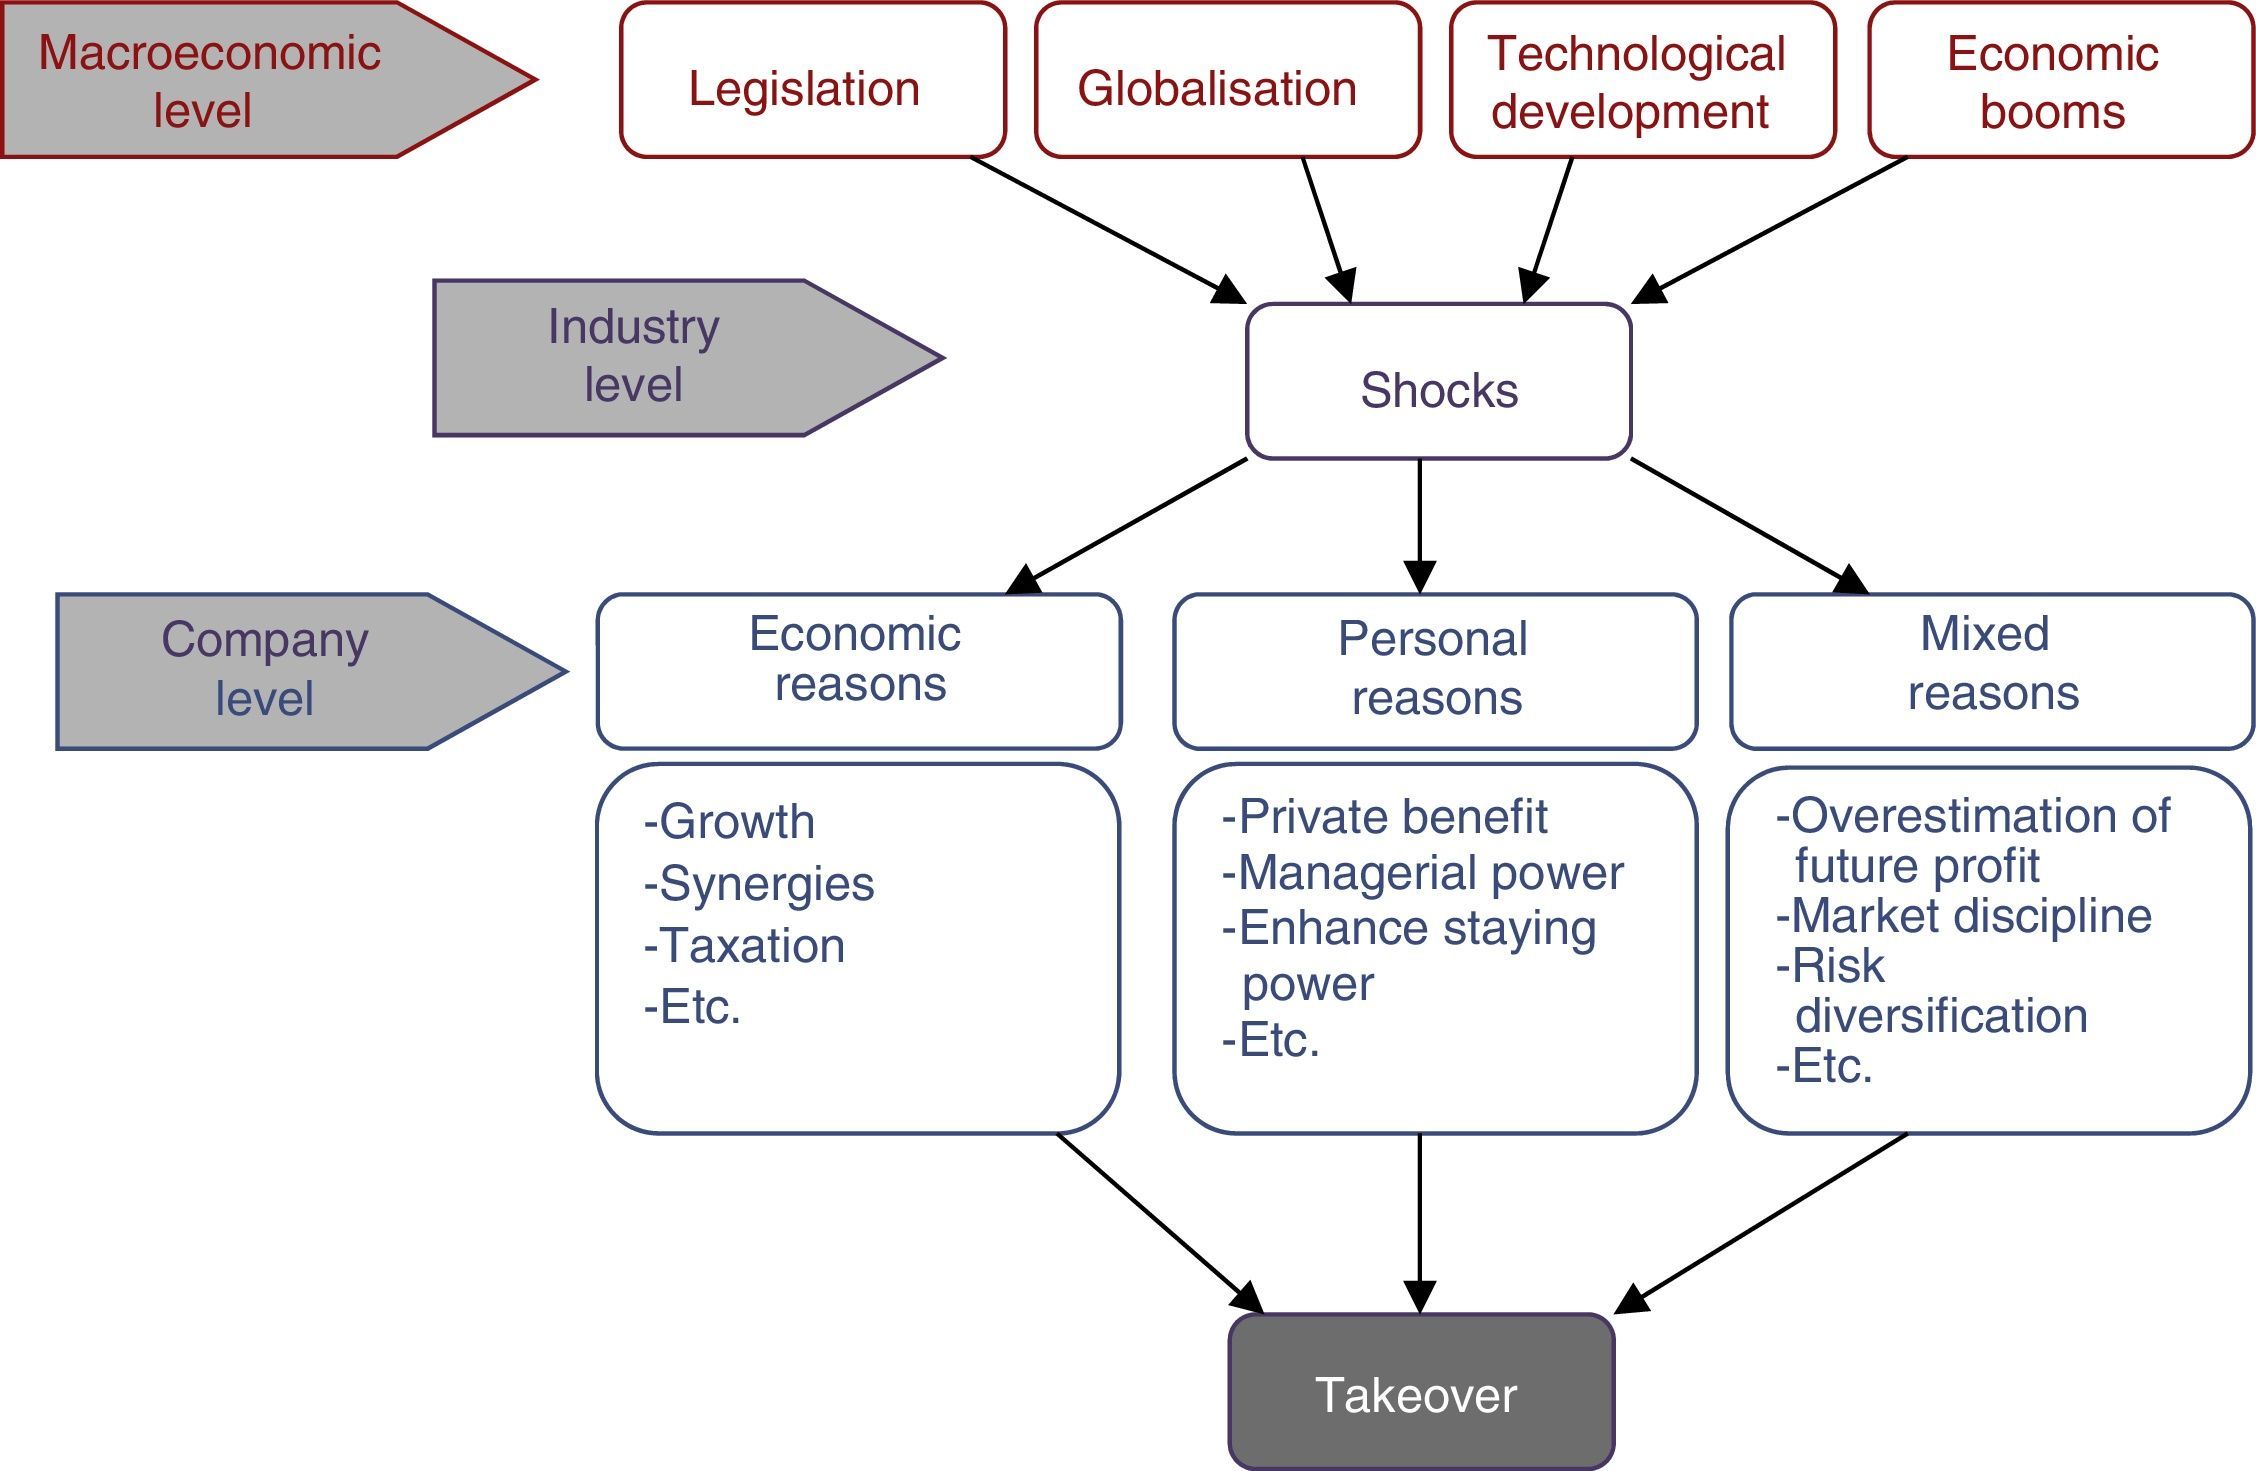
In addition to business factors, macroeconomic and industry-wide considerations such as economic expansion, globalisation or legislative changes may also impact the decision to engage in an acquisition (Zozaya, 2007). For many authors, the result of such operations is more favourable when the buyer and target firms engage in the same business (Hietala, Kaplan, & Robinson, 2003; Lubatkin, 1983; Porter, 1980; Salter and Weinhold, 1979; Singh and Montgomery, 1987). Fig. 2 depicts the aforementioned motivations, classified by levels and groups.
 and Abellán (2004).")
Factors underlying takeover bid decisions, by level. Source: Formulated by the authors based on Ali-Yrkkö (2002) and Abellán (2004).
Of the company level categories, ‘purely economic reasons’ was regarded here as the most rational. This group included optimising the balance sheets of the companies concerned as an avenue for creating value. The intrinsic explanation that underlies such transactions cannot be overlooked. Common to all is value creation for shareholders, which determines their very essence as well as their viability. The present study rests on that mainstay.
Some authors have studied the feasibility of takeover operations based on their effects on the participants’ market value (Andrade, Mitchell, & Stafford, 2001; Campa and Hernando, 2004; Edmans, Goldstein, & Jiang, 2012; Firth, 1980; Franks, Broyles, & Hecht, 1977; Jarrel, Brickley, & Netter, 1988; Jensen and Ruback, 1983; Khana, Mishra, & Mottleb, 2014; Stunda, 2014). Nonetheless, more literature can be found on analyses based on accounting and financial variables. Pioneers such as Hogarty (1977), Meeks (1977) and Kaplan (1989) addressed profitability, cash flow, asset volume, sales or the market value of assets, while more recent papers (Grigorieva & Petrunina, 2015) have introduced greater complexity.
Using financial profitability, leverage, liquidity, size and P/E, Barnes (1999) reported: (1) that buyers try to buy lower performers; and (2) an inverse relationship exists between the objective and the result of the takeover. Colarte and Rodríguez (2006) analysed 52 variables and ratios classified under headings such as accounting structure, financial balance, indebtedness, profitability, productivity, efficiency and growth. More recently, Duso, Guglerm, and Yurtoglu (2010) used profits and share prices, identifying a positive correlation between share performance and post-merger profits. Ciobanu, Caloian, Brad, and Staicu (2012) used accounting ratios to analyse the performance in takeover bid target companies over a 5 year period (2006–2011) in Romania. They explored return on equity, return on assets and return on sales to measure companies’ economic performance before and after the bid was announced. They concluded that over 70% of takeover bids accepted could be explained by companies’ economic background. Dobre, Brad, Ciobanu, Turlea, and Caloian (2012) observed that company liquidity and a turnaround in revenues have a positive impact on performance. Halkos and Tzeremes (2012) showed that the bias introduced in efficiency estimations by the use of financial ratios has implications for both individual firm and industry performance evaluation and that bootstrapping provides more reliable estimates.
The findings are widely scattered and often inconclusive, although the consensus seems to be that target company shareholders benefit substantially more than their buyer company counterparts. Studies analysing the effect of board member and manager holdings on participation in takeovers (Alcalde, Espitia, & Vallés, 2003; Martynova & Renneboog, 2011; Song & Walkling, 1993) have usually reported an inverse relationship between the two.
In line with studies based on accounting and financial parameters, this article attempts to surmount the absence of conclusive findings in prior papers by applying a cascade methodology to develop a model based on variables that pass a preliminary test, as described below.
Data and methodologyThe cyclic behaviour of the economy and markets suggests the need to establish predictive models with which to prevent business failure by anticipating new recessions. Professors Gil and Giner (2013, pp. 129–130) detected a lack of such specific preventive models for the real estate, construction and manufacturing industries and hence a need to develop ad hoc models able to predict possible bankruptcy in those industries.
This article aims to identify a behaviour pattern able to characterise takeover bidding in the Spanish real estate industry over the last decade, showing that, in troubled times (as in bubble formation and bursting), accounting indicators are better predictors of managerial decisions than market volatility. As Gil and Giner (2013, p. 129) suggested, a model that draws from economic and financial indicators to explain takeover bidding could be used to apply general analyses to each specific case while at the same time predicting possible takeover operations.
In the spirit of the Libro Blanco del Sector Inmobiliario [white paper on the real estate industry] (Fundación de Estudios Inmobiliario, 1999), the 2009 edition of Spain's national business code system (CNAE) divides it into sub-industries. Development is included under the heading construction (regarding it as a preliminary thereto) as subgroup 41.1. The real estate holding business is classified under subgroup 68, which covers the sale and rental of direct holdings as well as holdings managed by third parties, including property managers (Fig. 3). This new structure highlights the distinction between the two types of business.
: real estate businesses. Source:Real Decreto 475/2007 (2007).")
2009 Spanish business codes (CNAE): real estate businesses. Source:Real Decreto 475/2007 (2007).
Of the 29 real estate companies listed on the Spanish securities exchange that defined their primary business under CNAE codes 40.1, 68.1 or 68.2, 10 were involved in takeover bidding.
The year 2012 was chosen as the end year for the study because after that: (a) the number of companies selected for the survey shrank by half as a result of company liquidation and closure; (b) some of the remaining companies were seeking arrangements with creditors; (c) the accounting information and economic-financial indicators reflected extreme circumstances; and (d) no takeovers were recorded in Spain's real estate industry between 2012 and 2015 (except the Metrovacesa takeover for delisting which, as such, lay outside the scope of the study).
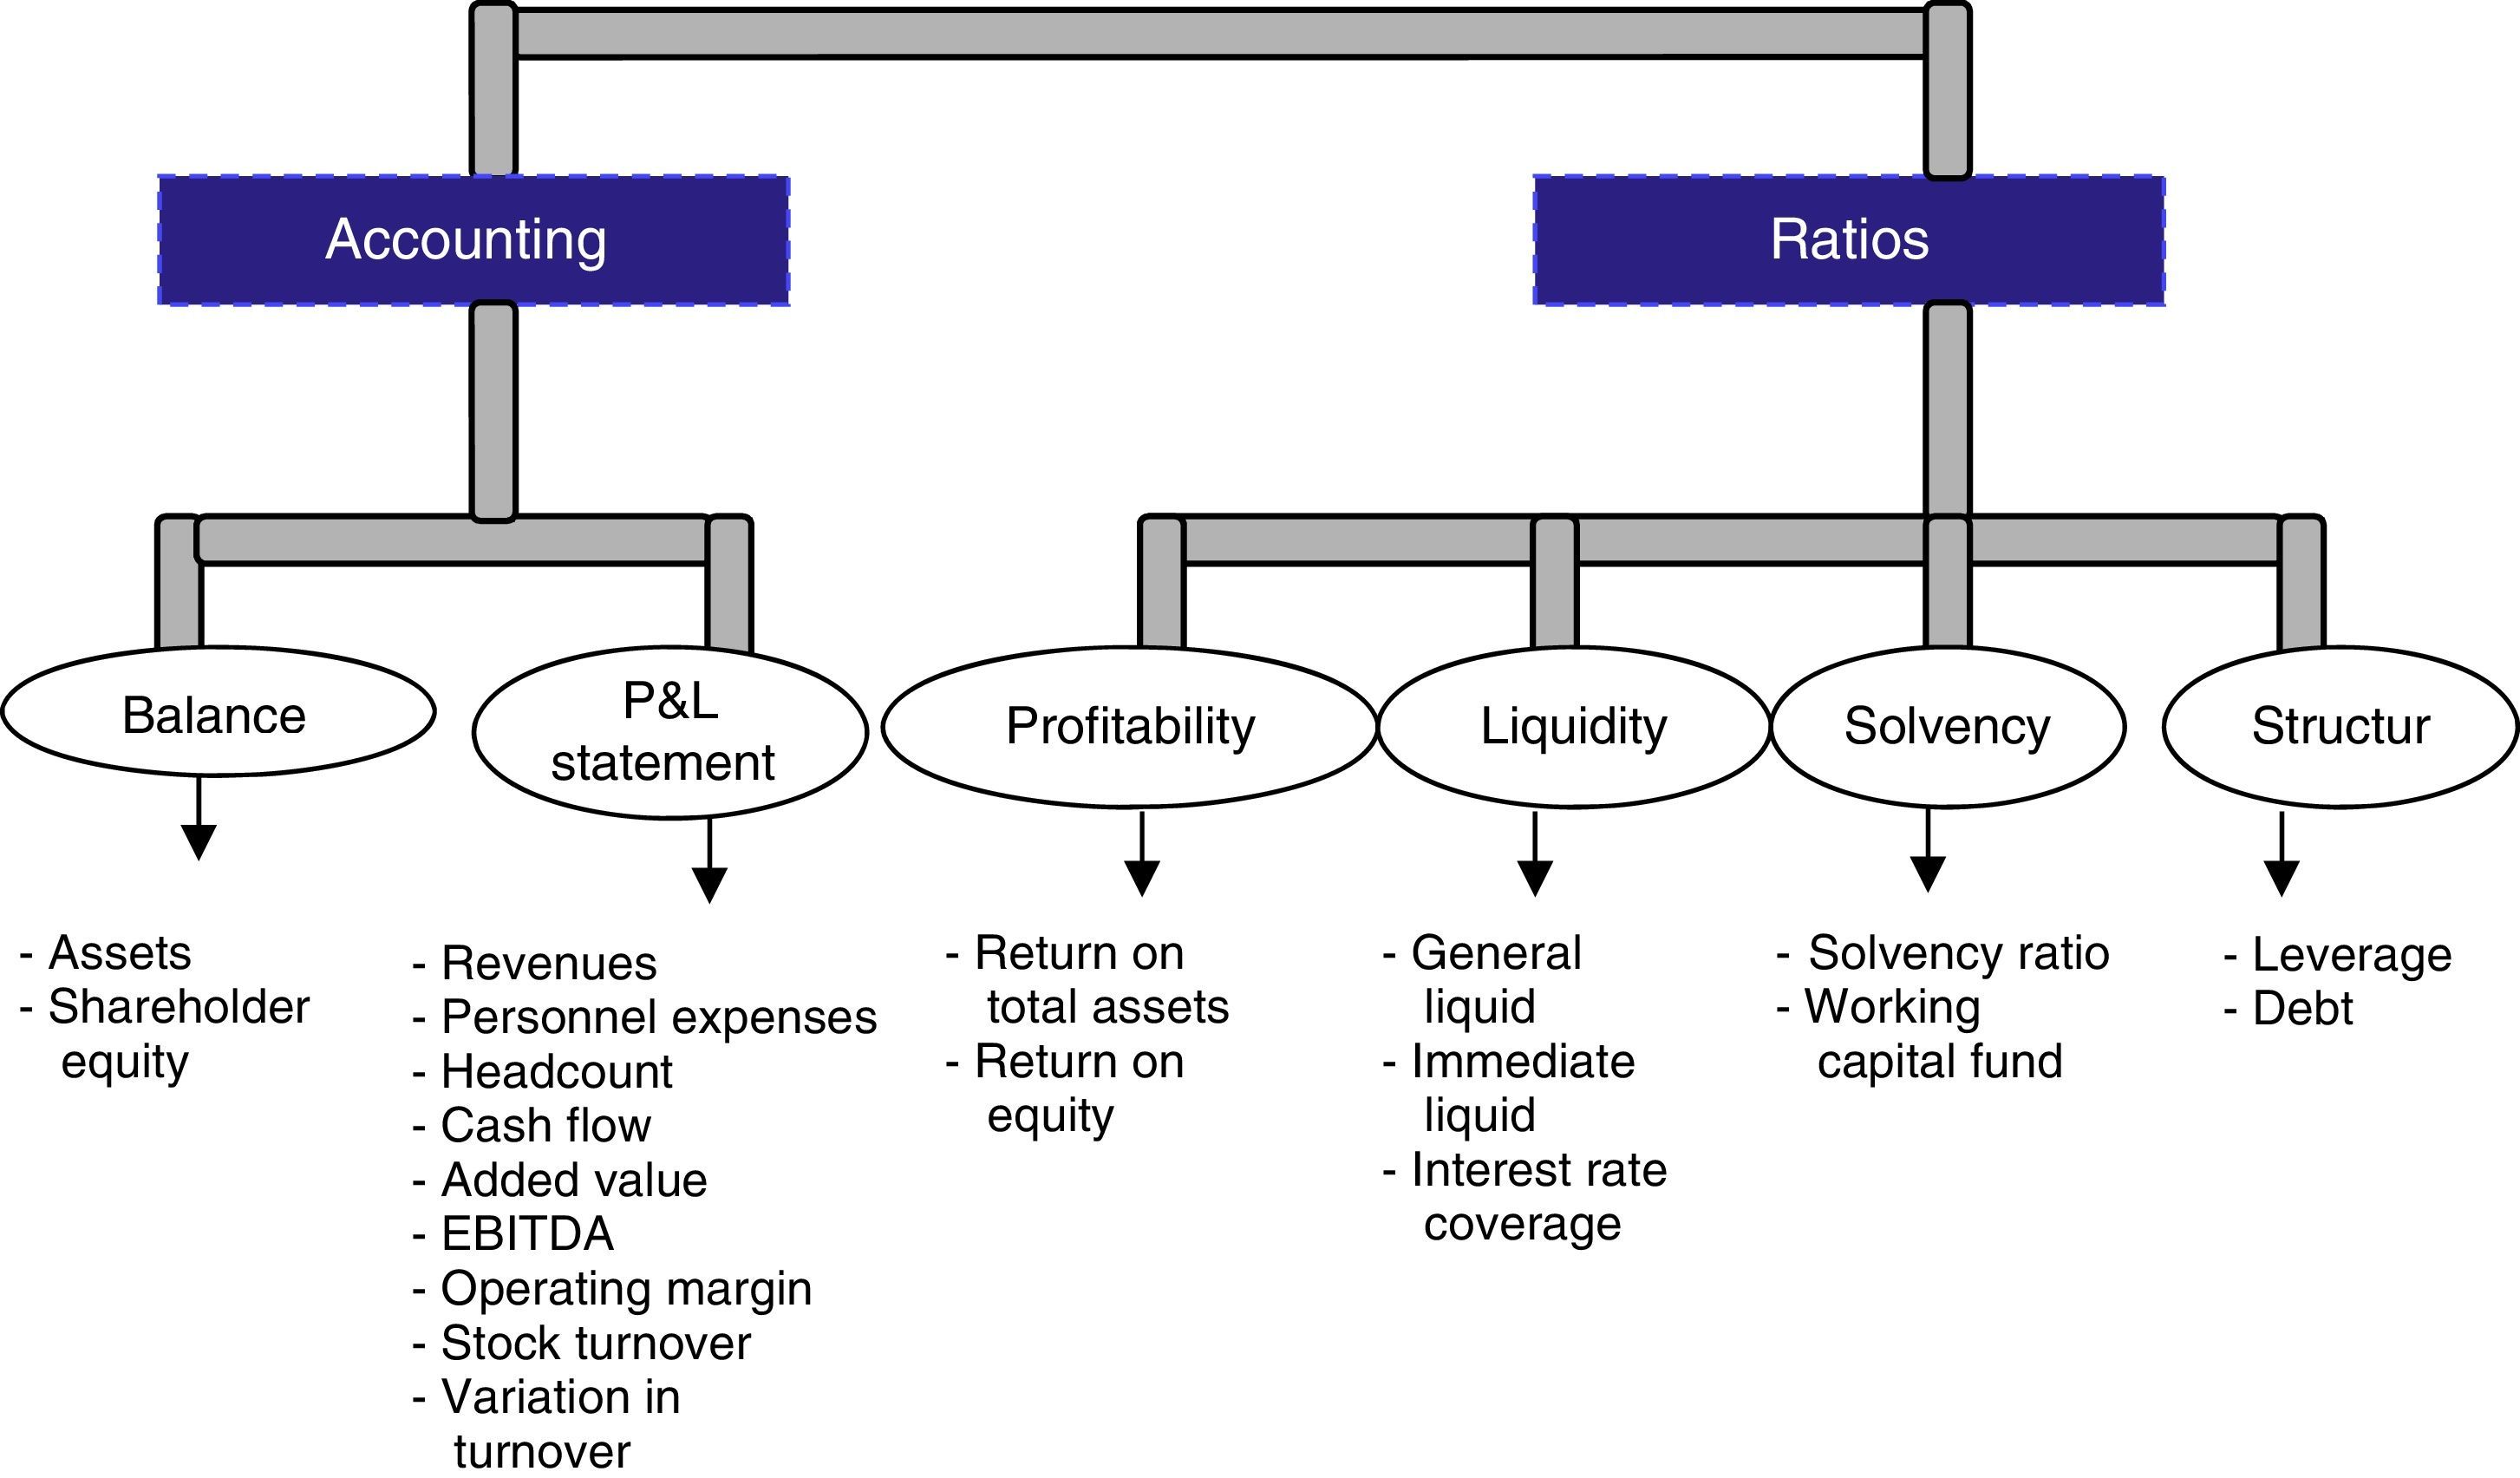
The companies selected were analysed in terms of 20 economic and financial variables, classified as shown in Fig. 4, further to a scheme proposed by Sharma and Ho (2002) and Colarte and Rodríguez (2006). Like those authors, the present researchers decided to disregard the use of share prices in this study. That decision was deemed appropriate given the bubble that was forming at the outset and the industry's lapse into recession at the end of the period studied. The use of share prices would have distorted the findings, over- or underestimating the value of the companies involved.

Factorial analysis reduced the initial 20 variables to five new regression variables that yielded one value each per company and year over the period studied. The resulting factors therefore included the effect of two extreme and opposite circumstances on the economic-financial indicators.
A behaviour pattern explaining involvement in takeover operations by the set of companies selected was sought with a two-stage statistical procedure.
- 1.
In the first stage, principal component analysis was applied to simplify the number of variables and obtain a short list of factors or components able to explain a substantial portion of model variable behaviour.
Principal components, a type of factor analysis, while not in itself explaining the behaviour of companies participating in takeovers, was a necessary preliminary step to simplify the large number of variables involved, many of which were inter-correlated, with no significant loss of information. Moreover, the inclusion of a large number of economic indicators in the discrimination techniques would render the procedure and interpretation of the results very complex.
In an initial simulation, profitability was observed to have a Kaiser–Meyer–Olkin measure of sampling adequacy (KMO coefficient) far below the level regarded as statistically acceptable and was consequently excluded from the analysis.
- 2.
A statistical method was applied to the components defined in the first stage to draw conclusions on the behaviour pattern of listed real estate companies in connection with takeover operations. That pattern was in turn applied to develop a model for possible future takeover operations. A CHAID-type decision tree was used, for its ability to both discriminate and categorise the set of companies analysed (Yao, Khosla, & Fei-Fei, 2011, p. 1579).
Decision trees, also known as CARTs (classification and regression trees), are graphic representations in which a discriminating criterion is used to split a sample into sub-groups of elements with shared characteristics, depicted as nodes and branches (Pérez, 2006, p. 27).
Chi-square automatic interaction detection (CHAID) was the method used in this analysis. In this procedure, of all the possible splits for all the variables, the one selected is the one with the lowest p-value associated with Pearson's χ2 if the variable is categorical, or with the F statistic if it is continuous.
The splitting variable and its optimal split are detected in a two-phase process. First the explanatory variable categories are merged, after which the splitting variable is selected in the splitting phase.
In the merge phase, the categories of each variable for which the lowest statistical significance (highest p-value) is obtained are grouped, provided that such value exceeds a certain pre-established threshold, αm. The procedure is described step-by-step below.
- -
Step 1: find the category pairing that yields the highest p-value for the χ2 or F test. That value is p*.
- -
Step 2: compare p* to the pre-established αm value. If p*>αm, join the two categories. If p*<αm, continue to step 3.
- -
Step 3: adjust the p-value using the Bonferroni multiplier, i.e., p*′=p*·B where:
c is the number of original categories;
r is the number of post-grouping categories.
The starting point for the splitting phase is the adjusted p*′ values found in the merge phase. The variable with the most significant contrast is selected, i.e., the one with a p*′ value of p+=min (p*′). If statistical significance, p+, is lower than the pre-established minimum αs that is the grouping chosen as the node split. Step-by-step, the procedure is as follows.
- -
Step 1: find the predictor variable with p*′=p+.
- -
Step 2: compare p+ to the pre-established αs value. If p+<αs, the node is split using the category grouping obtained in the merge phase, whereas if p+>αs, the node is regarded as a leaf or terminal node.
In this study, αs=αm=0.05. The splitting process ceased when the number of instances to be split was less than 100 for the ‘parent’ node and less than 50 for the ‘daughter’ nodes. Maximum tree depth was set at three levels, since the structures sought were not particularly complex.
As Serna (2009) showed, whilst discriminatory capacity is similar in the decision-tree (CHAID in this case) and logistic regression methods, with the latter the results can also be categorised by group.
ResultsPrincipal components methodPrincipal components analysis yielded a series of new variables known as components or factors which were used as input for a CHAID with a view to discriminating, categorising and ultimately describing a behaviour pattern characteristic of companies engaging in takeover bidding.
The inter-variable level of correlation deduced from the correlation matrix values was even higher than after the aforementioned exclusion. Of the 171 correlations identified, 70 exhibited absolute values of over 0.30, confirming that the criteria for factor analysis were met and the correlations were significant (Carbó, 1996, p. 172).
Two further indicators also confirmed the suitability of the method. The Bartlett sphericity test showed a p-value of under 0.05 at 190 degrees of freedom. The KMO coefficient, in turn, was 0.841 overall, with individual KMOs for many variables much higher than the acceptability limit. Furthermore, most of the residuals exhibited values of under 0.1, denoting a good fit for the method proposed.
The first five components identified explained 88.5% of the response variable behaviour, a percentage upward of the 75% of the variance regarded by De la Fuente (2011, p. 8) as good sampling adequacy.
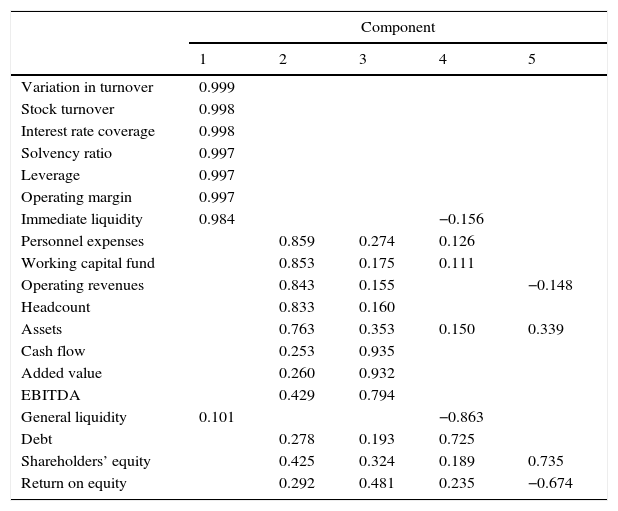
The initial solution delivered by principal components analysis was transformed by applying Varimax rotation to find a more visible relationship among variables and the components for a clearer and more precise interpretation. The findings are given in Table 1, which lists the new weightings for the variables under each component.
Rotated component matrix.
| Component | |||||
|---|---|---|---|---|---|
| 1 | 2 | 3 | 4 | 5 | |
| Variation in turnover | 0.999 | ||||
| Stock turnover | 0.998 | ||||
| Interest rate coverage | 0.998 | ||||
| Solvency ratio | 0.997 | ||||
| Leverage | 0.997 | ||||
| Operating margin | 0.997 | ||||
| Immediate liquidity | 0.984 | −0.156 | |||
| Personnel expenses | 0.859 | 0.274 | 0.126 | ||
| Working capital fund | 0.853 | 0.175 | 0.111 | ||
| Operating revenues | 0.843 | 0.155 | −0.148 | ||
| Headcount | 0.833 | 0.160 | |||
| Assets | 0.763 | 0.353 | 0.150 | 0.339 | |
| Cash flow | 0.253 | 0.935 | |||
| Added value | 0.260 | 0.932 | |||
| EBITDA | 0.429 | 0.794 | |||
| General liquidity | 0.101 | −0.863 | |||
| Debt | 0.278 | 0.193 | 0.725 | ||
| Shareholders’ equity | 0.425 | 0.324 | 0.189 | 0.735 | |
| Return on equity | 0.292 | 0.481 | 0.235 | −0.674 | |
As Fig. 5 shows, the five principal components that explain most of the response variable behaviour are: (a) liquidity, solvency and borrowing capacity; (b) size; (c) economic performance; (d) operating capacity; and (e) financial performance. The first two, which accounted for 70%, were observed to be the most significant.
Decision tree: chaid method
In this analysis, the independent variables were the components obtained with factor analysis as described above. Profitability, initially excluded from factor analysis due to its inconsistent KMO, was likewise included in light of its significance in the economic-financial study and in industry decision-making.
The dependent variable, which determined the discriminating criteria for categorisation into homogeneous groups, was company engagement or otherwise in takeover operations; the year of the operation was taken into consideration as well.1 The hypothesis posed for each of the six independent variables was as follows:
H0=the variable affected participation in takeovers.
H1=the variable studied did not affect participation in takeovers.
The structure of the pre-defined input variables for the tree includes the fluctuations over time in industry companies’ economic-financial indicators. Hence, the financial characteristics identified by CHAID testing to explain the takeover bids include the trends detected.
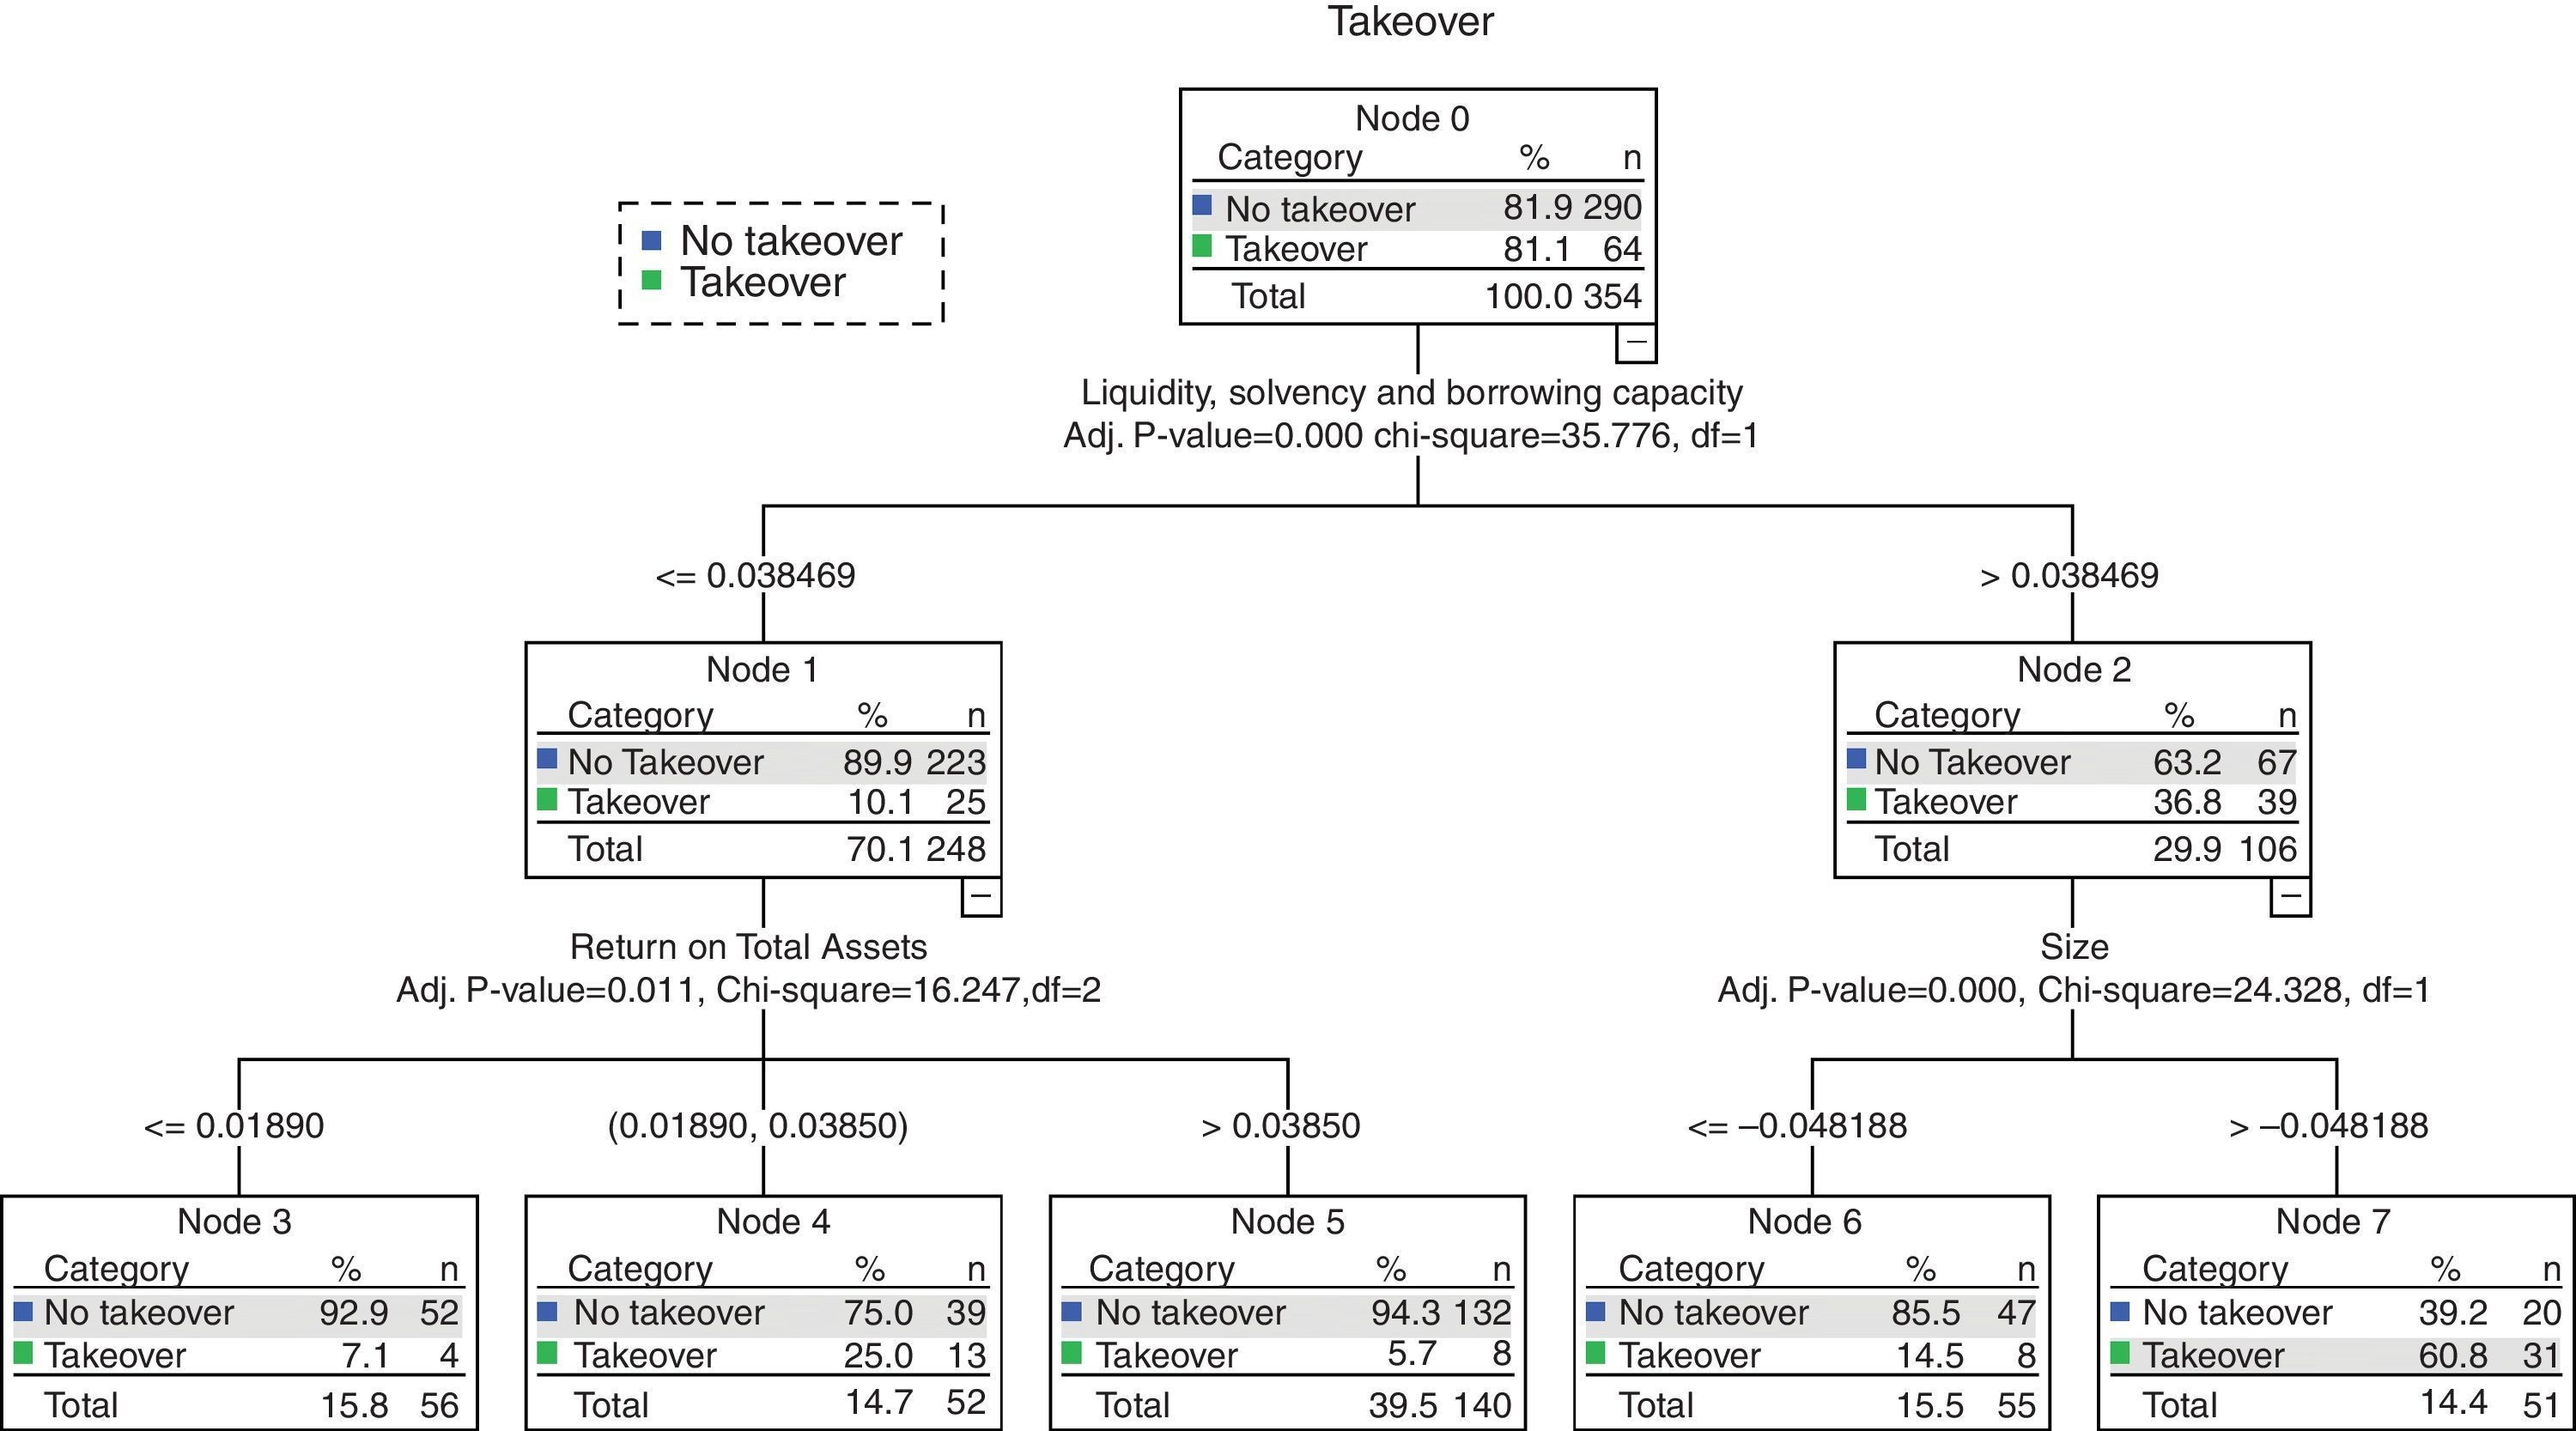
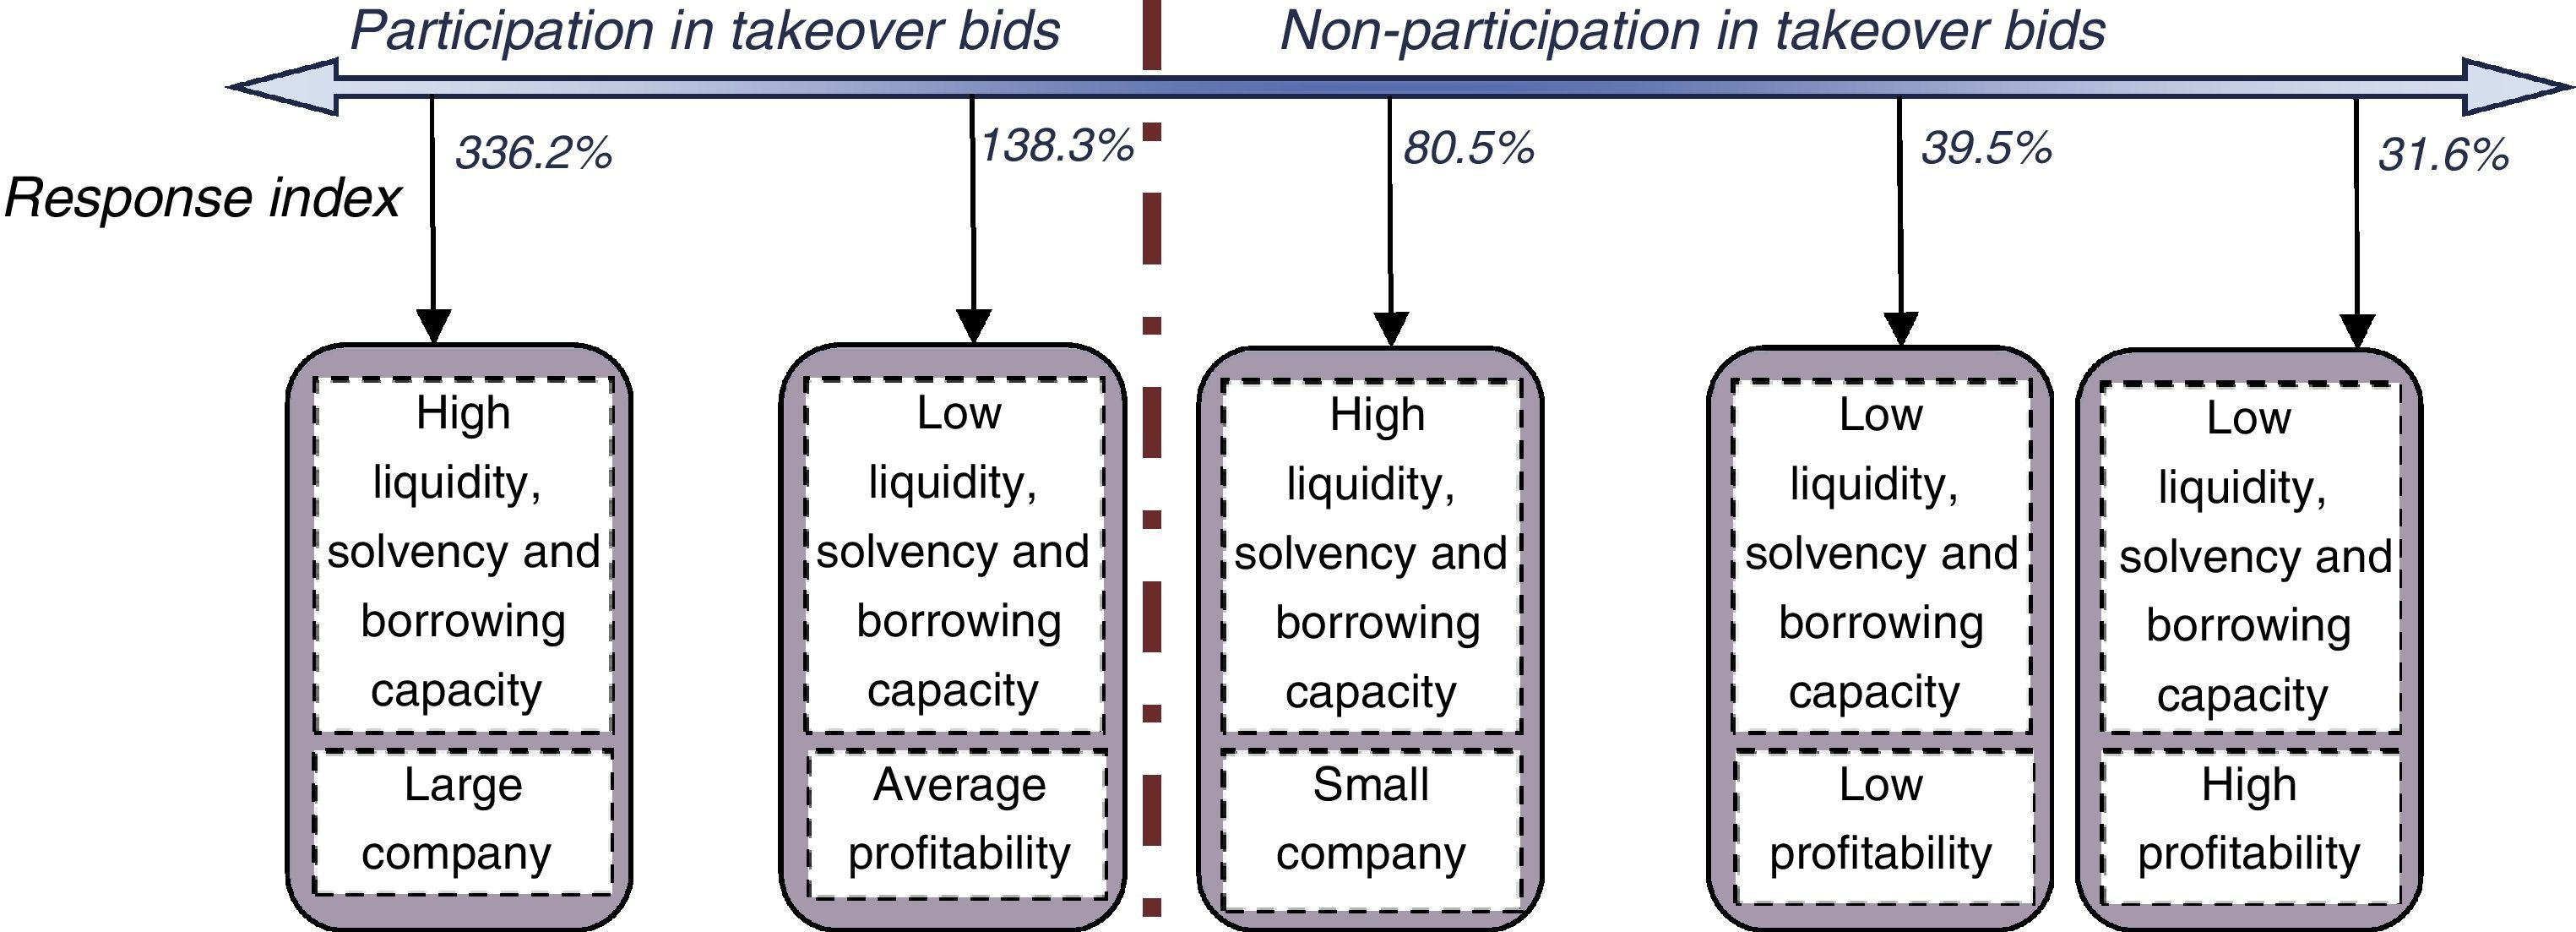
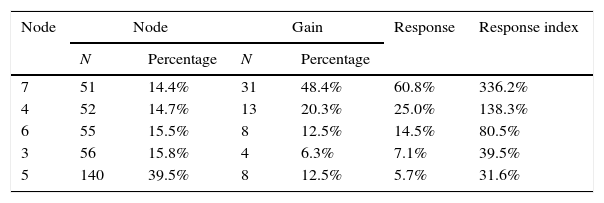
The resulting CHAID tree, the node data, node gains, the response and the response index are given in Table 2 and depicted in Fig. 6.
Terminal or leaf node gains.
| Node | Node | Gain | Response | Response index | ||
|---|---|---|---|---|---|---|
| N | Percentage | N | Percentage | |||
| 7 | 51 | 14.4% | 31 | 48.4% | 60.8% | 336.2% |
| 4 | 52 | 14.7% | 13 | 20.3% | 25.0% | 138.3% |
| 6 | 55 | 15.5% | 8 | 12.5% | 14.5% | 80.5% |
| 3 | 56 | 15.8% | 4 | 6.3% | 7.1% | 39.5% |
| 5 | 140 | 39.5% | 8 | 12.5% | 5.7% | 31.6% |
Note: The “Node” column shows the number of cases (N) included in each and the percentage of that number over the total (354). The “Gain” column shows the number of cases in the node (N) constituting takeover bids and the percentage of that number over the total number of takeover bids. The “Response” column is the percentage of the takeover bids relative to the total cases in the node. The “Response index” column is the quotient (in per cent) between the percentage of takeovers in the node and the percentage of cases in the node.

The resulting tree structure yielded three levels with two main branches, two intermediate and five terminal nodes in addition to the root node. Three of the six variables exhibited a significant discriminating criterion, i.e., were able to generate new branches. The root node, graphed as node 0, included all the cases in which the dependent variable was present. The total number of cases studied (n) was 354, 64 of which involved takeover bids.
The random probability of involvement of one of the companies in the set in a takeover bid in the period studied was 18.1%: this was the reference value used to determine the explanatory capacity of each node.
The root node split into two branches or sub-groups, generating nodes 1 and 2. Here the discriminating variable used was component 1: company liquidity, solvency and borrowing capacity. With a p-value of 0.000, the chi-square test denoted association between this predictor and the response variable.
The cut-off value for the explanatory variable used to divide the two sub-groups was 0.038469. Node 1 included the cases with values less than or equal to the cut-off, i.e., companies with scant liquidity, solvency and borrowing capacity.
Tellingly, while accounting for 248 of the total 354 cases (70.1%), this node explained only 10.1% of the takeover bids (25 cases), which was lower than the 18.1% benchmark. This revealed that low values for this variable discouraged concentration.
Node 2, in turn, covered the companies with liquidity, solvency and borrowing capacity values higher than 0.038469. While only 29.9% of the total cases were classified in this node, it explained 36.8% of the takeover bids.
These data showed that most of the industry companies studied were not characterised by high liquidity, solvency or borrowing capacity. That may be the reason why a larger number of takeover bids was not observed. They also indicated, however, that the variables grouped under component 1 prompted acquisitions, inasmuch as they favoured such operations.
An analysis of the left branch of the tree showed that three daughter nodes, known as leaf or terminal nodes, hung off parent node 1. Here the discriminating criterion was profitability among companies characterised by low levels of liquidity, solvency and borrowing capacity. The chi-square test denoted association, with a p-value of 0.011.
Node 3 comprised the sub-group of companies which, in addition to having low liquidity, solvency and borrowing capacity, were scantly profitable (less than or equal to 1.89%). This leaf accounted for 15.8% of the total cases and only four concentration operations.
The financial characteristics defining this group did not encourage takeovers, as can be seen from the data given in Table 2. Whereas the 56 cases in this node should have accounted for 15.8% of such operations (if the response were uniformly distributed), the actual response was only 7.1%. The gain, since this leaf explained only four concentration operations, was 6.3%. As a result, the response index was 39.5%, considerably lower than if the number of cases had been the 10 required to meet the 18.1% benchmark.
Similar conclusions were drawn from an analysis of node 5. The right-most leaf on this branch includes the sub-group of companies with low liquidity, solvency and borrowing capacity and medium-high profitability, i.e., over 3.85%. Although the companies with these characteristics accounted for nearly 40% of the total, only 5.7% of the takeover bids were recorded in this leaf, which consequently exhibited very low explanatory capacity and a response index of just 31.6% (Table 2).
In all six components, companies characterised by a dearth of liquidity, solvency and borrowing capacity initially proved to be in a less favourable position to engage in takeovers. Companies that in addition had very low profitability values were not involved in concentration operations, as they were neither attractive takeover targets nor inclined to take such initiatives, for doing so could significantly compromise their business. The companies in node 1 that had higher profitability were similarly disinclined to participate in takeover bids, for their economic management and limited liquidity and ability to marshal resources made such operations both unappealing and undesirable.
Lastly, companies with low liquidity, solvency and borrowing capacity and profitability between 1.69 and 3.85% were positioned in the third leaf on this branch, node 4. While just 14.7% of the cases were positioned in this terminal node, it explained 25% of the takeover bids which, compared to the benchmark (18.1%), gave an index of 138.3% (Table 2).
The market discipline model showed that companies characterised by this pattern were involved in a larger number of operations. Although the want of liquid resources would hinder takeover bids, the expectations around improvements in economic management would encourage such processes. The smaller number of total cases in this group can be attributed to the fact that most of its components were takeover targets, some of which disappeared after the operation.
The right branch of the model, where the parent node was node 2, split into two sub-groups in which company size was the discriminating factor. The chi-square for this factor had a significant and statistically acceptable p-value of 0.000.
The companies with high liquidity, solvency and borrowing capacity were divided into two sub-groups: those with a regression variable value of less than or equal to −0.04818, positioned in node 6, here referred to as small; and those in node 7, with regression values of higher than that value, regarded as large. No clear relationship was initially observed between the two variables defining this branch: liquidity, solvency and borrowing capacity were not size-dependent, for of the 106 cases in node 2, 55 involved small and 51 large companies.
Terminal node 6 accounted for 14.5% of the takeover bids, for a gain of 12.5% (Table 2) and an under-100% index of 80.5%. The explanatory capacity of this leaf was consequently deficient.
Node 7, in turn, contained the major share of participation in takeover bids: 60.8%. While the percentage of cases was only 14.4%, node gain was 48.4% for an index of 336.2%.
That revealed a behaviour pattern for concentration operations, which tended to involve sizeable companies with high liquidity, solvency and borrowing capacity. The ability to finance such operations, together with size-related economic, financial and strategic considerations,2 would justify takeover bids. Moreover, most of the companies in this group that participated in takeovers were buyers (Fig. 7).

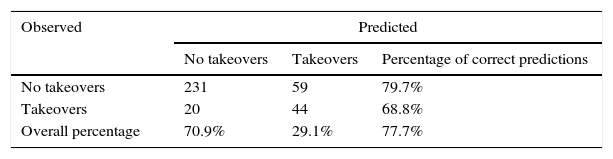
The results of the study yielded a robust explanation of developments during the study period in the companies selected. Accounting indicators are, thus, suitable tools to be used in corporate decisions predictive processes. As Table 3 shows, the 70% of the takeovers were explained, with an overall rate of close to 80%. The proportion of takeovers not explained by the model were related to strategic or market considerations or others difficult to pinpoint. As Alcalde et al. (2003) pointed out, such considerations may include managers’ private interests, financial speculation or the desire to grab a bargain, among others, none of which lie within the spectrum of rational economic behaviour.
In terms of the model's predictive power (Table 3), its reliability was on the same order as those of others based on empirical financial studies and more specifically on risk management using decision trees. In a study of the feasibility of CART and C4.5 models, Huang, Tzeng, and Ong (2006) reported percentages of 85.81 and 87.06%, respectively. Similarly, Hu and Ansell (2007) established decision tree model explanatory power to be 88.29%, and 88.60% when variables related to the economic environment were included. In other articles of note, Chuang and Lin (2009) and Zhou, Rao, and Lv (2010) found somewhat lower levels, around 77.5 and 70.35%. These findings can be applied to predict possible future industry takeovers in the presence of the financial characteristics defined in the pattern.
DiscussionThe grounds for M&A should be the fundamental indicators and the foreseeable continuation of current trends, with the ultimate aim of creating value with company business. When business decisions are not so oriented, that objective cannot be met. To prove this point, the reference used was a Spanish industry with a historically high level of indebtedness severely stricken after debt-based expansion under an unviable business model at rates only sustainable for short periods of time in contexts of intense growth.
The present analysis of acquisitions involving listed real estate industry companies from 2000 to date yielded a recurrent and clearly defined behaviour pattern. Financial and accounting information, like liquidity, solvency and borrowing capacity, along with size and to a lesser extent profitability, proved to be key factors in takeover bids.
The combination of high resource availability and low indebtedness, along with size, explained most of the acquisitions. The group of companies involved comprised primarily buyers, although it also included a few takeover targets. That would partly explain market discipline, in which companies with high growth potential become targets if they are not optimally managed.
The aforementioned categories describe a series of economic-financial characteristics that encourage takeover bids, to which the CHAID tests add the need for trends heading in the right direction. That is particularly important in this study, since the period analysed included two diametrically opposed sets of circumstances.
Other marginal characteristics found to encourage takeover bids, although to a lesser degree, included high indebtedness and low solvency and liquidity, in conjunction with medium profitability levels, for companies in that category might be strategically appealing on the grounds of their growth potential.
Such financial characteristics would not, however, appear to suffice to justify takeover bids when viewed from the standpoint of prudent investment. The foregoing should consequently be supplemented with prospective financial analysis for variables that initially induce takeovers may destroy value in adverse economic circumstances. The indebtedness assumed as a result of acquisitions, liquidity and solvency constraints, profitability and especially size placed the companies that opted to engage in concentration operations in a straightened financial position.
Lessons can be drawn from the acquisitions made in the real estate industry in the past to help identify correct and incorrect decisions and model future behaviour. Recurrent patterns of past behaviour in connection with acquisitions, together with financial analysis of the major variables involved, can be applied not only to predict future takeovers but to assess, a priori, their suitability or feasibility.
The explanatory capacity of the analysis paved the way for the development of a model to predict future takeovers in the presence of the circumstances identified.
The model proposed may be particularly useful under the present circumstances, in which: the real estate industry is contracting and restructuring, most companies have completed their post-crisis refinancing, business and price recovery is attracting new entrants, SAREB divestment is programmed for the years to come and the public sector is simplifying the applicable legislation in the pursuit of (especially international) investors.
All the foregoing will improve performance prospects, driving industry activity and enhancing its allure for possible further takeovers.
The ability to discriminate among and categorise the variables studied leaves room for optimism about the model's predictive capacity. Nonetheless, the testability of model utility, an issue that will be broached in future research, is contingent upon the recovery of the economy in general and the real estate industry in particular.
Conflict of interestThe authors declare no conflict of interest.
This information, not included hereunder for reasons of space, is available to readers on request.
Concentration operations logically increase the value of the variable size which, as noted by Alcalde et al. (2003) and Alcalde and Espitia (2002), is one of the main factors determining participation in takeover bids.

www.publicationethics.org.