Corporate social responsibility is a multidimensional concept that is often measured using diverse indicators. Composite indices can aggregate these single indicators into one measurement. This article aims to identify the key challenges in constructing a composite index for measuring corporate social responsibility. The process is illustrated by the construction of a composite index for measuring social outcomes in the electricity utility industry. The sample consisted of seventy-four companies from twenty-three different countries, and one special administrative region operating in the industry in 2011. The findings show that (1) the unavailability of information about corporate social responsibility, (2) the particular characteristics of this information and (3) the weighting of indicators are the main obstacles when constructing the composite index. We highlight than an effective composite index should has a clear objective, a solid theoretical background and a robust structure. In a practical sense, it should be reconsidered how researchers use composite indexes to measure corporate social responsibility, as more transparency and stringency is needed when constructing these tools.
La responsabilidad social corporativa es un concepto multidimensional que puede medirse de distintas formas. Una de ellas es a través de índices sintéticos o compuestos, instrumentos que permiten resumir la información de múltiples indicadores en una sola medida. Este artículo pretende identificar los desafíos que se presentan a la hora de construir un índice sintético para evaluar la responsabilidad social corporativa. Este proceso se ilustra a través de la construcción de un índice sintético para medir los resultados sociales de setenta y cuatro empresas que operan en la industria eléctrica, procedentes de veintitrés países diferentes y una región administrativa. Los resultados evidencian que la escasa disponibilidad de información de responsabilidad social corporativa y sus particulares características, así como determinar las ponderaciones a asignar a los indicadores, son los principales obstáculos para elaborar el índice sintético. Subrayamos que, para que un índice sintético se construya adecuadamente, sus objetivos han de estar claramente definidos, el marco teórico en el que se apoya ha de ser sólido y, además, ha de comprobarse si dicho índice es robusto, extremo que se considera muy relevante. Las implicaciones prácticas sugieren reconsiderar cómo se usan los índices sintéticos para medir la responsabilidad social corporativa, evidenciando que es necesaria más transparencia y rigor a la hora de construirlos.
Composite indices (CIs) aggregate different single indicators into one measure,1 summarizing multidimensional concepts (Grupp & Mogee, 2004). They are useful decision-making tools (Giambona & Vasallo, 2014) in the areas of sustainability, development, Human Rights and education, among others.
However, the use of CIs has also been criticized. For instance, Mitchell, May, & McDonald (1995) emphasized that CI measures without a sound theoretical background are flawed. Scott, Cocchi and Gemmell (2014) warned that some CIs are just arithmetic tools without a statistical basis. Moreover, Paruolo, Saisana and Saltelli (2013) and Salvati and Zitti (2009) highlighted the problem of compensability between indicators when high values of one indicator offset low values of another. Different types of indicators, continuous and categorical, should be mixed in some cases (Asselin, 2002). Although some authors have suggested using uncertainty and sensitivity analyses to test the robustness of CIs (Saisana, Saltelli & Tarantola, 2005; Singh, Murty, Gupta & Dikshit, 2012), such analyses are seldom carried out. Thus, we can assume that CIs are useful measurement tools, but only if they are constructed following a transparent process.
This study focuses on the measurement of Corporate Social Responsibility (CSR). Previous studies have shown that there are different measures and methods to do it (De la Cuesta, Pardo-Herrasti & Paredes-Gázquez, 2015; Martínez-García & Rodríguez, 2013). One of these measures is Corporate Social Performance (CSP), which encompasses policies, process and outcomes related to CSR (Wood, 2010). The use of CIs to measure CSR or CSP is widespread. While the authors of some studies construct their own CIs (Chen & Delmas, 2011; Van den Bossche, Rogge, Devooght & Van Puyenbroeck, 2010), others use those provided by CSR rating agencies (Ioannou & Serafeim, 2012; Miras-Rodríguez et al., 2014).
But, what kinds of problems arise when constructing a CI to measure CSR (CSR-CI)? This study aims to identify these problems and provide solutions to them, thus contributing to the CSR measurement literature. We illustrate these difficulties by constructing a CSR-CI to measure social outcomes in the electricity utility industry, attending to a specific dimension of CSR (social) and CSP (outcomes).
The article is structured as follows. The following section provides theoretical guidelines on how to construct a CI, attending to on the particularities of CSR. The section ‘Academic exercise and results’ applies the theory to the construction of the aforementioned CI. Discussion section discusses its implications in CSR research, and the last section includes the conclusions and limitations of the study.
Guidelines for constructing a composite indexThis section provides insight on how to construct a CSR-CI, adapting the guidelines of the handbook of the Organization for Economic Co-operation and Development (OECD) for constructing CIs (OECD, 2008, p. 20). We divided the construction process into six stages: (1) theoretical framework, (2) indicator selection, (3) exploratory analysis of indicators, (4) multivariate analysis, (5) normalization, weighting and aggregation and (6) uncertainty and sensitivity analyses.
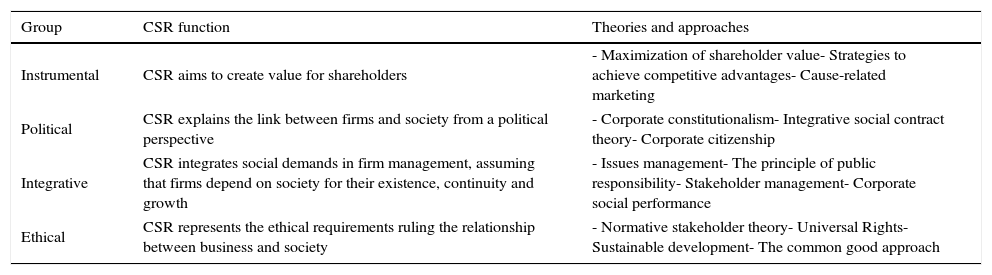
Theoretical frameworkA CI is not a single, isolated measure, but the outcome of a theoretical review that justifies its construction. In the case of a CSR, this task is particularly difficult due to the lack of consensus on the definition (Okoye, 2009). The definition of the CSR depends on how the concept is understood. Table 1 summarizes the four groups of theories and approaches to explain the meaning of CSR.
Groups of theories and approaches to define CSR.
| Group | CSR function | Theories and approaches |
|---|---|---|
| Instrumental | CSR aims to create value for shareholders | - Maximization of shareholder value- Strategies to achieve competitive advantages- Cause-related marketing |
| Political | CSR explains the link between firms and society from a political perspective | - Corporate constitutionalism- Integrative social contract theory- Corporate citizenship |
| Integrative | CSR integrates social demands in firm management, assuming that firms depend on society for their existence, continuity and growth | - Issues management- The principle of public responsibility- Stakeholder management- Corporate social performance |
| Ethical | CSR represents the ethical requirements ruling the relationship between business and society | - Normative stakeholder theory- Universal Rights- Sustainable development- The common good approach |
In cases like this, when there is no clear definition of a concept, we can use definitions proposed by international organizations. One of the definitions of CSR proposed by the European Commission includes aspects of the four groups of theories and approaches. The European Commission (2002, p. 3) defines CSR as “a concept whereby firms integrate social and environmental concerns in their business operations and in their interaction with their stakeholders on a voluntary basis”. Based on this definition, a CSR-CI theoretical framework should address these basic issues:
- -
Firm-focused concept. As indicated by its name, the concept focuses on the firms.
- -
Multidimensionality. Different distinctions of dimensions exist, such as sustainability-centered centered (Singh et al., 2012), triple bottom line (Elkington, 1997) or responsibilities of a business (Carroll, 1979), among others.
- -
Stakeholder orientation. Stakeholders’ expectations are taken into account through goals or benchmarks, which can be externally predefined (top-down approach) or set by the stakeholders themselves (bottom-up approach) (Khadka & Vacik, 2012; O’Connor & Spangenberg, 2008).
- -
Voluntariness. As the adoption of CSR is discretional, there may be CSR information shortages. More and more initiatives promote full or partial regulation of CSR and its disclosure (Williamson, Stampe-Knippel, & Weber, 2014), but information still remains scarce.
In summary, a CSR-CI theoretical framework should be firm-focused, multidimensional and stakeholder-oriented, but its application is conditioned by the availability of information. Thus, the construction of a CI is limited both by the theoretical framework and the information available.
Indicator selectionIndicators are tools which provide information on firms’ outcomes and promote institutional dialog (Vera, Langlois, Rogner, Jalal & Toth, 2005). CSR indicators are available from different sources. For instance, international organizations such as the World Bank and the United Nations disclose indicators related to CSR at the country level, while companies and CSR analyst organizations provide CSR indicators at the firm level.
CSR analyst organizations quantify firms’ CSR efforts. They gather CSR information publicly disclosed by firms as well as private information when available. Escrig-Olmedo, Muñoz-Torres, Fernández-Izquierdo and Rivera-Lirio (2013) distinguished four types of organizations that analyze CSR: rating agencies, information providers, and rankings and sustainability indices. Some rating agencies also provide information, such as MSCI ESG data (former KLD) or Thomson Reuters Asset4 non-financial information database, among others.
Rating agencies construct their own CSR ratings, which are often used as aggregated multidimensional measures of CSR or CSP (Wood, 2010). However, these ratings may neglect negative impacts of firms (Scalet & Kelly, 2010) and may have a weak or non-existent theoretical background (Wood, 2010). Furthermore, due to lack of transparency in the rating construction process (Bendell, 2010; Scalet & Kelly, 2010), missing data and outlier analyses are seldom disclosed or even carried out.
Despite these drawbacks, CSR ratings are firm-focused and multidimensional measures. They fulfill some of the basic prerequisites of the CSR-CI theoretical framework. With regard to stakeholder orientation, these ratings are not adapted to the needs and preferences of different stakeholders (Escrig-Olmedo et al., 2013). This problem not only affects CSR ratings, but also the selection of the CSR-CI indicators in general.
Specifically, since the process of consulting stakeholders has proven extremely time-consuming and expensive (Fraser, Dougill, Mabee, Reed & McAlpine, 2006), using a bottom-up approach to select indicators depends on the resources available to do it. If we follow a top-down approach, the selection of the CSR-CI indicators pursuing a stakeholder-oriented perspective depends on:
- -
The availability of CSR indicators. The sources of CSR indicators are mainly information providers, which gather publicly disclosed CSR information without transforming it.
- -
The goal or benchmark defined, which may be theoretical (e.g. expert judgements), political (e.g. policy targets) or statistical (e.g. optimization methods).
The fastest and easiest way to obtain a CSR-CI is to use CSR ratings, but only ratings whose construction process is transparent. The disadvantages of these measures can be overcome by constructing a CSR-CI that uses indicators from information providers and applies a top-down approach with goal or benchmark driven procedures. However, it is advisable to use a bottom-up approach for CSR-CI indicator selection for considering stakeholders’ situation (Asif, Searcy, Zutshi, & Fisscher, 2013).
Exploratory analysis of indicatorsOnce the indicators have been selected, their quality should be analyzed. We identified four aspects for analysis: indicator distribution, type of indicator, missing data and outliers.
Indicator distributionSome CI construction methods require indicators with normal distribution. However, this assumption hard to meet in social sciences, and especially in behavioral sciences (Valentine, Nam, Hollingworth & Hall, 2014). For example, indicators related to labor issues often violate the assumption of normal distribution (O’Boyle and Aguinis, 2012).
Type of indicatorBecause CSR addresses issues which are difficult to account for (Gray & Gray, 2011), CSR is commonly measured using categorical indicators in addition to continuous ones (i.e. Asset4 or KLD ratings). These indicators require special treatment:
- -
When there are five or more response categories, categorical indicators may be treated as continuous indicators (Rhemtulla, Brosseau-Liard & Savalei, 2012).
- -
When there are fewer than five response categories, categorical indicators can be summarized using item parceling, which combines indicators assigning them arbitrary weights (Matsunaga, 2008). The combination has to be feasible from both a theoretical and statistical perspective. In the first case, the indicators should have a common meaning. In the second case, the indicators should correlate. Correspondece analysis assess the correlations between categorical indicators. We stress that item parceling involves subjective judgments (Nicoletti, Scarpetta & Boylaud 1999).
Firms find it difficult to determine what to report and how to report it (Reynolds & Yuthas, 2008). Moreover, they may be reluctant to report negative information (Boiral, 2013). Thus, missing data or missing values are a considerable problem in CSR research. One solution is to assign to the missing data a value of zero, assuming poor performance or lack of transparency. If we are measuring disclosure, a value of zero punishes lack of transparency; however, if we are measuring performance, the zero susbtition leads to wrong results since it is is unknown the company's true performance.
The OECD (2008, p. 25) recommends using imputation to solve the problem of missing data. However, when a large percentage of data is missing, imputation may have negative effects, even if it done following strict guidelines. In order to choose an imputation method fitting the properties of our indicators, we need to analyze the pattern, mechanism and distribution of missing data:
- -
As firms sometimes fail to report information about their CSR efforts intentionally (Boiral, 2013; Bouten, Evaraert, Van Liedekerke, De Moor & Christiaens, 2011), CSR indicators usually have a non-monotone pattern, and their mechanism may not be missing completely at random.
- -
If the distributon of the indicators is not normal, as previously shown for CSR indicators, a solution is multiple imputation (Cameron & Trivedi, 2005, p. 927), a method that restores lost variability in a dataset as a whole (Graham, 2012, p. 7).
Due to compulsory requirements, large firms tend to report more CSR information than medium and small ones (Delbard, 2008). Furthermore, the magnitude of the indicators reported by large firms can be much greater than that reported by medium and small companies, and vice versa; e.g. more employees or more sales on average. Thus, outliers are also a concern in CSR research. The OECD (2008, p. 84) recommends removing outliers. If the missing data are imputed, outliers should be checked to improve the quality of the imputations (Quintano, Castellano & Rocca, 2010).
Multivariate analysis of indicatorsMultivariate analysis evaluate the adequacy of the dataset and facilitate the understanding of the methodological choices adopted in the construction of the CI (Bas Cerdá, 2014). The multivariate analysis methods used in this stage may also serve to estimate the weights of the indicators.
In this stage, we should check if the sign of the indicators is in accordance with the theoretical framework. If the sign is not in accordance with the theoretical framework, we can modify the values of the indicators through reverse scoring (Hair et al., 2009, p. 126).
Recent studies measure CSR using scale testing methods along with multivariate analysis (Gallardo-Vázquez, Sánchez-Hernández & Corchuelo-Martínez-Azúac, 2013; Pérez & Rodríguez del Bosque, 2013). Scale testing methods assess the dimensionality, reliability, concept reliability and concept validity of CSR scales. These methods are designed for Likert-type scales (Sheng & Sheng, 2012), so they are not suitable for analyzing mixed datasets (datasets containing both continuous and categorical indicators) and indicators without a normal distribution. Thus, scale testing methods should be used with caution when working with CSR information. We selected the multivariate analysis method attending to three factors: indicator distribution, concept dimensionality and indicator types, and sample size.
Indicator distributionIf indicators are not normally distributed, non-parametric methods such as principal component analysis (PCA) should be used to assess the internal structure of the CI. These methods do not make any assumption about the distribution of the indicators.
Concept dimensionality and indicator typesMultiple factor analysis (Escofier & Pagès, 1994) combines PCA and correspondence analysis to analyze mixed data and also takes into account dimensionality issues. Factor analysis for mixed data (Pagès, 2014) and generalized procrustes analysis (Pagès, 2014) also explore mixed data. De Leon and Chough (2013) propose methods for analyzing mixed data. An alternative to mixed data analysis methods is PCA using the polychoric correlation matrix as input data. This correlation matrix is suited for the analysis of correlations between continuous and categorical data.
Sample sizeIf we construct a CI for a specific industry or country where CSR information is scarce, sample size requirements may be hard to met. Furthermore, the more CSR information is required, the smaller the sample size gets. In PCA, the less demanding sample size rule three subjects per indicator is required (OECD, 2008, p. 66). Regularized exploratory factor analysis is recommended instead of PCA when sample size is less than 50 subjects (Jung & Lee, 2011), but this method is parametric. Finally, nonlinear iterative partial least squares (Wold, 1966) is suitable when the number of indicators is greater than the number of subjects.
Normalization, weighting and aggregationThis subsection does not aim to review the normalization, weighting and aggregation methods of CIs, but rather to identify how CSR affects their selection.
Normalization and weightingThe normalization of indicators is often a secondary decision linked to the weighting method. If, due to some of the aforementioned CSR indicator properties (e.g. non-normality or propensity for outliers), indicators are skewed or the difference between the highest and lowest value (range) is large, it is recommended a scale transformation (OECD, 2008, p. 83).
The weighting method establishes the importance of each indicator. A CSR-CI should be constructed considering previously established goals, using either a top-down or bottom-up approach. Data envelopment analysis (DEA), the benefit-of-doubt approach (BOD) or the analytic hierarchy process (AHP) are some of the many weighting methods available which incorporate these goals in the weight estimation process (Singh et al., 2012; Mondéjar-Jiménez & Vargas-Vargas, 2008).
A common weighting method is PCA (Gómez-Limón & Riesgo, 2009). However, this method is not goal-oriented, and the weights are difficult to interpret (Paruolo et al., 2013). Thus, PCA may not be a suitable weighting method for CSR indicators unless goals are taken into account before or after the estimation of the weights. In any case, each weighting method has its own limitations (Domínguez-Serrano, Blancas-Peral, Guerrero-Casas & González-Lozano, 2011).
AggregationThe aggregation of indicators usually depends on the weighting method chosen. There are two common aggregation procedures: linear and geometric. The linear procedure is criticized because it is compensatory (Paruolo et al., 2013; Salvati & Zitti, 2009). The geometric procedure does not allow zero values in an indicator; thus, it has limitations when missing data are replaced by zero and when firms score zero in an indicator. For these reasons, the geometric procedure may not be suitable for CSR indicators. These limitations may not exist when working with subdomains of multidimensional concepts. Alternative aggregation procedures such as treating weights as importance coefficients may also be appropriate (Munda, 2008, p. 111), especially if the weights are set by experts or through a stakeholder participation process.
Uncertainty and sensitivity analysesEach additional indicator added to a CI is a potential source of uncertainty or change in the score of the CI. The standard deviation of these indicators also affects this uncertainty. However, since CSR is a multidimensional concept, a large number of indicators can be included in the construction of a CSR-CI. Consequently, the robustness of the CSR-CI is jeopardized.
Uncertainty and sensitivity analyses test the robustness of a CI (Saisana et al., 2005; Singh et al., 2012). They also assess the uncertainty attributed to construction decisions that cannot be justified by theoretical reasons or data properties (García Aguña & Kovacevic, 2011). These decisions define the input factors, which are random variables affecting the calculation of the CI. Different combinations of input factors lead to different scores of the CI. Despite the importance of uncertainty and sensitivity analyses in testing the robustness of a CI, they are seldom performed (Saisana et al., 2005).
Academic exercise and resultsThis section applies the previous guidelines to the construction of a CSR-CI for measuring social outcomes in the electricity utility industry. We focused on a specific industry because CSR demands vary across industries (Cai, Jo, & Pan, 2012).
Theoretical frameworkThis subsection evidences the importance of measuring the social outcomes of the electricity utility industry. First, social outcomes can be defined as “those outcomes concerning the impacts a firm has on the social system within which it operates” (GRI, 2013). Electric utilities refer to firms engaged in the production, transmission, distribution and commercialization of electricity (Eurostat, 2008).
Different studies have found that the consumption of electricity is related to economic and social development (Ozturk, 2010; Shuddhasattwa & Salim, 2011). Specifically, a negative relationship has been reported between the accessibility and affordability of electricity and poverty (Legros et al., 2009; OECD and IEA, 2010; Takada & Charles, 2006). Electricity is so important that Tully (2006) states that the right to electricity should be included in the Universal Declaration of Human Rights. However, the social dimension is often relegated to the background as the industry pays more attention to environmental and economic issues (Gallego-Carrera & Mack, 2010; Schlör, Fischer & Hake, 2012). Thus, the objective of our CSR-CI is to explore the state of the social outcomes of the electricity utility industry.
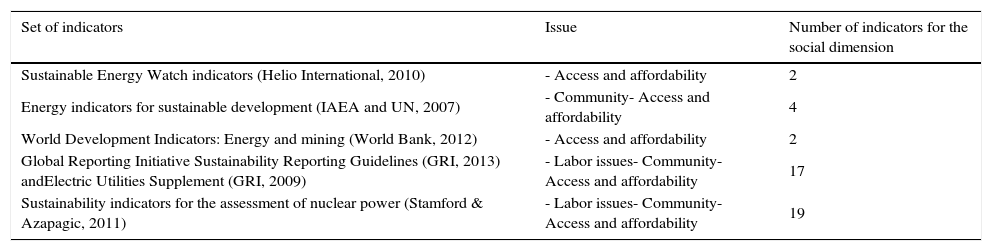
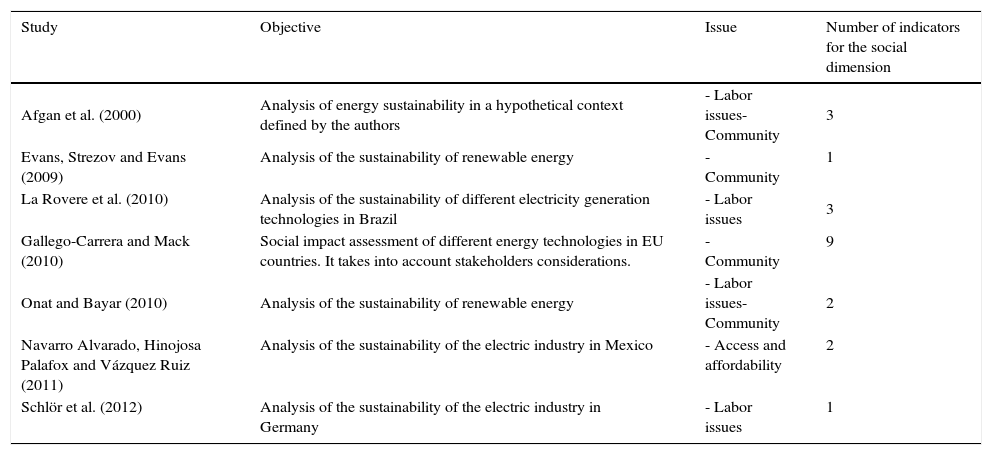
Table 2 identifies sets of indicators which measure the impact of the industry, highlighting the areas they cover and their contribution to the understating of the social dimension. Table 3 shows academic studies measuring CSR in the electricity utility industry and their contribution to the study of the social dimension.
Sets of indicators for measuring CSR in the electricity utility industry.
| Set of indicators | Issue | Number of indicators for the social dimension |
|---|---|---|
| Sustainable Energy Watch indicators (Helio International, 2010) | - Access and affordability | 2 |
| Energy indicators for sustainable development (IAEA and UN, 2007) | - Community- Access and affordability | 4 |
| World Development Indicators: Energy and mining (World Bank, 2012) | - Access and affordability | 2 |
| Global Reporting Initiative Sustainability Reporting Guidelines (GRI, 2013) andElectric Utilities Supplement (GRI, 2009) | - Labor issues- Community- Access and affordability | 17 |
| Sustainability indicators for the assessment of nuclear power (Stamford & Azapagic, 2011) | - Labor issues- Community- Access and affordability | 19 |
Academic studies related to CSR in the electricity utility industry.
| Study | Objective | Issue | Number of indicators for the social dimension |
|---|---|---|---|
| Afgan et al. (2000) | Analysis of energy sustainability in a hypothetical context defined by the authors | - Labor issues- Community | 3 |
| Evans, Strezov and Evans (2009) | Analysis of the sustainability of renewable energy | - Community | 1 |
| La Rovere et al. (2010) | Analysis of the sustainability of different electricity generation technologies in Brazil | - Labor issues | 3 |
| Gallego-Carrera and Mack (2010) | Social impact assessment of different energy technologies in EU countries. It takes into account stakeholders considerations. | - Community | 9 |
| Onat and Bayar (2010) | Analysis of the sustainability of renewable energy | - Labor issues- Community | 2 |
| Navarro Alvarado, Hinojosa Palafox and Vázquez Ruiz (2011) | Analysis of the sustainability of the electric industry in Mexico | - Access and affordability | 2 |
| Schlör et al. (2012) | Analysis of the sustainability of the electric industry in Germany | - Labor issues | 1 |
According to the CSR theoretical framework, if we want to assess how electric utilities contribute to social development, the CSR-CI should focus on stakeholders’ perception of how companies address the key issues in the industry. However, we were unable to find any studies fulfilling these conditions. Tables 2 and 3 show that the measurement of the social dimension in the industry is limited. From a theoretical perspective:
- -
Most studies adopt a macroeconomic approach where countries are the units of analysis.
- -
The social dimension is regarded as multidimensional, but each dimension or issue receives different attention. The tables identify up to four major key issues related to social outcomes in the electricity utility industry: Human Rights, electricity access and affordability, community impact and labor issues. Although socio-economic issues like employment or electricity consumption per capita are addressed in most studies, purely social issues like Human Rights, the impact of the electricity infrastructure on the community and electricity access and affordability of electricity are often missed.
- -
There is little evidence of the inclusion of stakeholders in the analyses of the social outcomes of firms (Gallego-Carrera & Mack, 2010).
While the CSR-CI should ideally address stakeholder expectations of the electric utilities operating around the world, we were unable to follow a bottom-up approach. There are no public goals for this industry in the social dimension to compare with. Nor did we find specific information on the expectations of stakeholders regarding the impact of this industry at a global scale. Similarly, there are no policies for setting specific goals for the industry at the firm level.
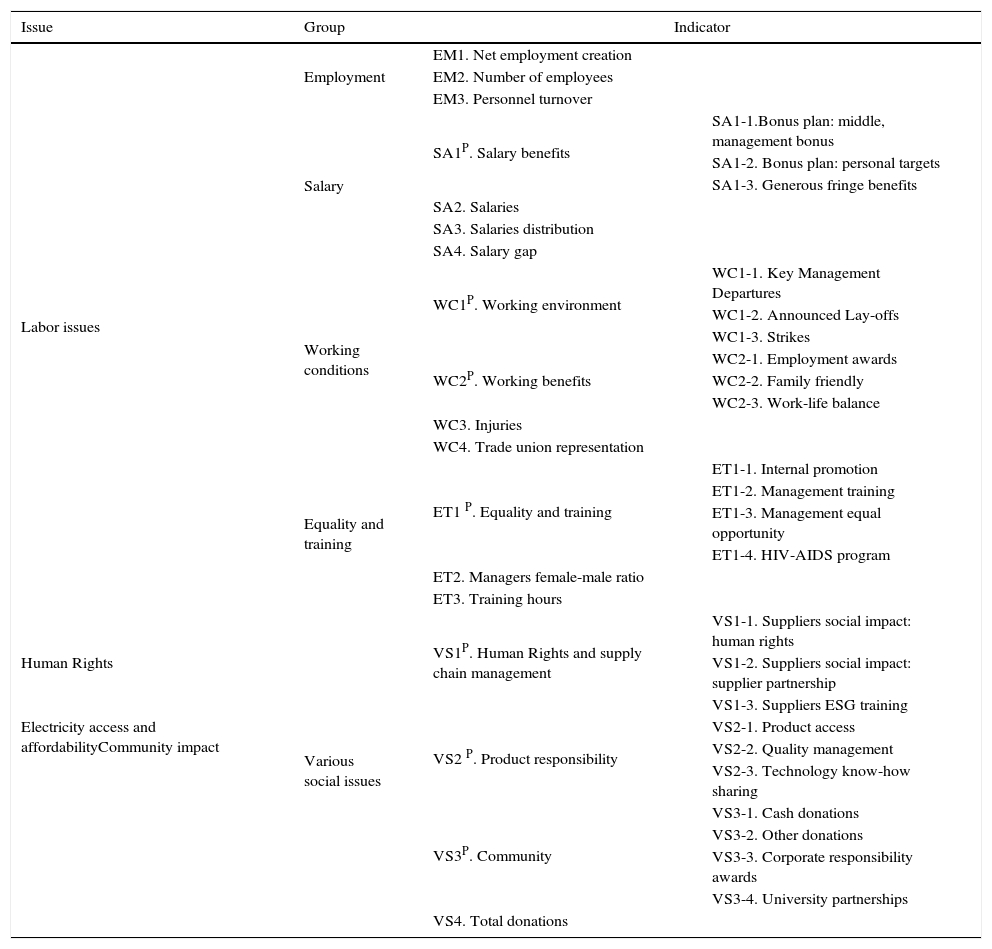
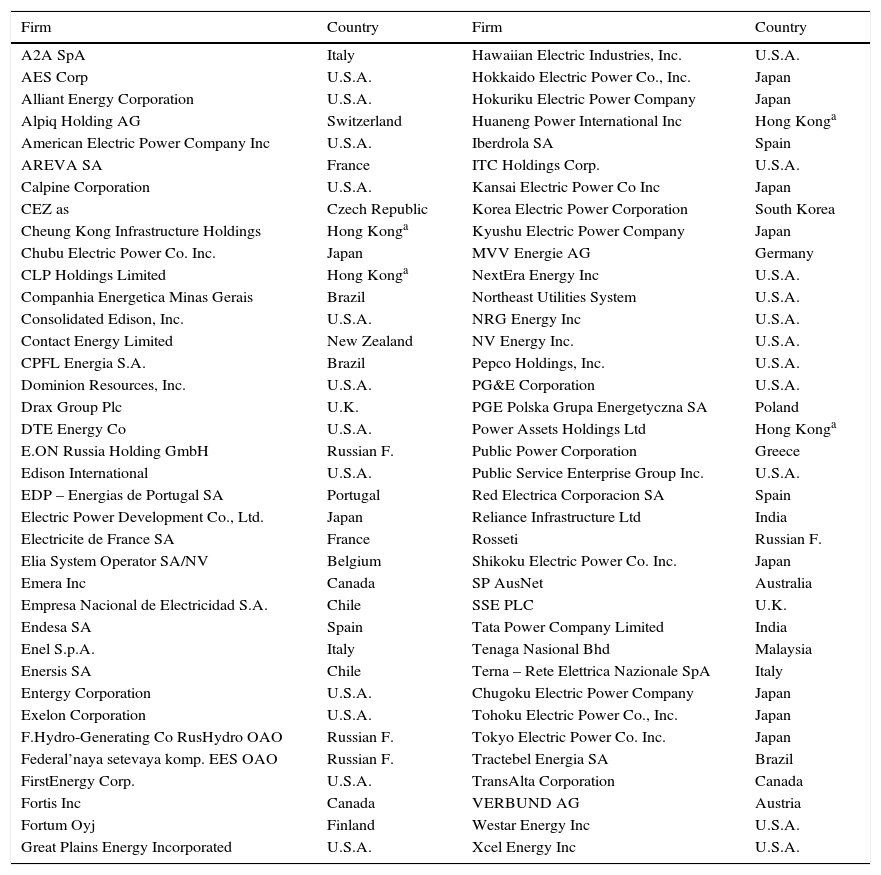
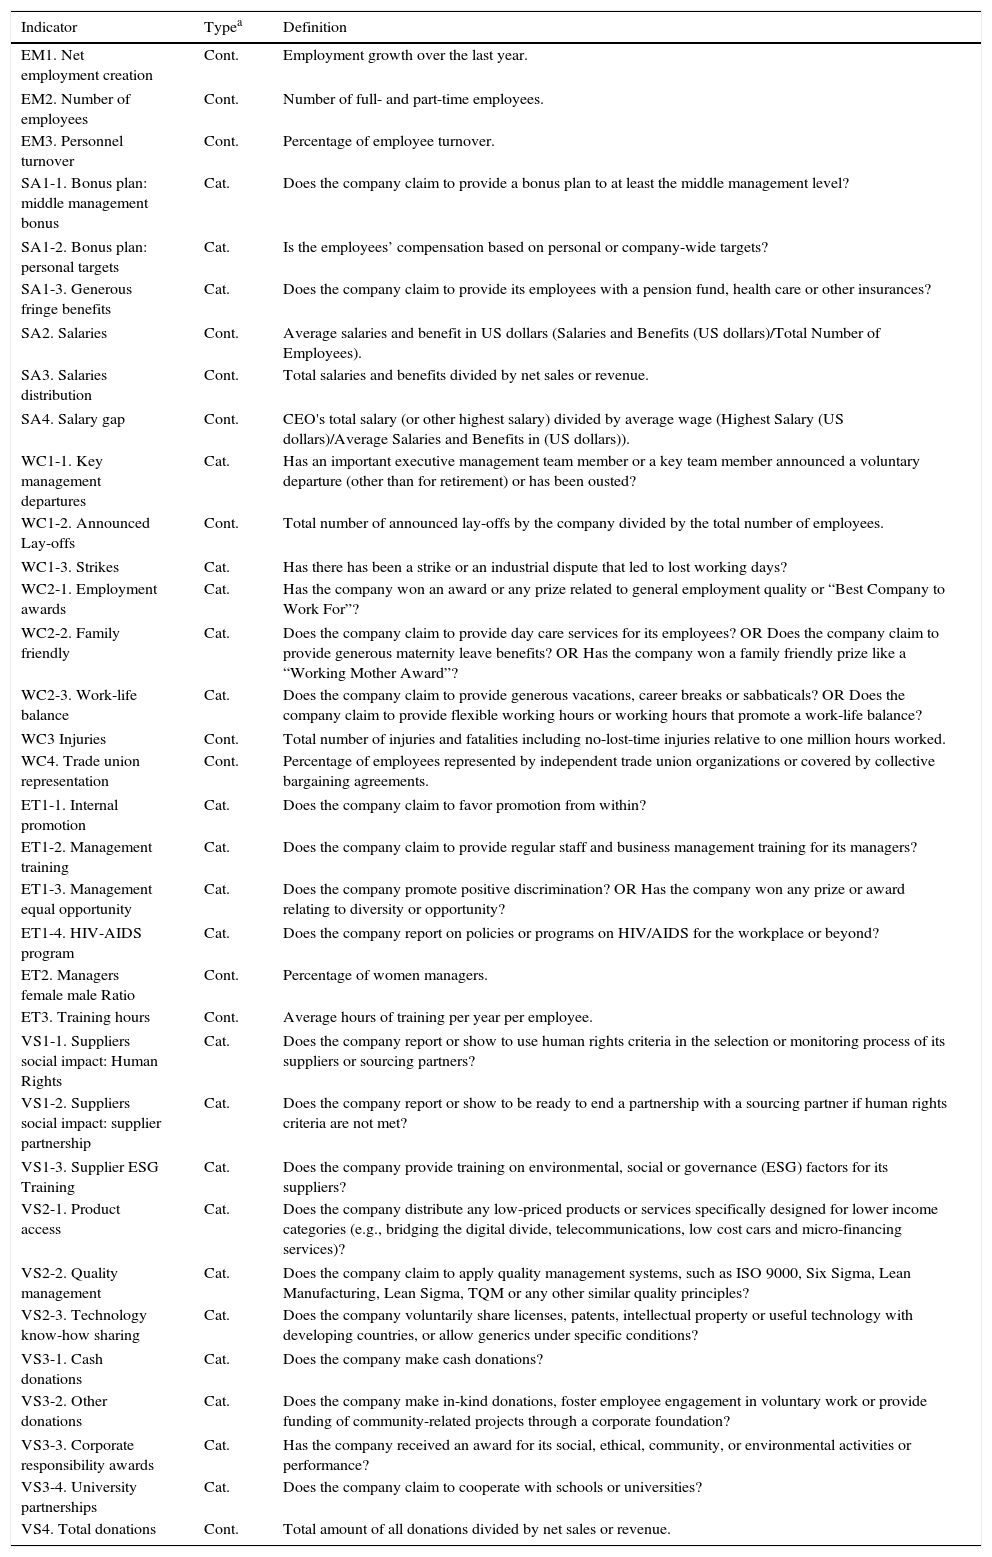
As an alternative, we followed a top-down approach with goal driven procedures. The CSR-CI was constructed using data from Asset4, a non-financial information database. As shown in Annex I, the sample of firms contained seventy-four firms from twenty-three different countries and one special administrative region operating in the electricity utility industry in 2011 (Thomson Reuters Business Classification, Code 591010). A total of fifty-four indicators concerning social outcomes are available in the database. Twenty of them were discarded because of the high rate of missing data (95% or more). Thus, thirty-four indicators were selected to construct the CSR-CI. Their classification according to the key issues identified in the literature review is shown in Table 4, and their definitions are available in Annex II. We included as many social outcomes as possible, bearing in mind that they should be related to the four issues identified in the literature. We assume that the greater the number of indicators included in the CSR-CI, the better it encompasses the social outcomes of the company.
Indicators included in the composite index.
| Issue | Group | Indicator | |
|---|---|---|---|
| Labor issues | Employment | EM1. Net employment creation | |
| EM2. Number of employees | |||
| EM3. Personnel turnover | |||
| Salary | SA1P. Salary benefits | SA1-1.Bonus plan: middle, management bonus | |
| SA1-2. Bonus plan: personal targets | |||
| SA1-3. Generous fringe benefits | |||
| SA2. Salaries | |||
| SA3. Salaries distribution | |||
| SA4. Salary gap | |||
| Working conditions | WC1P. Working environment | WC1-1. Key Management Departures | |
| WC1-2. Announced Lay-offs | |||
| WC1-3. Strikes | |||
| WC2P. Working benefits | WC2-1. Employment awards | ||
| WC2-2. Family friendly | |||
| WC2-3. Work-life balance | |||
| WC3. Injuries | |||
| WC4. Trade union representation | |||
| Equality and training | ET1 P. Equality and training | ET1-1. Internal promotion | |
| ET1-2. Management training | |||
| ET1-3. Management equal opportunity | |||
| ET1-4. HIV-AIDS program | |||
| ET2. Managers female-male ratio | |||
| ET3. Training hours | |||
| Human Rights | Various social issues | VS1P. Human Rights and supply chain management | VS1-1. Suppliers social impact: human rights |
| VS1-2. Suppliers social impact: supplier partnership | |||
| VS1-3. Suppliers ESG training | |||
| Electricity access and affordabilityCommunity impact | VS2 P. Product responsibility | VS2-1. Product access | |
| VS2-2. Quality management | |||
| VS2-3. Technology know-how sharing | |||
| VS3P. Community | VS3-1. Cash donations | ||
| VS3-2. Other donations | |||
| VS3-3. Corporate responsibility awards | |||
| VS3-4. University partnerships | |||
| VS4. Total donations | |||
P: Parceled indicators.
There are few indicators concerning the issues of Human Rights, electricity access and affordability and community impact. Thus, the CSR-CI mainly focuses on labor issues, the area with more available information. The other areas are also included to the extent there is information available. Given these limitations, the final objective of the CSR-CI is to be a first approach to the measurement of social outcomes in the electricity utility industry, identifying how labor issues and other issues are addressed by the firms.
Exploratory analysis of indicatorsOf the thirty-four selected indicators, twenty-three are categorical dichotomous and eleven are continuous. We used categorical scoring (Nicoletti et al., 1999) to aggregate dichotomous indicators into seven new indicators or parcels whose values ranged from one to seven (Table 4). A multiple correspondence analysis was carried out, revealing that each parcel accounts for at least 80% of the variance of the parceled indicators. The parcels are one-dimensional, as required by the item-parceling procedure (Matsunaga, 2008).
The final sample consisted of eleven continuous indicators and seven parceled indicators. Table 4 shows their classification into five groups: employment (three indicators), salary (four indicators), working conditions (four indicators), equality and training (three indicators) and various social issues (four indicators). The group of various social issues is heterogeneous and focuses on relevant social issues not included in the other groups.
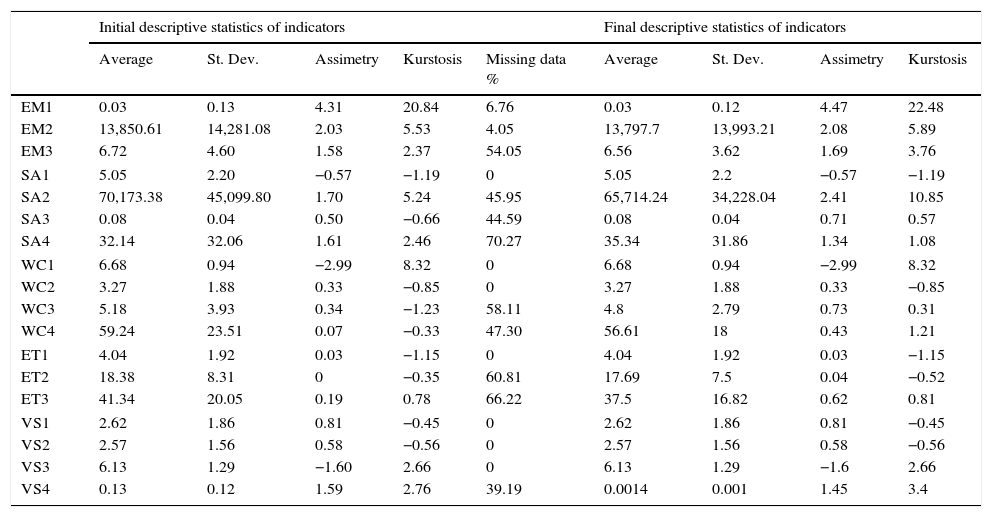
The initial descriptive statistics of the eighteen indicators are shown in Table 5. Outlier analysis was performed using box plots, QQ plots and the Mahalanobis distance. The analyses found that nine values could be considered outliers. These values were removed from the sample. The coefficients of skewness and kurtosis (asymmetry) indicate that most of indicators do not have a normal distribution.
Descriptive statistics.
| Initial descriptive statistics of indicators | Final descriptive statistics of indicators | ||||||||
|---|---|---|---|---|---|---|---|---|---|
| Average | St. Dev. | Assimetry | Kurstosis | Missing data % | Average | St. Dev. | Assimetry | Kurstosis | |
| EM1 | 0.03 | 0.13 | 4.31 | 20.84 | 6.76 | 0.03 | 0.12 | 4.47 | 22.48 |
| EM2 | 13,850.61 | 14,281.08 | 2.03 | 5.53 | 4.05 | 13,797.7 | 13,993.21 | 2.08 | 5.89 |
| EM3 | 6.72 | 4.60 | 1.58 | 2.37 | 54.05 | 6.56 | 3.62 | 1.69 | 3.76 |
| SA1 | 5.05 | 2.20 | −0.57 | −1.19 | 0 | 5.05 | 2.2 | −0.57 | −1.19 |
| SA2 | 70,173.38 | 45,099.80 | 1.70 | 5.24 | 45.95 | 65,714.24 | 34,228.04 | 2.41 | 10.85 |
| SA3 | 0.08 | 0.04 | 0.50 | −0.66 | 44.59 | 0.08 | 0.04 | 0.71 | 0.57 |
| SA4 | 32.14 | 32.06 | 1.61 | 2.46 | 70.27 | 35.34 | 31.86 | 1.34 | 1.08 |
| WC1 | 6.68 | 0.94 | −2.99 | 8.32 | 0 | 6.68 | 0.94 | −2.99 | 8.32 |
| WC2 | 3.27 | 1.88 | 0.33 | −0.85 | 0 | 3.27 | 1.88 | 0.33 | −0.85 |
| WC3 | 5.18 | 3.93 | 0.34 | −1.23 | 58.11 | 4.8 | 2.79 | 0.73 | 0.31 |
| WC4 | 59.24 | 23.51 | 0.07 | −0.33 | 47.30 | 56.61 | 18 | 0.43 | 1.21 |
| ET1 | 4.04 | 1.92 | 0.03 | −1.15 | 0 | 4.04 | 1.92 | 0.03 | −1.15 |
| ET2 | 18.38 | 8.31 | 0 | −0.35 | 60.81 | 17.69 | 7.5 | 0.04 | −0.52 |
| ET3 | 41.34 | 20.05 | 0.19 | 0.78 | 66.22 | 37.5 | 16.82 | 0.62 | 0.81 |
| VS1 | 2.62 | 1.86 | 0.81 | −0.45 | 0 | 2.62 | 1.86 | 0.81 | −0.45 |
| VS2 | 2.57 | 1.56 | 0.58 | −0.56 | 0 | 2.57 | 1.56 | 0.58 | −0.56 |
| VS3 | 6.13 | 1.29 | −1.60 | 2.66 | 0 | 6.13 | 1.29 | −1.6 | 2.66 |
| VS4 | 0.13 | 0.12 | 1.59 | 2.76 | 39.19 | 0.0014 | 0.001 | 1.45 | 3.4 |
For some indicators, such as SA4, ET3 and ET2, the percentage of missing data is high. In fact, Afgan, Carvalho and Hovanov (2000) stated that one of the main problems in the electricity utility industry is the absence and unreliability of data. We checked the properties of the indicators to determine how to treat these missing data. Visual inspection revealed a non-monotone pattern. As Little's test was not significant (p<0.000), the missing data were not completely random.
Given these missing data properties, we applied multiple imputation. Other studies of the electric utility industry (La Rovere, Soares, Oliveira & Lauria, 2010) also used estimation procedures to overcome the missing data limitation. Multiple imputation was performed using the fully conditional specification method, which is suitable for non-monotone missing data patterns (Van Buuren, Brand, Groothuis-Oudshoorn & Rubin, 2006). The imputation model applied was predictive mean matching, which ensures that imputed values are plausible. This model is appropriate when the normality assumption is not met (Horton & Lipsitz, 2001). The number of imputations should be similar to the percentage of missing data (White, Royston & Wood, 2011). We analyzed the convergence of the iterations and found no irregularities in the iteration patterns. We hereby obtained a complete dataset of indicators whose descriptive statistics are shown in Table 5.
Multivariate analysis of indicatorsThe multivariate analysis began began by examining the sign of the indicators. From a theoretical perspective, indicators EM3, SA4 and WC3 negatively affected the score of the CSR-CI, as higher values indicate worse social outcomes of the firm. Therefore, they were reversed. We also checked the relationship between indicators through polychoric correlations. The correlation matrix showed that none of the correlations were significant distinct from zero. The sample size has a firm to indicator ratio of 74:18 (equivalent to 4 firms for each variable).
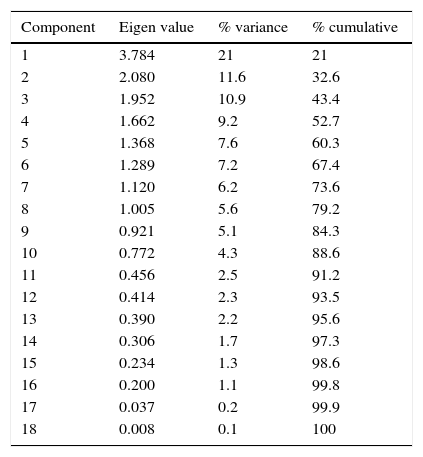
The chosen multivariate method should allow the use of mixed data and non-normally distributed indicators. We analyzed these data using factor analysis of mixed data (Pagès, 2014). The first five factors of the analysis accounted for 60.3% of the explained variance (Table 6), indicating a low correlation between the eighteen indicators. Chatterji, Levine and Toffel (2009) also found a low correlation between the subscores of a rating provided by a CSR analyst organization. When multidimensional concepts are analyzed, low correlations are not uncommon, but the removal of uncorrelated indicators implies that CSR-CI loses dimensionality.
Factor analysis of mixed data: eigenvalues.
| Component | Eigen value | % variance | % cumulative |
|---|---|---|---|
| 1 | 3.784 | 21 | 21 |
| 2 | 2.080 | 11.6 | 32.6 |
| 3 | 1.952 | 10.9 | 43.4 |
| 4 | 1.662 | 9.2 | 52.7 |
| 5 | 1.368 | 7.6 | 60.3 |
| 6 | 1.289 | 7.2 | 67.4 |
| 7 | 1.120 | 6.2 | 73.6 |
| 8 | 1.005 | 5.6 | 79.2 |
| 9 | 0.921 | 5.1 | 84.3 |
| 10 | 0.772 | 4.3 | 88.6 |
| 11 | 0.456 | 2.5 | 91.2 |
| 12 | 0.414 | 2.3 | 93.5 |
| 13 | 0.390 | 2.2 | 95.6 |
| 14 | 0.306 | 1.7 | 97.3 |
| 15 | 0.234 | 1.3 | 98.6 |
| 16 | 0.200 | 1.1 | 99.8 |
| 17 | 0.037 | 0.2 | 99.9 |
| 18 | 0.008 | 0.1 | 100 |
The weighting method we chose was the benefit-of-the-doubt (BOD) approach (Cherchye, Moesen, Rogge & Puyenbroeck, 2007). This method assumes that firms do not pay equal attention to all of the indicators but focus on those areas in which they perform better. The BOD approach reveals a firm's preferences, assigning greater weights to the indicators for which a firm has better performance (Shwartz, Burgess & Berlowitz, 2009).
The BOD approach expresses a CI as the ratio between the score of the firm and the score of a benchmark (expression (1)), where Iqc is the normalized (with the max-min method) score of the qth indicator (q=1,…,Q) for a firm c (c=1,…,M) and wqc the corresponding weight.
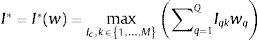
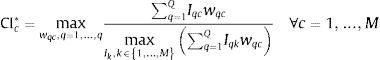
I* is the score of a hypothetical firm that maximizes overall performance defined as the weighted average given the (unknown) set of weights w (expression (2)).The optimal set of weights guaranteeing the best position for the firm compared to other firms is obtained by solving the constrained optimization problem of expression (3) (subject to non-negativity and normalization constraints on weights).The final score of a firm (CI*) is relative, since it depends on the score of the benchmark. The CI* score ranges from zero, when a firm has a score of zero for the indicators the benchmark outperforms, to one, when the firm is its own benchmark.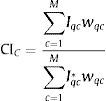
Cherchye et al. (2007) propose more restrictions to the expression (3). They suggest in this way, the score of the CI would include indicators representing the areas in which a firm shows both good and poor performance. Expression (4) shows the restriction; Sa captures the group of indicators a.
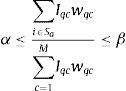
We applied the BOD approach with restrictions pertaining to category shares. Thus, while institutional factors are considered indirectly, firms are required to have a minimum performance in each of the five groups of indicators, regardless of whether the environment fosters performing well in them or not. With these additional restrictions, one per group of indicators, the weight of a group ranged between 0.1 and 0.3. This range resulted from the equal weighting of all groups (0.2 per group), given a leeway of 50% (±0.1 per group).
We solved the optimization problem using the Solver complement in Excel. For a given firm, the set of weights of the indicators included in the CSR-CI was calculated solving the optimization problem of expression (3), which was completed by adding the restriction of the expression (4). The resulting set of weights was applied to all of a firms in the sample; the one with the highest score (expression (2)) was the benchmark. The final score of a firm was obtained by applying expression (1). Ambiguities related to the different scales of measurement of the indicators were offset through the min-max normalization process.
The average score of the CSR-CI was 0.87 (σ=0.09). This score should be interpreted with caution, as it reflects the state of social outcomes in the electricity utility industry across firms. A high score does not mean the firm has achieved high social outcomes, but rather that the firm has better social outcomes than the rest of the firms of the industry. A discussion about the results of the CSR-CI and the weights of the indicators makes sense if the CSR-CI is robust, which we verify in the following subsection.
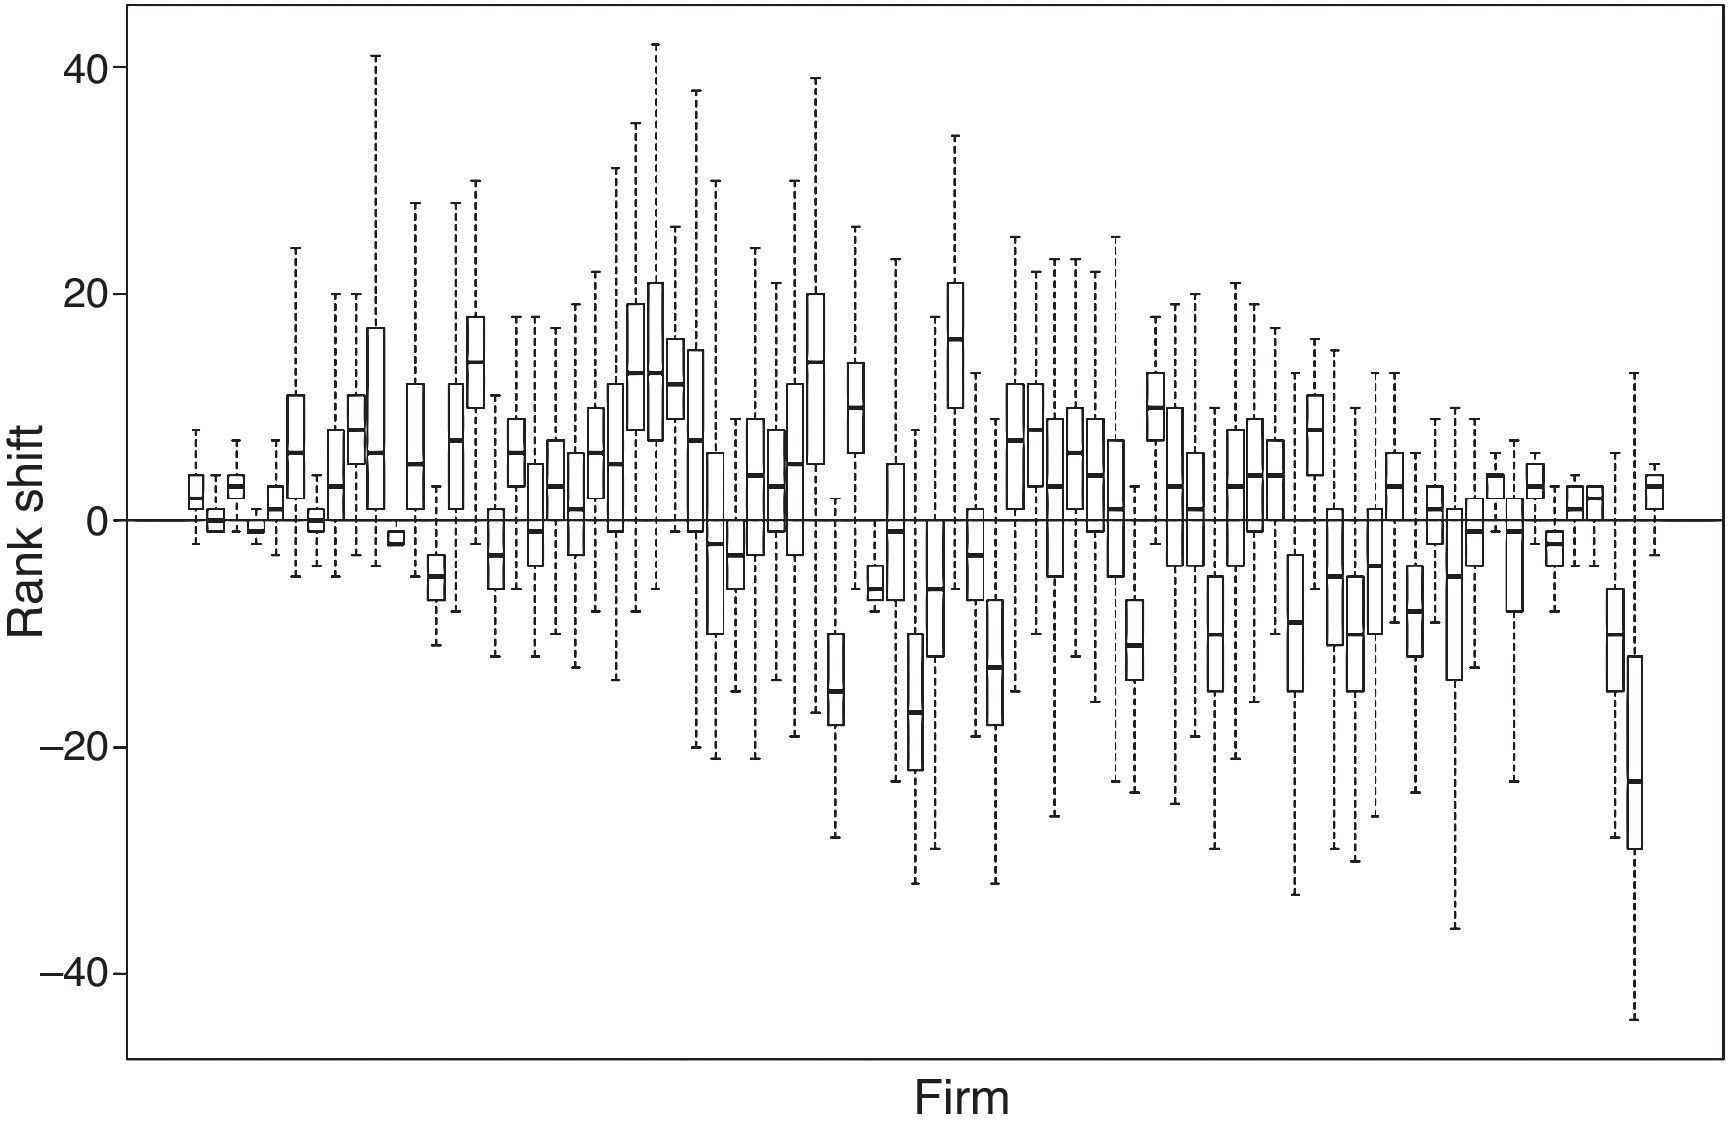
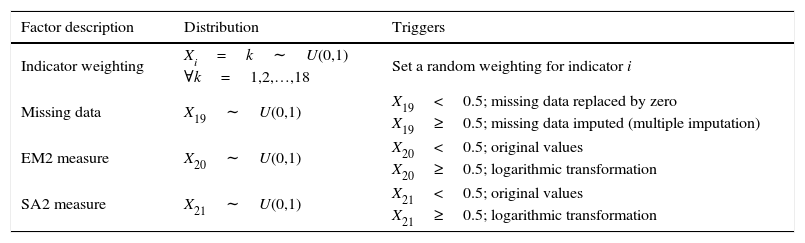
Uncertainty and sensitivity analysesThe construction of our CSR-CI entailed subjective or statistical decisions concerning the weighting method, the missing data treatment and the transformation of indicators. We assigned an input factor to each of these judgements. Table 7 shows the uncertainty factors of our CSR-CI and the triggers or thresholds for changing the treatment of their values. As usual in these analyses, each input factor followed a uniform distribution (U) (García Aguña & Kovacevic, 2011; Saisana et al., 2005). We generated 10,000 random draws of input factor combinations through a Monte Carlo simulation. For each combination, a new score of the CSR-CI was obtained. We calculated the shift in rank between the original rank of each firm and the rank of the firm in each random draw (Fig. 1).
Uncertainty analysis input factors.
| Factor description | Distribution | Triggers |
|---|---|---|
| Indicator weighting | Xi=k∼U(0,1) | Set a random weighting for indicator i |
| ∀k=1,2,…,18 | ||
| Missing data | X19∼U(0,1) | X19<0.5; missing data replaced by zero |
| X19≥0.5; missing data imputed (multiple imputation) | ||
| EM2 measure | X20∼U(0,1) | X20<0.5; original values |
| X20≥0.5; logarithmic transformation | ||
| SA2 measure | X21∼U(0,1) | X21<0.5; original values |
| X21≥0.5; logarithmic transformation | ||

Each box plot represents the shift in rank of a firm. The closer the shift is to the zero line, the more robust the CSR-CI is (i.e., there is no change in the ranking despite the new score of the CSR-CI). Box plots close to or at the zero line indicate that the rank of the firm hardly changes across the different simulations. However, as the shift is great for some firms, the CSR-CI is not robust for measuring their social outcomes.
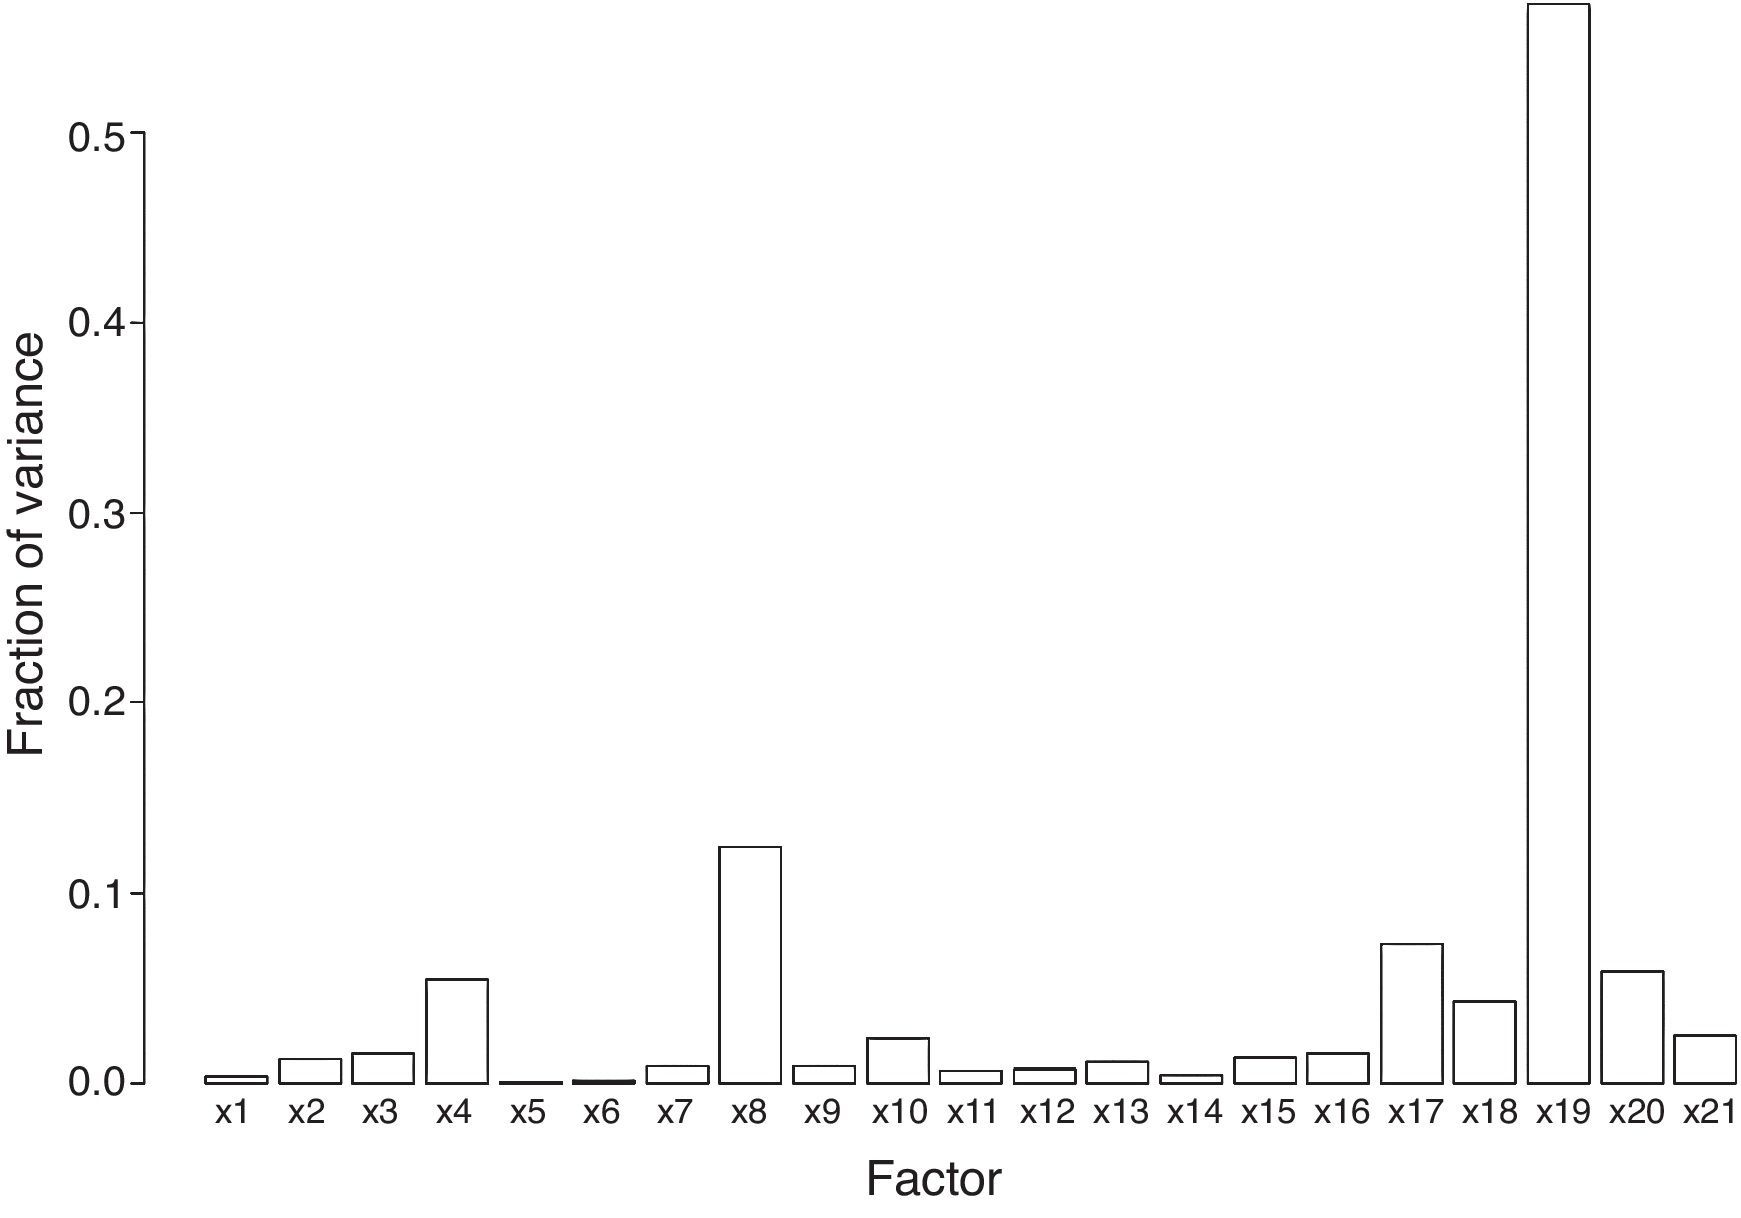
Sensitivity analysis identifies the input factors causing these shifts. For each random draw, we calculated the average shift in rank of the firms. Sensitivity analysis was performed on this average using the effective algorithm for computing global sensitivity indices (Plischke, 2010), which decomposed the variance of the CSR-CI. Fig. 2 shows the values of the first order indices of the sensitivity analysis.

Most of the change in the variance of the CSR-CI was due to missing data (input factor X19). If missing data are replaced by zero, firms lacking transparency score low in the CSR-CI and their position in the ranking changes substantially. Indeed, the box plots of Fig. 1 with a large range represent firms whose rank changes substantially when missing data are replaced by zero values. Thus, the less missing data, the more robust the CSR-CI is. These results indicate an important flaw in the CSR-CI: its score is not robust for most of the firms, as shown by the uncertainty analysis. According to the sensitivity analysis, this uncertainty is due to missing data.
DiscussionSince CSR is a multidimensional concept, a CI may be an adequate tool to measure it. However, the problems we identified when constructing the CSR-CI show that these indices should not be used deliberately. We identified two types of problems: those related to the availability of information and those related to technical issues.
The lack of available information affected the objective of the CSR-CI we constructed. We would have preferred a more ambitious CSR-CI, but we encountered two main limitations. The first one was the lack of information concerning key social issues of the electric utilities. We found few data concerning firms’ outcomes in Human Rights, electricity access and affordability and community impact. In order to construct a CSR-CI, a higher level of transparency needs to be reached. The second one was the lack of bottom-up established goals for the industry at the firm level. There are top-down goals such as the Millenium Development Goals (Modi, McDade, Lallement & Saghir, 2006; Valor, 2007), but they focus on the energy industry. The electricity utility industry need a global initiative stating social goals at the firm level which should be defined by their stakeholders (Wilde-Ramsing, 2013).
Problems in terms of technical issues were related to the properties of CSR data. Among them, we identified: mix of continuous and categorical indicators, non-normal distribution of indicators, lots of missing data, the presence of outliers, small sample sizes at the industry level and low correlations between indicators. These problems condition the weighting, normalization and aggregation methods chosen.
The homogenization of CSR measurement would minimize the impact of the mixed data problem, and better reporting should reduce missing data. CSR reporting standards are useful as a starting point to define which CSR indicators firms should report, but if we want robust CSR-CI indicators we need to go a step further and agree on a standard for measuring CSR.
A third type of problem would be the normalization, weighting and aggregation methods, but this aspect was not explored in the paper in depth. However, as shown by the sensitivity analysis, the weighting scheme has a minor effect on a firm's shift in rank, especially if we compare it to the one caused by missing data. This suggests that missing data is a more important problem in the robustness of a CSR-CI than issues related to the normalization, weighting and aggregation of indicators.
This study also found that correlations among indicators may be low. This result is a consecuence of the multidimensionality of CSR. Perhaps it is preferable to construct some CSR-CIs including few highly correlated indicators rather than a single CSR-CI including many low correlated indicators. Although CSR is multidimensional concept, this does not mean that a single measure capturing all its components, such as a CI, is an appropriate measure (Wood, 2010).
Another valuable finding is that uncertainty and sensitivity analyses should be performed to assess the robustness of the CSR-CI (Singh et al., 2012). In our case, the analyses evidence that the CSR-CI is not robust for measuring social outcomes. If we had not performed these analyses and had used the indicator to test hypotheses, we would have obtained misleading results.
Summarizing, transparency during the construction of CSR-CIs is essential. It allows the quality of the information to be assessed as well as its properties. If we are unable to assess the quality of the information, the CSR-CI might be flawed. We also stress that it is necessary to test the robustness of the final CSR-CI through uncertainty and sensitivity analyses, since these analyses uncover the limitations of the CSR-CI.
ConclusionWe constructed a CSR-CI for measuring social outcomes in the electricity utility industry, describing the difficulties of working with CSR information and proposing solutions. This study contributes to a better understanding of (1) the properties of CSR information and (2) the construction of CIs for CSR research.
The construction of a CSR-CI is a complex task requiring conditions which are difficult to meet in practice: perhaps an impossible mission. The process entails subjective decisions which require an understanding of the CSR concept and an assessment of the properties of CSR indicators.
In a practical sense, we should reconsider how we use CIs to measure CSR. If we want reliable measures, their construction should be rigorous and transparent throughout the stages of the process and uncertainty and sensitivity analyses should always be performed.
Since this study questions the reliability of CSR-CI indicators, it also has implications for past research. Most CSR research, and specially that relating CSR and financial performance, has been carried out using ratings as a composite measure of CSR. We have not found any studies which applied uncertainty and sensitivity analyses to these ratings. Thus, these measures may have flaws similar to the ones identified in this study. Indeed, these ratings have been seriously criticized. Although these organizations play a key role gathering and providing CSR information, what is questionable is the misuse of these ratings by researchers, since the final decision about which measure of CSR to choose is in our hands. This is a call to the academic community for more stringency when using aggregated measures of CSR in our research.
A limitation of this study is that the CI constructed is industry-specific and just focuses on the social dimension. However, since this industry was used for illustrative purposes, the properties and problems of CSR information identified remain valid.
Conflicts of interestThe authors declare that there are no conflicts of interest.
The authors give thanks to the assistance provided by the Chair Telefónica UNED in Corporate Responsibility and Sustainability in accessing the Asset4 database and the financial help from the Spanish Science and Innovation Ministry (Research Project ECO2011-26171). Special thanks to Clara García Aguña, from the OECD Economics Department.
| Firm | Country | Firm | Country |
|---|---|---|---|
| A2A SpA | Italy | Hawaiian Electric Industries, Inc. | U.S.A. |
| AES Corp | U.S.A. | Hokkaido Electric Power Co., Inc. | Japan |
| Alliant Energy Corporation | U.S.A. | Hokuriku Electric Power Company | Japan |
| Alpiq Holding AG | Switzerland | Huaneng Power International Inc | Hong Konga |
| American Electric Power Company Inc | U.S.A. | Iberdrola SA | Spain |
| AREVA SA | France | ITC Holdings Corp. | U.S.A. |
| Calpine Corporation | U.S.A. | Kansai Electric Power Co Inc | Japan |
| CEZ as | Czech Republic | Korea Electric Power Corporation | South Korea |
| Cheung Kong Infrastructure Holdings | Hong Konga | Kyushu Electric Power Company | Japan |
| Chubu Electric Power Co. Inc. | Japan | MVV Energie AG | Germany |
| CLP Holdings Limited | Hong Konga | NextEra Energy Inc | U.S.A. |
| Companhia Energetica Minas Gerais | Brazil | Northeast Utilities System | U.S.A. |
| Consolidated Edison, Inc. | U.S.A. | NRG Energy Inc | U.S.A. |
| Contact Energy Limited | New Zealand | NV Energy Inc. | U.S.A. |
| CPFL Energia S.A. | Brazil | Pepco Holdings, Inc. | U.S.A. |
| Dominion Resources, Inc. | U.S.A. | PG&E Corporation | U.S.A. |
| Drax Group Plc | U.K. | PGE Polska Grupa Energetyczna SA | Poland |
| DTE Energy Co | U.S.A. | Power Assets Holdings Ltd | Hong Konga |
| E.ON Russia Holding GmbH | Russian F. | Public Power Corporation | Greece |
| Edison International | U.S.A. | Public Service Enterprise Group Inc. | U.S.A. |
| EDP – Energias de Portugal SA | Portugal | Red Electrica Corporacion SA | Spain |
| Electric Power Development Co., Ltd. | Japan | Reliance Infrastructure Ltd | India |
| Electricite de France SA | France | Rosseti | Russian F. |
| Elia System Operator SA/NV | Belgium | Shikoku Electric Power Co. Inc. | Japan |
| Emera Inc | Canada | SP AusNet | Australia |
| Empresa Nacional de Electricidad S.A. | Chile | SSE PLC | U.K. |
| Endesa SA | Spain | Tata Power Company Limited | India |
| Enel S.p.A. | Italy | Tenaga Nasional Bhd | Malaysia |
| Enersis SA | Chile | Terna – Rete Elettrica Nazionale SpA | Italy |
| Entergy Corporation | U.S.A. | Chugoku Electric Power Company | Japan |
| Exelon Corporation | U.S.A. | Tohoku Electric Power Co., Inc. | Japan |
| F.Hydro-Generating Co RusHydro OAO | Russian F. | Tokyo Electric Power Co. Inc. | Japan |
| Federal’naya setevaya komp. EES OAO | Russian F. | Tractebel Energia SA | Brazil |
| FirstEnergy Corp. | U.S.A. | TransAlta Corporation | Canada |
| Fortis Inc | Canada | VERBUND AG | Austria |
| Fortum Oyj | Finland | Westar Energy Inc | U.S.A. |
| Great Plains Energy Incorporated | U.S.A. | Xcel Energy Inc | U.S.A. |
| Indicator | Typea | Definition |
|---|---|---|
| EM1. Net employment creation | Cont. | Employment growth over the last year. |
| EM2. Number of employees | Cont. | Number of full- and part-time employees. |
| EM3. Personnel turnover | Cont. | Percentage of employee turnover. |
| SA1-1. Bonus plan: middle management bonus | Cat. | Does the company claim to provide a bonus plan to at least the middle management level? |
| SA1-2. Bonus plan: personal targets | Cat. | Is the employees’ compensation based on personal or company-wide targets? |
| SA1-3. Generous fringe benefits | Cat. | Does the company claim to provide its employees with a pension fund, health care or other insurances? |
| SA2. Salaries | Cont. | Average salaries and benefit in US dollars (Salaries and Benefits (US dollars)/Total Number of Employees). |
| SA3. Salaries distribution | Cont. | Total salaries and benefits divided by net sales or revenue. |
| SA4. Salary gap | Cont. | CEO's total salary (or other highest salary) divided by average wage (Highest Salary (US dollars)/Average Salaries and Benefits in (US dollars)). |
| WC1-1. Key management departures | Cat. | Has an important executive management team member or a key team member announced a voluntary departure (other than for retirement) or has been ousted? |
| WC1-2. Announced Lay-offs | Cont. | Total number of announced lay-offs by the company divided by the total number of employees. |
| WC1-3. Strikes | Cat. | Has there has been a strike or an industrial dispute that led to lost working days? |
| WC2-1. Employment awards | Cat. | Has the company won an award or any prize related to general employment quality or “Best Company to Work For”? |
| WC2-2. Family friendly | Cat. | Does the company claim to provide day care services for its employees? OR Does the company claim to provide generous maternity leave benefits? OR Has the company won a family friendly prize like a “Working Mother Award”? |
| WC2-3. Work-life balance | Cat. | Does the company claim to provide generous vacations, career breaks or sabbaticals? OR Does the company claim to provide flexible working hours or working hours that promote a work-life balance? |
| WC3 Injuries | Cont. | Total number of injuries and fatalities including no-lost-time injuries relative to one million hours worked. |
| WC4. Trade union representation | Cont. | Percentage of employees represented by independent trade union organizations or covered by collective bargaining agreements. |
| ET1-1. Internal promotion | Cat. | Does the company claim to favor promotion from within? |
| ET1-2. Management training | Cat. | Does the company claim to provide regular staff and business management training for its managers? |
| ET1-3. Management equal opportunity | Cat. | Does the company promote positive discrimination? OR Has the company won any prize or award relating to diversity or opportunity? |
| ET1-4. HIV-AIDS program | Cat. | Does the company report on policies or programs on HIV/AIDS for the workplace or beyond? |
| ET2. Managers female male Ratio | Cont. | Percentage of women managers. |
| ET3. Training hours | Cont. | Average hours of training per year per employee. |
| VS1-1. Suppliers social impact: Human Rights | Cat. | Does the company report or show to use human rights criteria in the selection or monitoring process of its suppliers or sourcing partners? |
| VS1-2. Suppliers social impact: supplier partnership | Cat. | Does the company report or show to be ready to end a partnership with a sourcing partner if human rights criteria are not met? |
| VS1-3. Supplier ESG Training | Cat. | Does the company provide training on environmental, social or governance (ESG) factors for its suppliers? |
| VS2-1. Product access | Cat. | Does the company distribute any low-priced products or services specifically designed for lower income categories (e.g., bridging the digital divide, telecommunications, low cost cars and micro-financing services)? |
| VS2-2. Quality management | Cat. | Does the company claim to apply quality management systems, such as ISO 9000, Six Sigma, Lean Manufacturing, Lean Sigma, TQM or any other similar quality principles? |
| VS2-3. Technology know-how sharing | Cat. | Does the company voluntarily share licenses, patents, intellectual property or useful technology with developing countries, or allow generics under specific conditions? |
| VS3-1. Cash donations | Cat. | Does the company make cash donations? |
| VS3-2. Other donations | Cat. | Does the company make in-kind donations, foster employee engagement in voluntary work or provide funding of community-related projects through a corporate foundation? |
| VS3-3. Corporate responsibility awards | Cat. | Has the company received an award for its social, ethical, community, or environmental activities or performance? |
| VS3-4. University partnerships | Cat. | Does the company claim to cooperate with schools or universities? |
| VS4. Total donations | Cont. | Total amount of all donations divided by net sales or revenue. |