

The analysis of new cardiovascular risk factors is under an extensive debate in the cardiology and metabolic research fields.
ObjectiveTo determine the main factors that contribute to the classification of individuals with higher coronary risk in the adult population from Maracaibo, Venezuela.
MethodsA descriptive, cross-sectional study with multistage random sampling in 1379 individuals belonging to the Maracaibo City Metabolic Syndrome Prevalence Study (MMSPS) was performed. They were classified according to the coronary risk by Framingham-Wilson equation adapted to our population. The association between various risk factors was evaluated by ordinal logistic regression models.
Results1,379 subjects (females 55.9%; n=771) were evaluated, 66.2% (n=913) were classified with low coronary risk. In univariate (χ2=112.35; p<0.00001) and multivariate analysis [OR: 3.98 (2.39-6.63); p<0.01], the main factors associated to be classified as the highest risk category were hypertriglyceridemia.
ConclusionThere are several factors that should be included in predictive models use worldwide. The most important in our population were dyslipidemia such as hypertriglyceridemia, hyperlipoproteinemia (a) and insulin resistance.
El análisis de nuevos factores de riesgo cardiovascular constituye un tema de amplio debate en la investigación cardio-metabólica.
ObjetivoDeterminar los principales factores que contribuyen a la clasificación de sujetos en las categorías de mayor riesgo coronario en individuos adultos de la ciudad de Maracaibo, Venezuela.
MétodosEstudio descriptivo, trasversal con muestreo aleatorio multietapas en 1.379 individuos pertenecientes al Estudio de Prevalencia de Síndrome Metabólico de la Ciudad de Maracaibo (EPSMM). Estos fueron clasificaron de acuerdo con el riesgo coronario mediante la fórmula Framingham-Wilson adaptada para nuestra población. Se evaluó la asociación entre diversos factores de riesgo mediante un modelo de regresión logística ordinal.
ResultadosSe evaluaron 1.379 sujetos (mujeres: 55,9%; n=771), de los cuales un 66,2% (n=913) fueron clasificados en riesgo coronario bajo. Tanto en el contexto univariante (χ2=112,35; p<0,00001) como multivariante [OR: 3,98 (2,39-6,63); p<0,01] el principal factor asociado para ser clasificado en las categorías de riesgo más elevado fue la hipertrigliceridemia.
ConclusiónExisten numerosos factores que deberían ser incluidos en los modelos de predicción empleados en el mundo, en cuyo caso las dislipidemias: hipertrigliceridemia, hiperlipoproteinemia (a), e insulinorresistencia son las más importantes en nuestra población.
Since the mid-twentieth century the study of cardiovascular risk factors has represented a high priority issue in the global epidemiology field, given the progressive increase in the last decades for the incidence of risk factors and cardiovascular disease,1 which have been discovered and added into the estimation systems for large studies like Framingham, SCORE, PROCAM, QRISK, among others.2
However, there are a growing group of variables that plays an important role in cardiovascular disease and that are still under discussion, whether for their role as simple biomarkers or as truly mediators independently associated with the development and progression of atherosclerosis in the clinical practice.3 Also, its appearance has led to the conformation of various subgroups of individuals according to the presence or absence of obesity. These subgroups have been defined as metabolic phenotypes and whose importance in the practical has been debated in recent years.4
Based on these scenarios, our research team has previously calibrated the Framingham-Wilson equation for more specific assessment of coronary risk in our population,5 likewise assessed the epidemiological behavior of some innovative risk factors.6 Although these findings were made in a univariate context, they demonstrated the potential effect of these variables on the occurrence of a coronary event. Therefore, the aim of this study was to determine the main factors that contribute to the classification of individuals with higher coronary risk in the adult population from Maracaibo, Venezuela and thereby establish additional control strategies to those established risk factors.
Materials and methodsSample selectionThis report is part of the Maracaibo City Metabolic Syndrome Prevalence Study, a cross-sectional study which purpose was to identify metabolic syndrome and cardiovascular risk factors in the adult population from Maracaibo, the second largest city of Venezuela. The sample (1,986 individuals) was calculated based on estimations of the population of the city by our National Institute of Statistics (1,428,043 inhabitants for the year 2007). A total of 244 subjects (12%) were added for oversampling, in order to increase accuracy of the estimates obtained from smaller subgroups from the overall sample, amounting to a total of 2,230 individuals. Maracaibo is divided in parishes, each of which was proportionally sampled with a multistage cluster method: In the first stage, clusters were represented by sectors from each of the 18 parishes, selecting 4 from each parish by simple randomized sampling. In the second phase, clusters were represented by city blocks within each sector, which were selected by simple randomized sampling. Further details of the sampling process have been previously published elsewhere.7
Calibration of the Framingham-Wilson equation for the population of MaracaiboFrom the 2,230 individuals selected include those below 30 and over 74 years old as well as those with a history of ischemic heart disease (for the application of the equation and its calibration),5 a final sample number of 1,379 individuals was obtained for this arm of the study.
For proper equation calibration, the constants in the formula regarding major cumulative coronary events (lethal and non-lethal myocardial infarction, symptomatic and non symptomatic angina) were substitute with the local statistics obtained from the Vital Statistics Yearbook of the State of Zulia from 2008, where the morbidity and mortality for cardiovascular diseases is registered. The results were obtained from the sum of all the lethal and non-lethal myocardial infarction divided by the population at risk to suffer such events in a given year. Since the real number of cases of silent myocardial infarction and anginas was unknown, a similar proportion to Framingham's was used, just as other studies have done.8–10 The applied formula was:
Where H0(t)/FramAll represents the rate of coronary events including silent myocardial infarction and angina in Framingham, H0(t)/FramMajor is the rate of lethal and non-lethal myocardial infarction, and t is the time of follow-up, which in our case is 10 years. For the estimation of coronary risk the Framingham equation was applied,8 analyzing a risk model at 10 years of presenting myocardial infarction (lethal or non-lethal), symptomatic or not, or angina. The subjects were classified in 4 categories: low risk <5%, moderate risk 5-9.9%, high risk 10-19.9%, and very high risk ≥ 20%.5Ethical considerations
All individuals enrolled in the study signed a written informed consent before undergoing physical examination and blood sample collection. All procedures were approved by the Ethics Committee of the Endocrine and Metabolic Diseases Research Center of The University of Zulia, Maracaibo, Venezuela.
Subjects evaluationData were collected through completion of a full clinical record carried out by trained personnel, which included gathering information regarding ethnic origin, past medical and family history. Likewise, socioeconomic status was classified according to the Graffar scale modified by Méndez-Castellano.11 Personal history of tobacco or cigarette use was assessed by requesting the total ongoing time of the established habit, as well as the amount of units consumed per day. Subjects that quitted this habit for more than 1 year continuously were considered former smokers. As for alcohol consumption, those who had ≥1 gram daily alcohol intake were considered “consumers”.12 The International Physical Activity Questionnaire (IPAQ) was used to evaluate physical activity. For the statistical analysis only the leisure time sub-sphere was taken into account, because of the overestimation of global physical activity in our population when all 4 IPAQ spheres (Work, Active Transportation, Home, Leisure Time) are assessed through the IPAQ Scoring protocol.13 Once the data was obtained in the leisure time sphere, it was divided in two big groups, individuals with MET's=0 (Inactive) and those with METs >0. Afterwards, this last group was divided into quintiles, obtaining the following classification: (Q1 or very low: [male: <296,999; female: <230,999], Q2 or low: [male: 297,000-791,999; female: 231,000-445,499], Q3 or moderate: [male: 792,000-1532,399; female: 445,500-742,499], Q4 or high: [male: 1532,400-2879,999; female: 742,500-1798,499], Q5 or very high: [male: ≥2879,000; female: ≥1798,500]).
Clinical assessmentArterial blood pressure was evaluated using the auscultatory method with a calibrated sphygmomanometer to perform 3 separate blood pressure measurements 5minutes apart, choosing the highest obtained values when measured at different times. Hypertension was classified according to the Fifth Report of the Joint National Committee on Prevention, Detection, Evaluation, and Treatment of High Blood Pressure (JNC-5),14 which was chosen to properly compare the results with previous recalibrations of the formula.
In regards of anthropometric evaluation, waist circumference values were determined using the established NIH anatomical parameters: a point equidistant to the costal lower margin and the anterior superior iliac spine.15 Weight was determined using a digital weighing scale, while height values were obtained with a vertical tape measure calibrated in centimeters and millimeters; subjects had their feet bare and all clothing which could alter the determinations were removes. For the quantification of the body mass index (BMI), the (weight/height2) formula was utilized, expressed in kg/m2.
Laboratory analysisAfter 8-10hours of fasting the following parameters were evaluated. For blood glucose levels, the enzymatic-colorimetric method was applied using glucose oxidase (SIGMA, USA). Plasma concentration of total cholesterol, HDL-C, triglycerides (TAG) and high sensitivity–C reactive protein (hs-CRP) were determined using commercial kits (Human Gesellschaft für Biochemica and Diagnostica, Wisbaden, Germany). LDL-C and VLDL-C levels were calculated using the Friedewald formula.16 When the triglycerides levels were above 400mg/dl, the lipoprotein fractions were determined using agarose gel electrophoresis with posterior optic densitometry (GS-800 densitometer; BioRad. USA). Fasting insulin levels were determined with DRG INTERNATIONAL INC. NEW JERSEY, USA insulin kits. For the calculation of insulin resistance (IR), the HOMA2-IR model proposed by Levy et al.17 was applied using the HOMACalculator v2.2.2, software which also calculates HOMA2-βcell and HOMA2-S. Lipoprotein (a) [Lp(a)] was estimated through the latex turbidimetric method (Human Gesellschaft für Biochemica and Diagnostica, Germany).
DefinitionsThe subjects were classified as: normal weight (<25kg/m2), overweight (25-29.9kg/m2) and obese (≥30kg/m2) as per WHO criteria.18 Abdominal obesity was defined according to waist circumference values in females ≥90cm or in males ≥95 cm.19 Impairment fasting glucose was defined according to the criteria of the American Diabetes Association (ADA) (≥100mg/dl and <126mg/dl).20 Hypertriglyceridemia was considered when TAG ≥150mg/dl,21 elevated Lp(a) when levels ≥30mg/dl.22 For the assessment of insulin resistance (IR) was used as cutoff point ≥2 according to the characteristics exhibited in our population23 and the values to define high levels of hs-CRP was (≥0.765mg/L).24
Statistical analysisQualitative variables were expressed as absolute and relative frequencies, and were assessed for associations with Pearson's Chi-squared (χ2) test. The percentages of risk were expressed as median with percentiles 25 and 75 due to their not-normal nature of the variable. To compare risk groups, Mann-Whitney's U test for comparisons between 2 groups.
Additionally, an ordinal logistic regression model was constructed, where the dependent variable included the coronary risk categories, while the independent variables selected were: gender, age, ethnic groups, social status, past family history of diabetes, myocardial infarction, alcohol consumption, smoking, sedentarism, BMI, insulin resistant, fasting impairment glucose, abdominal obesity, high TAG and Lp(a); in a second adjustment was added to the model high hs-CRP.
Regression coefficients (β) were calculated with their corresponding confidence intervals (CI95%), along with odds ratios (eβ) and their CI95%; as well as goodness of fit parameters and parallel line testing. Data were analyzed with the Statistical Package for the Social Sciences (SPSS) v.21 for Windows (IBM Inc. Chicago, IL). Results were considered statistically significant when p<0.05.
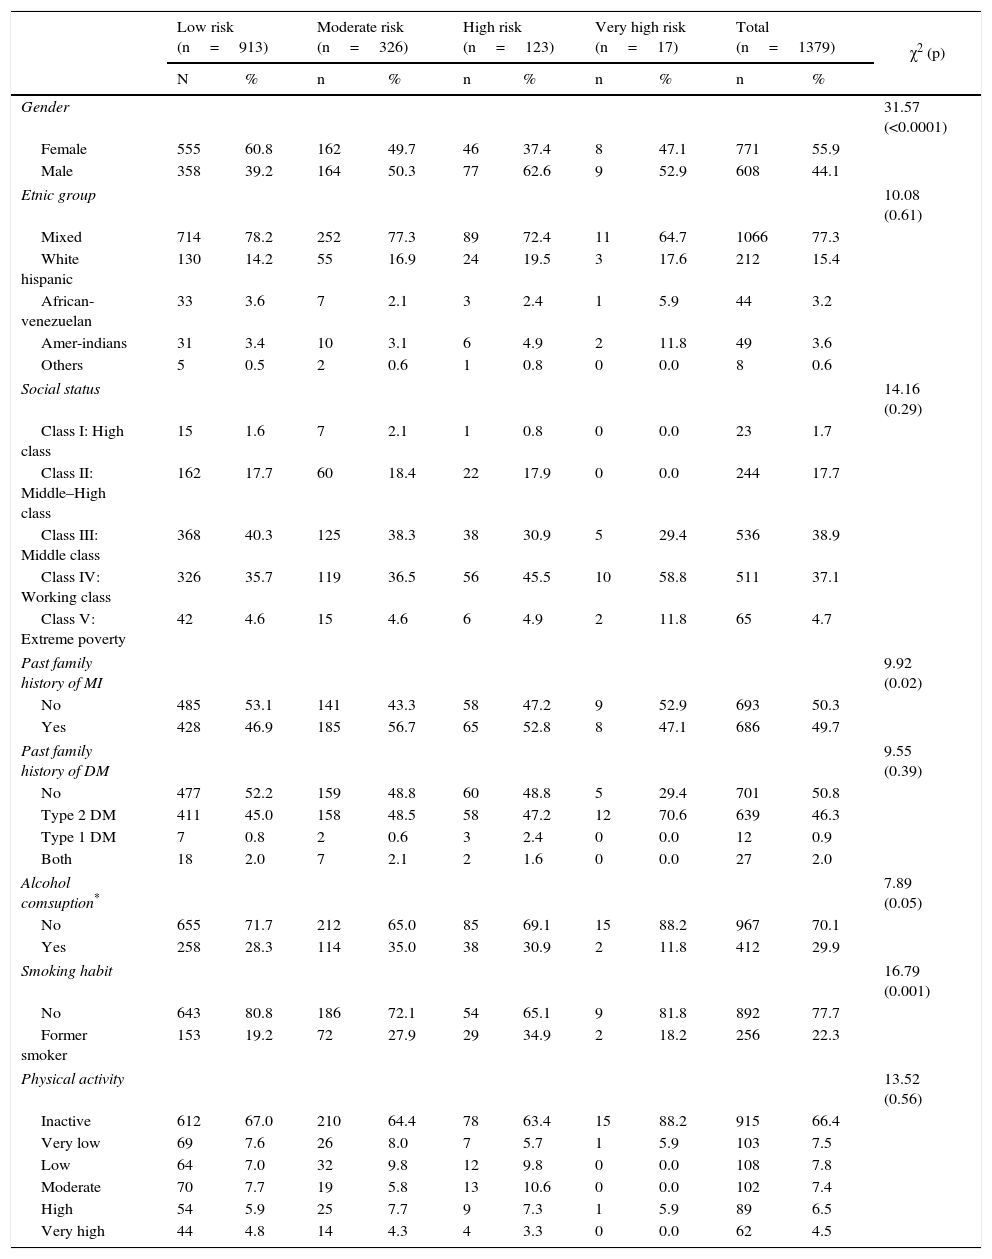
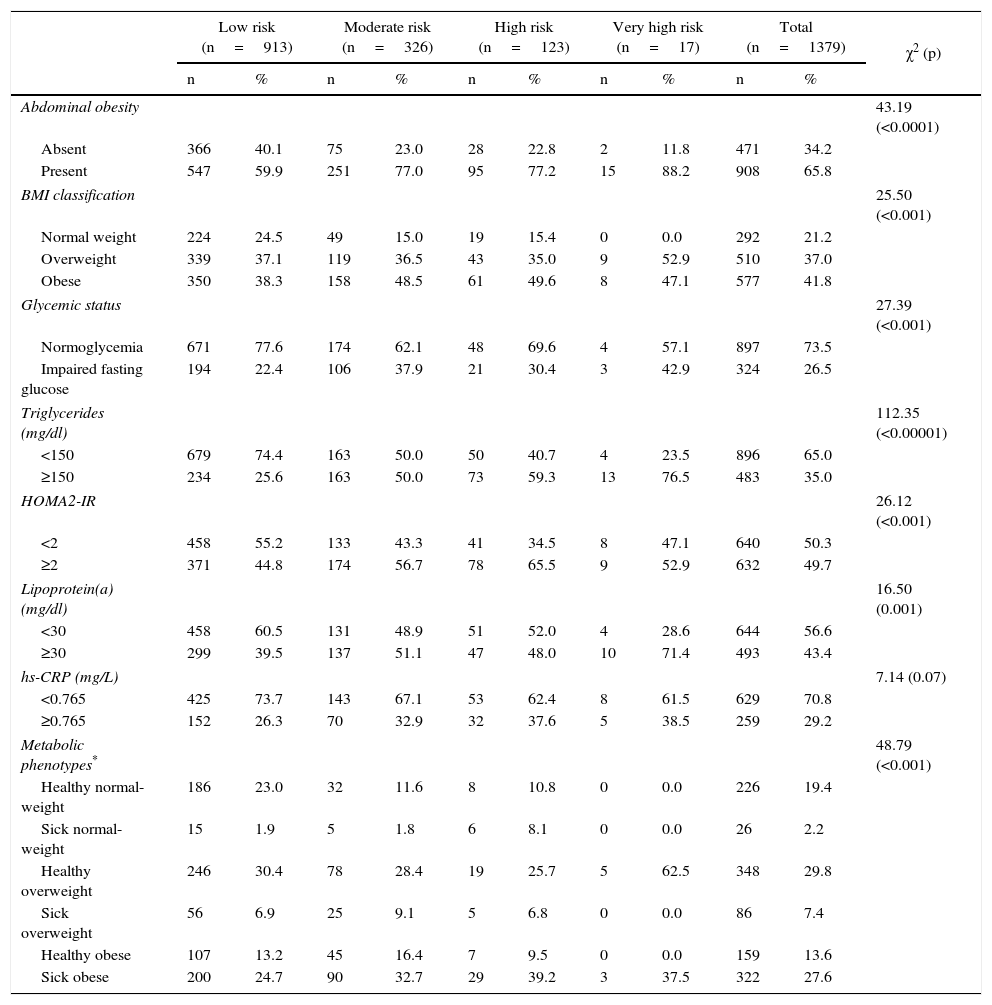
ResultsGeneral characteristics of the populationThe sample was conformed by 1,379 subjects (females: 55.9%; n=771), with a mean age of 46.9±10.9 years. The distribution of individuals according to coronary risk categories are shown in Tables 1 and 2. The sociodemographic characteristics and psycho-biological habits (Table 1) show an increase in the percentage of men, individuals with family history of myocardial infarction and former smokers as augment the coronary risk categories. Meanwhile, according to clinical and metabolic characteristics (Table 2), hypertriglyceridemia, metabolic phenotypes classification and abdominal obesity were the variables with the highest degree of association to coronary risk categories.
General characteristics according to coronary risk categories. Maracaibo city, 2014.
| Low risk (n=913) | Moderate risk (n=326) | High risk (n=123) | Very high risk (n=17) | Total (n=1379) | χ2 (p) | ||||||
|---|---|---|---|---|---|---|---|---|---|---|---|
| N | % | n | % | n | % | n | % | n | % | ||
| Gender | 31.57 (<0.0001) | ||||||||||
| Female | 555 | 60.8 | 162 | 49.7 | 46 | 37.4 | 8 | 47.1 | 771 | 55.9 | |
| Male | 358 | 39.2 | 164 | 50.3 | 77 | 62.6 | 9 | 52.9 | 608 | 44.1 | |
| Etnic group | 10.08 (0.61) | ||||||||||
| Mixed | 714 | 78.2 | 252 | 77.3 | 89 | 72.4 | 11 | 64.7 | 1066 | 77.3 | |
| White hispanic | 130 | 14.2 | 55 | 16.9 | 24 | 19.5 | 3 | 17.6 | 212 | 15.4 | |
| African-venezuelan | 33 | 3.6 | 7 | 2.1 | 3 | 2.4 | 1 | 5.9 | 44 | 3.2 | |
| Amer-indians | 31 | 3.4 | 10 | 3.1 | 6 | 4.9 | 2 | 11.8 | 49 | 3.6 | |
| Others | 5 | 0.5 | 2 | 0.6 | 1 | 0.8 | 0 | 0.0 | 8 | 0.6 | |
| Social status | 14.16 (0.29) | ||||||||||
| Class I: High class | 15 | 1.6 | 7 | 2.1 | 1 | 0.8 | 0 | 0.0 | 23 | 1.7 | |
| Class II: Middle–High class | 162 | 17.7 | 60 | 18.4 | 22 | 17.9 | 0 | 0.0 | 244 | 17.7 | |
| Class III: Middle class | 368 | 40.3 | 125 | 38.3 | 38 | 30.9 | 5 | 29.4 | 536 | 38.9 | |
| Class IV: Working class | 326 | 35.7 | 119 | 36.5 | 56 | 45.5 | 10 | 58.8 | 511 | 37.1 | |
| Class V: Extreme poverty | 42 | 4.6 | 15 | 4.6 | 6 | 4.9 | 2 | 11.8 | 65 | 4.7 | |
| Past family history of MI | 9.92 (0.02) | ||||||||||
| No | 485 | 53.1 | 141 | 43.3 | 58 | 47.2 | 9 | 52.9 | 693 | 50.3 | |
| Yes | 428 | 46.9 | 185 | 56.7 | 65 | 52.8 | 8 | 47.1 | 686 | 49.7 | |
| Past family history of DM | 9.55 (0.39) | ||||||||||
| No | 477 | 52.2 | 159 | 48.8 | 60 | 48.8 | 5 | 29.4 | 701 | 50.8 | |
| Type 2 DM | 411 | 45.0 | 158 | 48.5 | 58 | 47.2 | 12 | 70.6 | 639 | 46.3 | |
| Type 1 DM | 7 | 0.8 | 2 | 0.6 | 3 | 2.4 | 0 | 0.0 | 12 | 0.9 | |
| Both | 18 | 2.0 | 7 | 2.1 | 2 | 1.6 | 0 | 0.0 | 27 | 2.0 | |
| Alcohol comsuption* | 7.89 (0.05) | ||||||||||
| No | 655 | 71.7 | 212 | 65.0 | 85 | 69.1 | 15 | 88.2 | 967 | 70.1 | |
| Yes | 258 | 28.3 | 114 | 35.0 | 38 | 30.9 | 2 | 11.8 | 412 | 29.9 | |
| Smoking habit | 16.79 (0.001) | ||||||||||
| No | 643 | 80.8 | 186 | 72.1 | 54 | 65.1 | 9 | 81.8 | 892 | 77.7 | |
| Former smoker | 153 | 19.2 | 72 | 27.9 | 29 | 34.9 | 2 | 18.2 | 256 | 22.3 | |
| Physical activity | 13.52 (0.56) | ||||||||||
| Inactive | 612 | 67.0 | 210 | 64.4 | 78 | 63.4 | 15 | 88.2 | 915 | 66.4 | |
| Very low | 69 | 7.6 | 26 | 8.0 | 7 | 5.7 | 1 | 5.9 | 103 | 7.5 | |
| Low | 64 | 7.0 | 32 | 9.8 | 12 | 9.8 | 0 | 0.0 | 108 | 7.8 | |
| Moderate | 70 | 7.7 | 19 | 5.8 | 13 | 10.6 | 0 | 0.0 | 102 | 7.4 | |
| High | 54 | 5.9 | 25 | 7.7 | 9 | 7.3 | 1 | 5.9 | 89 | 6.5 | |
| Very high | 44 | 4.8 | 14 | 4.3 | 4 | 3.3 | 0 | 0.0 | 62 | 4.5 | |
MI=Miocardial Infarction; DM=Diabetes mellitus.
Clinical-and biochemical characteristics according to coronary risk categories. Maracaibo city, 2014.
| Low risk (n=913) | Moderate risk (n=326) | High risk (n=123) | Very high risk (n=17) | Total (n=1379) | χ2 (p) | ||||||
|---|---|---|---|---|---|---|---|---|---|---|---|
| n | % | n | % | n | % | n | % | n | % | ||
| Abdominal obesity | 43.19 (<0.0001) | ||||||||||
| Absent | 366 | 40.1 | 75 | 23.0 | 28 | 22.8 | 2 | 11.8 | 471 | 34.2 | |
| Present | 547 | 59.9 | 251 | 77.0 | 95 | 77.2 | 15 | 88.2 | 908 | 65.8 | |
| BMI classification | 25.50 (<0.001) | ||||||||||
| Normal weight | 224 | 24.5 | 49 | 15.0 | 19 | 15.4 | 0 | 0.0 | 292 | 21.2 | |
| Overweight | 339 | 37.1 | 119 | 36.5 | 43 | 35.0 | 9 | 52.9 | 510 | 37.0 | |
| Obese | 350 | 38.3 | 158 | 48.5 | 61 | 49.6 | 8 | 47.1 | 577 | 41.8 | |
| Glycemic status | 27.39 (<0.001) | ||||||||||
| Normoglycemia | 671 | 77.6 | 174 | 62.1 | 48 | 69.6 | 4 | 57.1 | 897 | 73.5 | |
| Impaired fasting glucose | 194 | 22.4 | 106 | 37.9 | 21 | 30.4 | 3 | 42.9 | 324 | 26.5 | |
| Triglycerides (mg/dl) | 112.35 (<0.00001) | ||||||||||
| <150 | 679 | 74.4 | 163 | 50.0 | 50 | 40.7 | 4 | 23.5 | 896 | 65.0 | |
| ≥150 | 234 | 25.6 | 163 | 50.0 | 73 | 59.3 | 13 | 76.5 | 483 | 35.0 | |
| HOMA2-IR | 26.12 (<0.001) | ||||||||||
| <2 | 458 | 55.2 | 133 | 43.3 | 41 | 34.5 | 8 | 47.1 | 640 | 50.3 | |
| ≥2 | 371 | 44.8 | 174 | 56.7 | 78 | 65.5 | 9 | 52.9 | 632 | 49.7 | |
| Lipoprotein(a) (mg/dl) | 16.50 (0.001) | ||||||||||
| <30 | 458 | 60.5 | 131 | 48.9 | 51 | 52.0 | 4 | 28.6 | 644 | 56.6 | |
| ≥30 | 299 | 39.5 | 137 | 51.1 | 47 | 48.0 | 10 | 71.4 | 493 | 43.4 | |
| hs-CRP (mg/L) | 7.14 (0.07) | ||||||||||
| <0.765 | 425 | 73.7 | 143 | 67.1 | 53 | 62.4 | 8 | 61.5 | 629 | 70.8 | |
| ≥0.765 | 152 | 26.3 | 70 | 32.9 | 32 | 37.6 | 5 | 38.5 | 259 | 29.2 | |
| Metabolic phenotypes* | 48.79 (<0.001) | ||||||||||
| Healthy normal-weight | 186 | 23.0 | 32 | 11.6 | 8 | 10.8 | 0 | 0.0 | 226 | 19.4 | |
| Sick normal-weight | 15 | 1.9 | 5 | 1.8 | 6 | 8.1 | 0 | 0.0 | 26 | 2.2 | |
| Healthy overweight | 246 | 30.4 | 78 | 28.4 | 19 | 25.7 | 5 | 62.5 | 348 | 29.8 | |
| Sick overweight | 56 | 6.9 | 25 | 9.1 | 5 | 6.8 | 0 | 0.0 | 86 | 7.4 | |
| Healthy obese | 107 | 13.2 | 45 | 16.4 | 7 | 9.5 | 0 | 0.0 | 159 | 13.6 | |
| Sick obese | 200 | 24.7 | 90 | 32.7 | 29 | 39.2 | 3 | 37.5 | 322 | 27.6 | |
BMI= body mass index; hs-CRP= high sensitivity-C reactive protein.
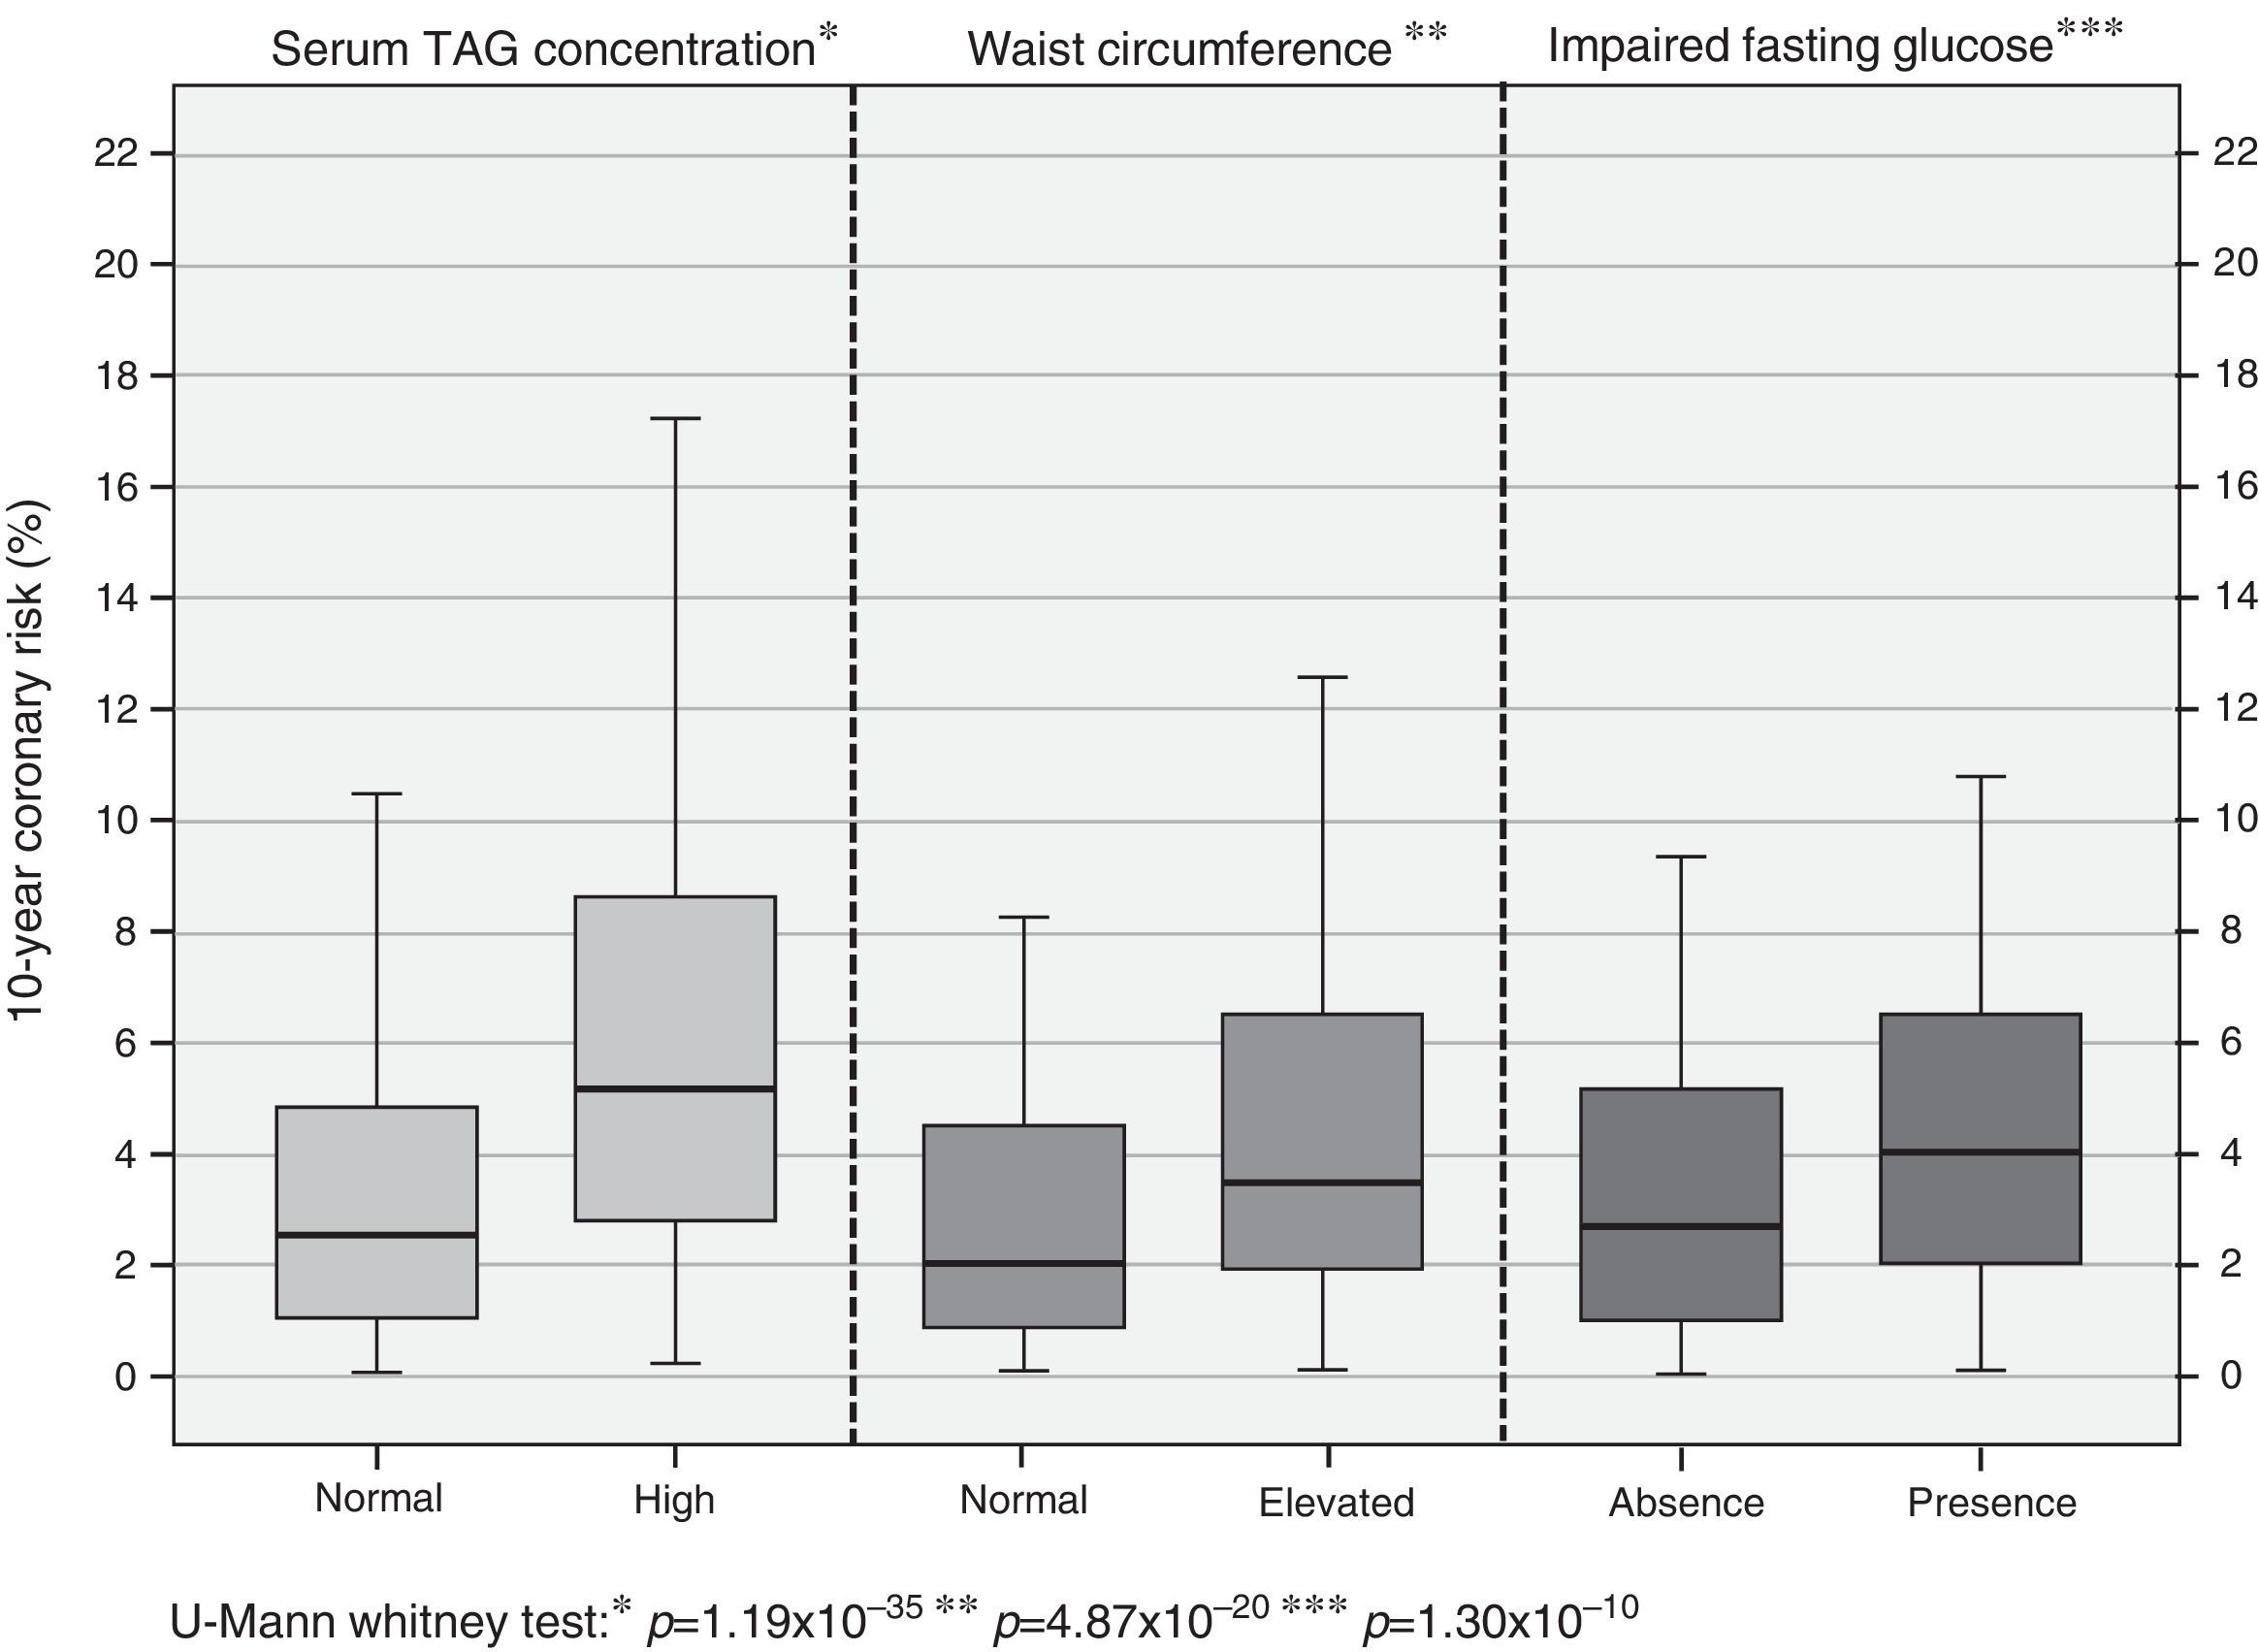
In assessing coronary risk behavior according to the presence of alterations associated more with the previous analysis, higher percentages of risk are observed in subjects with hypertriglyceridemia [high TAG: 5.17% (2.79-8.62) vs. normal TAG: 2.58% (1.09-4.88); p=1.19×10⁻³⁵]; similarly it is shown in subjects with abdominal obesity [with abdominal obesity: 3.96% (2.00-7.03) vs. without abdominal obesity: 2.15% (0.99-4.41); p=4.87×10⁻²⁰] and glycemic status [impaired fasting glucose: 4.07% (2.09-6.62) vs. normoglycemia: 2.73% (1.21-5.01); p=1.30×10⁻¹⁰] (Fig. 1).
Important risk factors for coronary artery disease
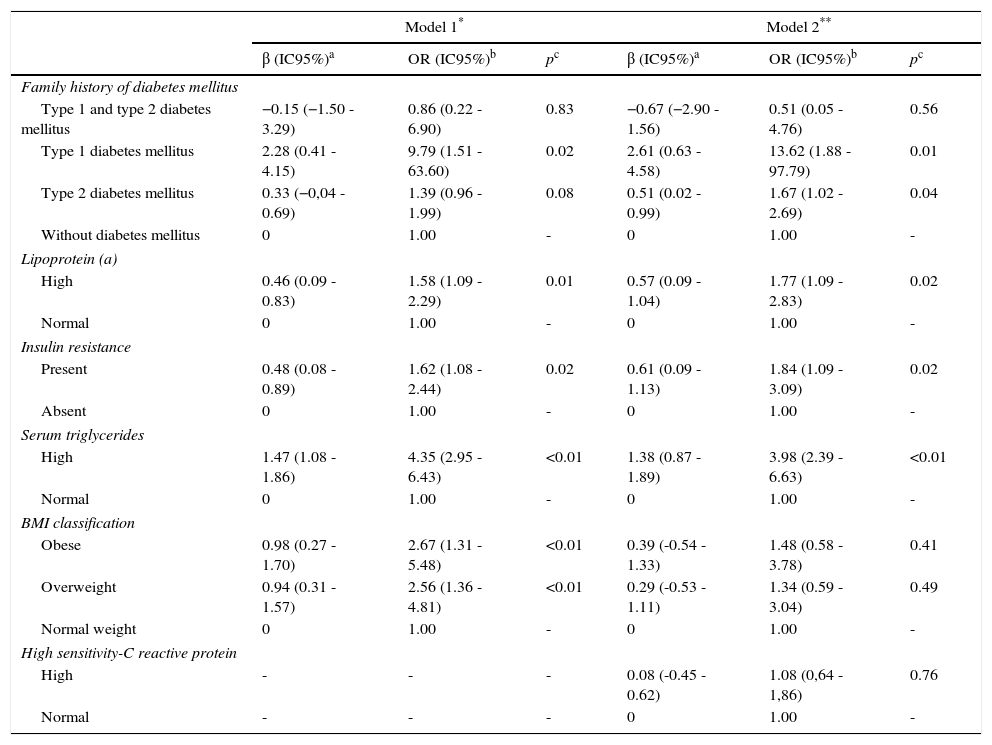
The main risk factors in the higher risk categories are shows in Table 3; in the first model the family medical history of type 1 DM was the most important factor [OR: 9.79 (95% CI: 1.51-63.6); p=0.02], followed by the presence of elevated TAG [OR: 4.35 (95% CI: 2.95-6.43); p<0.01]. When performing a second adjustment by hs-CRP, both variables remain the most important high risk factors for coronary artery disease.
Ordinal logistic regression model for coronary risk categories. Maracaibo city, 2014.
| Model 1* | Model 2** | |||||
|---|---|---|---|---|---|---|
| β (IC95%)a | OR (IC95%)b | pc | β (IC95%)a | OR (IC95%)b | pc | |
| Family history of diabetes mellitus | ||||||
| Type 1 and type 2 diabetes mellitus | −0.15 (−1.50 - 3.29) | 0.86 (0.22 - 6.90) | 0.83 | −0.67 (−2.90 - 1.56) | 0.51 (0.05 - 4.76) | 0.56 |
| Type 1 diabetes mellitus | 2.28 (0.41 - 4.15) | 9.79 (1.51 - 63.60) | 0.02 | 2.61 (0.63 - 4.58) | 13.62 (1.88 - 97.79) | 0.01 |
| Type 2 diabetes mellitus | 0.33 (−0,04 - 0.69) | 1.39 (0.96 - 1.99) | 0.08 | 0.51 (0.02 - 0.99) | 1.67 (1.02 - 2.69) | 0.04 |
| Without diabetes mellitus | 0 | 1.00 | - | 0 | 1.00 | - |
| Lipoprotein (a) | ||||||
| High | 0.46 (0.09 - 0.83) | 1.58 (1.09 - 2.29) | 0.01 | 0.57 (0.09 - 1.04) | 1.77 (1.09 - 2.83) | 0.02 |
| Normal | 0 | 1.00 | - | 0 | 1.00 | - |
| Insulin resistance | ||||||
| Present | 0.48 (0.08 - 0.89) | 1.62 (1.08 - 2.44) | 0.02 | 0.61 (0.09 - 1.13) | 1.84 (1.09 - 3.09) | 0.02 |
| Absent | 0 | 1.00 | - | 0 | 1.00 | - |
| Serum triglycerides | ||||||
| High | 1.47 (1.08 - 1.86) | 4.35 (2.95 - 6.43) | <0.01 | 1.38 (0.87 - 1.89) | 3.98 (2.39 - 6.63) | <0.01 |
| Normal | 0 | 1.00 | - | 0 | 1.00 | - |
| BMI classification | ||||||
| Obese | 0.98 (0.27 - 1.70) | 2.67 (1.31 - 5.48) | <0.01 | 0.39 (-0.54 - 1.33) | 1.48 (0.58 - 3.78) | 0.41 |
| Overweight | 0.94 (0.31 - 1.57) | 2.56 (1.36 - 4.81) | <0.01 | 0.29 (-0.53 - 1.11) | 1.34 (0.59 - 3.04) | 0.49 |
| Normal weight | 0 | 1.00 | - | 0 | 1.00 | - |
| High sensitivity-C reactive protein | ||||||
| High | - | - | - | 0.08 (-0.45 - 0.62) | 1.08 (0,64 - 1,86) | 0.76 |
| Normal | - | - | - | 0 | 1.00 | - |
Model 1 adjusted for: gender, age, ethnicity, socioeconomic status, family history of diabetes, myocardial infarction, alcohol use, smoking habit, physical activity, BMI classification, insulin resistance, impaired fasting glucose, abdominal obesity, high triglycerides and Lp(a).
Adjust information for Model 1: (χ2=581.67; p <0.01); Pseudo R-squared: Cox and Snell (0.48) - Nagelkerke (0.59) - McFadden (0.39); Test of parallel lines: (χ2=39.09; p=0.94)
Nowadays, scoring systems and risk rating tools are especially used in predicting cardiovascular disease due to significant epidemiological growth shown during the last decades worldwide, which has lead different research groups to design models risk that allows identification and early control in those subjects with high risk for develop coronary events.25 In this sense, studies as Framingham, PROCAM, SCORE and Reynolds26 are some of the ones used for this purpose but whose design involves specific (mostly caucasian) population which has caused doubts regarding its generalizability to other populations groups.27 This is why calibration of the Framingham formula has been used in several regions to verify the accuracy of predictive data obtained with the original formula.8–10
Also, another aspect to be considered when applying risk formulas, especially those derived from the Framingham study, is the ongoing analysis of potential factors that could influence the occurrence of cardiovascular events, which have emerged over the last decade associated with the broad field of molecular research triggered by the behavior of coronary artery disease. Although they have been considered or included in the most current risk models,28,29 they are not part of the systems more used in Latin America. Given this and the previous findings of our research team in relation to the behavior of certain risk factors of coronary artery disease, it necessary a multivariate evaluation of this diverse group of factors in our population.
It is interesting to observe the fact that past family history of DM is one of the main risk factors evaluated, especially the history of type 1 DM, which shows the importance and the various mechanisms of this illness in the development of cardiovascular disease,30 which has led to the use of clinical guidelines to evaluate thoroughly the various cardiovascular risk factors in type 1 diabetic patients.31 However, the low frequency of individuals with this past family history makes impossible to generalize these results into our population but it demonstrates the need to conduct studies focused on this relationship and its potential preventive role for those having this condition. Similarly, those with a past family history of type 2 DM presented a higher probability of being in coronary high risk categories, similar to the issues raised by Dhananjayan et al.32, in 450 subjects at southern India whose relationship was determinated with endothelial dysfunction's markers. However, these findings demonstrate the importance of investigating this background during clinical evaluation even in healthy subjects.
Although there are numerous reports posed to obesity as an independent cardiovascular risk factor,33,34 our findings show that the relationship depends on the state of inflammation characteristic in this disease mediated by hs-CRP and possibly other large group of molecules involved in the pathophysiology,35,36 which should be part of the patient assessment especially in early stages of cardiovascular disease.
Contrary to the effect on obesity and overweight, prospective metabolic disorders such as IR and certain dyslipidemias continue to show as risk factors after adjustment for hs-CRP. In relation to IR, its effect remains even after exclusion of diabetic subjects, a relationship that has been demonstrated in several cross-sectional studies and reports37,38 and proofs the need to adjust the existing models of risk estimation according to this condition (none considered in their calculations) given its potential of complications over heart and metabolic conditions. Similarly, our results confirm the role of independent risk factor of Lp(a), a modified lipid molecule that for decades has been linked to the onset of coronary events39 and whose genetic influence is so important that none of socio-demographic, clinical, metabolic, and inflammatory factors modify its association with higher risk categories.
Meanwhile, hypertriglyceridemia was ranked as the greatest serum biomarker associate with higher coronary risk factor, independently of other risk factors that are actually used in clinical practice. This relationship was established more than 15 years ago,40 however it is an important reason of interest and ongoing research nowadays.41 In this sense, our findings are similar with results of Kim et al.42, in more than 70.000 Korean subjects who have an independent association between TAG and cardiovascular disease risk, especially in individuals without previous metabolic disease. It demonstrates the need to broaden the focus of therapeutic management in primary prevention (specific LDL) and consider the important role of other molecules in the atherosclerotic process, including them as primary therapeutic target. This perspective should not only be limited to primary prevention but also in patients with previous coronary events.43
While the cross-sectional nature of our study cannot establish causality, the findings demonstrate the relevance of a broad set of factors in our population as IR, high Lp(a), and TAG serum levels, emphasizing the importance to be worldwide included in the risk estimation models.
Ethical disclosuresProtection of human and animal subjectsThe authors declare that the procedures followed were in accordance with the regulations of the relevant clinical research ethics committee and with those of the Code of Ethics of the World Medical Association (Declaration of Helsinki).
Confidentiality of dataThe authors declare that they have followed the protocols of their work center on the publication of patient data.
Right to privacy and informed consentThe authors have obtained the written informed consent of the patients or subjects mentioned in the article. The corresponding author is in possession of this document.
FundingThis work was supported by Research Grant no. CC-0437-10-21-09-10 from Consejo de Desarrollo Científico, Humanístico y Tecnológico (CONDES), University of Zulia, and Research Grant no. FZ-0058-2007 from Fundacite-Zulia.
Conflict of interestThe authors declare no conflict of interest.