

Based on the importance of innovation to global competitiveness and the importance that the Brazil, Russia, India, China and South Africa countries represent for the world economy, the purpose of this study is to analyze the innovation progress of BRICS as a block and its individual members from 2008 to 2013. The Global Innovation Index was used as a source of data due to its recognized importance. Innovation is measured by inputs and outputs in this data bank. Two analyses were done. First, the innovation index of BRICS was analyzed as a whole showing a drastic decrease in the innovation index during the economic crises of 2008–2009 followed by a timid recovery. Second, a regression analysis between inputs and outputs for each country is run. The regression analysis by country presents a small R2 showing that the relation between inputs and outputs cannot be satisfactorily explained. However, when the BRICS group is considered it shows a significant relation with R2=64%.
The acronym BRIC referring to Brazil, Russian, India, and China first appeared in 2001 in a report from Goldman Sachs called Building Better Global Economies BRICS written by the economist Jim O¿Neill. At that time, the BRICS were facing outstanding economic improvement. Brazil's Gross Domestic Product (GDP) grew from 4.3% in 2000 to 6.1% in 2007. India and China almost doubled their GDP in the same period. Russia had a slight drawback but had its economy established. The BRIC countries represented 43.03% of the world population and 18% of the world's GDP, and was responsible for 46.3% of global economic growth from 2000 to 2008 (The Economist, 2012). The expectations regarding the Brazil, Russia, India, China and South Africa (BRICS) were high. It was estimated that the BRICS would have an economic development better than the G6 by 2050 (Wilson & Purushothaman, 2003).
Even with these astonishing economic figures, they did not have full access to the core of the global economic discussions led by the G8. This uncanny situation lead to the creation of BRICS as a club of leaders in 2008. Later in 2010 South Africa was incorporated into the group. O¿Neill (2011) argues that when the acronym was launched, his intention was not to see the rise of an economic group and neither the entrance of South Africa, His intention was to illustrate the economic results those countries were reaching.
With the success of BRICS and realizing the growth of these countries, scientific literature has sought to improve knowledge about it. A special topic about this group, and about other countries who live in a global competitiveness, is the innovation process. The uncertainty, cumulative differentiation, and collaboration characteristics (Pavitt, 1990) make the countries live in a constant search for innovative leadership because innovation represents a drive of economic growth, progress, and competitiveness both for developed economies and developing economies (Cornell University, 2014).
Innovation has therefore become a central point to sustain a better performance (Dittrich & Duysters, 2007), create competitive advantage (Barney, 1991; Day, 1994), value creation (Deeds, DeCarolis, & Coombs, 2000) and economic development (Schumpeter, 1934), and most importantly to attain economic and social success in today's globalized business world (Castaño, Méndez, & Galindo, 2016; Senge, Carstedt, & Porter, 2006). The BRICS are aware of the importance of innovation and in 2011 the Senior Official Meeting in China was held in an attempt to reach agreements regarding science, technology, and innovation.
Cornell University, together with INSEAD1 and WIPO,2 aware of the need to understand and manage the innovation process in the country, launched in 2007 the Annual Report on the Global Innovation Index with a simple goal of determining how to find metrics and approaches that best capture the richness of innovation in society and thus go beyond traditional measures of innovation such as the number of research articles and the costs incurred at the level of research and development (R&D) (Cornell University, 2014).
Recognizing the importance of innovation for the solid development of the BRICS, this study aims to analyze the innovation progress of BRICS as a block and of its individual members from 2008 to 2013. This period is relevant due to the economic crises of 2008–2009. For this, data were collected from the Global Innovation Index and the analyses were done in two parts. First, the innovation index of the BRICS was analyzed as a whole. Second, a regression analysis between inputs and outputs for each country is run making it possible to check the impact of innovation from each country and the impact of each input to build up the index.
This study is organized into five sections. First, a review of innovation is presented showing how important it is for companies and nations that want to survive and thrive in the business environment of today's world. The second section shows the story of BRICS and data to support why these emerging countries were being considered an economic phenomenon. Next, the methodology is presented, data were collected from the Global Innovation Index, and the analyses were carried out in two parts. The first analysis sees the BRICS as a whole. The second analysis uses a Regression Analysis to find the correlation of inputs and outputs in the performance of each member of the BRICS regarding innovation. Finally, the conclusion with limitations and future research proposal is presented.
2InnovationInnovate, according to Dosi (1988), refers to the process of searching, discovery, experimentation, imitation, and adoption of new production processes and new organizational settings. This process lacks an effective management in order to represent a positive result.
According to the Annual Report on the Global Innovation Index organized by Cornell University, the innovation factor is considered as an engine of economic growth and welfare; moreover, it is an important factor for the conduct and economic progress of competitiveness both for developed economies and developing economies (Cornell University, 2014).
It is worth stating that innovation has characterized the history of humanity due to its capacity of changing human behavior, labor methods and work (Galindo & Méndez, 2014). Therefore, with the rise of companies and the modern economic assumptions, innovation has become one of the central mechanism for strategic change, growth (Dittrich & Duysters, 2007), better performance (Barney, 1991; Day, 1994), competitive advantage (Drucker, 1985), economic development (Schumpeter, 1934), and for creating value (Deeds et al., 2000) in order to attain economic and social success in today's globalized business world (Castaño et al., 2016; Senge et al., 2006).
However, scholars have yet to clearly define innovation (Mazzarol & Reboud, 2011). Joseph Schumpeter, the pioneer in recognizing innovation as essential to economic development, argues that innovation covers five areas: product innovation, process innovation, marketing innovation, input innovation, and organizational innovation (Schumpeter, 1934). Later on the concept of creative destruction, which briefly means the ability to incessantly destroy old structures to give way to new ones, is considered essential to innovation and continuity of capitalism (Schumpeter, 1942). Damanpour (1991) defines innovation as the adoption of an internally generated or purchased device, system, policy, program, process, product, or services that is new to the organization. The Global Innovation Index and Effective Innovation Policies for Development report released in 2015 highlights that innovation has broadened going beyond resource and development laboratories to include social innovations (Cornell University, 2015)
Investments in innovations are important for firms and nations to compete for the future and to secure competitive advantage in an increasingly globalized and uncertain economic environment (Vila, Pérez, & Coll-Serrano, 2014). Therefore, companies are invited to innovate not only in products and production processes, but also in organizational structure, administrative processes, and managerial practices (Birkinshaw, Hamel, & Mol, 2008; Damanpour & Aravind, 2012; Hamel, 2007), as shown in the typology proposed by Schumpeter (1934).
The outputs of innovation depend on time, money, and how companies perform their daily tasks (Cooper, 1998; Mazzarol & Reboud, 2011), whereas investments in resource and development (R&D) are essential due to their contribution to a strong economy in several ways. Innovation contributes to job creation, economic growth, taxes, national security (Hausman & Johnston, 2014), improved trade deficits, as well as offshore consumers clamor for advanced products and services (Mandel, 2009).
Nevertheless, the study of innovation is still challenging researchers. Innovation is an accumulative process and not linear or continuous (Dosi, 1988). This approach is present on the S curve (Christensen, 1992; Leonard-Barton, 1998). Thus, before understanding the accumulative process, it is necessary to measure innovation. Miranda and Figueiredo (2010) point out that it is not a matter of being or not being innovative, but a matter of identifying at which stage the company is. A key point in the literature is how to measure innovation. According to Cornell University (2014) the journey to effective measurement is far from over.
2.1Innovation in emerging countriesDeveloping economies are characterized by the fact that they started their industrialization process late and, moreover, have an industrial base still in consolidation (Figueiredo, 2015).
Unlike what happened in the past where these economies had only followers of capacity, in developed economies today, the countries considered in development already have a set of sufficient capacity to develop their own innovations and reach the international technological frontier (Bell, Scott-Kemmis, & Satyarakwit, 2006).
Katz (1976) was one of the first to begin research on the process of innovation in developing economies, specifically in the Latin American region. From these studies we derived results on the technological creativity located in such economies.
Hobday (2003), Dutrénit (2006), Mazzoleni and Nelson (2007), Dantas and Bell (2011), and Figueiredo (2015) are some authors who have some emerging countries in their research studies on the innovation process. It is noteworthy that “the development of the public research infrastructure ought to be the central goal of policy, calling for a careful appreciation of its role in the context of a developing country's national system of innovation (Mazzoleni & Nelson, 2007, p. 1515). “To accumulate their technological capabilities and move up heads on the international technological frontier [of innovation], companies in developing countries need to engage in technological learning processes” (Figueiredo, 2015, p. 39).
From the research, we note the importance of paying attention to the innovation context experienced by these countries, since it plays an important role in the accumulation of skills and capabilities, propelling them to the international technological frontier.
Regarding the BRICS countries, they represent an emergent economy and their capability to innovate is different from those of affluent regions. Amann and Cantwell (2012) argue that the import-substitution industrialization policy, which is key to bypass external constraint and trigger economic growth, adopted at different levels by the BRICS, has led to the development of local technological capabilities in some of its members. Williamson (2015) states that companies from emerging countries are innovate to have found non-traditional competitive advantages to leverage the advantage of their home countries. For example, they have to innovate in cost (Williamson & Zeng, 2009) and create ways to unlock emerging demands in low-end segments (Prahalad, 2006).
3BRICSThe growing influence and importance of emerging economies to the global competition has already been discussed by the specialized literature. Katz (1976), Bell, Scott-Kemmis, and Satyarakwit (1982), and Lall (1987) question the belief that companies from developing regions were not able to create their own technology and had the fate to absorb technologies developed in affluent regions. Therefore, emerging economies have been calling the attention of scholars worldwide.
The end of the crises-ridden 1990s favored a global flood of easy money making virtually every economy in the developing and developed world a winner (Sharmar, 2012). In this scenario of economic development of four countries of the developing region showed expressive results leading Jim O¿Neill, an economist of the Goldman Sachs investor bank, to create the acronym BRICS in reference to Brazil, Russia, India, and China (O¿Neill, 2001).
These countries had expressive economic results. In the early 2000s, China become the second world economy, Brazil the sixth, India showed robust growth and was raked in the ninth position, and Russia had its economic situation established. Moreover, the BRICS represent 43.03% of the world population, 18% of the world GDP, it covers almost 26% of the terrestrial area of the planet, and was responsible for 46.3% of the global economic growth from 2000 to 2008 (The Economist, 2012). In 2015, the group represented 19.1% of the world's total exports, 23.1% of world GDP, and is home to 3.073 billion inhabitants (ITAMARATY, s.d.).
According to UNCTAD (2013), “Over the past decade, FDI inflows to BRICS more than tripled to an estimated US$ 263 billion in 2012. As a result, their share in world FDI flows kept rising even during the crisis, reaching 20% in 2012, up from 6% in 2000”.
Brazil's GDP growth rate jumped from 4.3% in 2000 to 6.1 in 2007. India had an astonishing improvement with its GDP doubling from 2000 to 2007 growing at a rate of 15.9%. China's GDP grew from 8.4% in 2000 to 14.2% in 2007. South Africa had a timid but important improvement rising from 4.2% in 2000 to 5.5% in 2007. The only country of the BRICS that had a drop in its performance from 2000 to 2007 was Russia. Russia's GDP decreased from 10.0% in 2000 to 8.5% in 2007 (IBGE, 2014).
Wilson and Purushothaman (2003) pointed out that if things go right, in the next 50 years the BRICS could become an important player in the world economy with an annual increase in US dollars four times that of the G6 by 2050.
The BRICS were on the crest of the wave and an uncanny situation arose. Even if robust economic development the emergent regions specially the members of the BRICS were still out of the main economic forum the G8 meeting – at least as a full member – showing the lack of importance the affluent regions give to the emerging ones. This lack of representativeness lead to the creation of BRIC as a political-diplomatic entity with the first summit held on May 18th 2008 in Yekaterinburg, Russia (Reis, 2012). In 2011, in Sanya, China, South Africa was formalized a member of BRICS (BRICS Summit, 2012).
The entrance of South Africa into the BRICS caught the attention of O¿Neill (2011). He argues that when the acronym BRIC was created he did not expect it to become a political club of leaders, so what he meant has to be regarded differently, and more so after the entrance of South Africa in the group. The expectations regarding the economic development were high.
It seemed to be a pleasant scenario and an irreversible economic trend. Finally emerging companies would enjoy stable economic progress. However, Wilson and Purushothaman (2003) argues that the BRICS faces significant challenges in keeping development because of bad policy or bad luck. With the economic crises in 2008–2009 (Coulibaly, Sapriza, & Zlate, 2013) and with the world economy heading to its worst years since 2009 (Sharmar, 2012), the optimism had to be held.
In 2009, GDP growth in Brazil was −0.3% followed by a recovery of 7.5% in the next year. However, in 2011 the GDP plummeted to 2.7%. Even China has shown signs of drawbacks. Its GDP rate decreased from 10.4% in 2010 to 7.7% in 2013. Russia was also strongly affected. In 2009 its GDP was −7.8% and after some recovery it reached 1.3% in 2013. This trend of loss is also noticed for India and South Africa's GDP (IBGE, 2014).
3.1Economic crisis 2008–2009The economic crisis of 2008–2009 made Afnouch and Hammami (2014, p. 159) argue that “the financial crisis of 2008 was considered the most severe crisis since the Great Depression and its magnitude and the speed of its spread across the world come to put forward concerns about the contagion”.
The reasons for the economic crisis of 2008–2009 that started in the United Stated is a combination of poor lending practices, poor investment in financial instruments such as derivatives, banking practices, poor political decisions that allowed the failure of Lehman Brothers, leading to a loss of over 500 points in the Dow Jones industrial on the US stock exchange (Peston, 2008), but also, according to Hausman and Johnston (2014), due to the lack of innovation. In the same line of thought, Lester and Piore (2006) had already touched on the issue of innovation to keep an economy strong and competitive.
The US government had to intervene in the economy as a result of the crisis, rescuing banks and offering an economic stimulus package. The economic recession was not limited to the US; economic decline and unemployment affected almost every country in the world (Coulibaly et al., 2013; Hausman & Johnston, 2014). Nevertheless, during dire times, there might be opportunities. Unprecedented cooperation between emerging powers in the context of BRICS were noticed after the economic crises (Stuenkel, 2013). This cooperation to overcome the crisis empowered their global competitiveness, making them an alternative for international investors looking for diversification (Verma & Rani, 2015).
It seems that the BRICS recovered quickly from the economic crises, at least as related to international trade. For example, export in 2008 reached US$ 2.352 billion, in 2009 there was a drop to US$ 1.887, nevertheless in 2010 it rose to US$ 2.475 billion. A similar trend occurred with imports: despite a drop of 17.3% in 2009 compared to 2008, in 2010 there was an incredible increase of 164% compared to the last result of 2009 (1.634) (MRE, 2016).
An example of cooperation to overcome the crises can be the Senior Official Meeting held in Dalian, China in September of 2011 to discuss and make agreements regarding science, technology, and innovation (Mota, 2012).
4MethodologyThis paper aims to understand the development of innovation of the BRICS from 2008 to 2013. This period is relevant because it shows results before and after the economic crises of 2008–2009. To do so, a quantitative method was used to measure the innovation index. Data were collected from the annual reports of the Global Innovation Index done by Cornell University, INSEAD Institute, and WIPO.
The analyses were separated into two parts. First, the innovation index of the BRICS was analyzed as a whole, just with descriptive statistics. Second, a regression analysis between inputs and outputs for each country (5 countries – Brazil, Russia, India, China and South Africa) was run. Regression analyses are used to verify the relationship between two or more variables and can help to predict a dependent variable from independents variables (Hair, Black, Babin, Anderson, & Tatham, 2009). Therefore, it was possible to verify the impact of innovation of each country and the impact of each input to build up the index.
It is important to highlight that, due to its annual periodicity, the report published in 2014 covers the data from 2013. Another important observation to highlight is that the first report released in 2007 does not disclose the data by inputs; therefore these data were not considered in this paper.
The Global Innovation Index was considered due to its leading reference in innovation and relevance. Ban Ki-moon (Secretary-General of the United Nations) argues that the Global Innovation Index is a unique tool for refining innovation policies (Cornell University, 2014). From 2008 to 2013, the Global Innovation Index considered pillars of inputs and outputs. Each input had three sub pillars and the outputs varied between two and three sub pillars (See annex to check the pillars). The scale to measure the indicators varied from 1 to 7 (2008–2009) and from 0 to 100 from 2010 to present time. Due to scale adaptation through the years, a rule of three was done to calculate the indicators from 2008 and 2009.
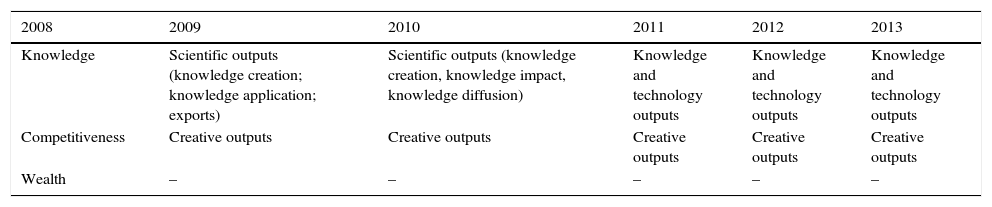
Over the years the pillars constituting the overall rate of innovation suffered some modifications. As for inputs, they remained the same; however, the outputs changed in a few years as shown in Table 1. Because of these changes and realizing that the knowledge factor remained always present, it was decided in this paper to analyze only one innovation output. This output refers to (1) knowledge creation (2) knowledge impact, and (3) knowledge diffusion. For analytical purposes, only the group as a whole was considered, which is calculated by the average of the three subgroups that are part of it.
Change in output constituents in the Innovation General Index (2008–2013).
| 2008 | 2009 | 2010 | 2011 | 2012 | 2013 |
|---|---|---|---|---|---|
| Knowledge | Scientific outputs (knowledge creation; knowledge application; exports) | Scientific outputs (knowledge creation, knowledge impact, knowledge diffusion) | Knowledge and technology outputs | Knowledge and technology outputs | Knowledge and technology outputs |
| Competitiveness | Creative outputs | Creative outputs | Creative outputs | Creative outputs | Creative outputs |
| Wealth | – | – | – | – | – |
R statistical software version 3.1.2 (R Core Team, 2014) and a lattice package to build graphs were used to run the regression and to analyze the relationship between inputs and outputs. The next part of this paper presents the results.
In addition, the authors also observed the innovation rates of the countries that make up the G8 group to make a brief comparison with the BRICS countries. It is important to mention here that Russia is a country that joined the G8 in 1997, but it came out in 2014, but it is also considered a member of the BRICS. For this reason, the analysis of the G8 group was considered with only 7 countries (Canada, France, Germany, Italy, United States, United Kingdom and Japan).
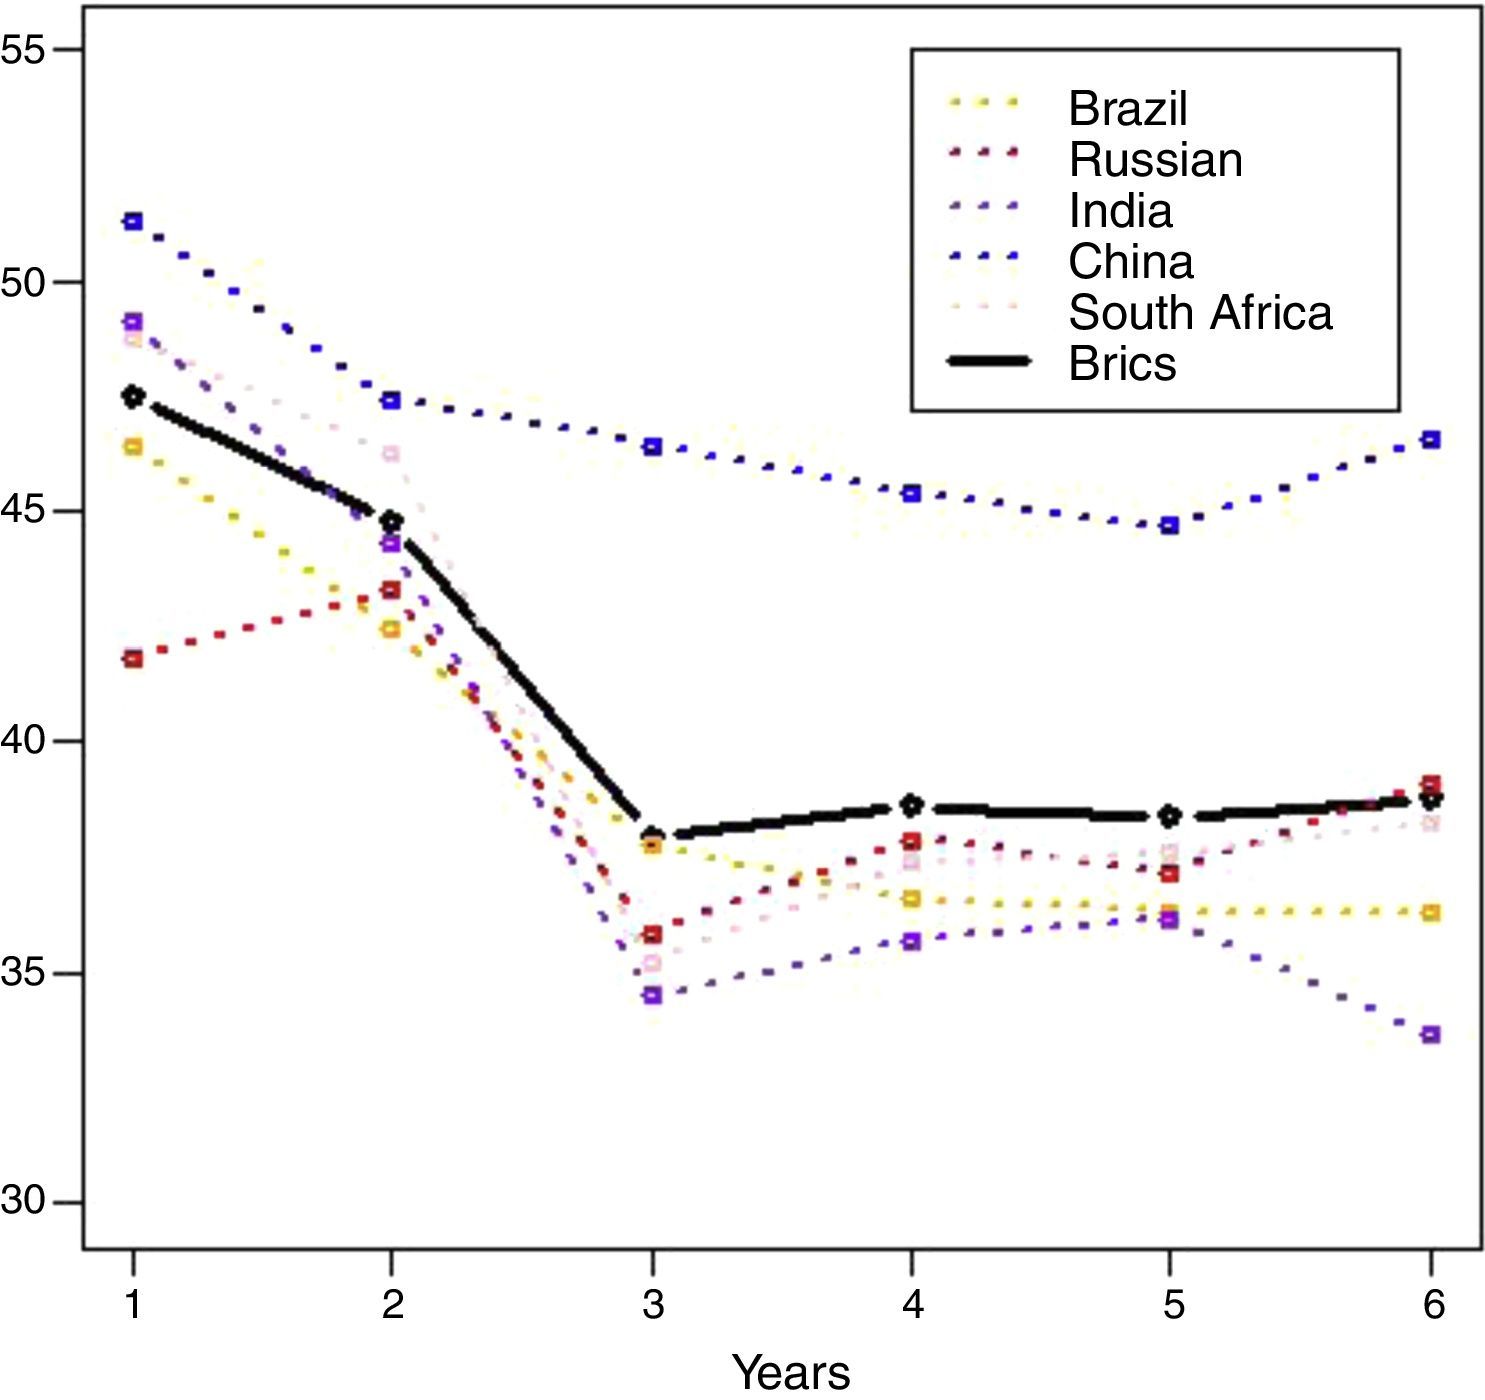
5ResultsBefore seeking for correlations between the variables and jump into statistics analysis, it was necessary to identify how the BRICS evolved from 2008 to 2013 regarding innovation. The Global Innovation Index (Fig. 1) shows a drastic drop from 2008 to 2010 followed by a slight recovery until 2013.

It is likely that the Global Innovation Index was affected by the economic global crisis started in 2008. Even though, this study does not imply any correlation of cause and effect between the indicators and the economic crises even though it is suggested that somehow the crisis may have had some impact on the Global Innovation Index performance during this period.
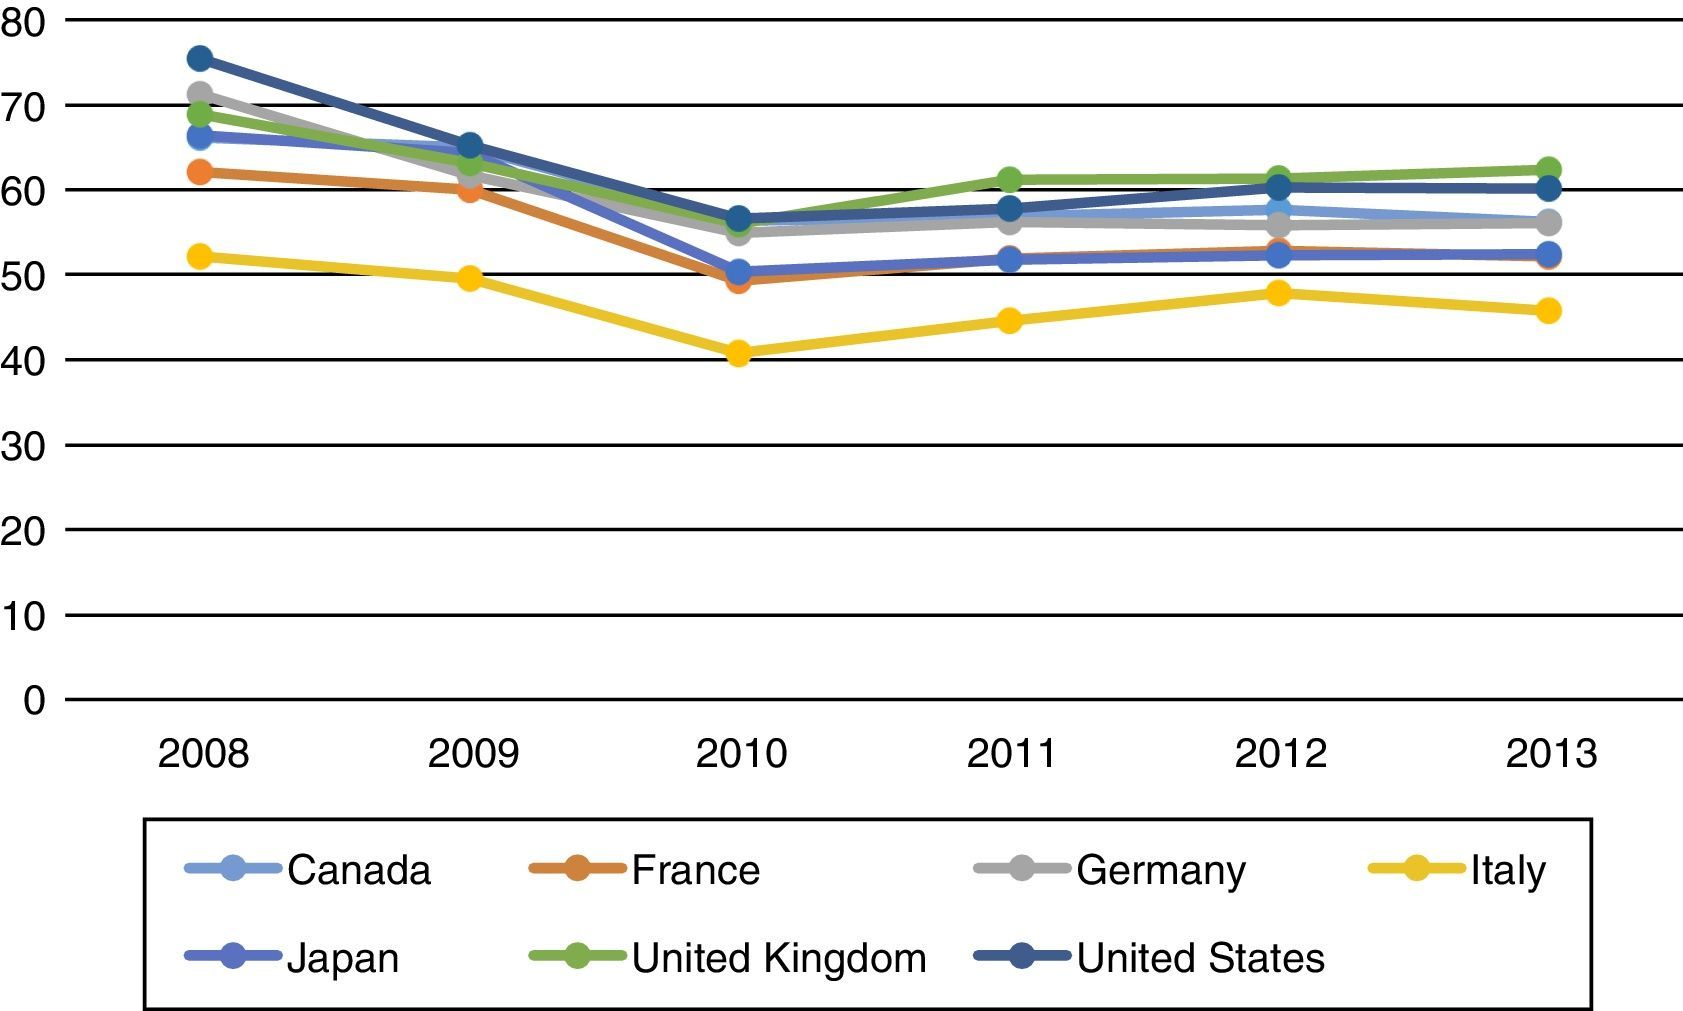
In order to compare the behavior of the BRICS countries with respect to innovation process with economically developed countries, a graph is shown in Fig. 2 of the G8 countries (except Russia) showing its Innovation General Index between the years 2008 and 2013.

It can be clearly realized that the contents of the G8 countries are higher than the BRICS countries. Moreover, it is perceived that there was a decline in these numbers in 2010, as occurred in the BRICS, but with the G8 countries this number was quickly recovered in the following years. One feature that shows some similarity in the two groups is that, in fact, all countries seem to behave the same way, which comes to confirm their presence in the same group.
A plummet in the innovation index can also be notice when analyzing the index by each country member of the BRICS. Brazil had a considerable drop and did not show any sign of recovery until 2013. India had a similar trend. After the drop, the innovation index showed some improvement, but it was not sustained and was followed by another decrease. On the other hand, Russia and China had a better performance showing a stable trend of increase after 2012. It is assumed that this phenomenon enhanced and stabilized the general BRICS index.
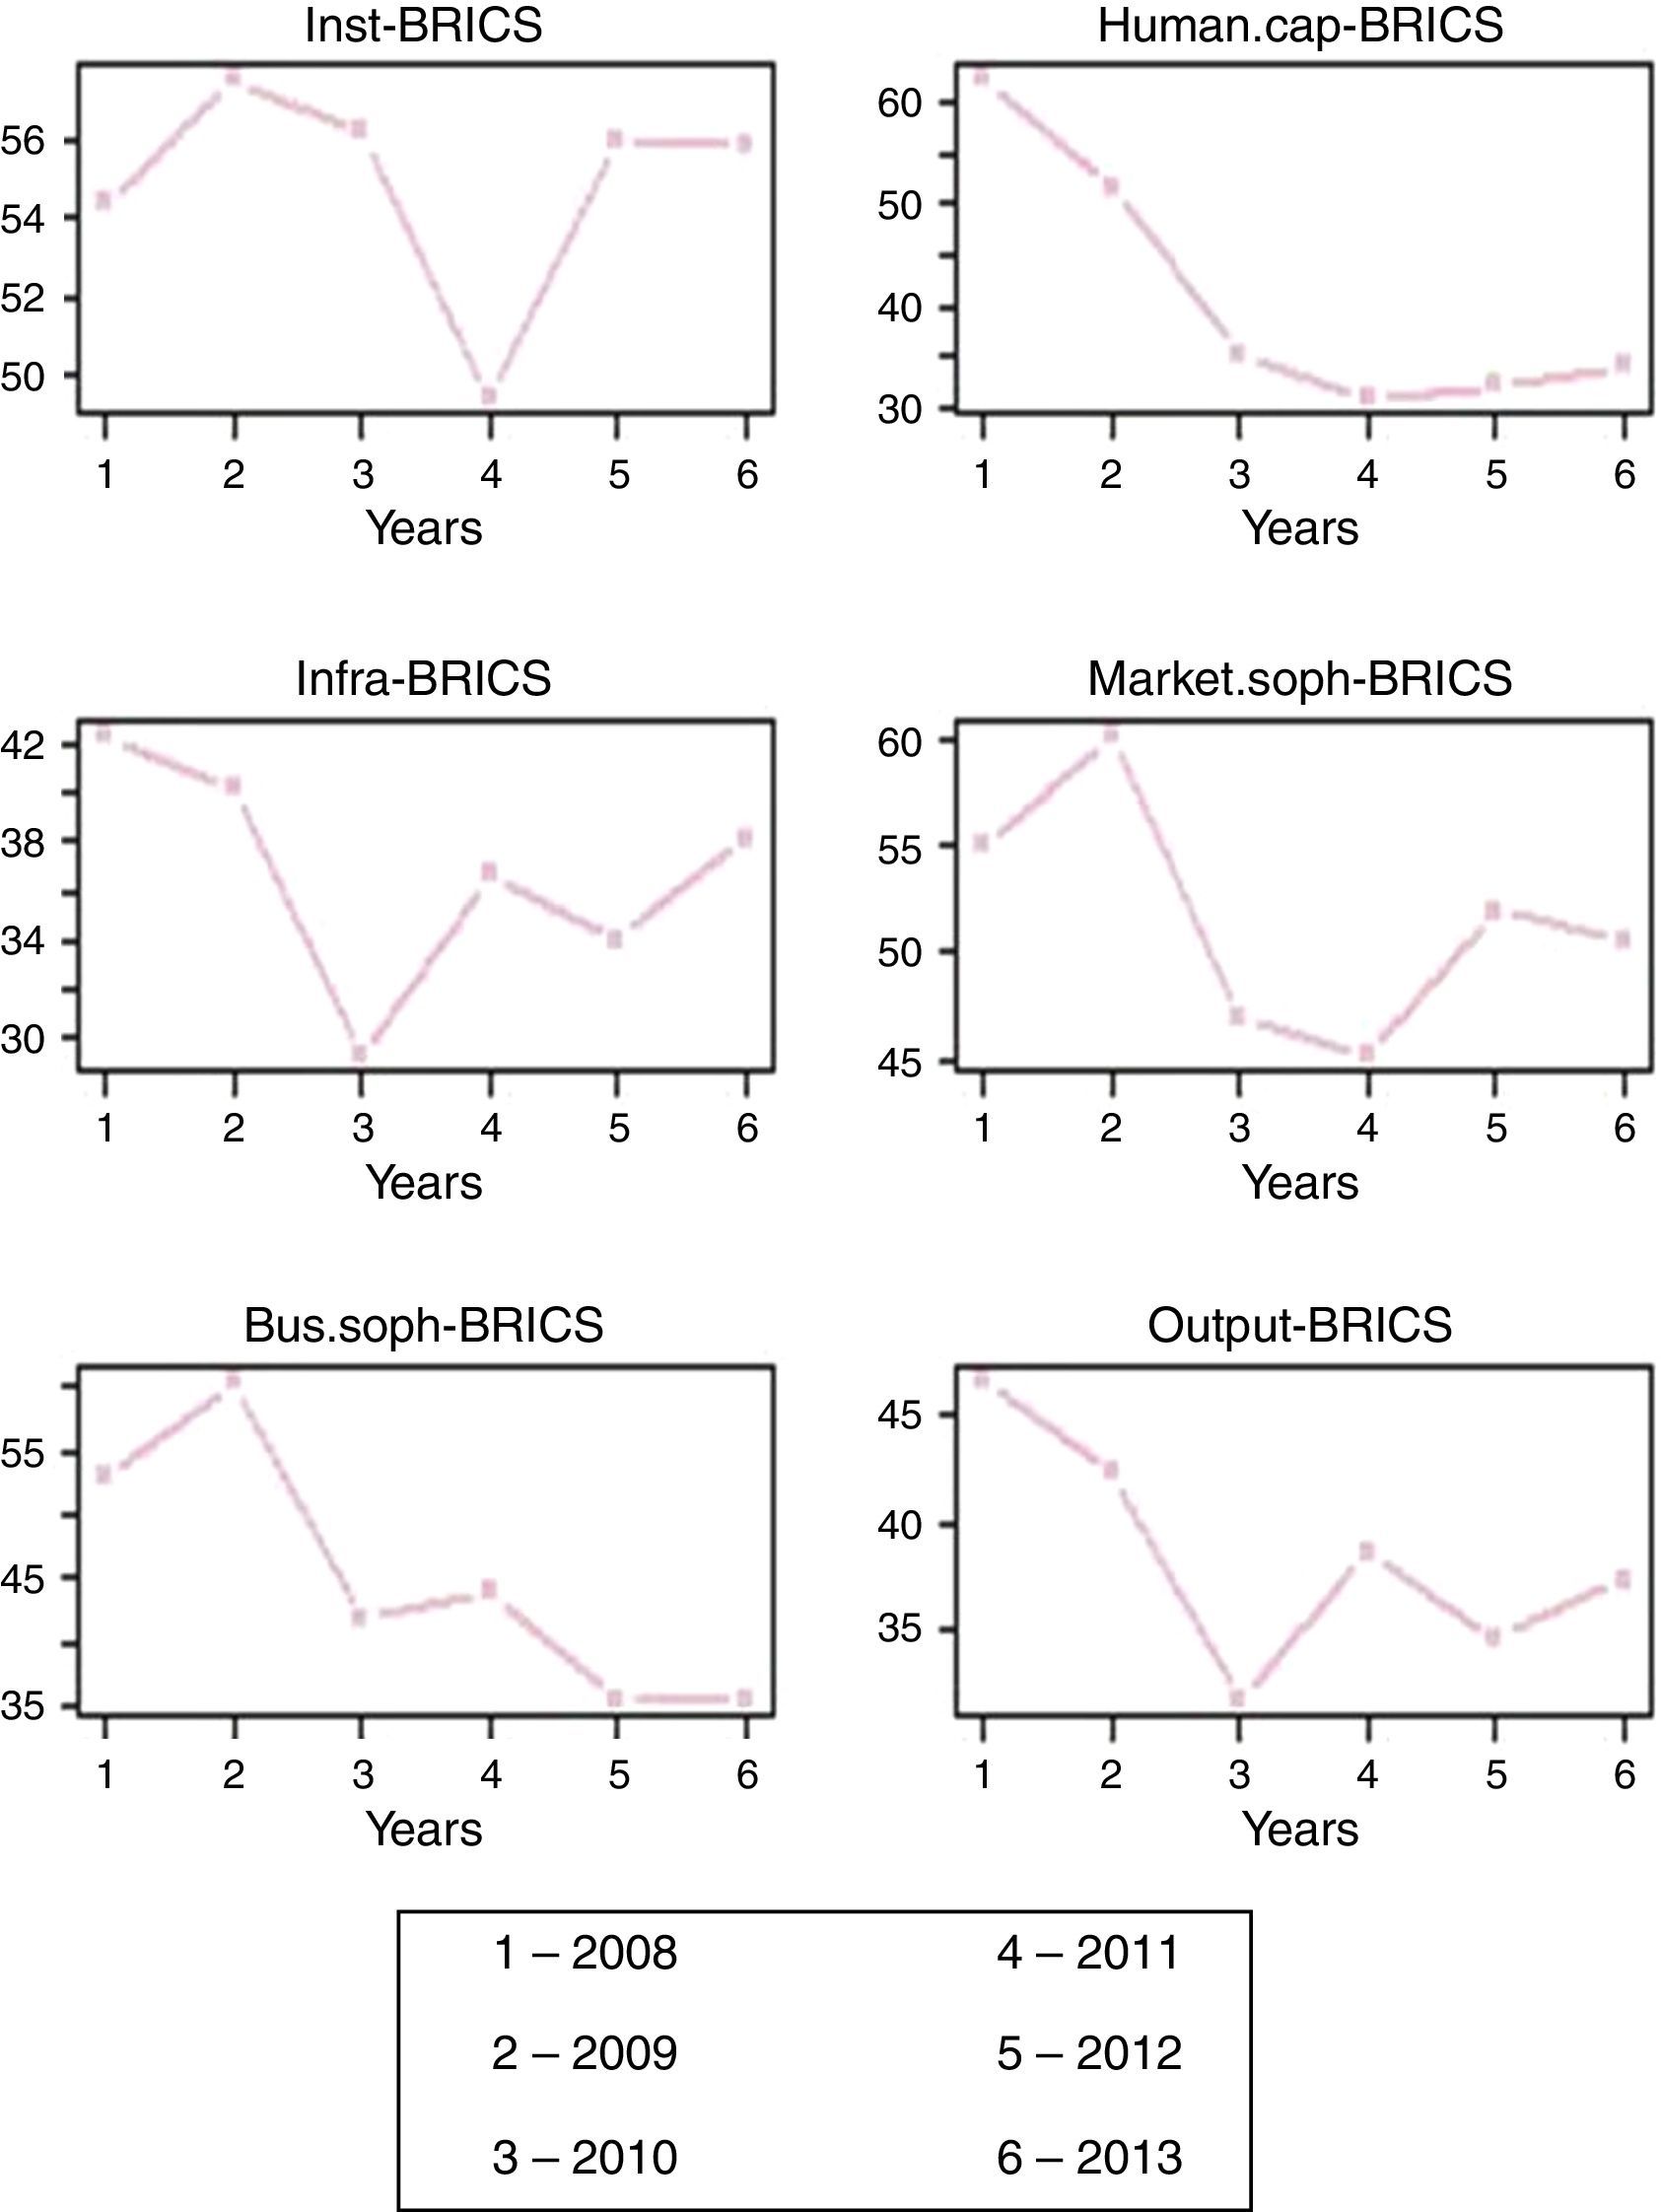
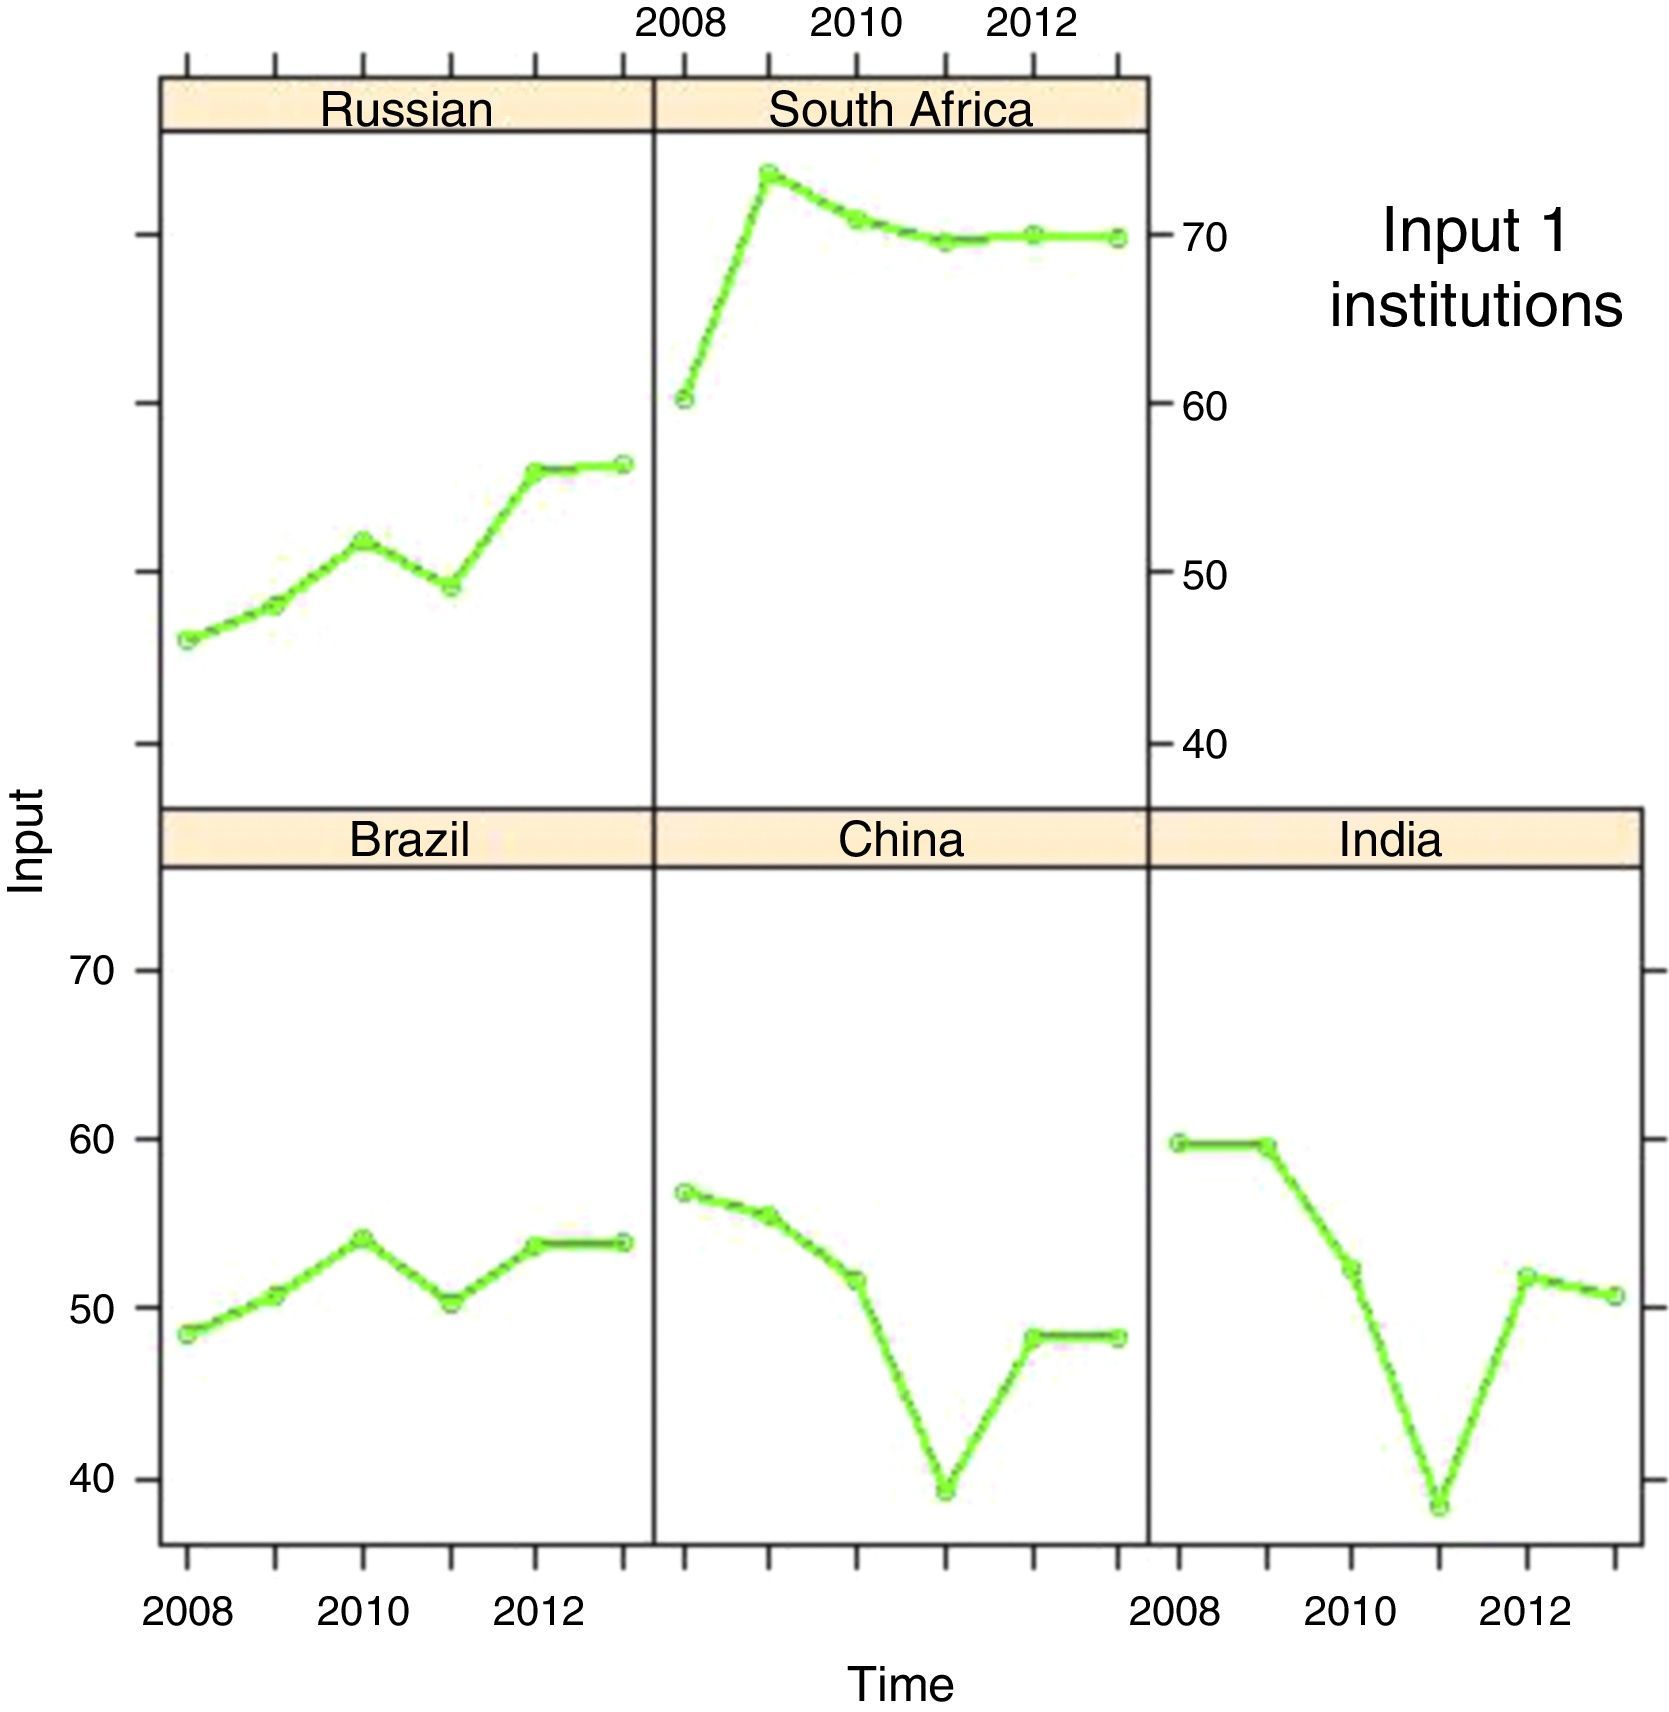
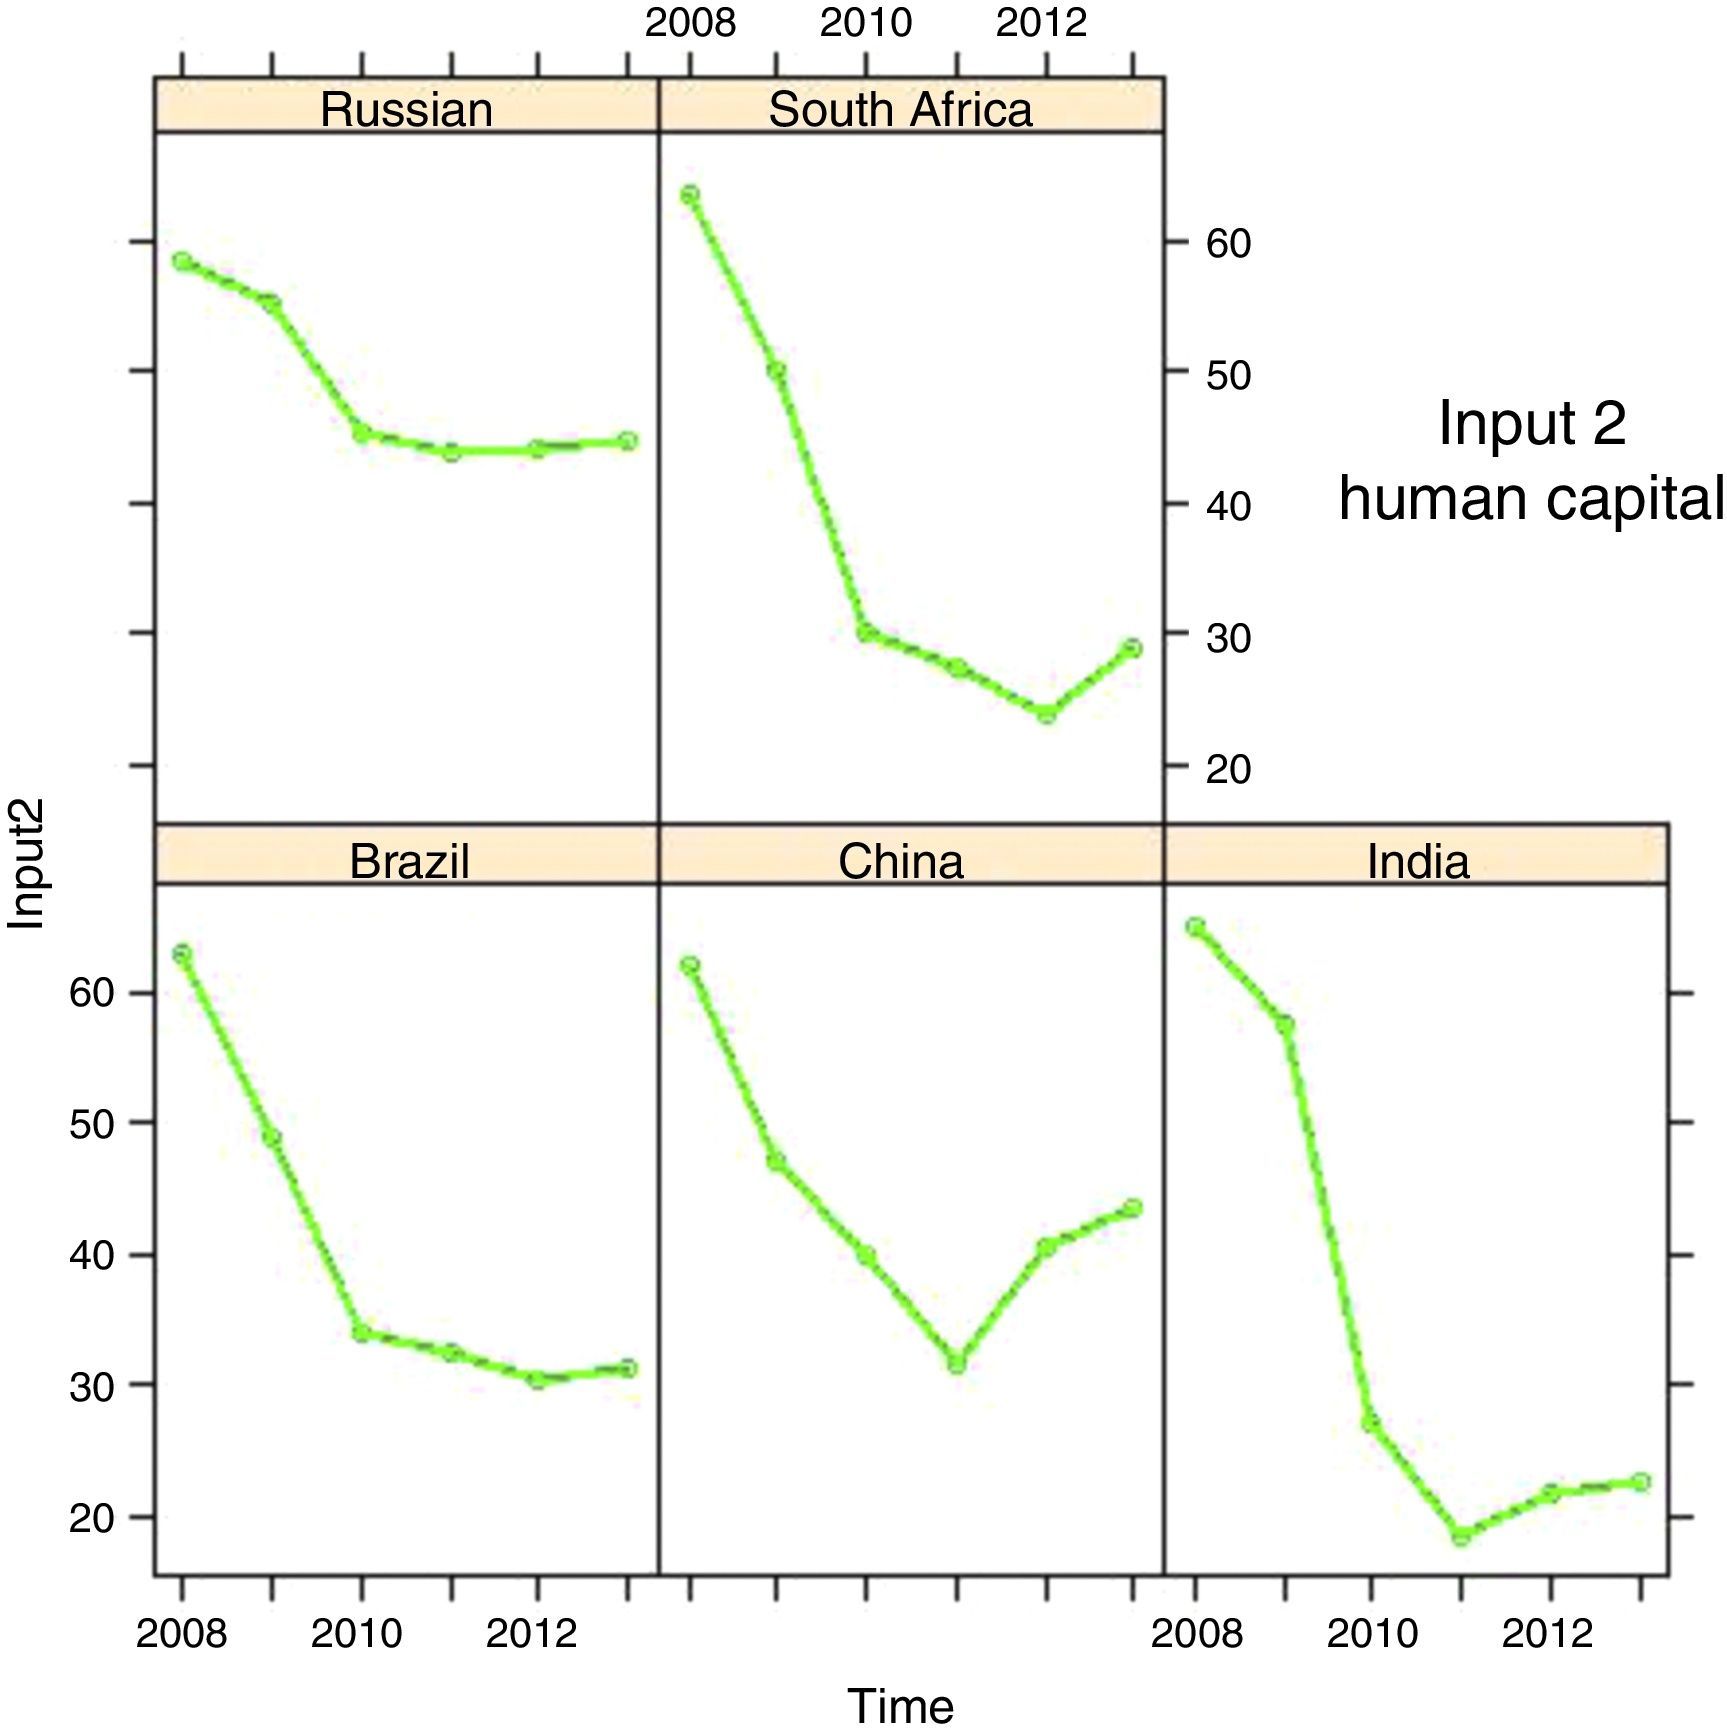
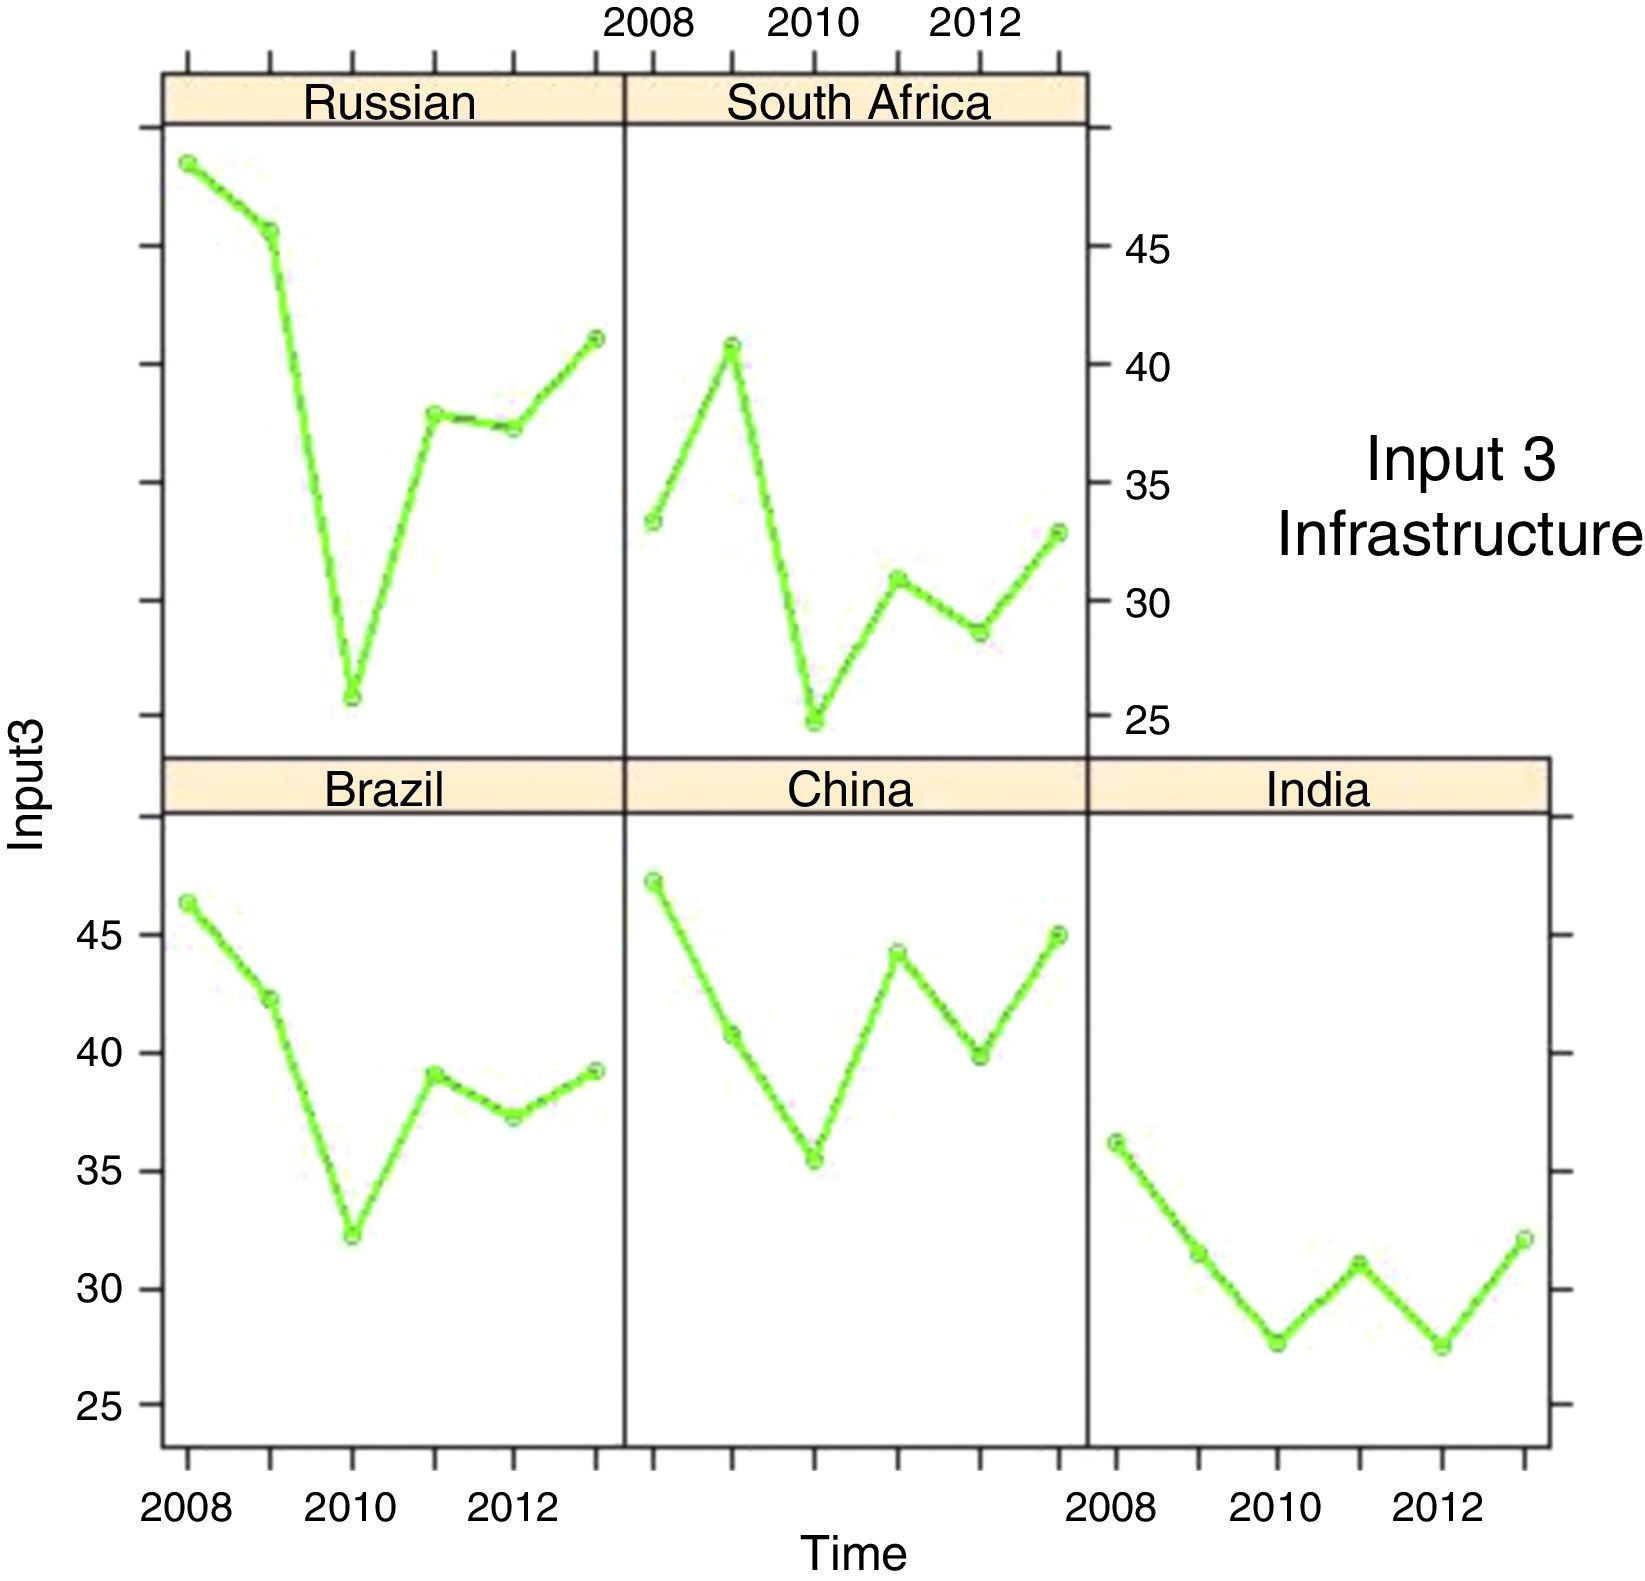
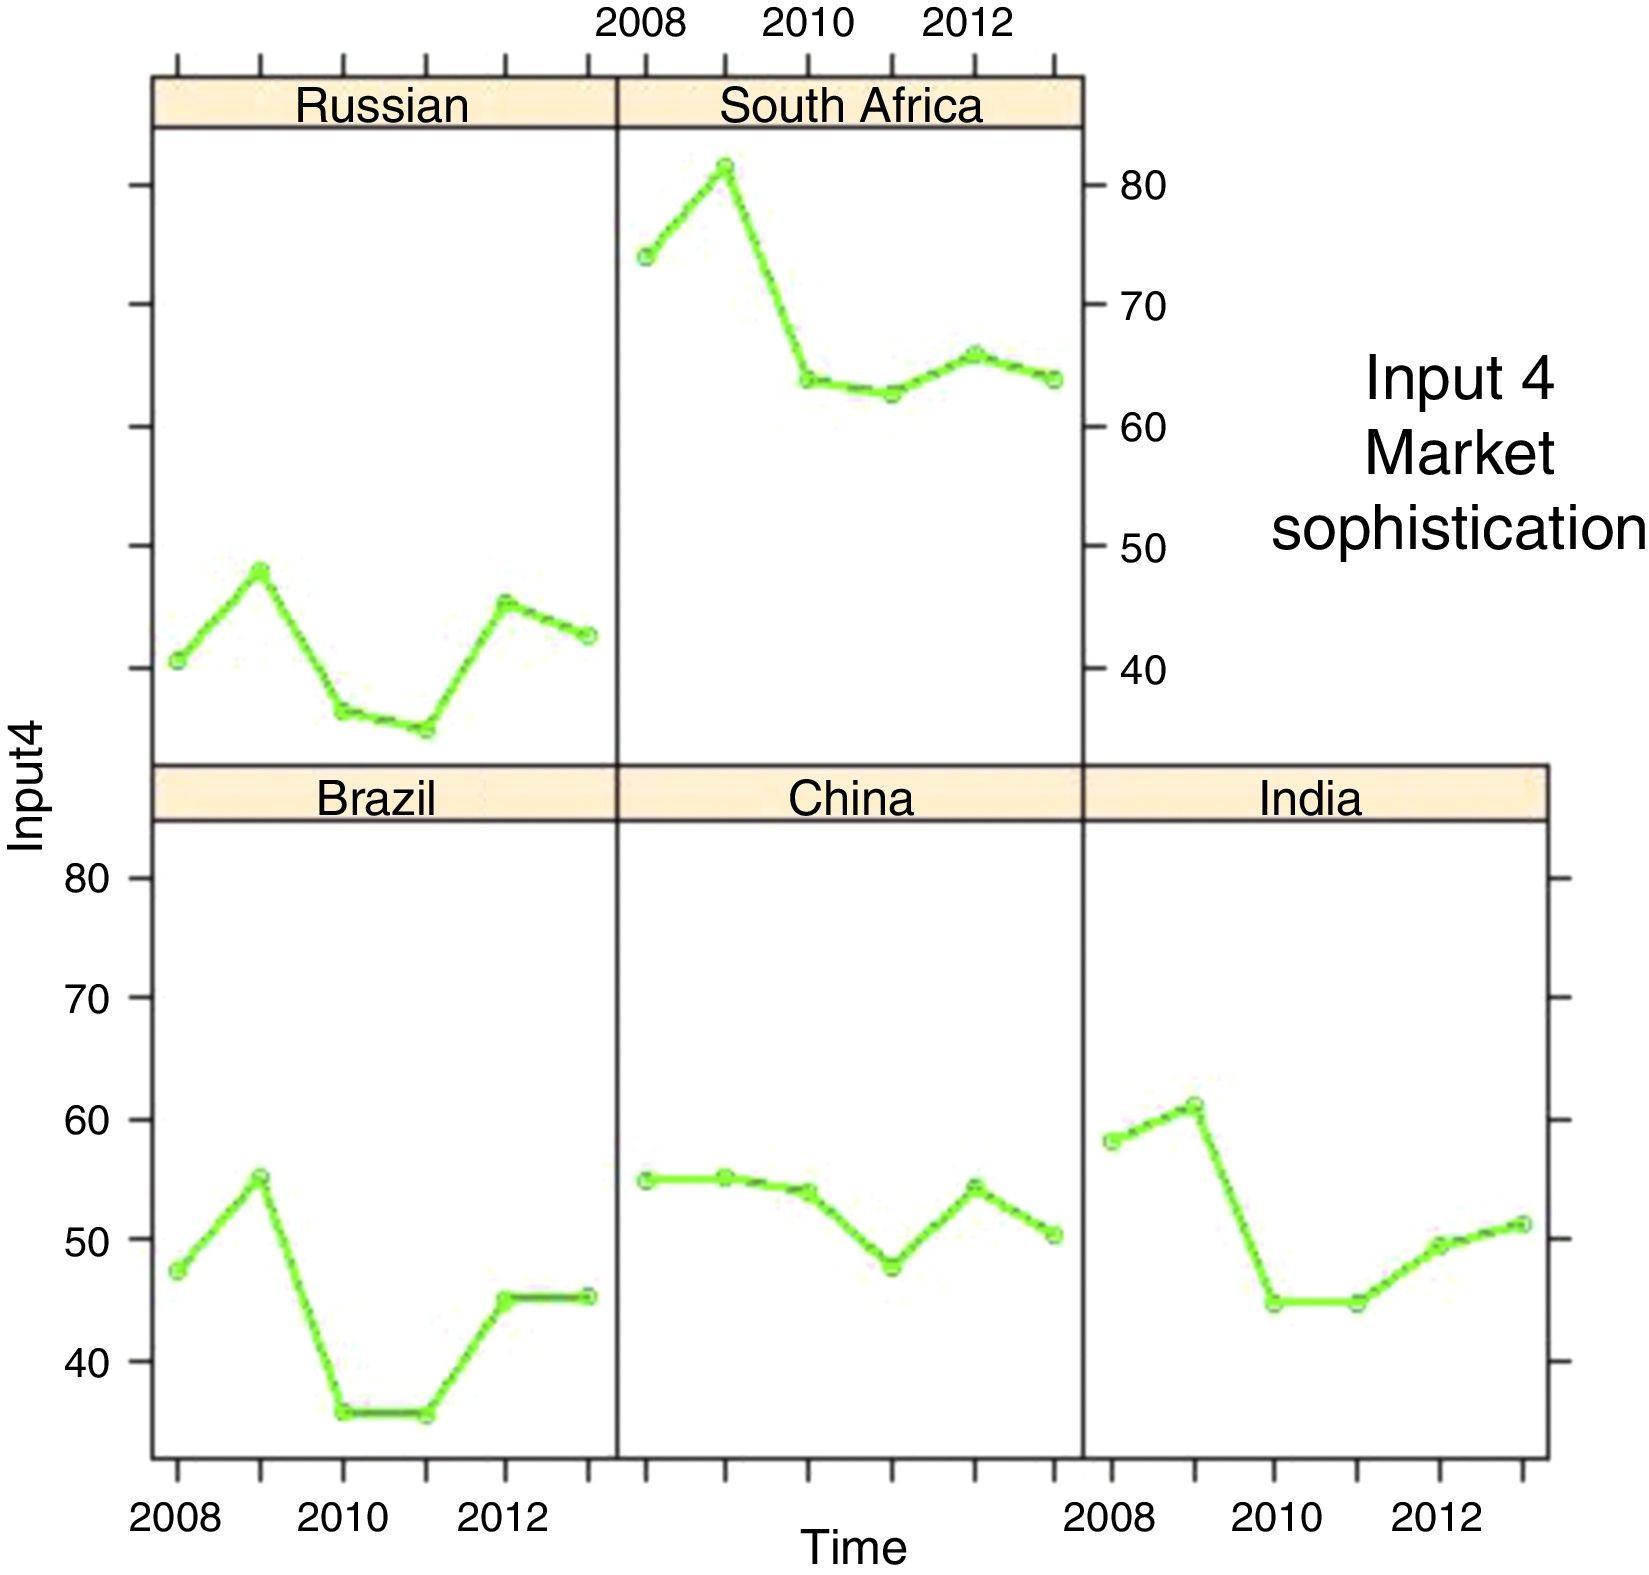
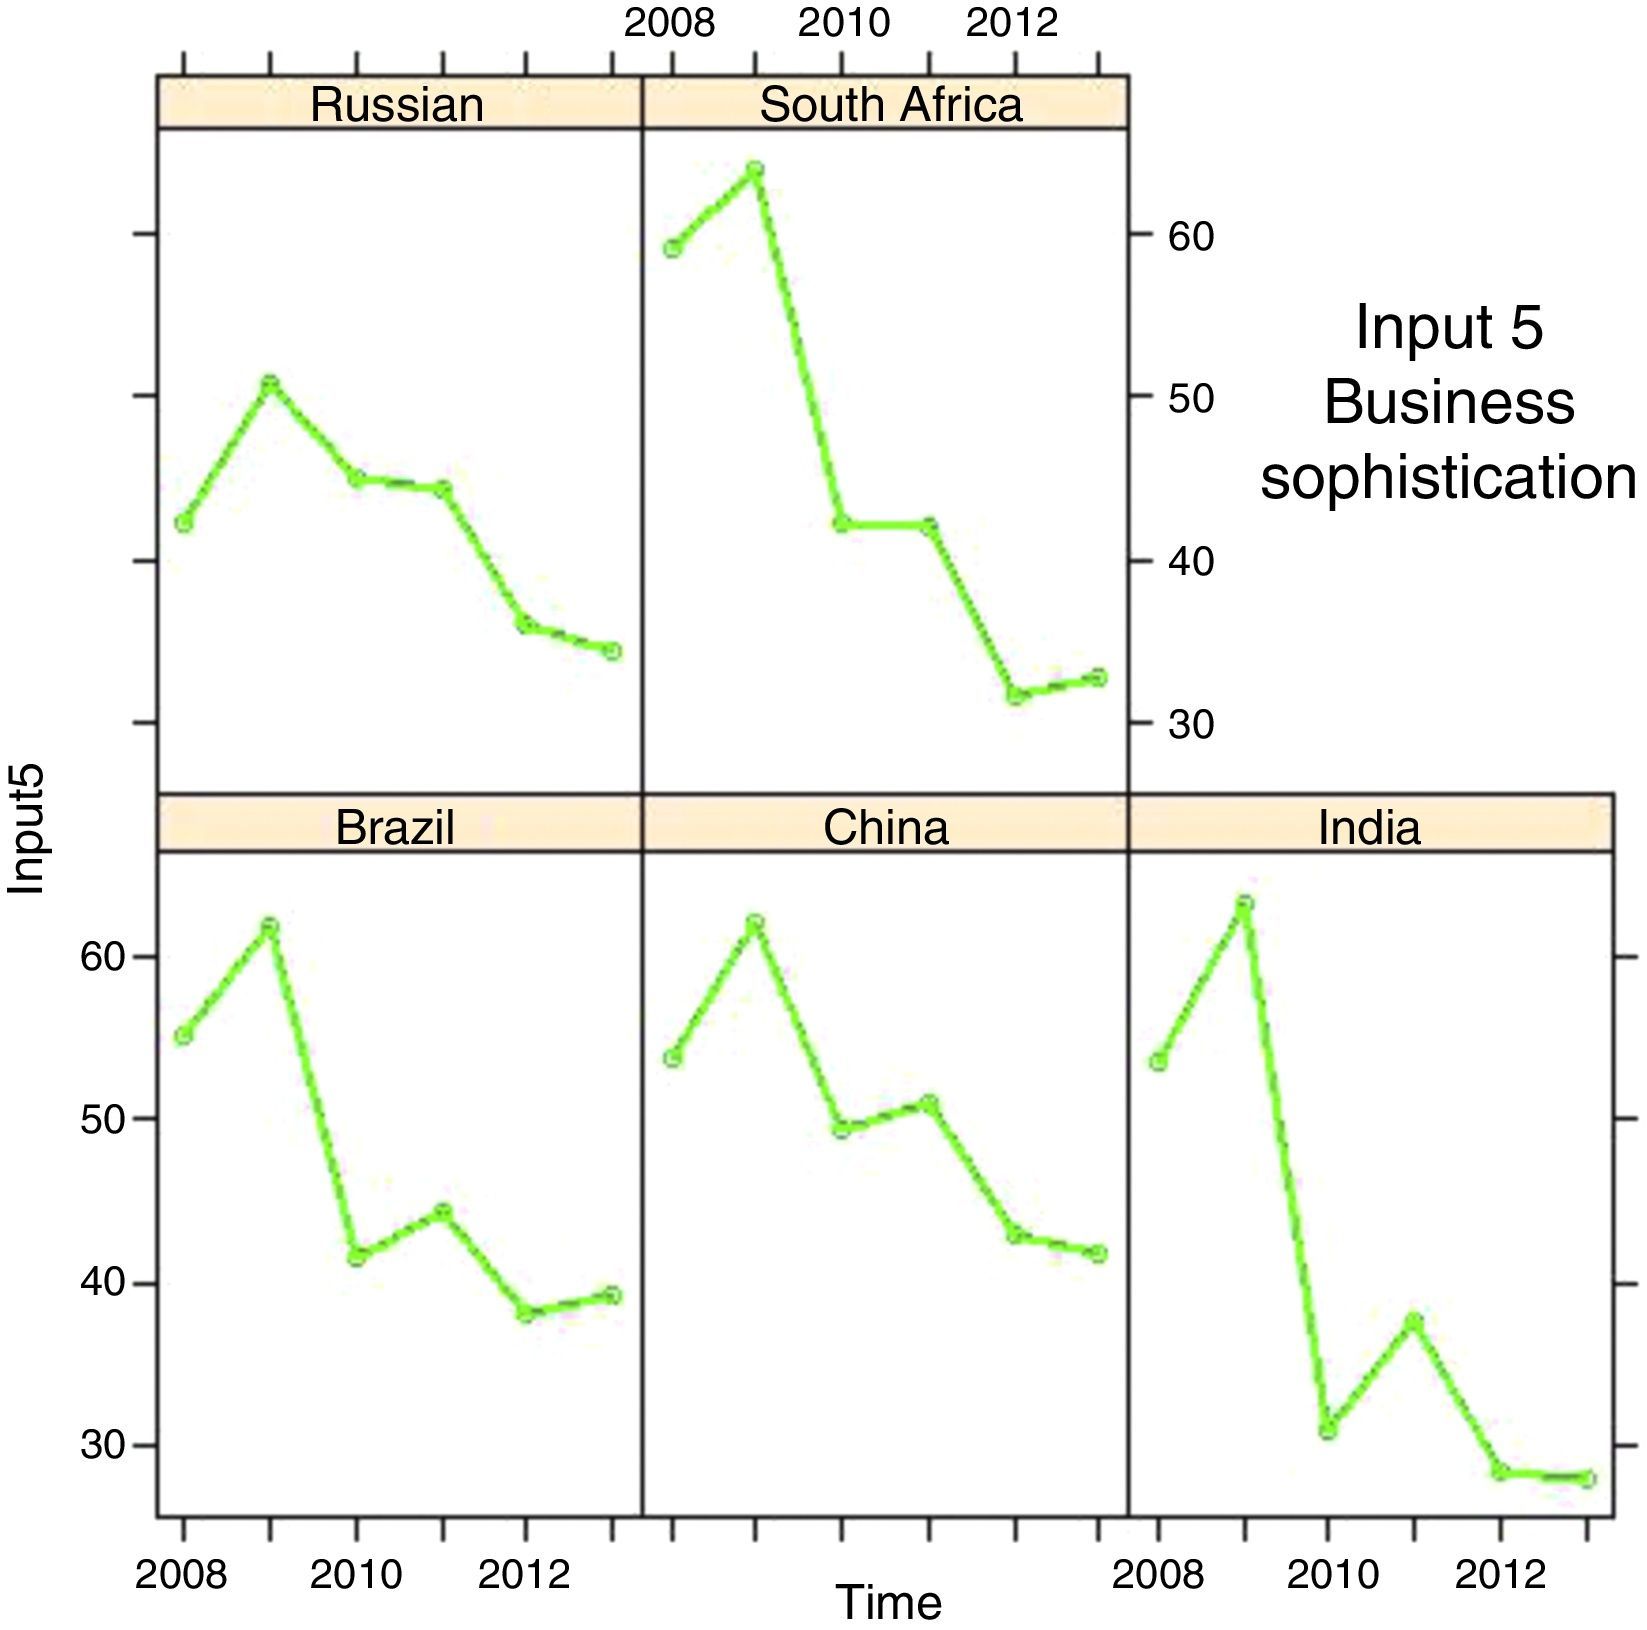
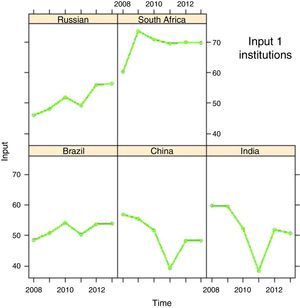
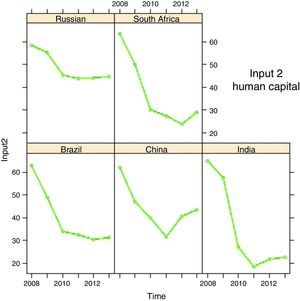
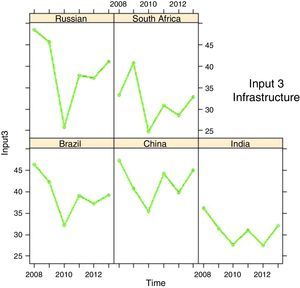
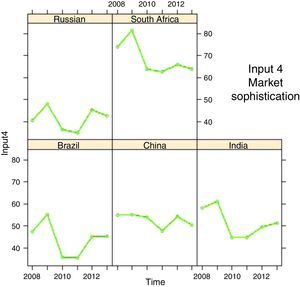
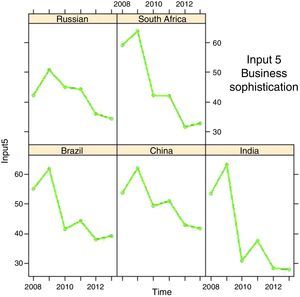
To have a clear picture of the Global Innovation Index behavior, it was necessary to analyze the inputs and outputs that compose this index. Fig. 2 illustrates each of this variables and its behavior from 2008 to 2013 (Fig. 3).
.")
No surprisingly, the five inputs considered plummeted during the economics crises.
In 2008 all variables presented a high score in the Global Innovation Index, nevertheless some of those variables showed an increase in the following year, such as Institutional, Market Sophistication, and Business Sophistication. However, between 2009 and 2010 all variables showed a drastic decrease. Some, such as Infrastructure and Output (knowledge), reached the lowest position. Nevertheless, after some indices showed some improvement in 2010, only Institutional and Infrastructure indices have seen a full recovery.
Once again, it is suggested that the inputs and outputs of the Global Innovation Index were impacted by the economic crises of 2008–2009, which may have led to a drastic decrease that still affected most of the inputs until 2013.
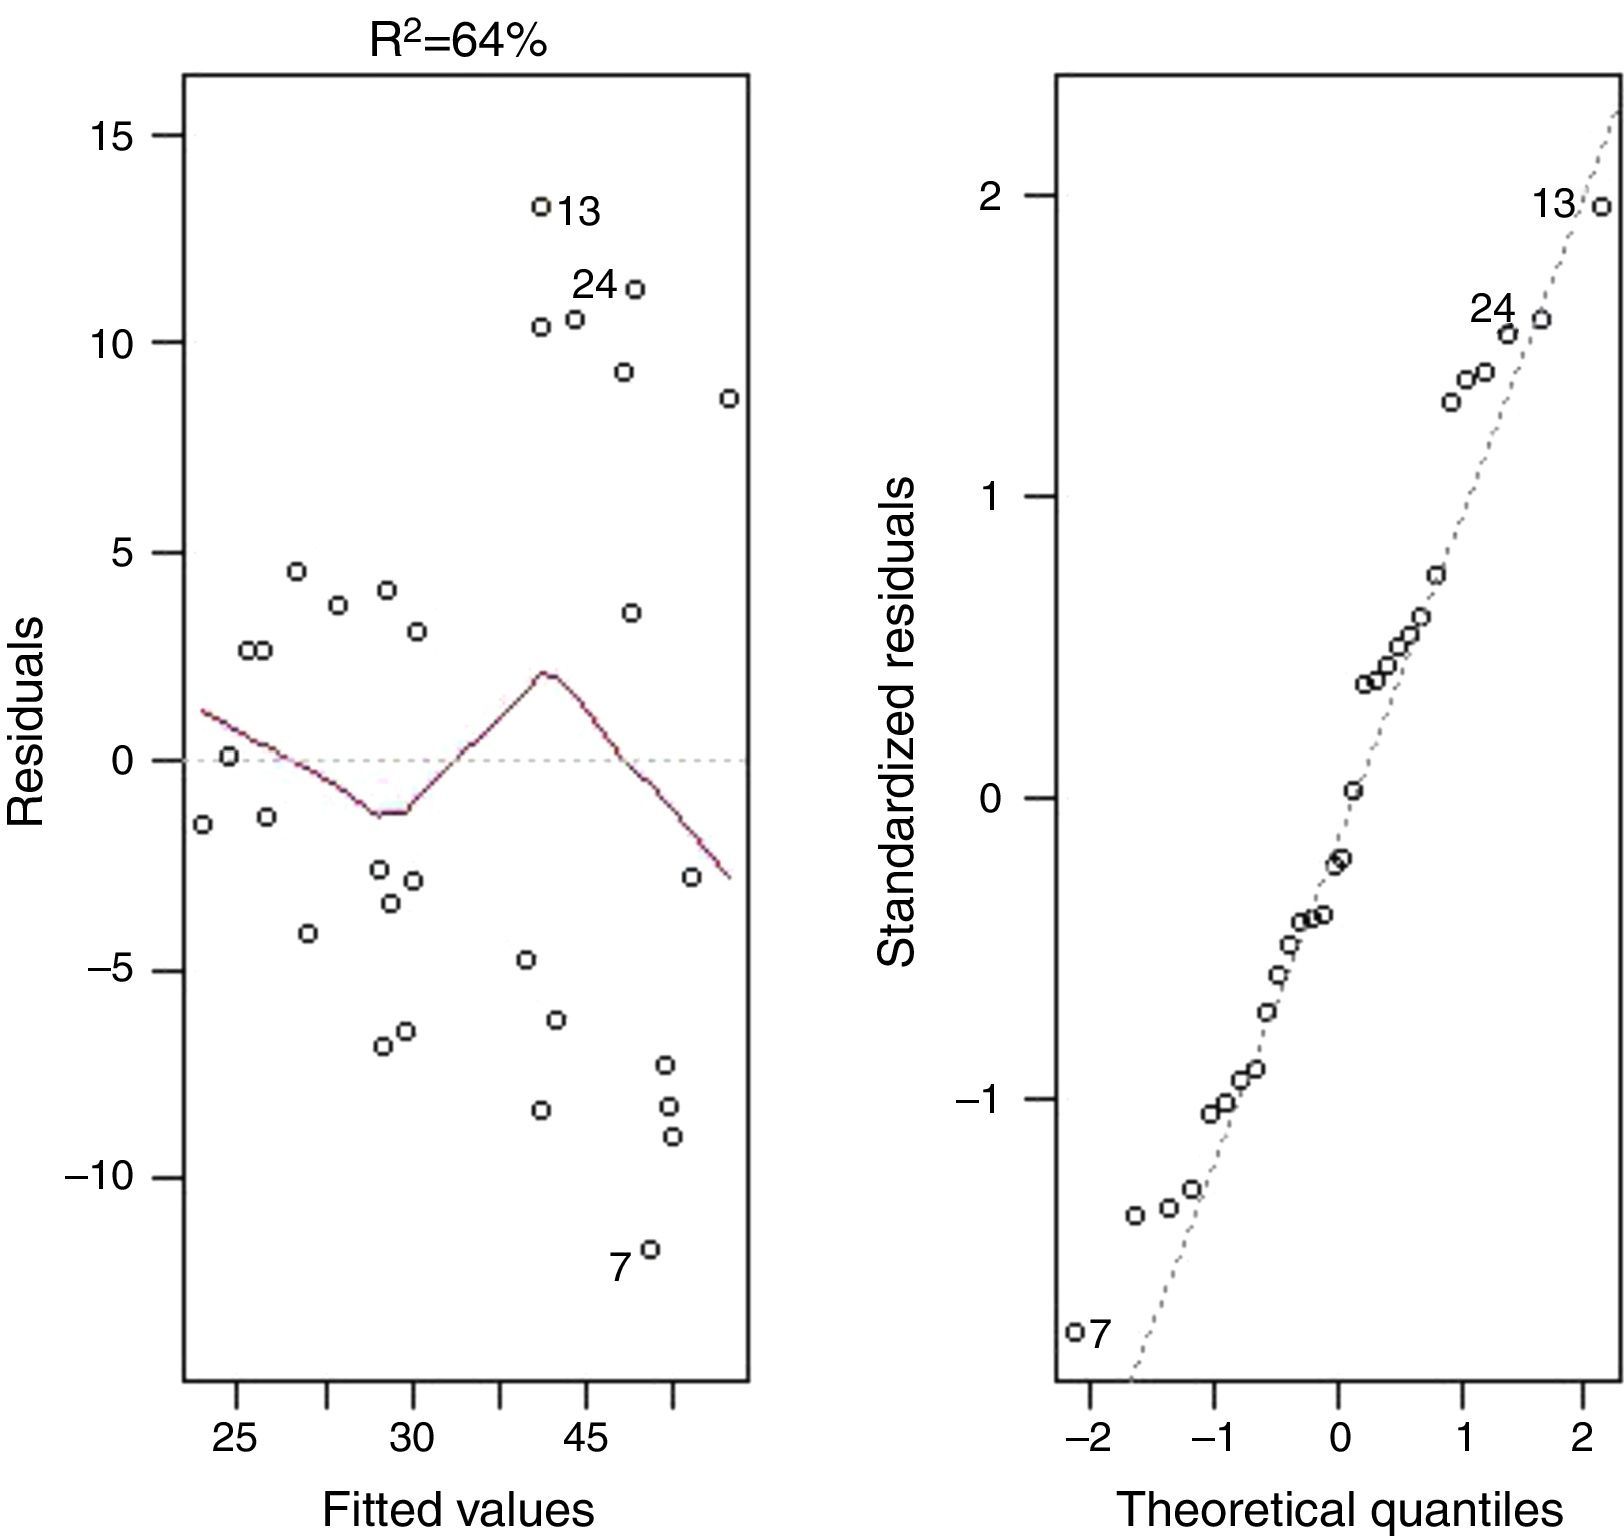
The second part of the analysis aims to observe the relation between inputs and outputs. A regression analysis of the BRICS (Fig. 4) and by country (Fig. 6) was run to verify the causality of the variable knowledge (outputs).

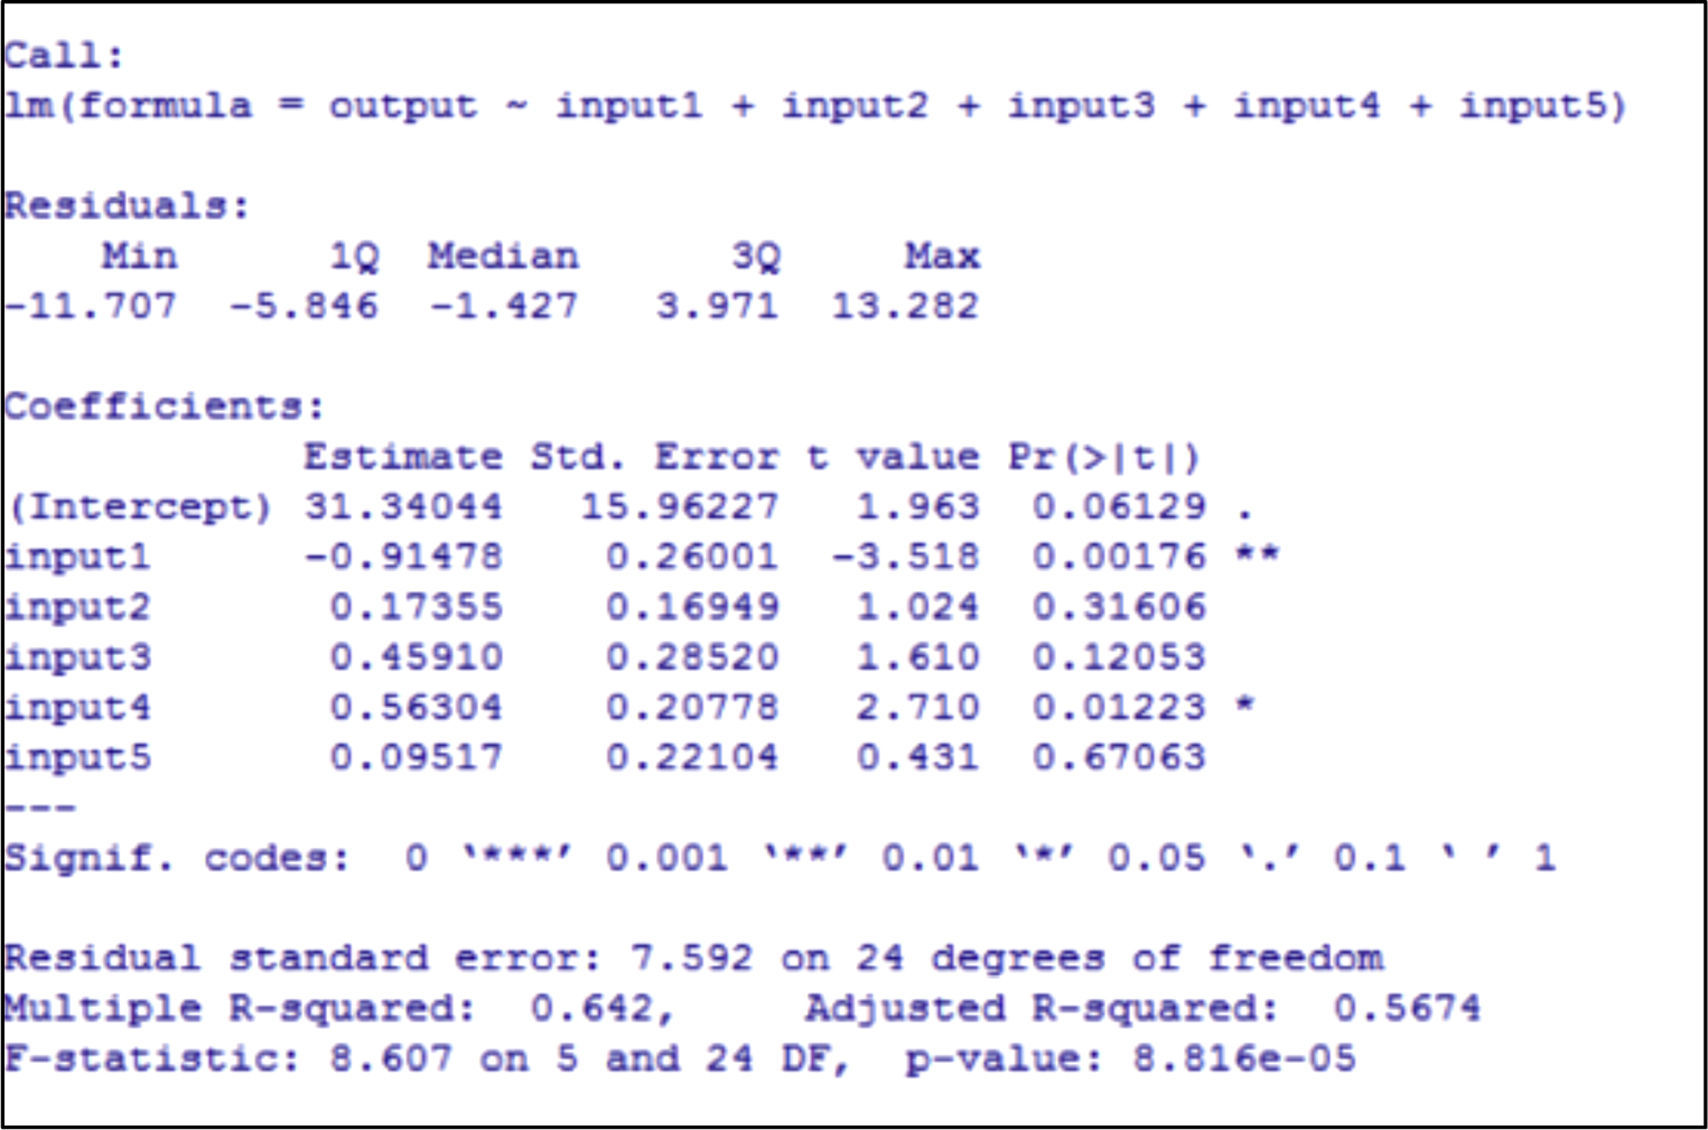
Fig. 5 shows the round Regression output data for the BRIC group using the 5 inputs and outputs mentioned throughout this work.


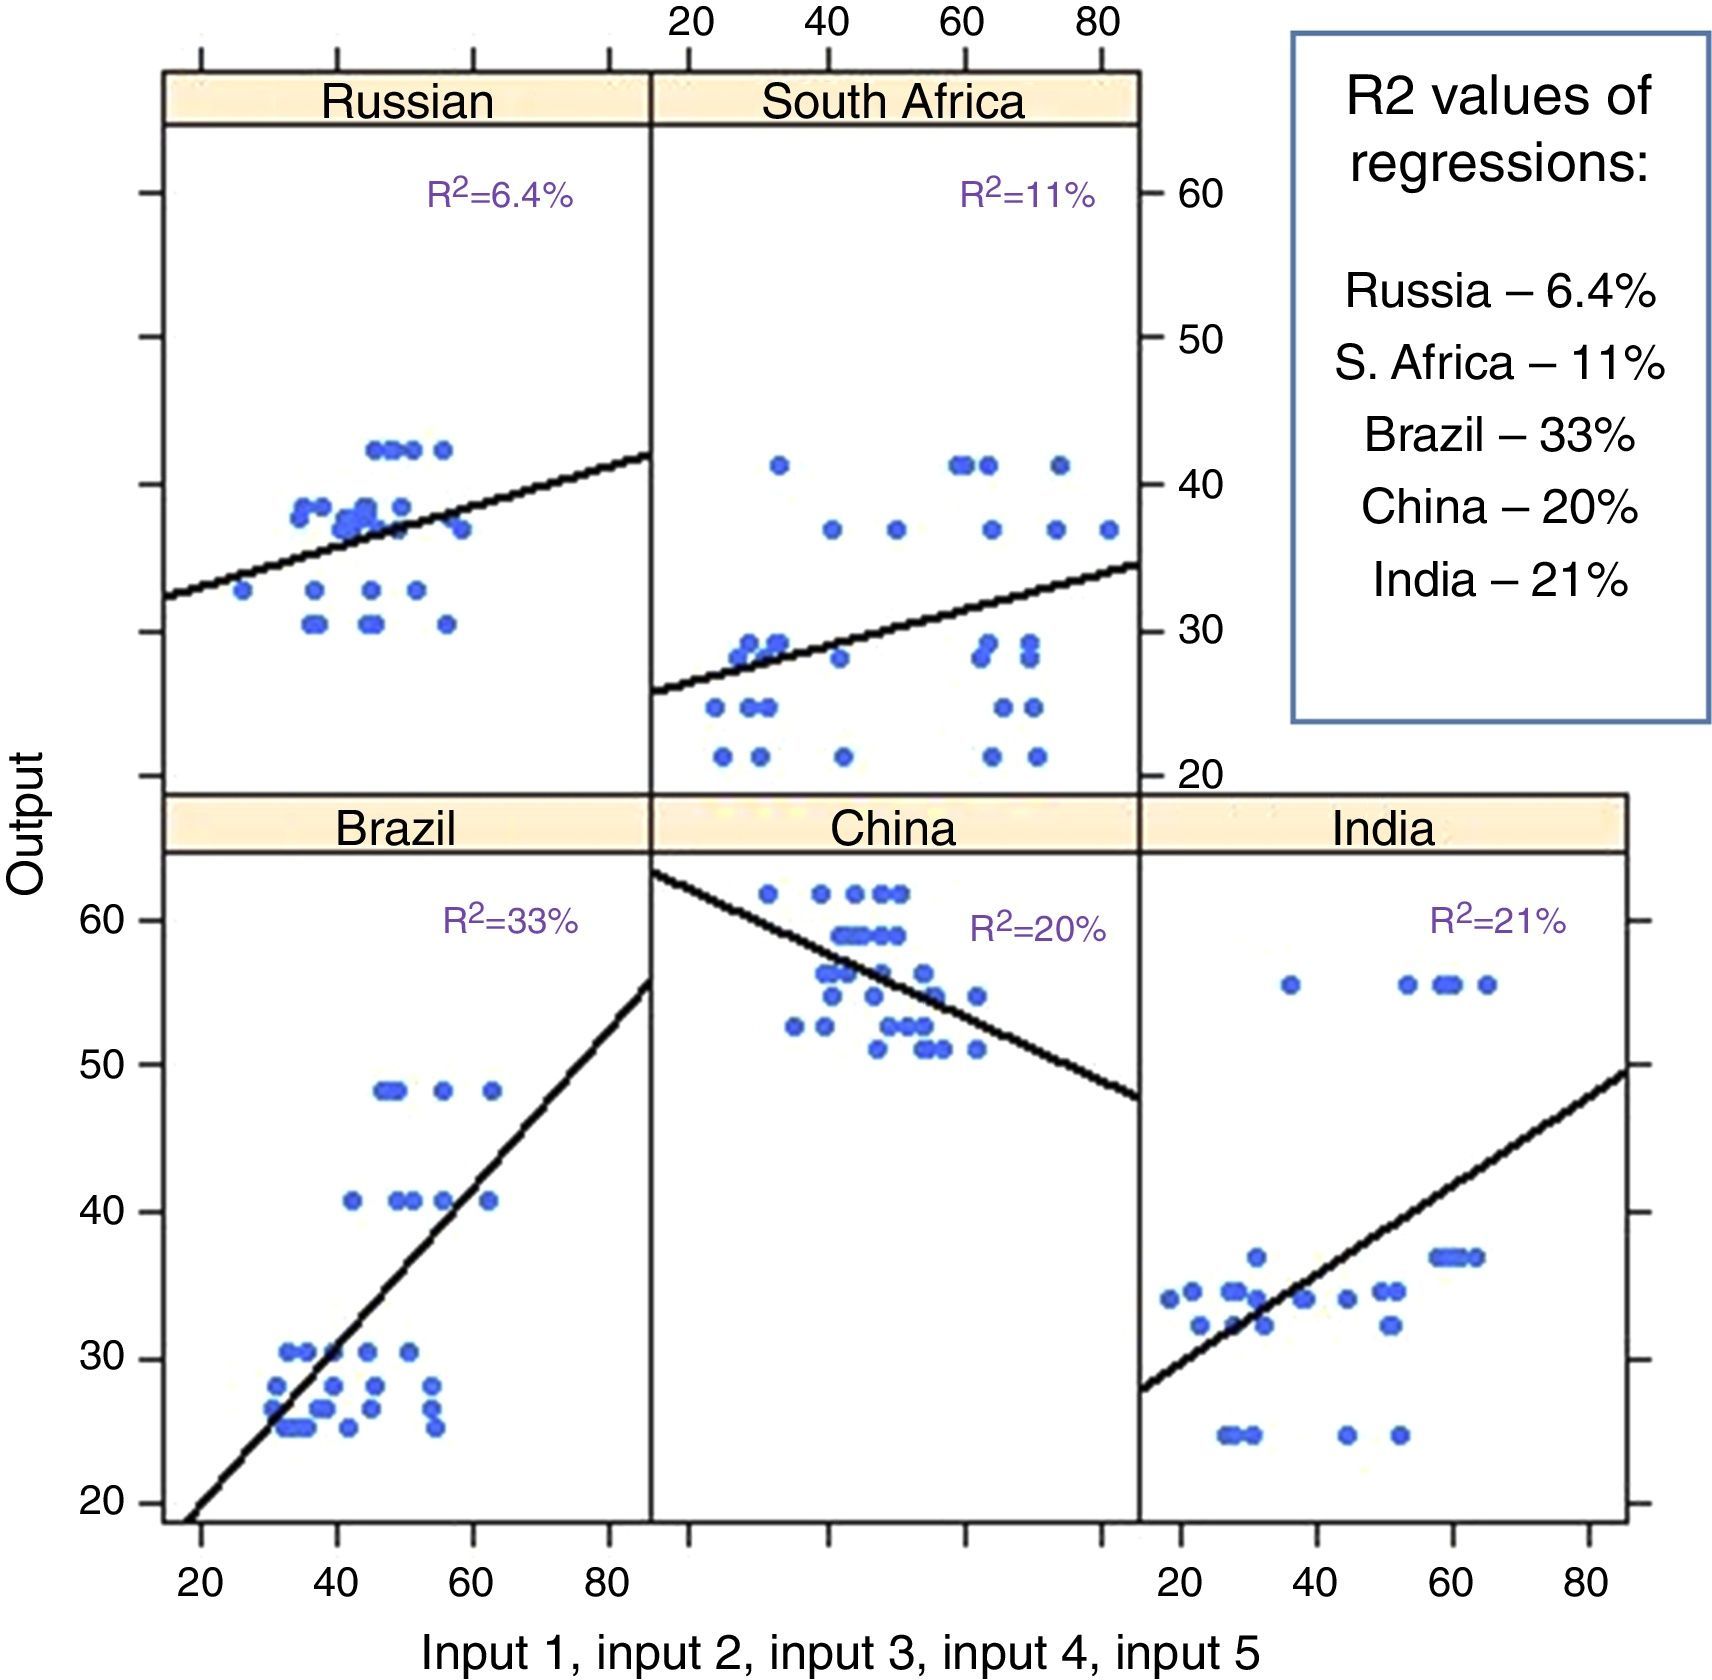
The regression analysis by country does not present any significant result. All R2 are lower than 35% showing that the output cannot be well explained by the inputs analyzed. On the contrary, the regression analysis considering the BRICS presents an R2=64%, which represents a high power of explanation of outputs in relation to inputs.
The BRICS group is an abstract conglomeration of 6 countries, and to say that there is a significant relationship between the inputs and outputs that build the innovation in the BRICS group as a whole, when it does not exist within any single member of the group, can be strange. However, this information seems to make relevant the fact that, when put together, that is, when needing to work together in an interactive and collaborative process, countries can achieve higher levels of knowledge by increasing and developing their inputs.
In the analysis of regression by country, Brazil and China have shown interesting results. The inputs can explain 33% of Brazil's output. Though this is not an expressive result, it is the highest percentage among the countries that compose the BRICS. Another interesting point is that the regression analysis for China showed a negative correlation: the higher the output the lower the input, and vice versa. An isolated analysis of this country can likely show which input is impacting this negative correlation.
Appendix shows the impact of each input on the regression analysis by country. The figures show the differences and similarities among them and also the power to explain their influence on the BRICS as a whole.
6ConclusionThis paper has discussed the importance of innovation in the BRICS context. It has been seen that innovation is essential for strategic change, growth, better performance, competitive advantage, economic development, value creation, and to obtain economic and social success in the globalized business world (Barney, 1991; Castaño et al., 2016; Day, 1994; Deeds et al., 2000; Dittrich & Duysters, 2007; Drucker, 1985; Schumpeter, 1934; Senge et al., 2006). Innovation is not only a matter of companies, but nations as well that want to increase their competitiveness in the business environmental of today and compete in the future must invest in innovation (Tellis, Eisingerich, Chandy, & Prabhu, 2008). This paper has also shown that investments in innovation can protect companies from crises (Hausman & Johnston, 2014; Lester & Piore, 2006). In that sense, the BRICS are already considering the importance of innovation. The Senior Official Meeting in Dalian, China shows that the BRICS are trying to achieve agreements regarding science, technology, and innovation.
The literature highlights the importance of the study of innovation in its different types (product, process, marketing, organizational), such as shown in the Schumpeter classification (1934). The Global Innovation Index, when analyzing innovation by country, does not follow this distinction because it considers several indicators, as shown in Appendix to this paper, which includes this type broadly. Thus, the final result obtained (General Innovation Index) is the ability to innovate in any of the types that literature presents.
This study tried to analyze the innovation progress of the BRICS as a bloc and their individual members from 2008 to 2013. We believe this goal has been satisfactorily achieved.
We can notice that the countries that make up the BRICS group behave in much the same way as the Innovation index, which is characterized by pillars that behave in different ways over the years analyzed.
Another factor that can be discussed is that the evolution of the Innovation index of BRICS was also observed when compared with the G8 countries, which is a group of developed economies. What we saw was that, although this last group presented higher absolute values than BRICS, the behavior of the two was very similar.
It was possible to analyze that the innovation in the BRICS from 2008 to 2013 presented a drop in this index during the economic crisis (2008–2009). However, the members of BRICS have shown some timid improvement that can be explained by the increase of the Infrastructure and Institutional indices.
There is a strong suggestion that the economic crisis of 2008–2009 was responsible for the drop of investment in the inputs of innovation. After the crisis it is possible to see a slight recovery due to the fast increase of Institutional and Infrastructure inputs. This analysis points out how inputs need attention in order to improve the innovation index showing that Human Capital, Market Sophistication, and Business Sophistication need special treatment.
In the first analysis the Global Innovation Index plummeted and did not show any expressive recovery. The second analysis, using Regression, illustrates how the inputs explain the output of knowledge. The R2 of BRICS is almost 65% while the R2 of each country is not over 35%. This means that as a whole the inputs are able to explain the output of knowledge when analyzed in the BRICS, but the scenario changes when the countries are analyzed individually. Perhaps this result shows the need for the BRICS countries to work in cooperation in order to stimulate the development of the innovation process.
The limitations of this study can contribute to further research. Studies considering all the inputs and outputs of the Global Innovation Index can contribute to a better understanding of the drivers of innovation. Moreover, as seen in Fig. 1, China seems to be in the lead on the issue of seeking ways to improve the status of innovation. To study this development seems interesting and can be mentioned here as a suggestion for future research. The study can also be replicated in other country groups such as the Asian Dragons and the European Union. As the data available increases, it is interesting to do a panel data analysis to have a forecast of innovation and assist the development of public policies to stimulate the growth of innovation.
Annex
- 1.
Institutions
- 1.1
Political environment
- 1.1.1
Political stability
- 1.1.2
Government effectiveness
- 1.1.3
Press freedom
- 1.2
Regulatory environment
- 1.2.1
Regulatory quality
- 1.2.2
Rule of law
- 1.2.3
Cost of redundancy dismissal, salary weeks
- 1.3
Business environment
- 1.3.1
Ease of starting a business
- 1.3.2
Ease of resolving insolvency
- 1.3.3
Ease of paying taxes
- 2.
Human capital & research
- 2.1
Education
- 2.1.1
Expenditure on education, % GDP
- 2.1.2
Gov’t expenditure/pupil, secondary, % GDP/cap
- 2.1.3
School life expectancy, years
- 2.1.4
PISA scales in reading, math, & science
- 2.1.5
Pupil-teacher ratio, secondary
- 2.2
Tertiary education
- 2.2.1
Tertiary enrolment, % gross
- 2.2.2
Graduates in science & engineering, %
- 2.2.3
Tertiary inbound mobility, %
- 2.3
Research & development (R&D)
- 2.3.1
Researchers, headcounts/mn pop
- 2.3.2
Gross expenditure on R&D, % GDP
- 2.3.3
QS university ranking, average score top 3
- 3.
Infrastructure
- 3.1
Information & communication technologies (ICTs)
- 3.1.1
ICT access
- 3.1.2
ICT use
- 3.1.3
Government's online service
- 3.1.4
E-participation
- 3.2
General infrastructure
- 3.2.1
Electricity output, kWh/cap
- 3.2.2
Logistics performance
- 3.2.3
Gross capital formation, % GDP
- 3.3
Ecological sustainability
- 3.3.1
GDP/unit of energy use, 2005 PPP$/kg oil eq
- 3.3.2
Environmental performance
- 3.3.3
ISO 14001 environmental certificates/bn PPP$ GDP
- 4.
Market sophistication
- 4.1
Credit
- 4.1.1
Ease of getting credit
- 4.1.2
Domestic credit to private sector, % GDP
- 4.1.3
Microfinance gross loans, % GDP
- 4.2
Investment
- 4.2.1
Ease of protecting investors
- 4.2.2
Market capitalization, % GDP
- 4.2.3
Total value of stocks traded, % GDP
- 4.2.4
Venture capital deals/tr PPP$ GDP
- 4.3
Trade & competition
- 4.3.1
Applied tariff rate, weighted mean, %
- 4.3.2
Non-agricultural mkt access weighted tariff, %
- 4.3.3
Intensity of local competition
- 5.
Business sophistication
- 5.1
Knowledge workers
- 5.1.1
Knowledge-intensive employment, %
- 5.1.2
Firms offering formal training, % firms
- 5.1.3
GERD performed by business, % GDP
- 5.1.4
GERD financed by business, %
- 5.1.5
GMAT test takers/mn pop. 20–34
- 5.2
Innovation linkages
- 5.2.1
University/industry research collaboration
- 5.2.2
State of cluster development
- 5.2.3
GERD financed by abroad, %
- 5.2.4
JV–strategic alliance deals/tr PPP$ GDP
- 5.2.5
Patent families filed in 3+ offices/bn PPP$ GDP
- 5.3
Knowledge absorption
- 5.3.1
Royalty & license fees payments, % total trade
- 5.3.2
High-tech imports less re-imports, %
- 5.3.3
Comm., computer & info. services imp., % total trade
- 5.3.4
FDI net inflows, % GDP
- 6.
Knowledge & technology outputs
- 6.1
Knowledge creation
- 6.1.1
Domestic resident patent app./tr PPP$ GDP
- 6.1.2
PCT resident patent app./tr PPP$ GDP
- 6.1.3
Domestic res utility model app./tr PPP$ GDP
- 6.1.4
Scientific & technical articles/bn PPP$ GDP
- 6.1.5
Citable documents H index
- 6.2
Knowledge impact
- 6.2.1
Growth rate of PPP$ GDP/worker, %
- 6.2.2
New businesses/th pop. 15–64
- 6.2.3
Computer software spending, % GDP
- 6.2.4
ISO 9001 quality certificates/bn PPP$ GDP
- 6.2.5
High- & medium-high-tech manufactures, %
- 6.3
Knowledge diffusion
- 6.3.1
Royalty & license fees receipts, % total trade
- 6.3.2
High-tech exports less re-exports, %l
- 6.3.3
Comm., computer & info. services exp., % total trade
- 6.3.4
FDI net outflows, % GDP
- 7.
Creative outputs
- 7.1
Intangible assets
- 7.1.1
Domestic res trademark app./bn PPP$ GDP
- 7.1.2
Madrid trademark app. holders/bn PPP$ GDP
- 7.1.3
ICTs & business model creation
- 7.1.4
ICTs & organizational model creation
- 7.2
Creative goods & services
- 7.2.1
Cultural & creative services exports, % total trade
- 7.2.2
National feature films/mn pop. 15–69
- 7.2.3
Global ent. & media output/th pop. 15–69
- 7.2.4
Printing & publishing manufactures, %
- 7.2.5
Creative goods exports, % total trade
- 7.3
Online creativity
- 7.3.1
Generic top-level domains (TLDs)/th pop. 15–69
- 7.3.2
Country-code TLDs/th pop. 15–69
- 7.3.3
Wikipedia edits/pop. 15–69
- 7.3.4
Video uploads on YouTube/pop. 15–69
The authors declare no conflicts of interest.