


The connection between change and innovation is not always linear and there are not many studies on the subject in the area of services. This study aims to explain the link between willingness to change and innovation in services. The constructs Willingness to Change in Services and Innovation in Services have been analyzed. Two scales were applied in order to measure these constructs in a sample of 351 companies developing software services in Brazil. Two indices were generated: the Willingness to Change Coefficient – derived from the perception of technical staff and managers in relation to the variables of each factor on the Willingness to Change in Services scale – and the Innovation in Services Coefficient – derived from measures concerning the introduction of new or substantially improved software by companies and their impact. Linear regression analysis showed no significant correlation between Willingness to Change in Services and Innovation in Services. These findings can be explained by factors such as the dissonance between the constitutive logic of the Willingness to Change in Services and IS scales, since the former applies fully to the analysis of services while the latter derives from industrial indicators; the omission of phenomena that may act as mediators in the relationship; the nature of Change in Services, which could be related to other processes than those directly related to customer and provider, so that the agents of change are not considered in innovation measures and, therefore, not measurable on the Innovation in Services scale.
In the area of innovation, a number of studies aiming to identify innovation vectors stand out, such as Becker and Dietz (2004), exploring Research and Development (R&D) as an innovation vector, Gu, Zhang, and Kang (2006), testing the impact of R&D on innovation generation and patent registration in China, and Simioni, Hoff, and Binotto (2015), exploring factors that drive innovation in the wood sector in Brazil. One of the drivers traditionally associated with innovation is change. The assumption is that change is a necessary condition for innovation to take place. Change is thus characterized as a stage prior to innovation. The two phenomena have become widely recognized theoretically as partners (Poole & Van de Ven, 2004) and have been explored in studies that test the limits of their relationship. Two camps have emerged: those who explore the relationship between technical change and innovation, such as Mowery and Rosenberg (2000), Jamison and Hård (2003) and Hekkert, Suurs, Negro, Kuhlmann, and Smits (2007), and those who investigate the construct of innovation-related organizational change, such as Edwards (2000) and Dooley (2004).
The wide application of these studies to different sectors, activities and business segments indicates that the relationship between change and innovation is not limited to specific sectors. This reasoning leads us to propose a central research hypothesis: in services, as well as in industrial activities, change behaves as a predictor of innovation. In order to test this hypothesis, some questions need to be answered: how should the phenomena of change and innovation be addressed in order to develop measurement scales that are valid for services? How should the predictive link between these phenomena be tested?
To answer these questions, the first task is to study the two phenomena (accepted here as constructs) of change and innovation in the context of service activities. While much has been published on innovation in services since 2010, a period of time accounting for 70% of the studies on the subject (Moreira, Guimarães, & Philippe, 2013), little has been said on the phenomenon of change in services over recent decades. This is not a matter of chance, but a characteristic inherent to the services themselves, for which change is essential to their operation (Delaunay & Gadrey, 1987; Hill, 1977). If every service entails a change, how can one identify change in services? Answering this dilemma seems to stem from neo-Schumpeterian theory (Nelson & Winter, 2005) for investigating the nature of the innovation process.
Among the approaches historically used in innovation studies, the demand-pull approach has been particularly prominent in the context of services. This is explained by its assumption that the customer – in the context of the consumer market – is a source of innovation. The application of this approach to services explains why the customer plays a direct role in generating innovation. Knowing that the provision of a service depends on the coexistence of and interaction between provider and customer (Gadrey, 2000; Gallouj, 2002; Kon, 2004; Miles, 2005; Rubalcaba, 2007), two agents emerge who can intervene in the innovation process and, before that, in the process of change in a service.
Moreira et al. (2013) understand that the service provider plays an active role in accepting or imposing barriers to the assimilation of inputs for change in service that customers suggest. They argue that change in services corresponds to requests for changes in the features previously agreed for a service during its delivery. Customers make dynamic requests during service delivery – requests for alterations, scope changes, project reviews, and so on – and it is up to the providers to accept, revise or reject such requests. The authors outline the conditions for a provider to accept suggested changes to the original project of a service. This is Willingness to Change in Services (WiCS), understood here as representing change in services.
With the measurement of change in services established, the next task is to adopt criteria to measure innovation in services. We choose, in this study, to adopt a measurement scale applied in the Technological Innovation Survey – PINTEC (IBGE, 2010) – that, in turn, is derived from international measurements suggested by the Oslo Manual (OECD & Eurostat, 2005). We attempt to address the second question that emerges from this study: how should the relationship between change and innovation in services be tested? In order to answer this question, this paper aims to explain the relationship between willingness to change and innovation in services.
Change and innovation: closeness and boundaries between the two conceptsChange can be broadly understood as alteration over time. The recognition of this alteration of reality – and therefore change – is linked to individual perception (Lau & Woodman, 1995). The concept of innovation can be understood in the present techno-economic paradigm (Perez, 2002) in the light of the neo-Schumpeterian or evolutionary school (Nelson & Winter, 2005). Schumpeter's (1982, p. 93) concept of innovation as “the carrying out of new combinations of resources” capable of generating new goods, production methods, markets, raw materials and forms of organization is a starting point for the advances proposed by evolutionary authors. The neo-Schumpeterian school aims to develop the original Schumpeterian concept – proposed at the height of the Fordist economic period – into a concept of the innovation phenomenon capable of encompassing new forms in an economy in transition to a service economy (Rubalcaba, 2007). Neo-Schumpeterian authors emphasize innovation as a means to obtain competitive advantage from the appropriation of cost and quality advantages (Kon, 2004). Thus, innovation is defined as a phenomenon that can impact the competitiveness of organizations.
Change and innovation are close, which is why they can be considered “partners” (Poole & Van de Ven, 2004). The joint analysis of some of the concepts attributed to change and innovation – assuming there are no universally accepted and definitive concepts for either of them – makes it possible to establish boundaries between the phenomena. The concepts of change, when referring to alteration of a current situation, direct attention to the act of change rather than to its effects.
The innovation phenomenon, in addition to organizational change, enables alteration of the current situation through the introduction of a new combination of resources. Innovation also entails the assumption that improved results will be obtained and will generate value – originally described as economic value in the Schumpeterian analysis, although later theoretical developments accept innovations capable of generating social value, providing the bases for theories of social entrepreneurship. This approach makes it possible to establish two key dimensions for innovation analysis and diagnosis: the dimension of action (implying the introduction of a new combination of resources), and the dimension of qualitatively improved results (implying that innovation necessarily generates qualitative improvement in relation to the prior situation) (IBGE, 2010).
The breakdown of the two phenomena reveals that change and innovation share the dimension of action, given that both refer to a greater or lesser extent to alterations in the current situation. Just as change refers to a situation of alteration of a previous reality, innovation can also be associated with this understanding. Changes would thus generate alterations in organizations, products or services, and also for innovations, which would link the two phenomena. While for change the defining focus is on the parameters altered by the change (Poole & Van de Ven, 2004), for innovation, the focus shifts to the qualitative results obtained (Nelson & Winter, 2005), without any judgment about the altered parameters – which creates a space for the emergence of multiple models, categories and typologies aimed at understanding the different manifestations of innovation. Therefore, interpreting innovation in services requires an understanding of the willingness to change, which is addressed below.
Willingness to Change in Services – WiCSMoreira et al. (2013, p. 55) describe change in services as “any alteration in the characteristics foreseen for a service, regardless of qualitative merit, which occurred during its delivery with a view to altering the final service” and attribute its generation to “alterations in the expectations of customers and providers, which are consecutively reconfigured through the stages of providing a service. Thus, the authors define WiCS as the “willingness of an individual or organization to accept alterations in the characteristics foreseen for a final service”.
To investigate the explanatory dimensions of WiCS, the authors studied software services. These services represent “a variety of services directly or indirectly related to software, ranging from training, maintenance and support to full made-to-order development”, covering also the “meeting point between the product model and the service model”, which is customizable software (Petit, Janssen, & Leitão, 2007, pp. 13–14). Software services have clear characteristics of service delivery due to the highly individualized nature of the final product. In addition, these services vary in intensity of interaction between customer and provider, making it possible to isolate the desired level of interaction.
In order to identify the explanatory dimensions of WiCS, Moreira et al. (2013) conducted a survey with experts in software services through a series of semi-structured interviews in ten cities in Brazil. Using content analysis techniques, the authors constructed seven explanatory dimensions for WiCS: Customer Relationship Management; Software Characteristics and Software Development; Organizational Conditions for Change; Team Conditions; Administrative Procedures and Conditions for Decision Making; Enterprising Behavior; and Interaction with Supporting Organizations. Since this is the first effort to map WiCS, the dimensions presented by the authors are considered exploratory.
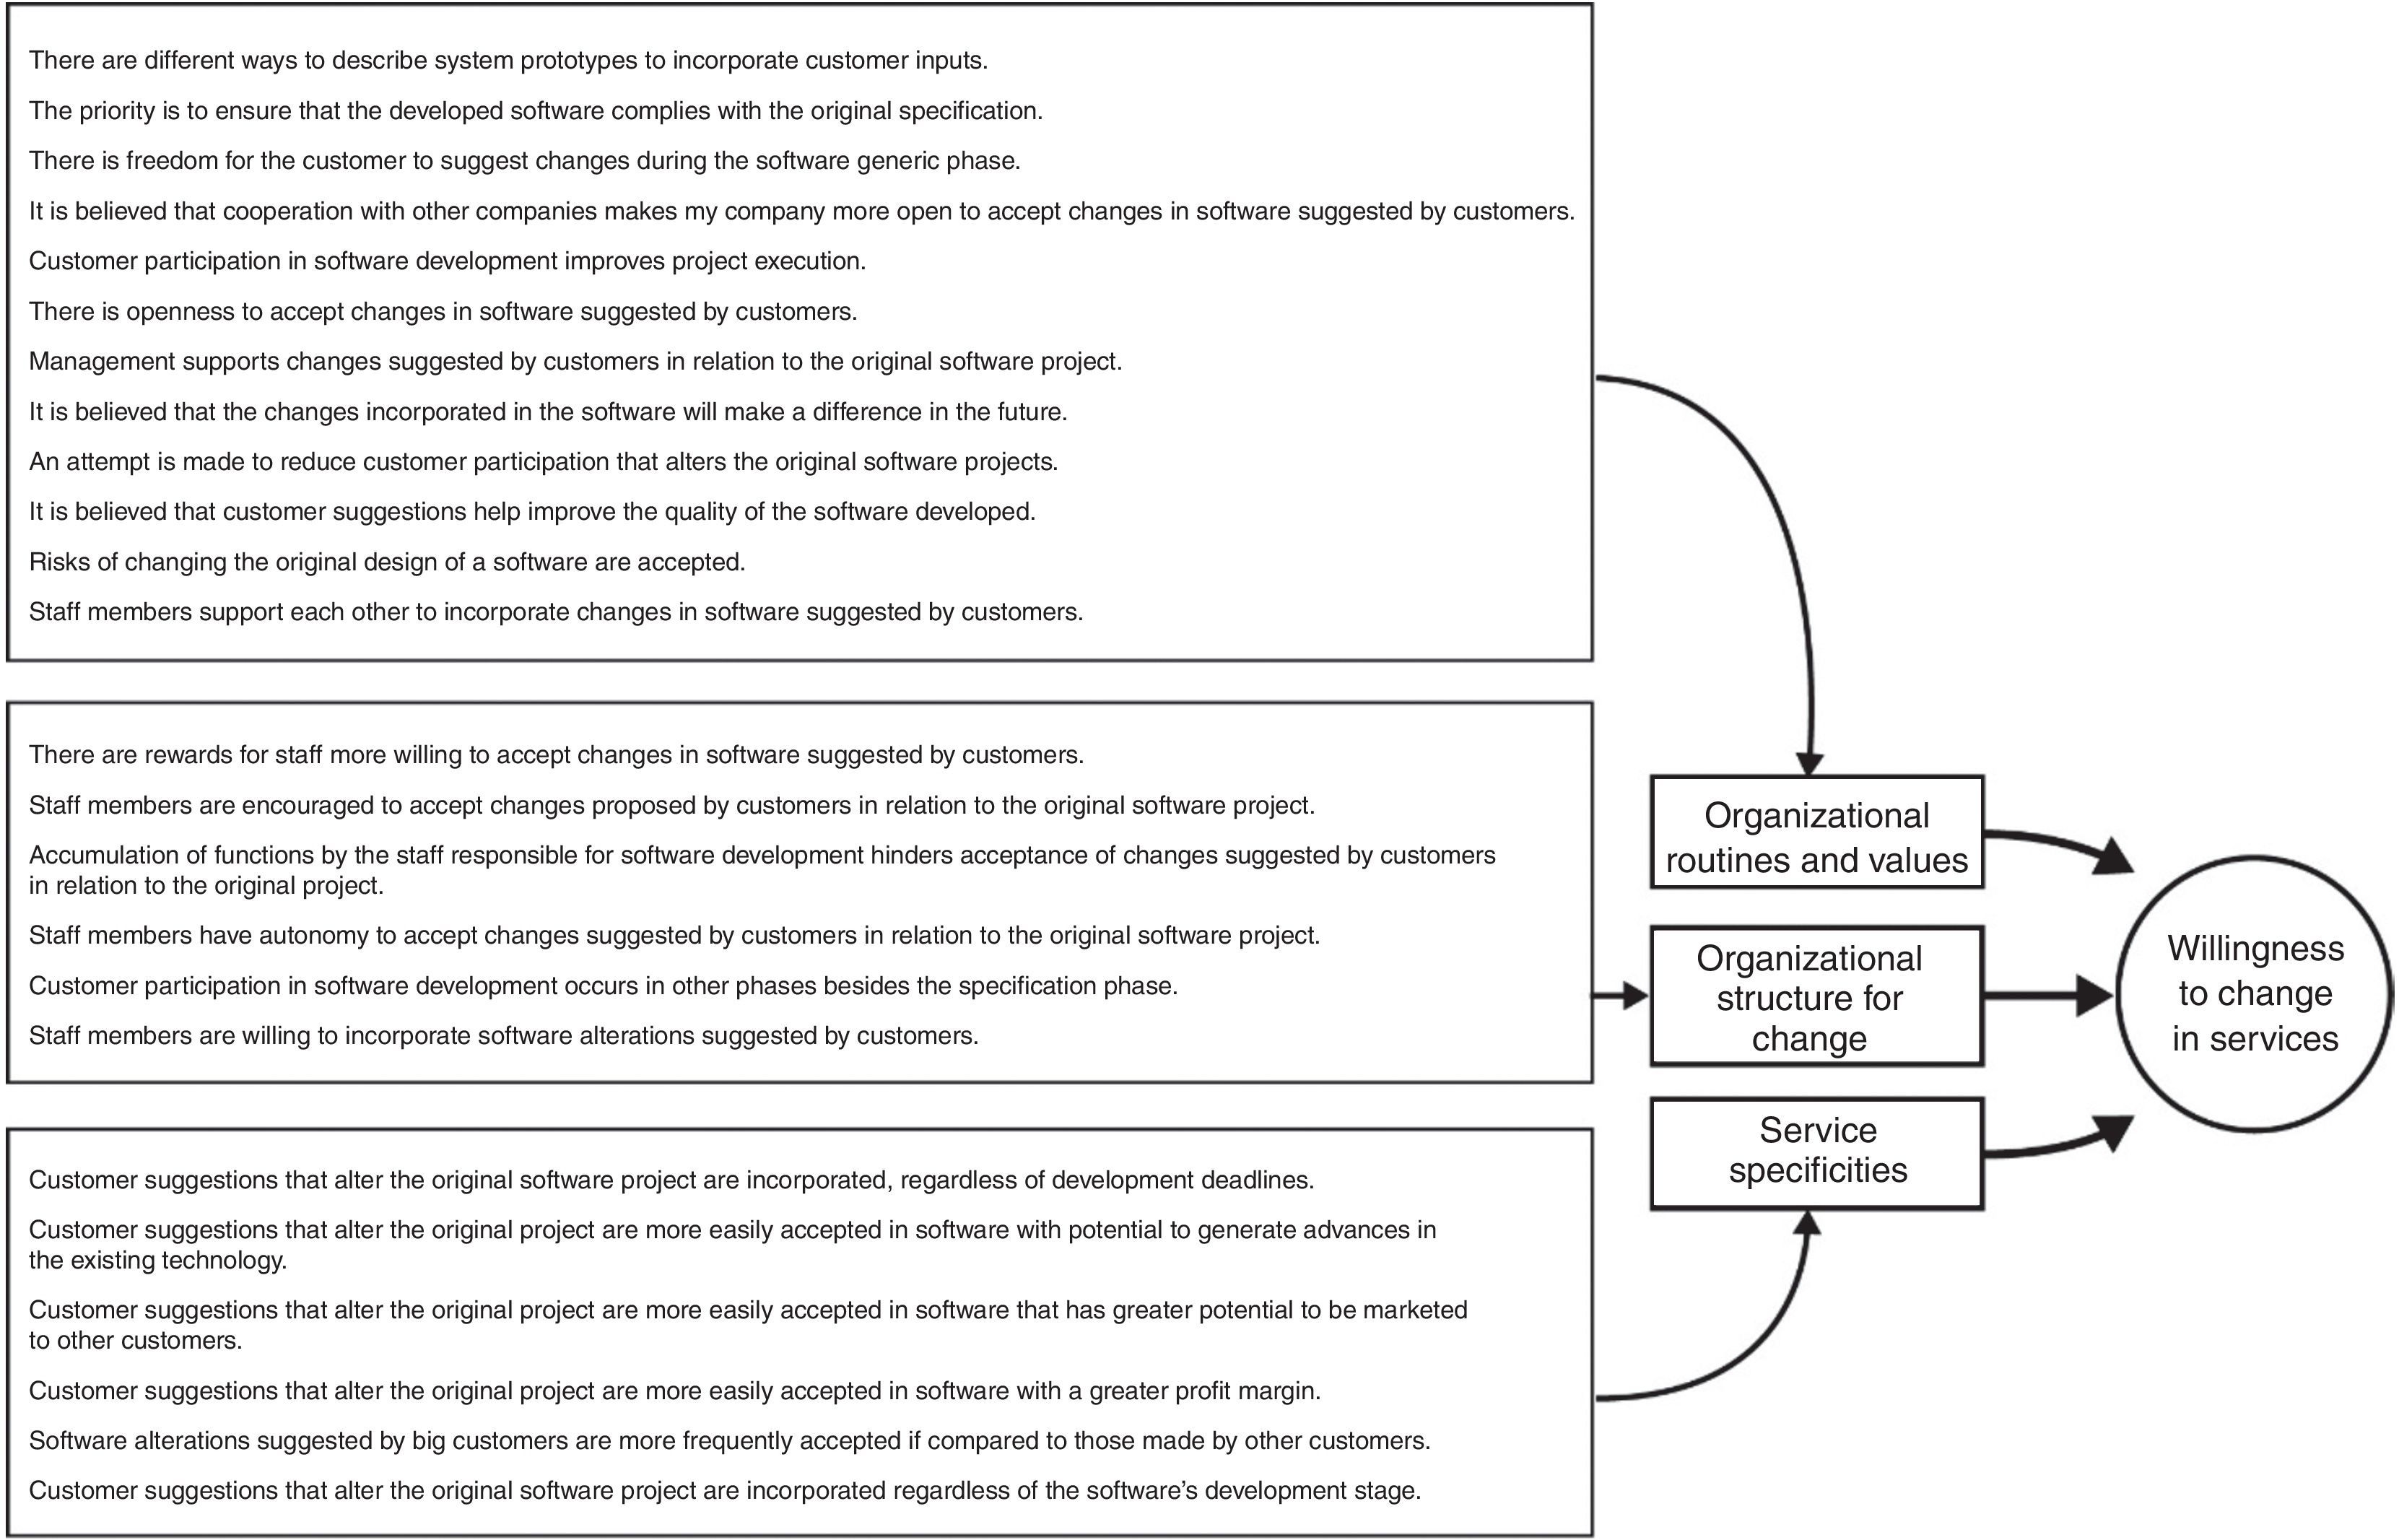
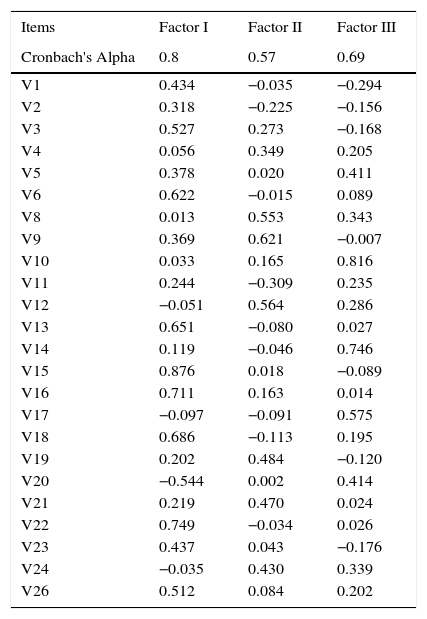
Subsequently, these seven dimensions were used as a basis for choosing the items that comprised the first version of the measurement scale proposed for WiCS. After semantic and theoretical validation of the scale by judges, Moreira et al. (2013) applied the scale to a sample of 351 companies that provide software services. Using Exploratory Structural Equation Modeling for the results obtained from the application of the scale, the authors validated a measurement scale for WiCS consisting of three explanatory factors: Organizational Routines and Values (Cronbach's Alpha 0.8); Organizational Structure for Change (Cronbach's Alpha 0.65) and Service Specificities (Cronbach's Alpha 0.69). Fig. 1 shows the factors and the respective items that comprise the structure of the WiCS construct.
.")
Factor structure for WiCS. Source: Moreira et al. (2013).
In order to test the relationship between change and innovation in services, and having defined WiCS as representing change in services, the remaining task is to select indicators for innovation in services. The framework for proposing innovation indicators – understood as measures of results in terms of development of innovations by firms, sectors and countries – is the OECD Innovation Manual known as the Oslo Manual. This Manual is based on the technology-push approach – which establishes measurements for research and development efforts by firms as an innovation indicator – and demand-pull approach – which uses measures for interactions with consumers. Additionally, it is possible to recognize indicators aimed at measuring cooperation and partnership between firms, which provide the theoretical basis for a systemic approach to innovation.
In Brazil, the Oslo Manual (OECD & Eurostat, 2005) serves as the basis for the Technological Innovation Survey – PINTEC (IBGE, 2010). The PINTEC edition for the 2006–2008 period uses the 2005 edition of the Oslo Manual as a basis for the formulation of its indicators and includes service sectors among the surveyed companies (considering only IT and computer-related services). In PINTEC, there are no specific indicators for services, but the measurements are extended to these companies. A question clearly emerges: what is the limit for extending indicators from industry to the measurement of innovation in services?
Evangelista and Sirilli (1998) explore the results of a survey conducted on the theoretical basis of the Oslo Manual with Italian service companies. The results showed the need to adapt industry measurements to measure innovation in services. Noting that “accumulated experience in measuring innovation in industrial sectors is an excellent starting point to measure innovation in services”, the authors characterize the original measurements – derived from the Oslo Manual – as inputs for the development of specific measurements to measure innovation services, emphasizing that it is necessary to discuss the limits of application of these measurements to service sectors.
Although the Oslo Manual and PINTEC can be extended to service sectors, it is known from empirical results that these applications are limited. Thus, the construction of measurements for innovation in services is indicated by Gallouj and Savona (2009, 2010, p. 40) as a research agenda for the field of innovation in services. Historically, the authors demonstrate that the use of large-scale surveys in services proves to be problematic for a number of reasons, such as methodological difficulties in defining innovation outputs of services, measurements and scope of data collection, and they suggest that “different and more comprehensive measurements need to be incorporated into the innovative activities of firms to study the nature of innovation in services and its effects on the economic performance of the services”.
With a view to address the lack of indicators for innovation in services, attention should be drawn to the recent proposal of the SSII – Service Sector Innovation Index, a composite innovation index based on 23 original indicators of the ISC-4 – Community Innovation Statistics. This index, supported by a European survey and similar to PINTEC, is also based on the Oslo Manual for proposing indicators, grouped into nine themes: human resources, demand for innovation, public support for innovation, product and process innovation, product innovation outputs and process, non-technological innovations, outputs of non-technological innovation, marketing and intellectual property. The indicators are selected in order to cover the main components of performance in terms of innovation for service firms (Arundel, Kanerva, Van Cruysen, & Hollanders, 2007).
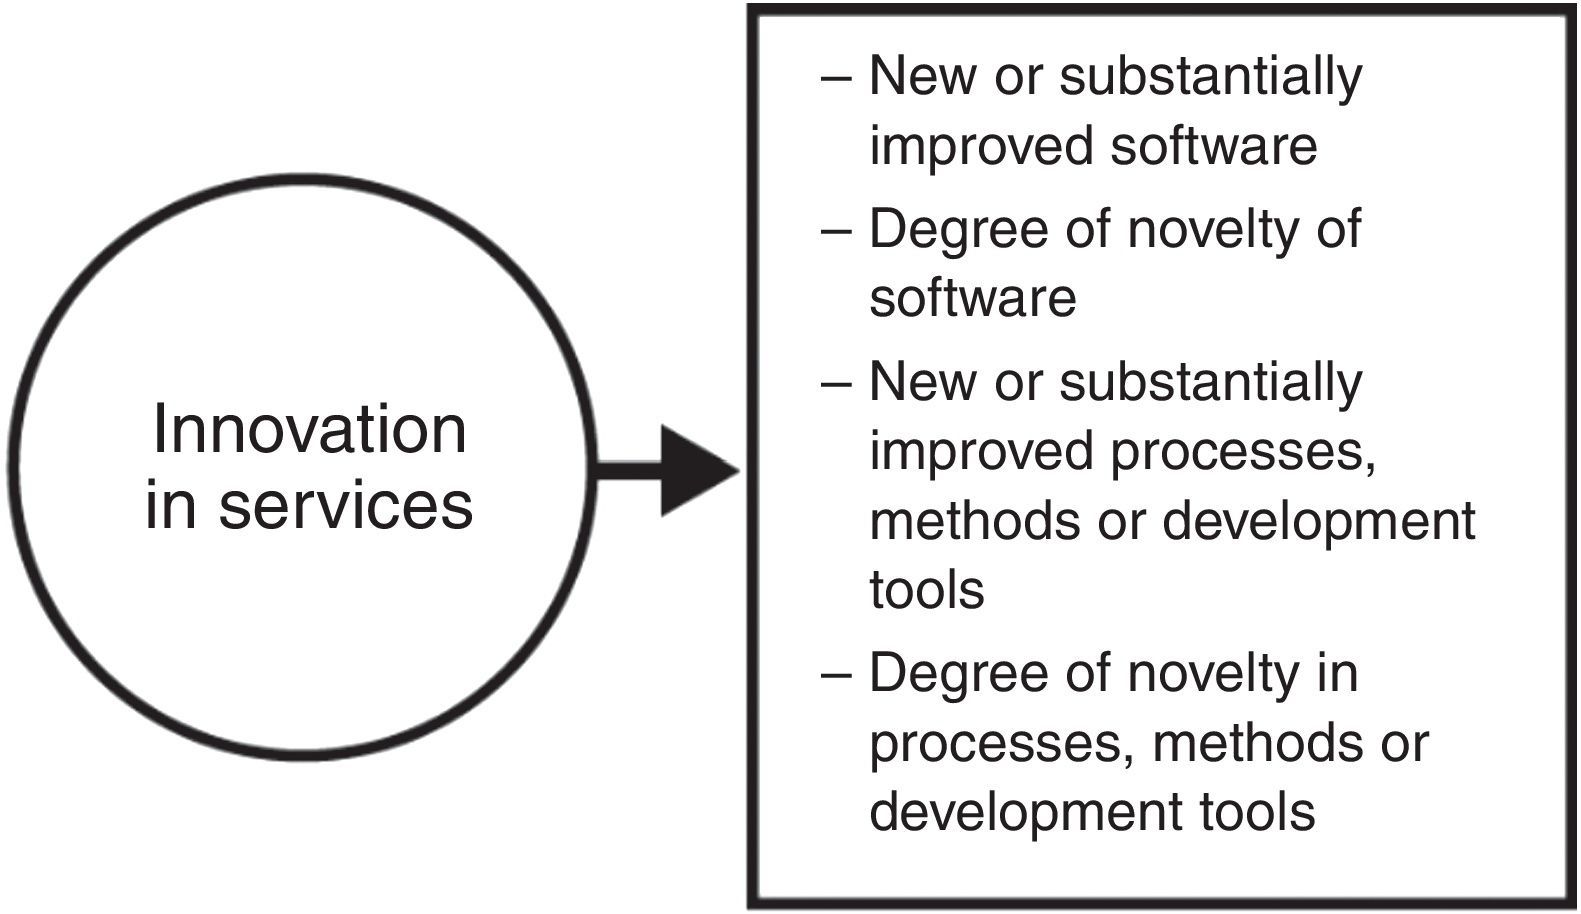
As a subset of indicators derived from the ISC-4, the SSII certainly contributes to the selection of indicators that are more sensitive to the dynamics of innovation in services. Nevertheless, it does not, on its own, fulfill research needs. It is a partial response to the task of establishing indicators for innovation in services, since the task of developing indicators specifically aimed at measuring the peculiar dynamics of innovation in the service sector has yet to be addressed (Gallouj & Savona, 2009, 2010) (Fig. 2).

In this study, the measurement of the results generated by innovation in the companies surveyed was carried out through data collection using a measuring instrument developed as a result of selection and adaptation of four subindicators of the 2008 PINTEC. The indicators adopted consider innovations in products – understood, for software services, as the introduction of new or substantially improved software – and innovations in processes – understood as the adoption of new processes, methods and development tools. In addition, the impact of software and processes adopted is measured by characterizing them as “new to Brazil” and “new to the world”. Thus, the measurement structure for the construct Innovation in Services is created, with a focus on software.
MethodTo test the relationship between WiCS and the results in terms of Innovation in services, we recovered the data from the application of the WiCS scale carried out by Moreira et al. (2013) and applied the scale proposed in this study for the measurement of Innovation in Services, consisting of four items, to the same group of companies originally selected by the authors. Thus, both scales were applied to a random sample of 351 companies that develop software services in Brazil, focusing on services entailing high interaction between customer and provider, i.e. development to order and customization. The sample was obtained from a population of 2300 Brazilian companies. We had access to one representative with a systems analyst profile or equivalent position per company. The applied scale measured the results in terms of Innovation in Services in the companies studied and, considering the four items, measured innovations in products and processes, as well as their degree of novelty. Both scales are Likert-type scales with 10 positions for the measurements.
Based on data obtained from the scales, two indices derived from the variables originally measured were calculated. The first is the Willingness to Change Coefficient (WCC), a variable derived from the individual values observed for each respondent, for the variables of each explanatory factor of the WiCS. WCC indicates the gross score obtained by each respondent in relation to the respondent's willingness to change.
The second calculated index was the Innovation in Services Coefficient (ISC), which is derived from measurements obtained by companies participating in the survey in relation to introduction of new or substantially improved software and its impact. New software for Brazil was given a weighting of one, while new software for the world was given a weighting of two. The same logic was applied to innovations in new processes, methods and development tools.
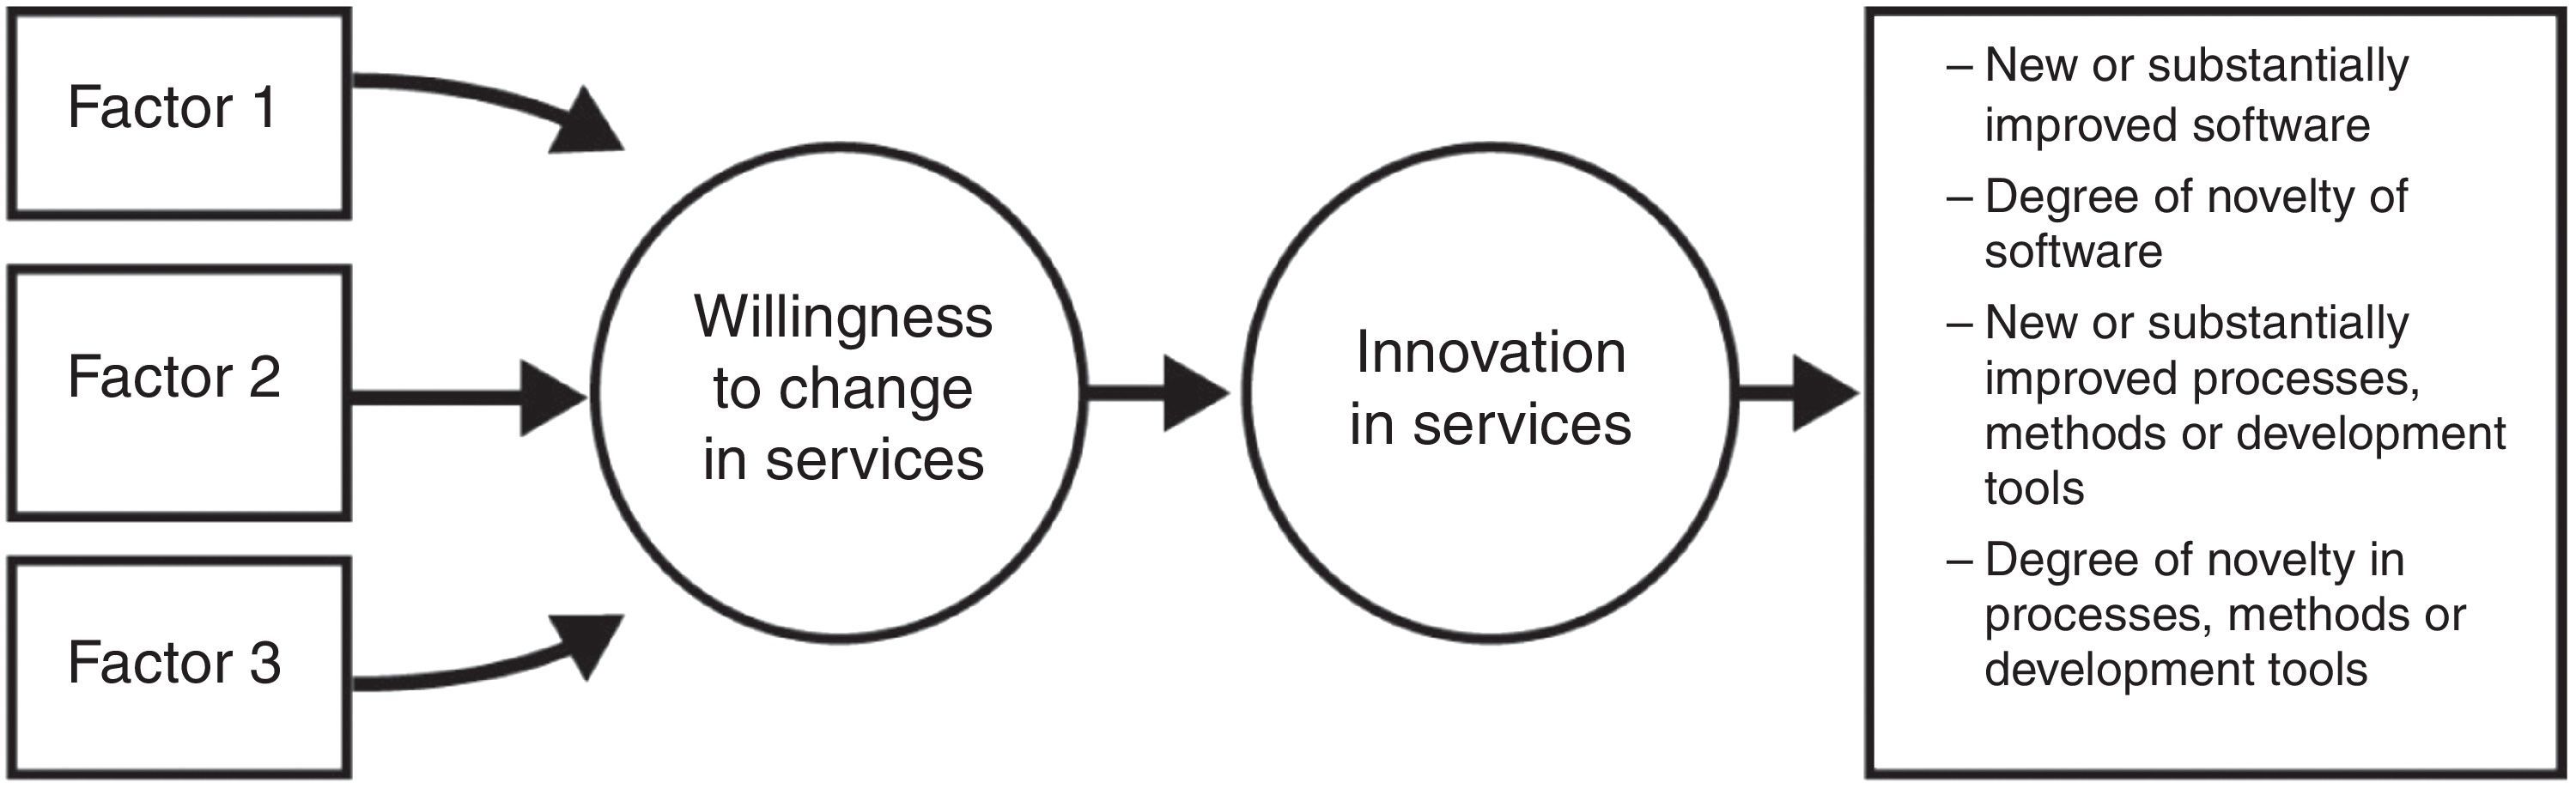
ISC was calculated by ISC=ISof+IProc, in which NSofnM*2NsofnB+ISof=Nsof* and NProcnM*2NprocnB+IProc=Nproc*. ISof refers to the number of innovations generated by launching new software products in the market; Nsof indicates the number of new software products introduced; NsofnB refers to the number of new software products for Brazil, and NsofnM indicates the number of new software products for the world. Similarly, Nproc indicates the number of new processes introduced into the market; NprocnB refers to the number of processes for Brazil and NprocnM refers to the number of new processes for the world. Based on the calculation of the indicators, the theoretical model tested in this study and shown in Fig. 3 was designed.

The model to be tested is based on hypothesis (H1): “Willingness to Change in Services directly predicts Innovation in Software Services, confirming that Willingness to Change is an input for Innovation in Services”. In order to test the predicted relationships, linear regression analyses (Hair, Anderson, Tatham, & Black, 2010) were conducted between the WiCS and IS constructs with the aid of the SPSS program. In addition, we tested the relationship between WiCS and three variables measured in the software development companies: region of operation, company size and number of employees.
Results and discussionThe first linear regression analysis performed tested directly the relationship between the WCC and the ISC.
The results of this analysis indicate that there is no significant relationship between the variables. The values of r=0.092 and r2=0.008 indicate virtually no prediction. This result does not support the predicted relationship, in view of the absence of shared variance between the WCC and ISC variables. In addition, we tested the significance of the variables representing the WiCS factors in relation to the ISC. We did not find any significant values at the threshold of p<0.05 for analysis of significance at 95 per cent confidence interval.
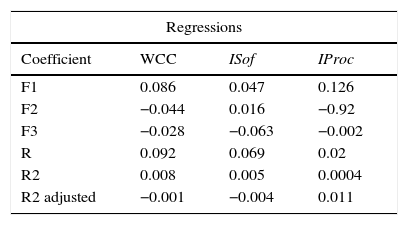
Given the non-significant result for the first relationship tested, we decided to extend the analyses to relationships between WCC and the individual indicators that make up the ISC: ISof and IProc. Further analysis of linear regression between WCC and ISof was conducted. The value observed for r=0.069 and r2=0.005 again indicated near zero prediction. As in the previous analysis, significant p values for the variables studied were not recorded. The regression test between WCC and IProc yielded results similar to the previous ones, with values of r=0.02 and r2=0.0004. In this case, the variables associated with the WCC were responsible for 2% of the variance in ISC. Table 1 shows the results of the linear regression between WCC and ISC, between WCC and ISof, and between WCC and IProc.
Linear regressions between WCC and ISC; between WCC and ISof; and between WCC and IProc.
| Regressions | |||
|---|---|---|---|
| Coefficient | WCC | ISof | IProc |
| F1 | 0.086 | 0.047 | 0.126 |
| F2 | −0.044 | 0.016 | −0.92 |
| F3 | −0.028 | −0.063 | −0.002 |
| R | 0.092 | 0.069 | 0.02 |
| R2 | 0.008 | 0.005 | 0.0004 |
| R2 adjusted | −0.001 | −0.004 | 0.011 |
Source: Research data.
*p<0.05 and **p<0.01.
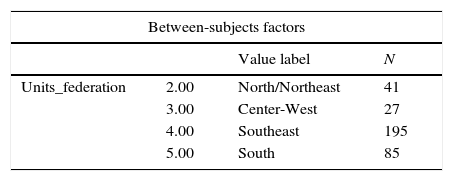
In addition to the linear regression tests between the coefficients, Analyses of Variance (ANOVA) were also performed between the WCC values and the variables for region of operation, time in the market and number of employees of companies. Originally, the “Units federation” variable was measured, which corresponded to the Brazilian states in which the companies operate. These units were grouped into regions of operation. We chose to group the North and Northeast regions due to the small number of companies in the North Region, with only two participating companies. The data show that there are 195 companies in the Southeast Region, 85 in the South Region, 41 in the North and Northeast Regions and 27 in the Center-West Region. The ANOVA tests of the mean difference between WiCS scores of companies operating in different regions, their length of time in operation and number of employees were conducted.
The first ANOVA tested the mean difference in WCC between the different regions of Brazil. The results show that the WCC scores remained stable across the different regions of Brazil, in view of the close-to-mean values recorded. The lowest mean was observed in the Southeast Region, with 172.72, and the highest in the Center-West Region, with 182.92. The standard deviation also remains relatively constant across regions, ranging from 18.59 (North/Northeast Region) to 27.10 (Southeast Region). The significance test shows p=0.216, indicating that there is no significant relationship between the WCC scores and the variables associated with the federation units where companies operate at the 95% confidence interval. The pairwise comparison between regions was performed with the Bonferroni post hoc test, but produced no p<0.05 values, indicating that there is no significant difference in the comparison of means between regions. Table 2 shows these analyses.
ANOVA between WCC and Federation Units.
| Between-subjects factors | |||
|---|---|---|---|
| Value label | N | ||
| Units_federation | 2.00 | North/Northeast | 41 |
| 3.00 | Center-West | 27 | |
| 4.00 | Southeast | 195 | |
| 5.00 | South | 85 | |
| Descriptive statistics | |||
|---|---|---|---|
| Dependent variable: WiCS_NEW | |||
| Units_federation | Mean | Std. deviation | N |
| North/Northeast | 176.1463 | 18.59914 | 41 |
| Center-West | 182.9259 | 21.27101 | 27 |
| Southeast | 172.7282 | 27.10295 | 195 |
| South | 172.9294 | 22.65570 | 85 |
| Total | 173.9713 | 24.83233 | 348 |
| Source | Type III sum of squares | df | Mean square | F | Sig. | Partial eta squared | Noncent. Parameter |
|---|---|---|---|---|---|---|---|
| Corrected Model | 2752.567a | 3 | 917.522 | 1.494 | 0.216 | 0.013 | 4.483 |
| Intercept | 6,341,202.664 | 1 | 6,341,202.664 | 10,327.342 | 0.000 | 0.968 | 10,327.342 |
| States | 2752.567 | 3 | 917.522 | 1.494 | 0.216 | 0.013 | 4.483 |
| Error | 211,223.145 | 344 | 614.021 | ||||
| Total | 10,746,544.000 | 348 | |||||
| Corrected total | 213,975.713 | 347 |
| Estimates | ||||
|---|---|---|---|---|
| Dependent variable: PMS_NOVO | ||||
| Units_federation | Mean | Std. error | 95% confidence interval | |
| Lower bound | Upper bound | |||
| North/Northeast | 176.146 | 3.870 | 168.535 | 183.758 |
| Center-West | 182.926 | 4.769 | 173.546 | 192.306 |
| Southeast | 172.728 | 1.774 | 169.238 | 176.218 |
| South | 172.929 | 2.688 | 167.643 | 178.216 |
| Pairwise comparisons | ||||||
|---|---|---|---|---|---|---|
| Dependent variable: WiCS_NEW | ||||||
| (I) Units_federation | (J) Units_federation | Mean difference (I−J) | Std. error | Sig.a | 95% confidence interval for differencea | |
| Lower bound | Upper bound | |||||
| North/Northeast | Center-West | −6.78 | 6.141 | 1 | −23.077 | 9.517 |
| Southeast | 3.418 | 4.257 | 1 | −7.879 | 14.715 | |
| South | 3.217 | 4.712 | 1 | −9.286 | 15.72 | |
| Center-West | ||||||
| Southeast | 10.198 | 5.088 | 0.275 | −3.304 | 23.7 | |
| South | 9.997 | 5.474 | 0.412 | −4.529 | 24.522 | |
| Southeast | ||||||
| South | −0.201 | 3.221 | 1 | −8.748 | 8.345 | |
Source: Research data.
Based on estimated marginal means.
ANOVA analyses were also performed to test the differences in WCC means in relation to variables representing companies’ time in the market and number of employees. The results did not indicate significant relationships, with no p<0.05 values. Therefore, that length of time in operation and number of employees, as well as region of operation, do not have a significant impact on the WiCS scores among the companies in the sample.
The results obtained from the analysis performed in this study indicate that there is no predictive relationship between Willingness to Change and Innovation in Services. The significance of this result merits discussions. Far from being characterized as an unknown relationship, the connection between change and innovation is widely assumed in studies on creativity, change and innovation. Traditionally, change is accepted as a stage prior to innovation and, therefore, as its explanation, cause or vector. What explains, then, the fact that this relationship is not confirmed in the present study?
The non-significant result was repeated in three linear regressions, which strongly indicates that the possibility of error in the statistical analysis can be excluded, leaving other elements to be addressed. When taking into account the significant number of cases analyzed (351 participating companies) and the variability of scores obtained for WCC and the ISC, there are indications that the data do not present associated measurement errors, and have appropriate variability and national distribution. Therefore, the measurements employed need to be addressed.
The WCC, based on the variables tested and validated by Moreira et al. (2013) for WiCS, has a good record with respect to reliability of its measurements. The authors indicate that it is a robust construct, albeit a new one, and it has satisfactory measurements associated with factor loadings of its variables and with Cronbach's Alphas of its factors. But what can be said in relation to the measurements for IS?
There is a characteristic that dissociates the constitutive logic of the WiCS and IS scales: their applicability to the analysis of service activities. While the WiCS scale is built on the basis of the interactional logic of services and seeks to consider the roles of providers and customers, the IS scale is derived from PINTEC measurements (IBGE, 2010) that, in turn, are developed from the Oslo Manual (OECD & Eurostat, 2005). Thus, the IS scale results from a subset of indicators typically developed for industrial sectors.
The discussion about the limits to apply the Oslo Manual indicators – traditional innovation indicators – to service activities is not new. In their survey on innovation in Italian service companies, Evangelista and Sirilli (1998, p. 253) recognize the value of measurements from the industrial sectors, and that “the accumulated experience in measuring innovation in industrial sectors is an excellent starting point to measure innovation in services”, but stressed the limitations to their application. In particular, the authors warn about the challenges in measuring research and development activities in services, considered traditional innovation indicators in industrial sectors, along with patent registration and data from scientific publications and citations, which indicate dissemination of knowledge (Smith, 2005). In line with these authors, Kanerva, Hollanders, and Arundel (2006) indicate the partial appropriateness of indicators from the manufacturing industries to measure innovation in service activities.
A detailed analysis of the PINTEC innovation indicators reveals the limits of their application to services. Eight main sets of indicators are described: Innovative activities, Funding sources for innovative activities, Internal R&D activities, Impact of innovations, Information sources, Cooperation for innovation, Government support and Patents and other protection methods. In the group of innovative activities, the importance given to industrial design, introduction of innovations in the market, internal and external R&D, training and procurement of machinery and equipment, software and external knowledge are measured. Given the limitations of considering R&D activities in services and the obvious limits associated with consideration of industrial projects, what remains for measurements in services is limited to procurement of machinery and equipment, software and external knowledge, training and introduction of technological innovations in the market. In practical terms, this means considering innovative activities that do not take into account the relational nature of services. A similar analysis could be made regarding the other seven sets of indicators.
Given the limits of application of industrial indicators to the analysis of innovation in services, what is observed in the literature is the decision to adopt indicators that are presumed applicable and extend them to the sector. That was the logic used to select the variables associated with the IS scale used in this study. This option, the only current option to measure innovation in services, faces two problems: first, it entails working with a reduced number of indicators, which limits the measurement of the phenomenon, and second, it implies not measuring aspects of the relational perspective, which typifies the services. While the first problem leads to reduced measures, the second results in methodological inconsistency. If the relational perspective is the main element in the creation of services and provides the rationale for them, is there really a measurement of innovation in services when this perspective is not included in the indicators? The results indicate that the answer is negative.
Despite the limitations of applying industrial indicators to measurements of innovation in services, it is prudent to point out other factors that might explain the lack of prediction between change and innovation in services. The analyses conducted in this study examined the existence of a direct relationship between the constructs, which was not confirmed, but did not test for the existence of possible indirect relations. There may be intermediate phenomena or processes between change and innovation in services that have not been mapped yet. In addition, it is possible that change in services is directly related to other phenomena linked to the customer and the service provider, such as quality in services (measured from the provider's perception). Therefore, a challenge to future studies emerges, to test the WiCS and IS constructs together with other explanatory variables, such as creativity, for example.
Moreover, because it is a phenomenon that occurs during the delivery of service, in analytical terms, change in services is dissociated from innovation, which can only be diagnosed with the use of the indicators selected in this study, namely through its actual results in terms of launching of new software or adoption of new market processes. This distinction between the two phenomena generates another possible explanation. Change in services could be related to other processes that directly mobilize the customer and the service provider – agents of change – but not considered in innovation measurements. While change in services occurs at the locus of interaction and is defined around changes in customers’ expectations, innovation needs market validation in order to take place. Thus, a crucial epistemological difference emerges between the constructs.
ConclusionsThis study aimed to explain the relationship between willingness to change and innovation in services. The results show no direct predictability between the constructs, a characteristic that remained and was confirmed in subsequent tests performed with intermediate components of innovation in services (indexes for new software and processes). Because it is a relationship widely assumed and explored in the literature, we sought to investigate possible explanations for the results.
As possible explanatory dimensions related to these results, we highlight the epistemological characteristics associated with change in services and innovation. Change in services is characterized as a phenomenon with a microscope, occurring in the locus of the service relationship and causing alterations in the provider's and customer's expectations. Innovation is subject to market forces, which requires macro-analysis of new software and processes in companies. Thus, it is understood that change and innovation can represent stages of the same process in services, although they mobilize different actors and manifest themselves at different levels of analysis.
Attention is drawn to a limitation of this study, the selection of innovation indicators privileging variables associated with results and not considering innovative efforts made by firms. This choice was made because it is impossible to measure indicators of innovation in services with the same analytical tools used for industry. In addition, there is the exploratory nature of the study, in which the scales were applied to only one sample of respondents.
As a research agenda for future studies, the performance of tests is indicated to explain the relationship between willingness to change in services and other phenomena associated with customers and service providers, such as quality in services and creativity. Above all, it is necessary to address the challenge of building, rather than adapting, innovation indicators genuinely capable of measuring innovation in services and the phenomena associated with it and its possible vectors. These indicators should take into account the relational perspective, mobilization of skills and changes in expectations during service delivery.
Conflicts of interestThe authors declare no conflicts of interest.
An innovation in the software industry occurs when there is introduction into the market of:
- •
New or substantially improved software
- ∘
Software whose fundamental characteristics (technical specifications, codes, user-friendliness, functions or intended uses) differ substantially from previous software.
- ∘
- •
A new or substantially improved process, method or new development tool
- ∘
Software that existed before, but whose performance has been substantially increased or improved with significant improvement in its efficiency, speed, ease of use, etc.
- ∘
- 1.
Between 2010 and 2012, did your company introduce any new or substantially improved software products in the market? How many?
- •
None.
- •
1.
- •
Between 2 and 3.
- •
Between 4 and 5.
- •
Between 6 and 7.
- •
Between 8 and 9.
- •
Between 10 and 15.
- •
Between 15 and 20.
- •
More than 20.
- •
- 2.
Indicate in approximate percentage terms, how many of the new or substantially improved software products launched by your company were:
- •
New for the company, but already available in Brazil. ______%
- •
New in Brazil, but already available in other countries. ______%
- •
New to the world. ______%
Innovations in processes, methods and development tools correspond to the adoption of:
- •
New or substantially improved production technologies;
- •
New or substantially improved interfaces or platforms;
- •
New or substantially improved software development processes (agile processes, RUP, cascade, etc.);
- •
New or substantially improved languages and systems used in software development;
- •
New or substantially improved open frameworks (such as PHP);
- •
New or substantially improved storage and processing methods (such as cloud computing).
* Small and routine changes, such as version upgrades, are not included.
- •
- 3.
Between 2010 and 2012, did your company introduce any new or substantially improved process, method, or development tool in its production? How many?
- •
None.
- •
1.
- •
Between 2 and 3.
- •
Between 4 and 5.
- •
Between 6 and 7.
- •
Between 8 and 9.
- •
Between 10 and 15.
- •
Between 16 and 20.
- •
More than 21.
- •
- 4.
Indicate in approximate percentage terms how many of the new or substantially improved processes, methods or development tools adopted by your company were:
- •
New to the company but already adopted by other companies in Brazil. ______%
- •
New in Brazil but already adopted in other countries. ______%
- •
New to the world.
- •
Adjusted factor structure for WiCS in ESEM analysis.
| Items | Factor I | Factor II | Factor III |
|---|---|---|---|
| Cronbach's Alpha | 0.8 | 0.57 | 0.69 |
| V1 | 0.434 | −0.035 | −0.294 |
| V2 | 0.318 | −0.225 | −0.156 |
| V3 | 0.527 | 0.273 | −0.168 |
| V4 | 0.056 | 0.349 | 0.205 |
| V5 | 0.378 | 0.020 | 0.411 |
| V6 | 0.622 | −0.015 | 0.089 |
| V8 | 0.013 | 0.553 | 0.343 |
| V9 | 0.369 | 0.621 | −0.007 |
| V10 | 0.033 | 0.165 | 0.816 |
| V11 | 0.244 | −0.309 | 0.235 |
| V12 | −0.051 | 0.564 | 0.286 |
| V13 | 0.651 | −0.080 | 0.027 |
| V14 | 0.119 | −0.046 | 0.746 |
| V15 | 0.876 | 0.018 | −0.089 |
| V16 | 0.711 | 0.163 | 0.014 |
| V17 | −0.097 | −0.091 | 0.575 |
| V18 | 0.686 | −0.113 | 0.195 |
| V19 | 0.202 | 0.484 | −0.120 |
| V20 | −0.544 | 0.002 | 0.414 |
| V21 | 0.219 | 0.470 | 0.024 |
| V22 | 0.749 | −0.034 | 0.026 |
| V23 | 0.437 | 0.043 | −0.176 |
| V24 | −0.035 | 0.430 | 0.339 |
| V26 | 0.512 | 0.084 | 0.202 |
Source: Research data.
Peer Review under the responsibility of Departamento de Administração, Faculdade de Economia, Administração e Contabilidade da Universidade de São Paulo – FEA/USP.
Research funded by the Higher Education Personnel Improvement Coordination – CAPES under CAPES/COFECUB (Brazil – France) cooperation agreement.