


The present study aims to provide norms and age-, education-, and sex-adjusted data for the Wisconsin Card Sorting Test (WCST), the Modified Taylor Complex Figure (MTCF), and the Ruff-Light Trail Learning Test (RULIT) as part of the NEURONORMA-Plus project.
MethodsWe recruited 308 cognitively healthy individuals aged between 18 and 92 years. Tables are provided to convert raw scores to age-adjusted scaled scores, as well as adjustments for education and sex after applying independent regression models in 2 age groups (< 50 and ≥ 50 years).
ResultsOlder age had a negative effect on performance in both age groups. We observed a positive effect of education on WCST performance in the younger group (< 50 years), and on all MTCF measures (with the exception of the recognition task) in the older group (≥ 50 years). Education had no impact on performance in the RULIT, although sex did, with a small but significant effect whereby young men showed higher performance for one variable.
ConclusionThe normative data provided can contribute to the clinical interpretation of performance in these tests in the Spanish population.
el presente estudio tiene como objetivo proporcionar normas y ajustes para edad, educación y el género para el Wisconsin Card Sorting Test (WCST), la Figura Compleja Modificada de Taylor (FCMT) y el Ruff-Light Trail Learning Test (RULIT) como parte del proyecto NEURONORMA-Plus.
Métodola muestra consiste en 308 individuos cognitivamente sanos de entre 18 y 92 años. Se proporcionan tablas para convertir las puntuaciones brutas en puntuaciones escalares ajustadas por edad y ajustes por educación y género tras aplicar modelos de regresión independientes en dos grupos de edad (<50 y ≥50 años).
Resultadosla edad tuvo un efecto negativo en el rendimiento en ambos grupos etarios. Observamos un efecto positivo de la educación en el rendimiento del WCST en el grupo más joven (<50 años), y en todas las medidas del FCMT (con la excepción de la tarea de reconocimiento) en el grupo de mayor edad (≥50 años). La educación no influyó en el rendimiento en el RULIT, pero sí el género, que tuvo un efecto leve, aunque significativo, mostrando los hombres jóvenes un mayor rendimiento en una variable.
Conclusiónlos datos normativos aportados pueden contribuir en la interpretación clínica del rendimiento en estas pruebas en población española.
Normative data from neuropsychological tests are essential for correctly interpreting cognitive function. Cultural and sociodemographic factors are known to influence test performance in certain populations. Until very recently, few valid normative data were available for the Spanish population. This issue has been partially addressed by such multicentre normative studies as the NEURONORMA project,1 and recent studies conducted within the framework of the Normacog project.2 The present study, conducted within the NEURONORMA-Plus project, provides reference data for neuropsychological tools that were not included in the original project.
We present age-, sex-, and education-adjusted data for the Wisconsin Card Sorting Test (WCST), the Modified Taylor Complex Figure (MTCF), and the Ruff-Light Trail Learning Test (RULIT).
Wisconsin Card Sorting TestThe original WCST3,4 was developed to evaluate abstract reasoning and the ability to adapt cognitive strategies to a changing setting; both processes belong to the construct of executive function. The WCST evaluates planning, organisation, abstract reasoning, concept formation, information retention, set shifting (cognitive flexibility), and inhibition of impulsive response.5–7 Several versions of the WCST have since been developed. The version most frequently used in validity, reliability, and normative studies is that developed by Heaton.8,9 Two modes of administration for the WCST are currently available: the manual version and the computerised version. Despite controversy over the equivalence between the different versions, most studies show non-significant differences in WCST indices between the 2 administration modes.10 Some studies provide normative data for the WCST in the Spanish population.11–13
Modified Taylor Complex FigureComplex figure copying, such as the Rey-Osterrieth Complex Figure (ROCF),14 has been extensively used in neuropsychology. The ROCF has been used to study a wide range of neurological disorders.15 This test evaluates visuoconstructive abilities with the copy task and visual memory with the delayed recall of the figure. In 1969, Taylor created an alternative form of the ROCF, known as the Taylor Complex Figure (TCF).16 However, that figure contained some easily recognisable elements (e.g., stars) that could not be considered abstract, which led to the development of a new version, the Modified Taylor Complex Figure (MTCF).17 The latter contains fewer recognisable shapes and numerous lines, and the location of certain elements was changed. Thus, the MTCF may be considered a better alternative to the ROCF for assessing the same cognitive functions. Although a recent study provided Spanish normative data for the initial version of the TCF,18 no such data are available for the MTCF.
Ruff-Light Trail Learning TestThe RULIT was designed to evaluate learning and spatial memory in adults.19 The authors proposed a paradigm requiring no drawing skills and minimal visuomotor, spatial discrimination, and visuospatial integration skills to learn a specific path. Principal component analysis identified 2 main factors involved in test performance: visuospatial learning and memory, on the one hand, and verbal learning and memory, on the other.20 In another study, performance on the RULIT was found to reflect the laterality of brain lesions, with patients with right hemisphere damage presenting significantly poorer performance.21
No normative studies for the WCST, MTCF, or RULIT are currently available in the Spanish population. The purpose of this study is to provide normative data in the context of the NEURONORMA-Plus project.
Materials and methodsParticipantsWe included a total of 308 individuals. These were the spouses, relatives, or friends of patients assessed at the neurology department of Hospital del Mar, in Barcelona, or users of day centres for elderly people. We used stratified random sampling to divide participants into subgroups according to age, sex, and level of education. All participants were white, and they all lived and were educated in Spain. The project was approved by the ethics committee of the Parc de Salut Mar medical research institute, in Barcelona (Spain).
The inclusion criteria were as follows: 1) individuals who gave written informed consent; 2) men and women aged 18–95 years; 3) Spanish speakers with sufficient ability to read and write (reported during the initial interview and confirmed by a reliable history of at least one year of formal schooling); and 4) independence in activities of daily living, according to the Interview for Deterioration of Daily Living Activities in Dementia22 (score < 37). We established the following exclusion criteria: 1) history of central nervous system disease potentially causing neuropsychological deficits (e.g., stroke, epilepsy, head trauma, movement disorders, multiple sclerosis, brain tumours, brain lesions); 2) history of abuse of alcohol or other psychotropic substances; 3) presence of active or poorly controlled systemic disorders associated with cognitive impairment (e.g., diabetes mellitus, hypothyroidism, vitamin B12 deficiency); 4) history of severe psychiatric disorders (e.g., major depressive disorder, bipolar disorder, psychosis); 5) severe sensory deficits (vision and/or hearing loss) interfering with cognitive test performance; 6) scores < 25 points on the Mini-Mental State Examination (MMSE)23 (version proposed by Blesa et al.24) or < 5 points on the Memory Impairment Screen (MIS)25 (Spanish-language version26); and 7) any other reason that, in the authors’ opinion, should preclude inclusion (e.g., lack of motivation). Participants did not receive compensation for participating in the study.
Neuropsychological measuresAll tests were administered and scored according to the published manuals. Due to the non-verbal nature of the tests, psycholinguistic adaptation of the materials was not necessary. However, we did translate the original instructions from English into Spanish with the following procedure. First, a researcher prepared an initial draft of the translated instructions for each of the tests used. Subsequently, a consensus meeting was held with all clinical neuropsychologists and 2 linguists, and a consensus version was proposed for each test. Lastly, a behavioural neurologist with experience in the development of cognitive tests reviewed the instructions and approved the final version. All tests were administered by trained neuropsychologists who were native Spanish speakers.
Wisconsin Card Sorting TestThe current version of the WCST9 consists of 2 card packs containing 4 stimulus cards and 64 response cards each. The examiner shows the 4 stimulus cards to the examinee and indicates the characteristics of each of them. The examinee is then asked to match the 64 response cards with one of the 4 stimulus cards according to a pre-established principle (colour, shape, or number); each card must be played in order, starting with the card at the top of the deck. After each card is played, the examiner provides feedback to the subject (right/wrong).9 The variables analysed in our normalisation study are total number of trials, total number of errors, perseverative responses, perseverative errors, and trials to complete first category.
Modified Taylor Complex FigureThe main variables analysed in this study were copy accuracy, copy time, immediate recall, delayed recall, and recognition. The examinee is first asked to copy the figure as accurately as possible and with no time limit, but is not informed that he or she will later be asked to draw the figure from memory, at 3 (immediate recall) and 30 minutes (delayed recall). Finally, a recognition task is performed. No visual tasks are administered during the interference period. During recall tasks, the examinee is asked to draw the figure without cues. During the recognition task, the examinee must identify the highest possible number of items matching the rule from a set of 24 items (12 matching and 12 distractors). The complex figure is formed by 18 elements, each of which may be scored 2, 1, 0.5, or 0 points, depending on the accuracy/location of the elements (thus, the maximum possible score is 36 points). The score for the recognition task is the sum of true positive elements and true negative elements (12 – false positive elements or distractors). The maximum possible score is 24 points.
Ruff-Light Trail Learning TestIn this study, we used version A of the RULIT. The examinee is given a stimuli sheet presenting a complex configuration of circles interconnected by lines, and subsequently asked to recall a given path immediately after seeing the sheet (immediate recall) and after 30 minutes (delayed recall). The examinee must learn a path of 15 steps between circles and trace it by moving his or her finger from one circle to the next. After each move, the examiner will indicate whether the examinee is right or wrong; in the latter case, the examinee must try alternative steps until the correct circle is selected. The task is completed when the examinee is able to recall the path in 2 consecutive trials without making any mistakes. The examinee is allowed a maximum of 10 trials. The variables analysed in our normalisation study were total correct choices in the second trial, total correct choices, total step errors, total delayed correct choices, and total delayed step errors.
ProceduresEach participant was assessed in a single session, in which they were informed about the study and gave written informed consent. They were subsequently interviewed and completed screening tests to assess their eligibility for inclusion. Individuals meeting all inclusion criteria and none of the exclusion criteria were administered the neuropsychological test battery. Assessment took approximately 2 hours.
Statistical analysisNormative data were calculated according to the procedures described in the NEURONORMA project.1 To analyse the effects of sociodemographic variables on cognitive test scores, the sample was divided into 2 age groups: < 50 years (n = 118) and ≥ 50 years (n = 190). This ensures comparability with the results of previous normative NEURONORMA studies, and considers the effect of population ageing and differences in the level of education between younger and older adults. We applied the overlapping interval strategy to maximise the number of participants included in each normative group.27 We considered 10 age groups for the creation of normative data (mid-points): 18–29 years (n = 41), 23–36 (n = 59), 30–43 (n = 48), 37–50 (n = 53), 44–57 (n = 61), 51–64 (n = 71), 58–71 (n = 83), 65–78 (n = 74), 72–85 (n = 68), and 79–92 (n = 40). Lastly, we created 10 new age ranges to study the applicability of normative data: 18–26, 27–33, 34–40, 41–47, 48–54, 55–61, 62–68, 69–75, 76–82, and 83–92.
Normative data were obtained through the following process: 1) Descriptive analysis (mean, standard deviation, and percentages for the total sample and for each age group). 2) Determination of the effect of age, sex, and level of education with semi-partial correlations and the coefficient of determination (r2). 3) Creation of age-adjusted normative tables, assigning percentile ranks to age-adjusted scaled scores (SS) (range, 2–18; mean: 10; standard deviation: 3) for each age group (< 50/≥ 50 years) using cumulative percentiles. 4) For the purposes of adjusting data for level of education, we performed linear regression analyses between age-adjusted SS and level of education. We calculated the correlation coefficient (r) and the coefficient of determination (r2) of SS for each age group (< 50/≥ 50 years). When the explained variance was greater than 5% and β showed a significant effect (P < .05), we corrected the data using the formula developed by Mungas et al.28 Age- and education-adjusted SS were calculated for the group of individuals aged < 50 years using the formula education-adjusted SS = age-adjusted SS – (β * [years of schooling – 13]). For individuals aged ≥ 50 years, the following formula was used: education-adjusted SS = age-adjusted SS – (β * [years of schooling – 10]). The values 13 and 10 correspond to the mean number of years of schooling in each group. 5) To adjust for sex, we compared mean raw scores between men and women. If significant differences were found, a regression analysis was performed using age-adjusted SS as the dependent variable and sex as the predictor, and the criteria r2 ≥ 5% and β (P < .05) were used to decide whether adjustment for sex was needed. Thus, age-, sex-, and education-adjusted scores were calculated with the following formulae: Age- and education-adjusted SS – (β * sex), or age-adjusted SS – (β * sex), depending on which factors showed a significant association. Statistical analysis was conducted using the Statistical Package for Social Sciences (SPSS) software, version 22.
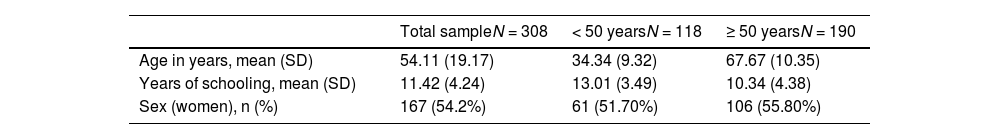
ResultsOur sample included 308 individuals. Table 1 shows the descriptive statistics of sociodemographic data for the total sample and for the 2 age groups (< 50/≥ 50 years).
Sociodemographic characteristics of the total sample and by age group.
| Total sampleN = 308 | < 50 yearsN = 118 | ≥ 50 yearsN = 190 | |
|---|---|---|---|
| Age in years, mean (SD) | 54.11 (19.17) | 34.34 (9.32) | 67.67 (10.35) |
| Years of schooling, mean (SD) | 11.42 (4.24) | 13.01 (3.49) | 10.34 (4.38) |
| Sex (women), n (%) | 167 (54.2%) | 61 (51.70%) | 106 (55.80%) |
SD: standard deviation.
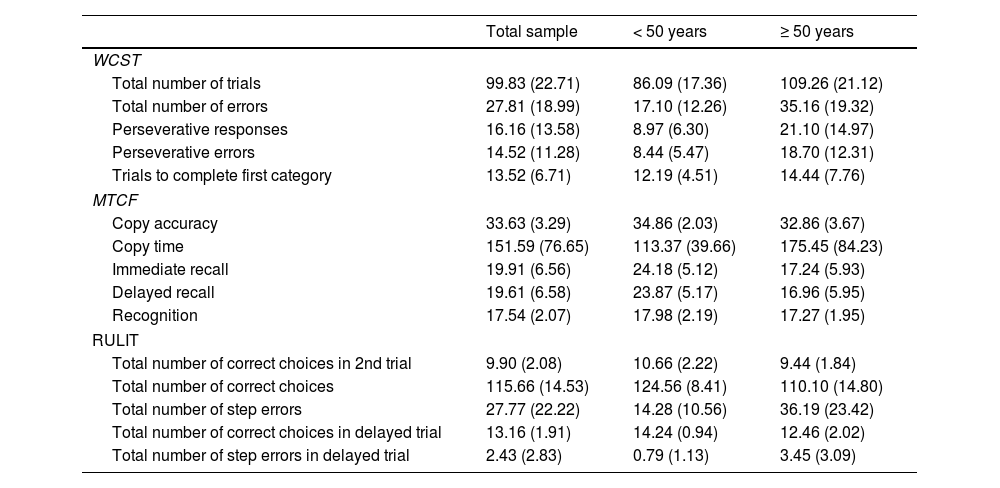
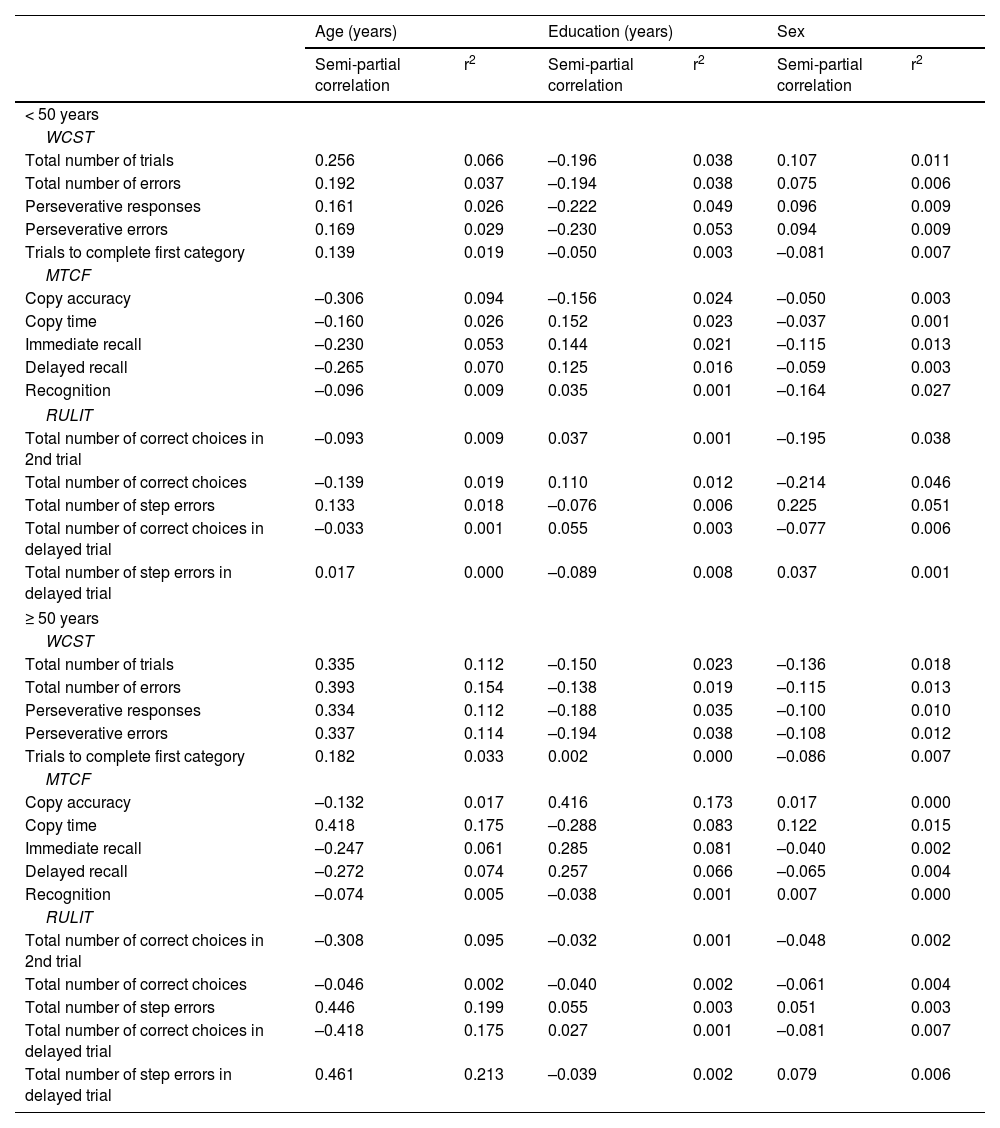
Descriptive data for cognitive variables are presented in Table 2. Semi-partial correlations and coefficients of determination between raw WCST, MTCF, and RULIT scores and age, level of education, and sex are presented in Table 3.
Descriptive data of the total sample and by age group.
| Total sample | < 50 years | ≥ 50 years | |
|---|---|---|---|
| WCST | |||
| Total number of trials | 99.83 (22.71) | 86.09 (17.36) | 109.26 (21.12) |
| Total number of errors | 27.81 (18.99) | 17.10 (12.26) | 35.16 (19.32) |
| Perseverative responses | 16.16 (13.58) | 8.97 (6.30) | 21.10 (14.97) |
| Perseverative errors | 14.52 (11.28) | 8.44 (5.47) | 18.70 (12.31) |
| Trials to complete first category | 13.52 (6.71) | 12.19 (4.51) | 14.44 (7.76) |
| MTCF | |||
| Copy accuracy | 33.63 (3.29) | 34.86 (2.03) | 32.86 (3.67) |
| Copy time | 151.59 (76.65) | 113.37 (39.66) | 175.45 (84.23) |
| Immediate recall | 19.91 (6.56) | 24.18 (5.12) | 17.24 (5.93) |
| Delayed recall | 19.61 (6.58) | 23.87 (5.17) | 16.96 (5.95) |
| Recognition | 17.54 (2.07) | 17.98 (2.19) | 17.27 (1.95) |
| RULIT | |||
| Total number of correct choices in 2nd trial | 9.90 (2.08) | 10.66 (2.22) | 9.44 (1.84) |
| Total number of correct choices | 115.66 (14.53) | 124.56 (8.41) | 110.10 (14.80) |
| Total number of step errors | 27.77 (22.22) | 14.28 (10.56) | 36.19 (23.42) |
| Total number of correct choices in delayed trial | 13.16 (1.91) | 14.24 (0.94) | 12.46 (2.02) |
| Total number of step errors in delayed trial | 2.43 (2.83) | 0.79 (1.13) | 3.45 (3.09) |
Data are presented as mean and standard deviation. MTCF: Modified Taylor Complex Figure; RULIT: Ruff-Light Trail Learning Test; WCST: Wisconsin Card Sorting Test.
Semi-partial correlations and coefficients of determination (r2) between raw test scores and the variables age, level of education, and sex in our sample, by age group.
| Age (years) | Education (years) | Sex | ||||
|---|---|---|---|---|---|---|
| Semi-partial correlation | r2 | Semi-partial correlation | r2 | Semi-partial correlation | r2 | |
| < 50 years | ||||||
| WCST | ||||||
| Total number of trials | 0.256 | 0.066 | –0.196 | 0.038 | 0.107 | 0.011 |
| Total number of errors | 0.192 | 0.037 | –0.194 | 0.038 | 0.075 | 0.006 |
| Perseverative responses | 0.161 | 0.026 | –0.222 | 0.049 | 0.096 | 0.009 |
| Perseverative errors | 0.169 | 0.029 | –0.230 | 0.053 | 0.094 | 0.009 |
| Trials to complete first category | 0.139 | 0.019 | –0.050 | 0.003 | –0.081 | 0.007 |
| MTCF | ||||||
| Copy accuracy | –0.306 | 0.094 | –0.156 | 0.024 | –0.050 | 0.003 |
| Copy time | –0.160 | 0.026 | 0.152 | 0.023 | –0.037 | 0.001 |
| Immediate recall | –0.230 | 0.053 | 0.144 | 0.021 | –0.115 | 0.013 |
| Delayed recall | –0.265 | 0.070 | 0.125 | 0.016 | –0.059 | 0.003 |
| Recognition | –0.096 | 0.009 | 0.035 | 0.001 | –0.164 | 0.027 |
| RULIT | ||||||
| Total number of correct choices in 2nd trial | –0.093 | 0.009 | 0.037 | 0.001 | –0.195 | 0.038 |
| Total number of correct choices | –0.139 | 0.019 | 0.110 | 0.012 | –0.214 | 0.046 |
| Total number of step errors | 0.133 | 0.018 | –0.076 | 0.006 | 0.225 | 0.051 |
| Total number of correct choices in delayed trial | –0.033 | 0.001 | 0.055 | 0.003 | –0.077 | 0.006 |
| Total number of step errors in delayed trial | 0.017 | 0.000 | –0.089 | 0.008 | 0.037 | 0.001 |
| ≥ 50 years | ||||||
| WCST | ||||||
| Total number of trials | 0.335 | 0.112 | –0.150 | 0.023 | –0.136 | 0.018 |
| Total number of errors | 0.393 | 0.154 | –0.138 | 0.019 | –0.115 | 0.013 |
| Perseverative responses | 0.334 | 0.112 | –0.188 | 0.035 | –0.100 | 0.010 |
| Perseverative errors | 0.337 | 0.114 | –0.194 | 0.038 | –0.108 | 0.012 |
| Trials to complete first category | 0.182 | 0.033 | 0.002 | 0.000 | –0.086 | 0.007 |
| MTCF | ||||||
| Copy accuracy | –0.132 | 0.017 | 0.416 | 0.173 | 0.017 | 0.000 |
| Copy time | 0.418 | 0.175 | –0.288 | 0.083 | 0.122 | 0.015 |
| Immediate recall | –0.247 | 0.061 | 0.285 | 0.081 | –0.040 | 0.002 |
| Delayed recall | –0.272 | 0.074 | 0.257 | 0.066 | –0.065 | 0.004 |
| Recognition | –0.074 | 0.005 | –0.038 | 0.001 | 0.007 | 0.000 |
| RULIT | ||||||
| Total number of correct choices in 2nd trial | –0.308 | 0.095 | –0.032 | 0.001 | –0.048 | 0.002 |
| Total number of correct choices | –0.046 | 0.002 | –0.040 | 0.002 | –0.061 | 0.004 |
| Total number of step errors | 0.446 | 0.199 | 0.055 | 0.003 | 0.051 | 0.003 |
| Total number of correct choices in delayed trial | –0.418 | 0.175 | 0.027 | 0.001 | –0.081 | 0.007 |
| Total number of step errors in delayed trial | 0.461 | 0.213 | –0.039 | 0.002 | 0.079 | 0.006 |
MTCF: Modified Taylor Complex Figure; RULIT: Ruff-Light Trail Learning Test; WCST: Wisconsin Card Sorting Test.
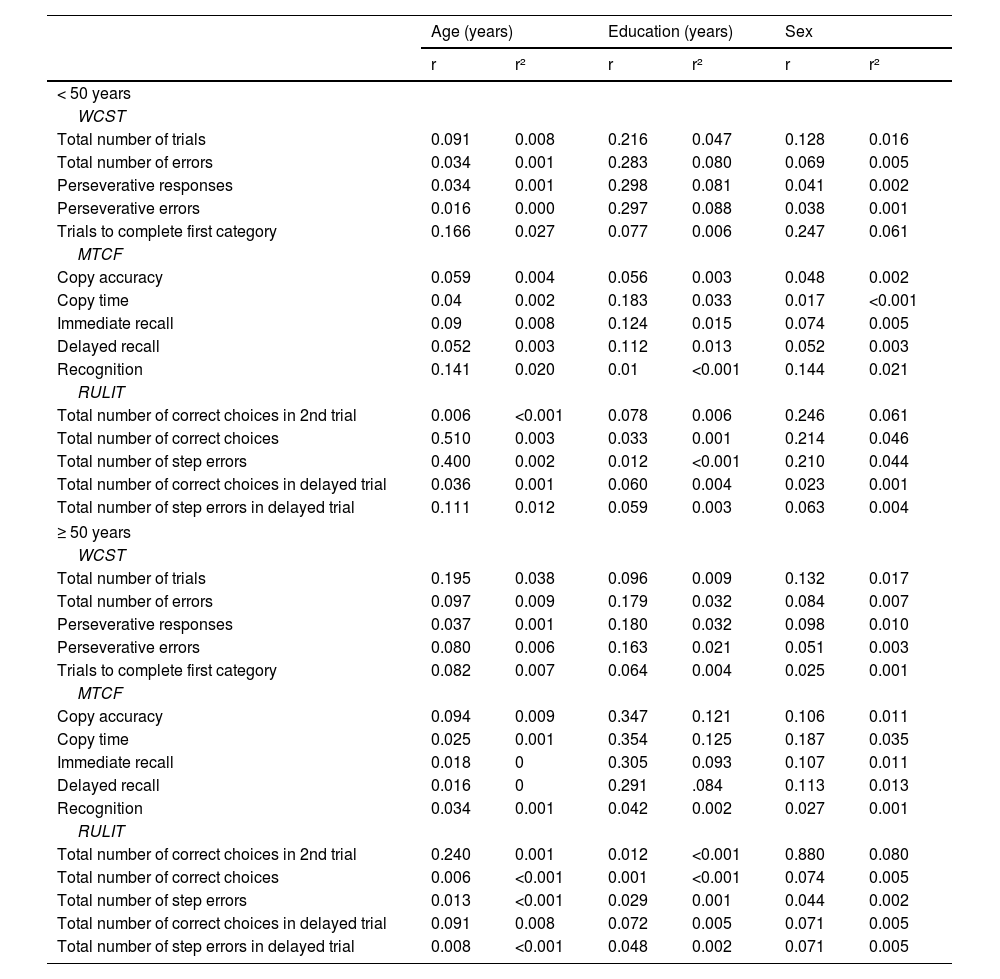
We observed an overall negative effect of age on the performance in the WCST and MTCF, which was more marked in the older group. This pattern was more pronounced in the RULIT, with a smaller effect in younger individuals and a larger effect in the older group. Education level explained a significant percentage of variance of the MTCF in the older group only. In contrast, it showed a positive influence on WCST performance in the younger group only. Education level had no significant effect on RULIT scores in any group. No significant sex-related differences were observed in MTCF or WCST scores. In the RULIT, men scored slightly better for total step errors in the younger age group. Table 4 shows the correlations (r) and explained variance (r2) of scaled scores for the WCST, MTCF, and RULIT, adjusted for age, sex, and level of education.
Correlation coefficients (r) and coefficients of determination (r2) of the scaled scores for the WCST, MTCF, and RULIT for age, education, and sex.
| Age (years) | Education (years) | Sex | ||||
|---|---|---|---|---|---|---|
| r | r² | r | r² | r | r² | |
| < 50 years | ||||||
| WCST | ||||||
| Total number of trials | 0.091 | 0.008 | 0.216 | 0.047 | 0.128 | 0.016 |
| Total number of errors | 0.034 | 0.001 | 0.283 | 0.080 | 0.069 | 0.005 |
| Perseverative responses | 0.034 | 0.001 | 0.298 | 0.081 | 0.041 | 0.002 |
| Perseverative errors | 0.016 | 0.000 | 0.297 | 0.088 | 0.038 | 0.001 |
| Trials to complete first category | 0.166 | 0.027 | 0.077 | 0.006 | 0.247 | 0.061 |
| MTCF | ||||||
| Copy accuracy | 0.059 | 0.004 | 0.056 | 0.003 | 0.048 | 0.002 |
| Copy time | 0.04 | 0.002 | 0.183 | 0.033 | 0.017 | <0.001 |
| Immediate recall | 0.09 | 0.008 | 0.124 | 0.015 | 0.074 | 0.005 |
| Delayed recall | 0.052 | 0.003 | 0.112 | 0.013 | 0.052 | 0.003 |
| Recognition | 0.141 | 0.020 | 0.01 | <0.001 | 0.144 | 0.021 |
| RULIT | ||||||
| Total number of correct choices in 2nd trial | 0.006 | <0.001 | 0.078 | 0.006 | 0.246 | 0.061 |
| Total number of correct choices | 0.510 | 0.003 | 0.033 | 0.001 | 0.214 | 0.046 |
| Total number of step errors | 0.400 | 0.002 | 0.012 | <0.001 | 0.210 | 0.044 |
| Total number of correct choices in delayed trial | 0.036 | 0.001 | 0.060 | 0.004 | 0.023 | 0.001 |
| Total number of step errors in delayed trial | 0.111 | 0.012 | 0.059 | 0.003 | 0.063 | 0.004 |
| ≥ 50 years | ||||||
| WCST | ||||||
| Total number of trials | 0.195 | 0.038 | 0.096 | 0.009 | 0.132 | 0.017 |
| Total number of errors | 0.097 | 0.009 | 0.179 | 0.032 | 0.084 | 0.007 |
| Perseverative responses | 0.037 | 0.001 | 0.180 | 0.032 | 0.098 | 0.010 |
| Perseverative errors | 0.080 | 0.006 | 0.163 | 0.021 | 0.051 | 0.003 |
| Trials to complete first category | 0.082 | 0.007 | 0.064 | 0.004 | 0.025 | 0.001 |
| MTCF | ||||||
| Copy accuracy | 0.094 | 0.009 | 0.347 | 0.121 | 0.106 | 0.011 |
| Copy time | 0.025 | 0.001 | 0.354 | 0.125 | 0.187 | 0.035 |
| Immediate recall | 0.018 | 0 | 0.305 | 0.093 | 0.107 | 0.011 |
| Delayed recall | 0.016 | 0 | 0.291 | .084 | 0.113 | 0.013 |
| Recognition | 0.034 | 0.001 | 0.042 | 0.002 | 0.027 | 0.001 |
| RULIT | ||||||
| Total number of correct choices in 2nd trial | 0.240 | 0.001 | 0.012 | <0.001 | 0.880 | 0.080 |
| Total number of correct choices | 0.006 | <0.001 | 0.001 | <0.001 | 0.074 | 0.005 |
| Total number of step errors | 0.013 | <0.001 | 0.029 | 0.001 | 0.044 | 0.002 |
| Total number of correct choices in delayed trial | 0.091 | 0.008 | 0.072 | 0.005 | 0.071 | 0.005 |
| Total number of step errors in delayed trial | 0.008 | <0.001 | 0.048 | 0.002 | 0.071 | 0.005 |
MTCF: Modified Taylor Complex Figure; RULIT: Ruff-Light Trail Learning Test; WCST: Wisconsin Card Sorting Test.
Tables A1–A15 (Supplementary material) present age-adjusted NEURONORMA scaled scores for the WCST, MTCF, and RULIT. The scaled scores and percentiles associated with the raw scores for each specific age range are presented in the first and second columns.
Tables B1–B8 (Supplementary material) present education-adjusted scaled scores and the corresponding β values. Regarding adjustment for sex, in accordance with the criteria for an effect to be considered relevant, the formula was only applied to the variable total correct choices in the RULIT. To adjust SS for age and sex for this variable, the age-adjusted SS must be increased in young women (Supplementary material, Table B8).
DiscussionThe purpose of this study was to provide normative data for the WCST, MTCF, and RULIT in the adult Spanish population. We studied the effect of age, sex, and level of education on test performance, and adjusted for these variables when necessary. This study is part of the NEURONORMA project, which simultaneously normalised several neuropsychological tests. This enables direct comparisons in test performance between different tests and for different cognitive functions, while identifying useful neuropsychological profiles for clinical practice.
Wisconsin Card Sorting TestAge was found to have a significant negative effect on test performance (performance on the WCST worsens as age increases). This is consistent with the results of previous studies showing a pattern of progressive decrease in test performance over time.13,29,30 According to Heaton et al.,9 performance remains stable between the ages of 20 and 50 years, and decreases progressively after the sixth decade of life. Our findings support these data, as we observed better performance in individuals aged 20–50 years, and poorer performance after the age of 50. In a normalisation study conducted in Taiwan,10 optimal performance was observed between the ages of 20 and 29 years; no significant differences in performance were observed in older groups. Although in our study the participants within that age range did display a trend toward better scores than older individuals, these differences were negligible. The clearly better performance of the Taiwanese participants aged under 30 years and the relative stability of the measures until advanced ages may be due to cultural and sampling factors; the authors themselves propose this explanation for the differences observed with respect to data from the United States, which are similar to our own findings.
Level of education has been shown to have a significant influence among younger adults (< 50 years) in all variables of the WCST. This effect was not apparent in individuals over the age of 50 years, in whom differences in performance are better explained by age. However, in a previous study9, the effect of education on WCST performance was found to increase gradually and progressively from the lowest to the highest levels of education, independently of ageing. Another study30 found no differences in WCST performance between individuals with different levels of education. Differences between studies in sample characteristics and in the statistical treatment of variables may explain such discrepancies. No significant sex-related differences were found in any of the WCST variables, as observed in previous studies.9,13,31
Modified Taylor Complex FigureAge was observed to have a negative effect on test performance, with more marked differences after the age of 50 years. The level of education had no effect on test performance in younger adults, but we did observe a significant positive influence in the older group. No significant sex-related differences were observed. Overall, our results are in line with those of previous studies on MTCF performance.32–34 and support the findings of other studies reporting a negative effect of age on performance in TCF35,36 and of the Spanish normative study of TCF, which showed poorer performance in individuals of older age and lower levels of education.18
Ruff-Light Trail Learning TestAge was found to have a negative impact on RULIT performance, mainly in the group of individuals older than 50 years. Education, in contrast, had no influence on any variable, regardless of age. These results are consistent with the original normative data,19 but stand in contrast with those of another study reporting poorer results in participants with lower levels of education.37 However, the latter study presented total scores only, without subtest scores. Our study found a significant effect of sex on total correct choices in the group of younger adults (< 50 years), with men performing better. These results stand in contrast with those of the original study,19 in which no significant sex effect was observed. On the other hand, some studies report that women perform better in verbal memory tasks and men in spatial memory tasks.38
LimitationsThe main limitations of this study are related to the small size of the sample and the limited applicability of the normative data presented. The wide age range of our sample resulted in smaller age subgroups, reducing the representativeness of the norms. Another relevant limitation concerns the applicability of these data to other Spanish-speaking populations, as our study only included Spanish individuals. These normative data should be used with caution in other Spanish-speaking countries due to the potential impact of cultural differences on test performance.
Conflicts of interestThe authors have no conflicts of interest to declare.
FundingThis study has received no specific funding from any public, commercial, or non-profit organisation.
We would like to thank all the participants for their selfless collaboration. We also wish to thank the following social clubs for older adults for their support: Barceloneta, Verneda, Verneda Alta, and Can Castelló. Lastly, we also thank the linguists Anna Planas and Mercè Paez for translating the original instructions of the tests into Spanish.
The following is Supplementary data to this article:
