


In recent decades, mortality rates for cerebrovascular diseases (CVD) have declined significantly in many countries. This study analyses changes in CVD mortality rates in Spain (1980-2011) to determine if previously observed trends remain.
Patients and methodsData on CVD mortality rates and the population data needed for the analysis were provided by Spain's National Statistics Institute. We calculated age-specific mortality rate, age-standardised overall mortality, and age-truncated mortality (35-64 years) using the direct method and standard European population structure. Joinpoint analysis was used to estimate the percentage of annual change in rates and identify significant changes in trends.
ResultsCVD mortality rate decreased considerably and continuously over the last 32 years in all age groups and in both sexes in Spain. For both sexes, joinpoint analysis identifies a final period with more marked decline: 2005-2011 in women (−6.3%) and 2007-2011 in men (−7.2%).
ConclusionsCVD mortality rates displayed a marked and continuous decline in Spain between 1980 and 2011. Due to the ageing of the population, doctors expect an increase in CVD prevalence and therefore its magnitude in terms of disability and healthcare costs, which poses a challenge to our health system.
En las últimas décadas las tasas de mortalidad por enfermedades cerebrovasculares (ECV) han descendido de forma importante en muchos países. En este estudio se analizan los cambios recientes en la evolución de la mortalidad por ECV en España (1980-2011) para verificar si las tendencias observadas previamente continúan.
Pacientes y métodosLos datos de mortalidad por ECV y las poblaciones necesarias para el cálculo de los indicadores fueron facilitados por el Instituto Nacional de Estadística. Se calcularon las tasas específicas por grupos de edad y estandarizadas globales y truncadas (35-64 años) mediante el método directo (población estándar europea). Mediante análisis de regresión «joinpoint» estimamos el porcentaje de cambio anual de las tasas e identificamos puntos de cambio significativos en la tendencia.
ResultadosLa mortalidad por ECV se ha reducido de forma contundente y sostenida en los últimos 32 años en todos los grupos de edad y sexo en España. En ambos sexos el análisis joinpoint identifica un periodo final de mayor descenso (2005-2011 [−6,3%] en mujeres y 2007-2011 en varones [−7,2%]).
ConclusionesExiste un marcado y continuo descenso en la mortalidad por ECV en España (1980-2011). Teniendo en cuenta el proceso de envejecimiento de la población, es esperable un incremento de la prevalencia y, por ello, de la magnitud de las ECV medida en términos de discapacidad y costes de salud, lo que representará un gran reto para nuestro sistema sanitario.
Although mortality rates for cerebrovascular diseases (CVD) have decreased significantly in many countries over the past few decades,1 the global burden of stroke is still a major concern as this entity is the second leading cause of death2 and the third cause of disability in the world.3 Furthermore, 40% of stroke patients have poor outcomes (death, dependency, or institutionalisation 3 months after stroke).4
In Europe, CVD mortality rates are increasingly dissimilar between countries; in fact, four-fold differences have been observed between some countries, and current trends are also highly divergent. The countries which had attained low mortality rates by the end of the 20th century experienced further declines, while mortality rates in the countries with moderate to high stroke mortality during the 1990s experienced an unprecedented increase.5
Due to the progressive ageing of the population and the increased prevalence of the main risk factors (arterial hypertension, diabetes, obesity, etc.), a further increase in CDV incidence is expected, with rates doubling by the year 2020.5,6
In Spain, CVD mortality started to decrease in 1973 in men and a year later in women.7 Rates declined faster during the 1990s, particularly in older age groups.8 There are still significant geographical differences, with very low rates in Castile-Leon, and very high rates in Murcia, the Valencian Community, and Andalusia.9
In light of the above and given the need for updated epidemiological data regarding stroke, we decided to analyse recent changes in CVD mortality rates in Spain (1980-2011) to confirm whether previously observed trends persisted.
Patients and methodsAge- and sex-adjusted mortality data were obtained from information published by Spain's National Statistics Institute between 1980 and 2011. We have used CVD deaths (codes 430-438 and I60-I69 of the ninth and tenth editions of the International Classification of Diseases for the periods 1979-1998 and 1999-2008, respectively) and the populations estimated by Spain's National Statistics Institute as of 1 July of each year in our analysis.
For each sex, we calculated age-specific rates, and overall (all ages) and truncated (35-64 years) age-standardised rates using the direct method and the European population as a reference. Values obtained were expressed as rates per 100000 person-years.
We conducted a trend analysis with joinpoint regression models10 using the software developed by the Surveillance Research Programme of the U.S. National Cancer Institute.11 These models have a double purpose: to identify time points associated with a significant change in disease trends, and to estimate the magnitude of trend changes (increases or decreases) for each time period. Thus, results include the years (period) making up each trend, as well as the annual percentage change (APC) and confidence intervals for each trend.
To estimate these models, we used standardised mortality rates and their standard errors; in models using age-specific rates, deaths and populations following the Poisson distribution were used.
Our previous experience12,13 has shown that the final linear trend can be markedly influenced by some outliers. To reduce the probability of obtaining trends resulting from a random fluctuation of data, we set a minimum number of 5 data points between 2 joinpoints. We established a maximum of 3 joinpoints for each regression model. The software fits the simplest model that the data allow by using the weighted least-squares technique and estimates statistical significance with the Monte Carlo Permutation method. A comparability test was performed to check whether trends in men and women were parallel.14 Statistical significance was set at P=.05.
We used a Microsoft® Excel spreadsheet to calculate mortality rates and standard errors.
ResultsOur data confirm that cardiovascular disease is the main cause of death in Spain, in both men and women, with 117532 deaths in 2011. Of these, 28855 were due to CVD, which represents a crude mortality rate of 61.7 deaths per 100000 people. Mortality rates are higher in women (70.6) than in men (52.7). However, in patients younger than 75, the mortality rate in men (3022 deaths) is 1.7 times that in women (1759 deaths).
CVD mortality rates are higher in older patients and show sex-related differences. In men, one in 2 deaths in 2011 corresponds to a patient younger than 75; in women, the proportion is one in 10.
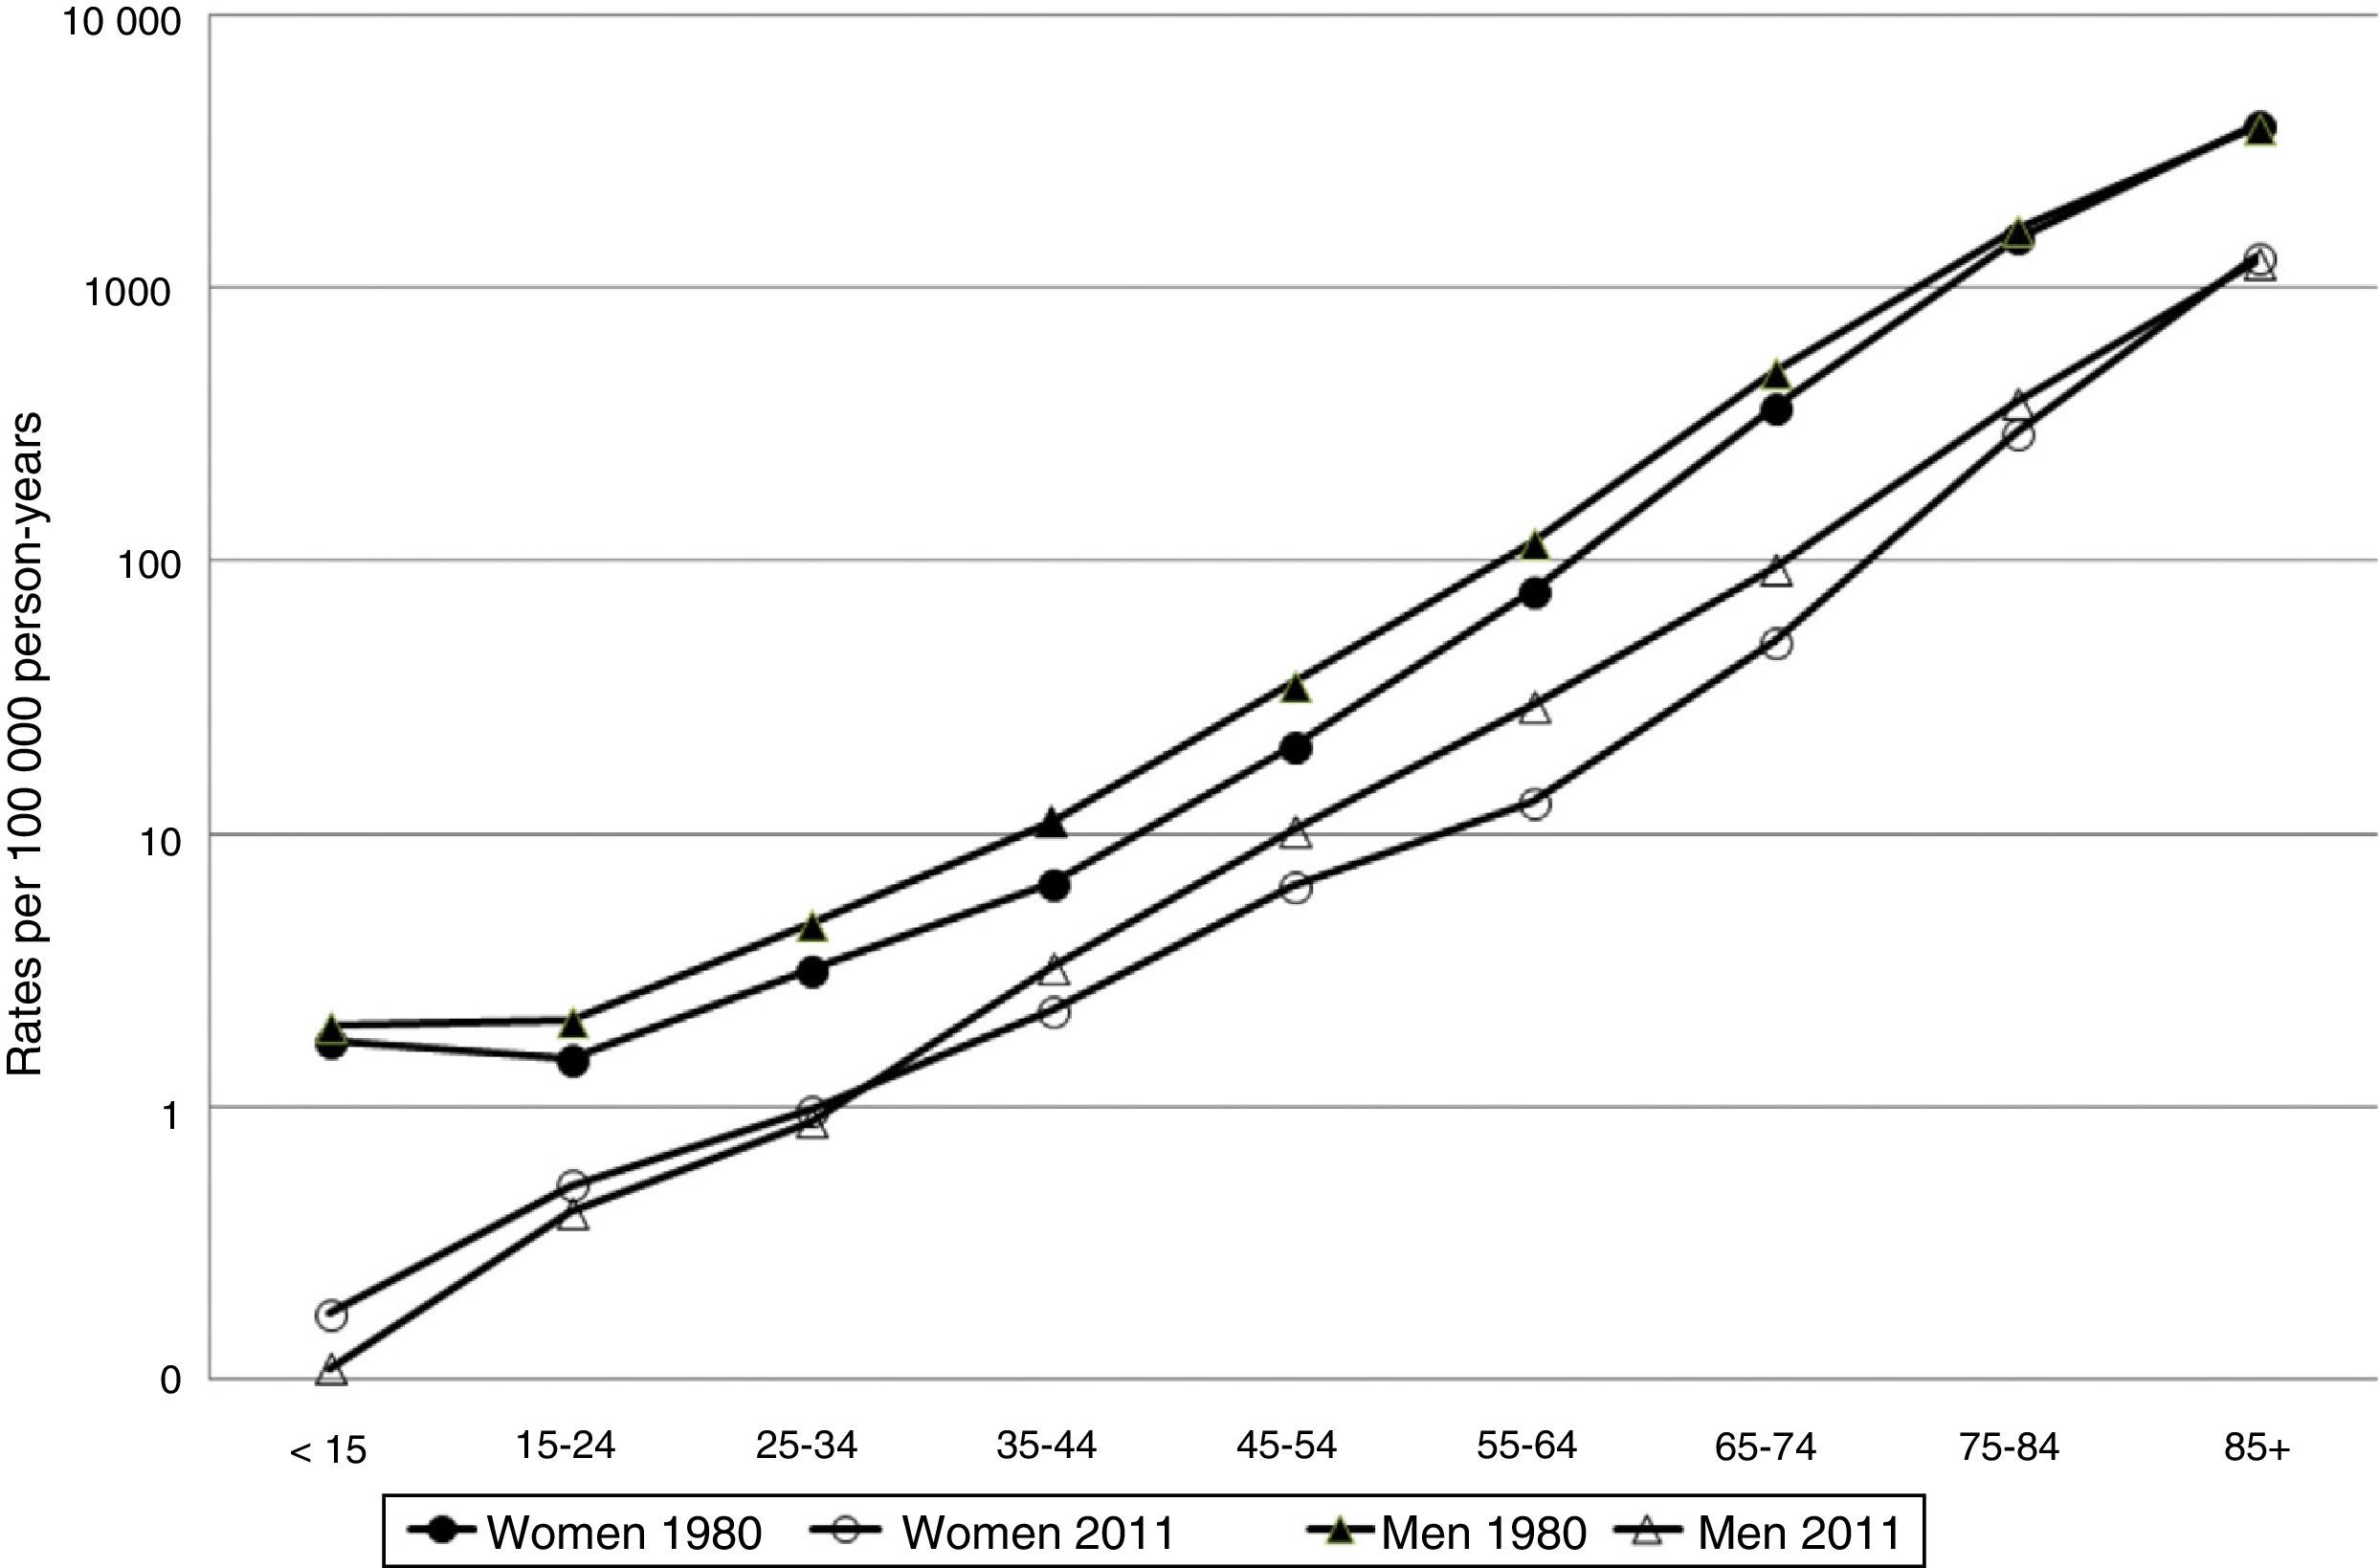
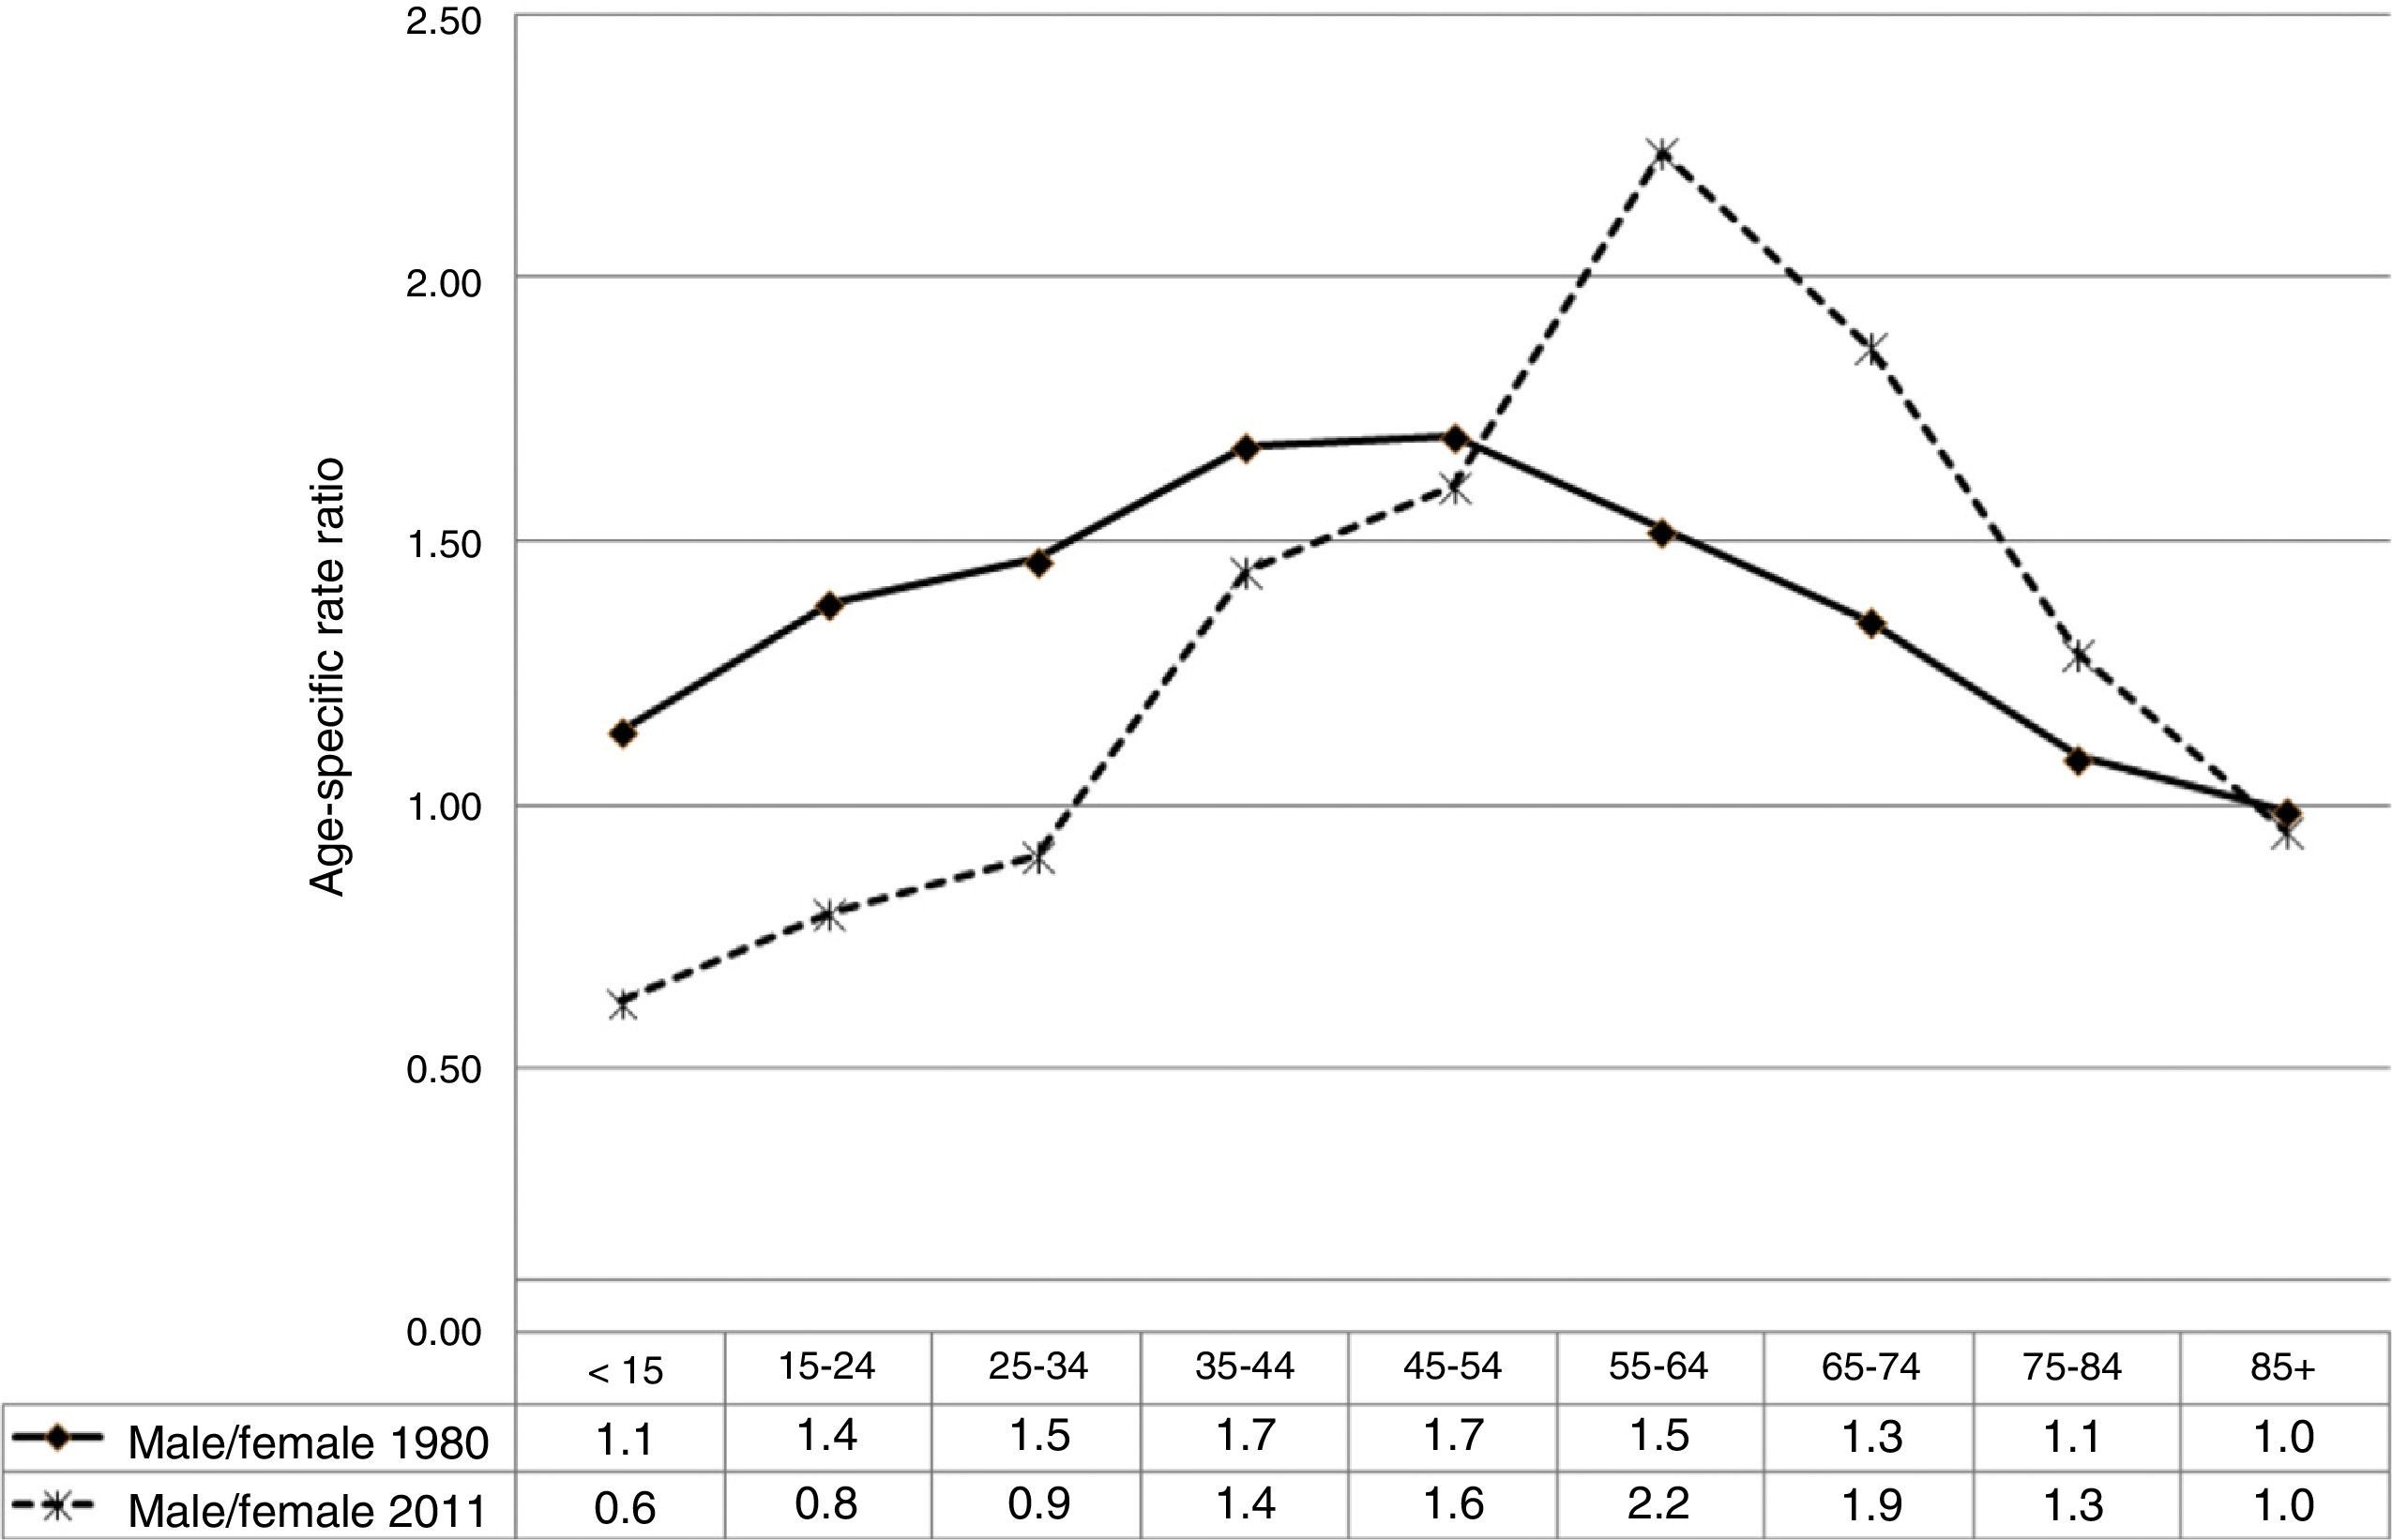
Fig. 1 shows the age- and sex-specific CVD mortality rates for the years 1980 and 2011. Rates in both sexes show an exponential growth as age increases. Fig. 2 shows the male/female ratio by age group for the years 1980 and 2011. This ratio was higher than 1 for all age groups younger than 85 in 1980. In 2011, the male/female ratio is less than 1 in younger patients (<35 years), and greater than 1 in the remaining age groups up to the age of 84.

 of mortality due to cerebrovascular diseases in Spain, 1980 and 2011.")
Mean age at death has experienced a steady increase during the study period from 76 years in 1980 to 82 years in 2011 (from 74 to 80 in men, and from 78 to 85 in women, in 1980 and 2011, respectively).
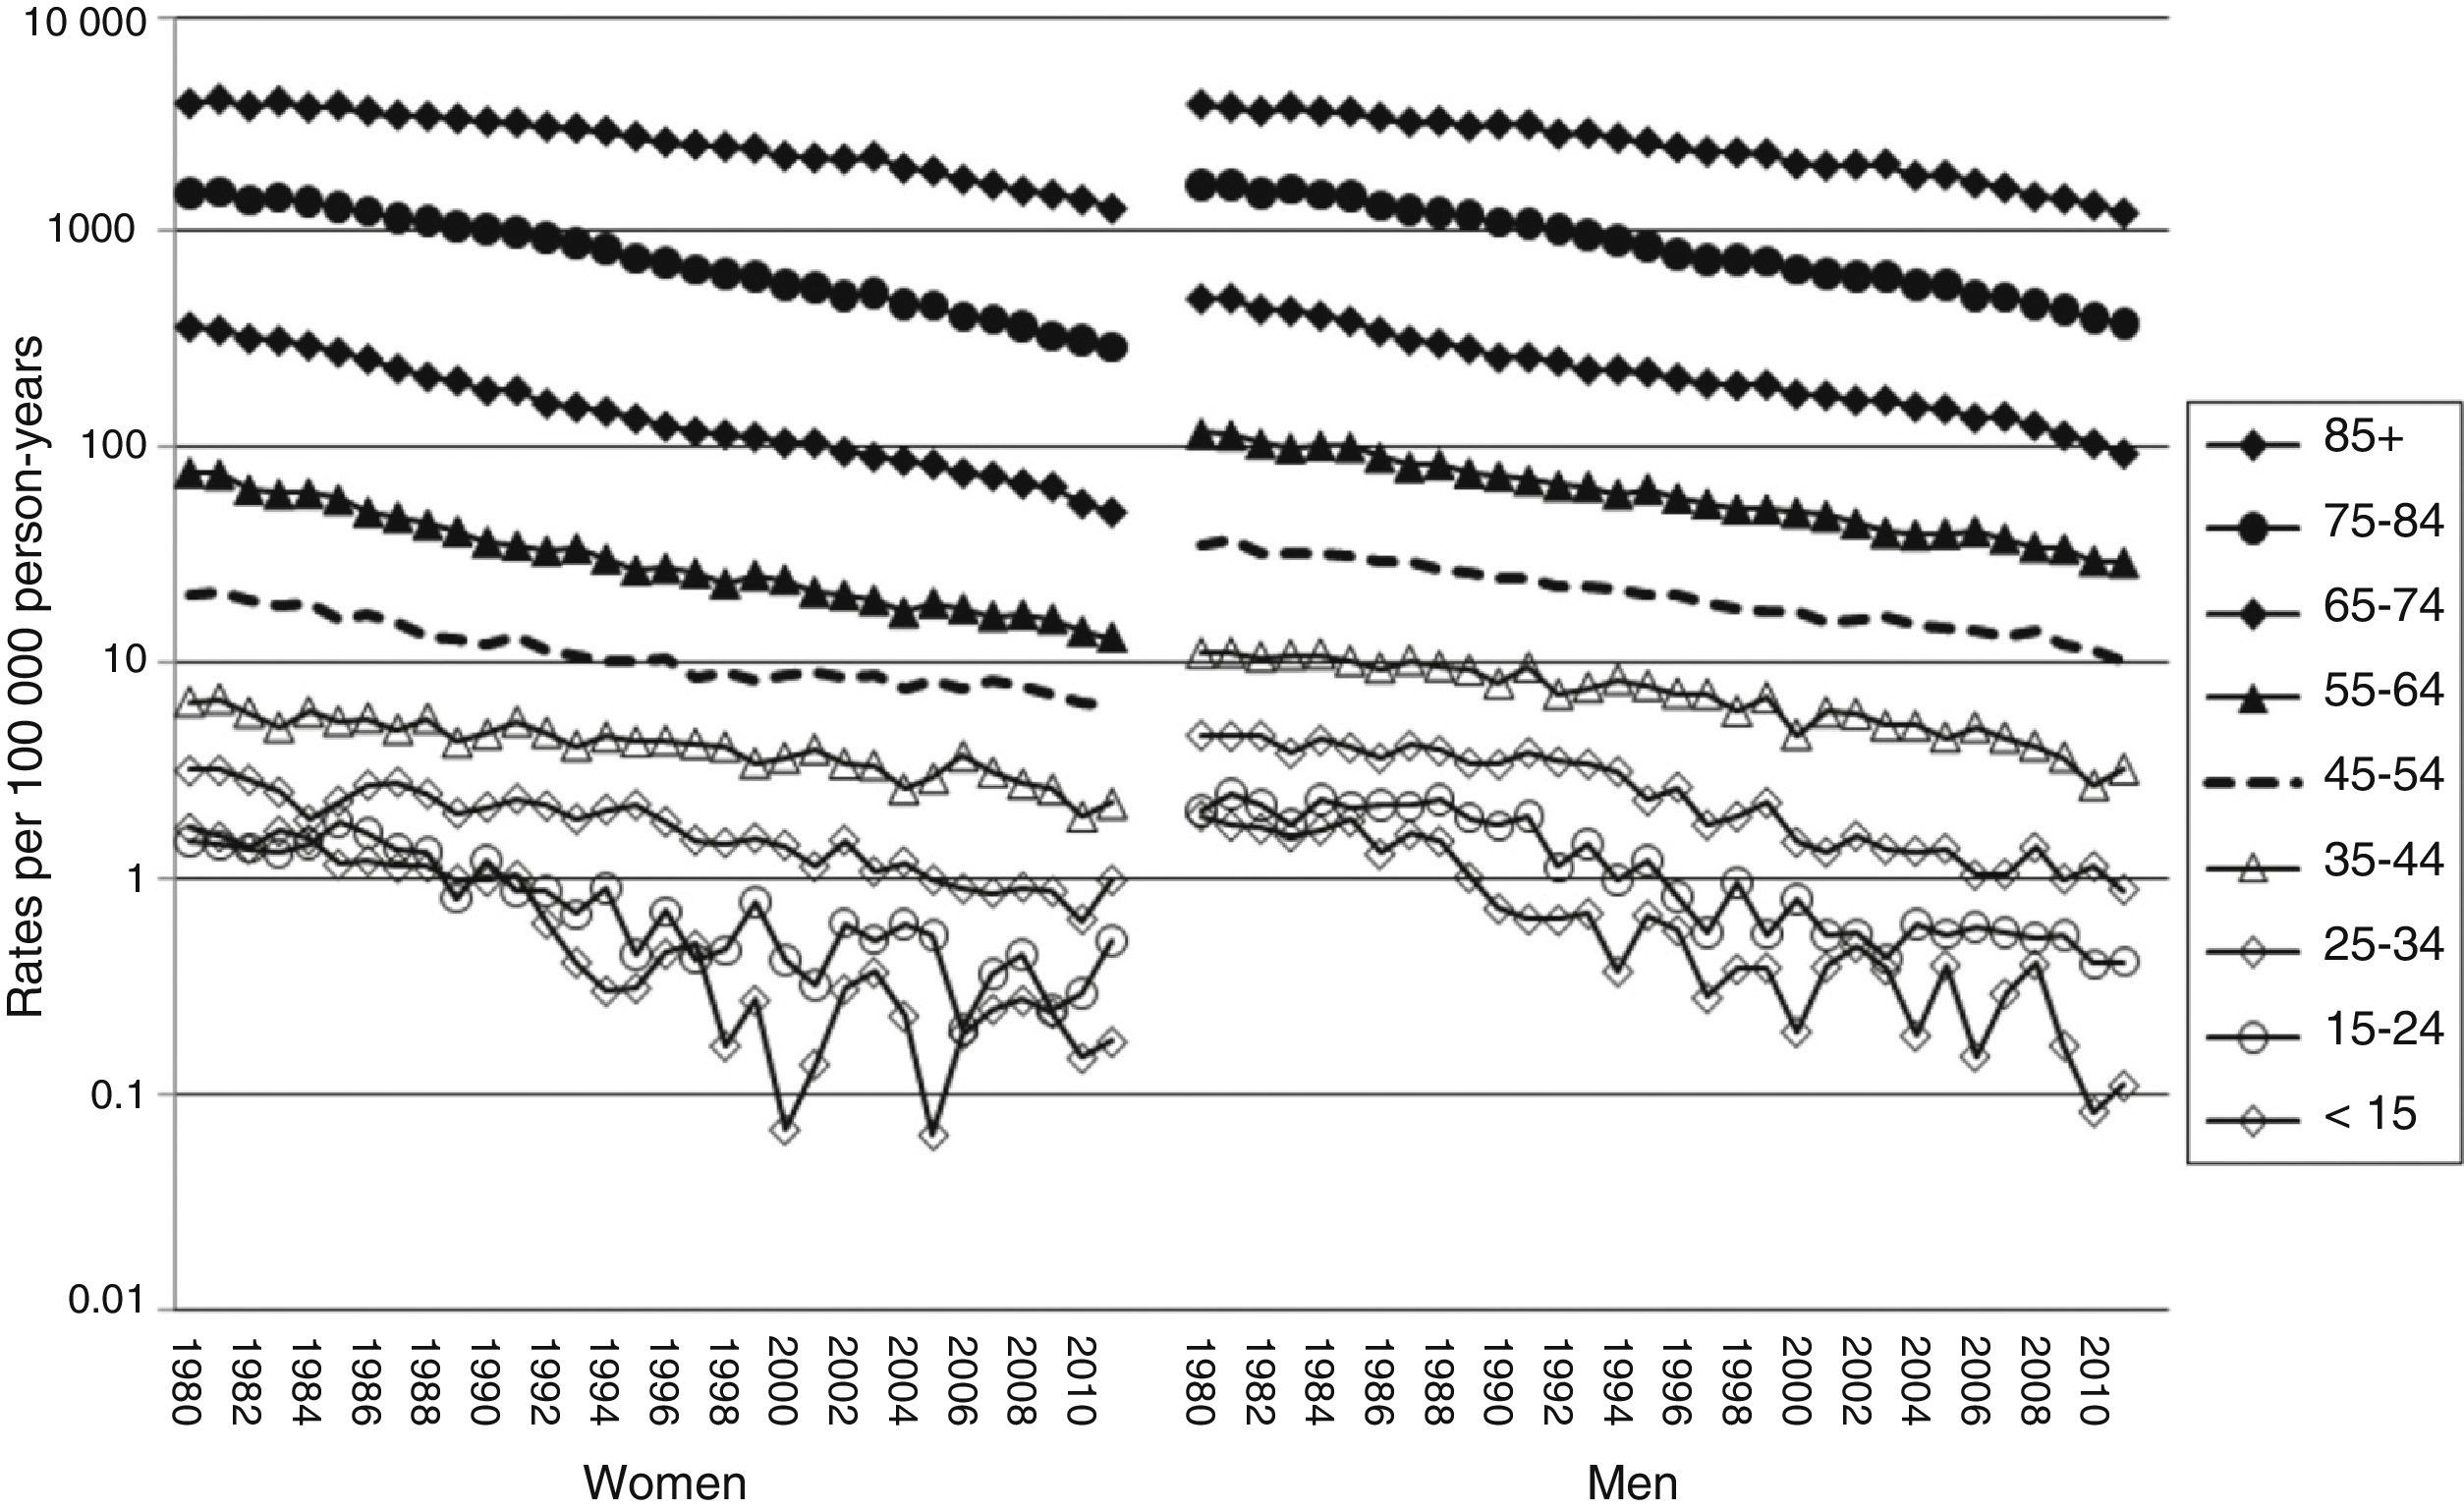
CVD mortality has shown a dramatic and continuous decrease over the 32 years of our study in all age and sex groups (Fig. 3).

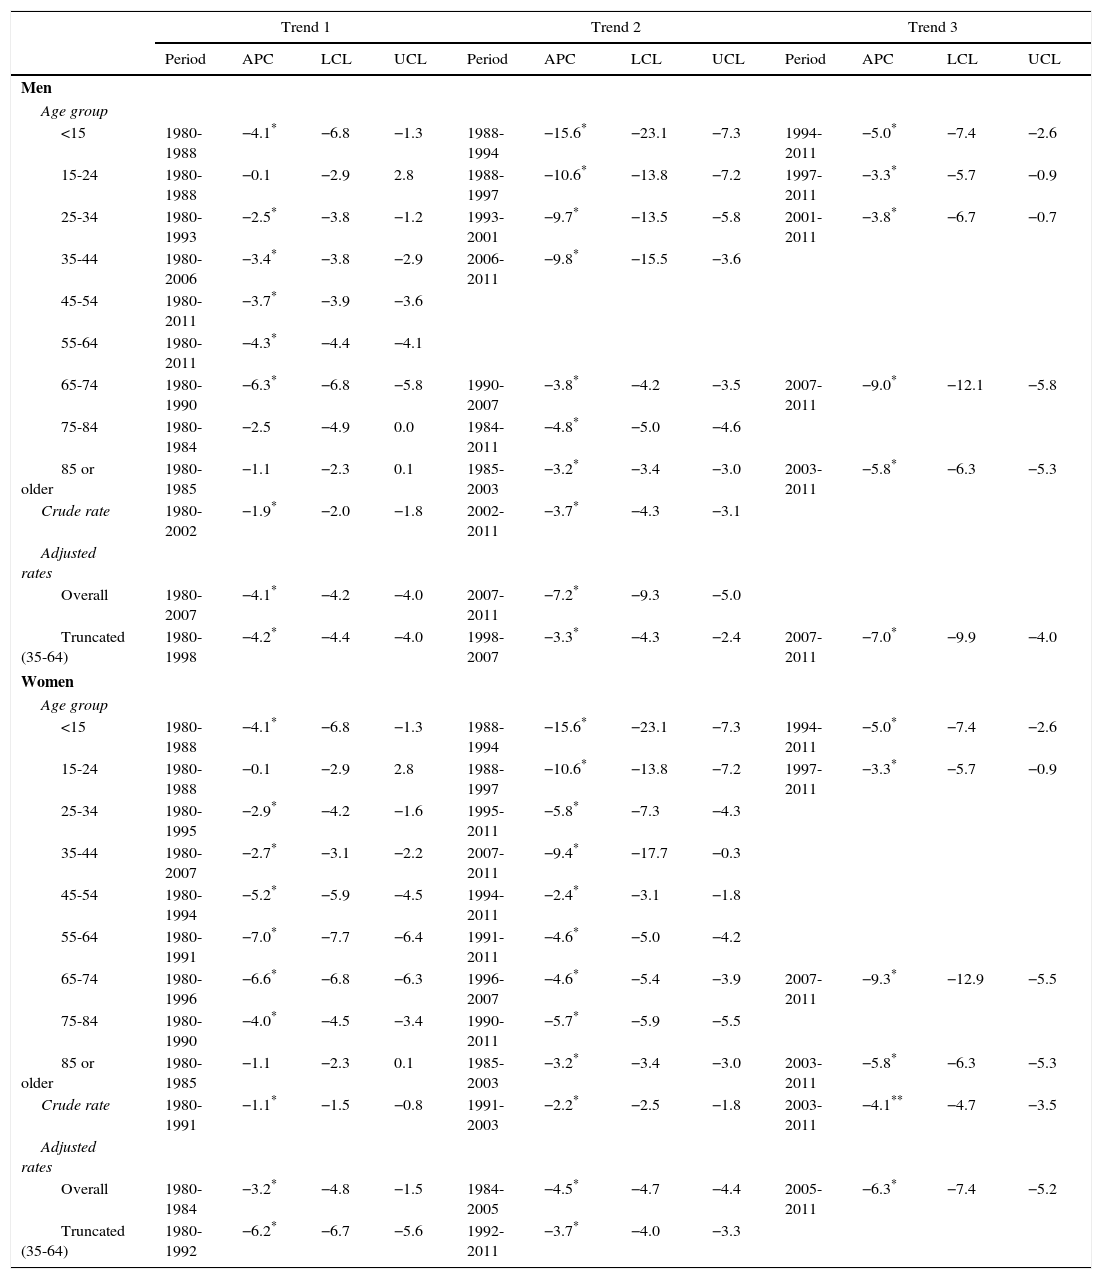
Results of the joinpoint regression analysis, that is, the points representing a significant change in rates (age group-specific, crude, and adjusted), and APC of every trend are shown categorised by sex in Table 1.
Joinpoint analysis of mortality due to cerebrovascular diseases, by age group and sex. Spain, 1980-2011.
| Trend 1 | Trend 2 | Trend 3 | ||||||||||
|---|---|---|---|---|---|---|---|---|---|---|---|---|
| Period | APC | LCL | UCL | Period | APC | LCL | UCL | Period | APC | LCL | UCL | |
| Men | ||||||||||||
| Age group | ||||||||||||
| <15 | 1980-1988 | −4.1* | −6.8 | −1.3 | 1988-1994 | −15.6* | −23.1 | −7.3 | 1994-2011 | −5.0* | −7.4 | −2.6 |
| 15-24 | 1980-1988 | −0.1 | −2.9 | 2.8 | 1988-1997 | −10.6* | −13.8 | −7.2 | 1997-2011 | −3.3* | −5.7 | −0.9 |
| 25-34 | 1980-1993 | −2.5* | −3.8 | −1.2 | 1993-2001 | −9.7* | −13.5 | −5.8 | 2001-2011 | −3.8* | −6.7 | −0.7 |
| 35-44 | 1980-2006 | −3.4* | −3.8 | −2.9 | 2006-2011 | −9.8* | −15.5 | −3.6 | ||||
| 45-54 | 1980-2011 | −3.7* | −3.9 | −3.6 | ||||||||
| 55-64 | 1980-2011 | −4.3* | −4.4 | −4.1 | ||||||||
| 65-74 | 1980-1990 | −6.3* | −6.8 | −5.8 | 1990-2007 | −3.8* | −4.2 | −3.5 | 2007-2011 | −9.0* | −12.1 | −5.8 |
| 75-84 | 1980-1984 | −2.5 | −4.9 | 0.0 | 1984-2011 | −4.8* | −5.0 | −4.6 | ||||
| 85 or older | 1980-1985 | −1.1 | −2.3 | 0.1 | 1985-2003 | −3.2* | −3.4 | −3.0 | 2003-2011 | −5.8* | −6.3 | −5.3 |
| Crude rate | 1980-2002 | −1.9* | −2.0 | −1.8 | 2002-2011 | −3.7* | −4.3 | −3.1 | ||||
| Adjusted rates | ||||||||||||
| Overall | 1980-2007 | −4.1* | −4.2 | −4.0 | 2007-2011 | −7.2* | −9.3 | −5.0 | ||||
| Truncated (35-64) | 1980-1998 | −4.2* | −4.4 | −4.0 | 1998-2007 | −3.3* | −4.3 | −2.4 | 2007-2011 | −7.0* | −9.9 | −4.0 |
| Women | ||||||||||||
| Age group | ||||||||||||
| <15 | 1980-1988 | −4.1* | −6.8 | −1.3 | 1988-1994 | −15.6* | −23.1 | −7.3 | 1994-2011 | −5.0* | −7.4 | −2.6 |
| 15-24 | 1980-1988 | −0.1 | −2.9 | 2.8 | 1988-1997 | −10.6* | −13.8 | −7.2 | 1997-2011 | −3.3* | −5.7 | −0.9 |
| 25-34 | 1980-1995 | −2.9* | −4.2 | −1.6 | 1995-2011 | −5.8* | −7.3 | −4.3 | ||||
| 35-44 | 1980-2007 | −2.7* | −3.1 | −2.2 | 2007-2011 | −9.4* | −17.7 | −0.3 | ||||
| 45-54 | 1980-1994 | −5.2* | −5.9 | −4.5 | 1994-2011 | −2.4* | −3.1 | −1.8 | ||||
| 55-64 | 1980-1991 | −7.0* | −7.7 | −6.4 | 1991-2011 | −4.6* | −5.0 | −4.2 | ||||
| 65-74 | 1980-1996 | −6.6* | −6.8 | −6.3 | 1996-2007 | −4.6* | −5.4 | −3.9 | 2007-2011 | −9.3* | −12.9 | −5.5 |
| 75-84 | 1980-1990 | −4.0* | −4.5 | −3.4 | 1990-2011 | −5.7* | −5.9 | −5.5 | ||||
| 85 or older | 1980-1985 | −1.1 | −2.3 | 0.1 | 1985-2003 | −3.2* | −3.4 | −3.0 | 2003-2011 | −5.8* | −6.3 | −5.3 |
| Crude rate | 1980-1991 | −1.1* | −1.5 | −0.8 | 1991-2003 | −2.2* | −2.5 | −1.8 | 2003-2011 | −4.1** | −4.7 | −3.5 |
| Adjusted rates | ||||||||||||
| Overall | 1980-1984 | −3.2* | −4.8 | −1.5 | 1984-2005 | −4.5* | −4.7 | −4.4 | 2005-2011 | −6.3* | −7.4 | −5.2 |
| Truncated (35-64) | 1980-1992 | −6.2* | −6.7 | −5.6 | 1992-2011 | −3.7* | −4.0 | −3.3 | ||||
LCL: lower confidence level; UCL: upper confidence level; APC: annual percentage change.
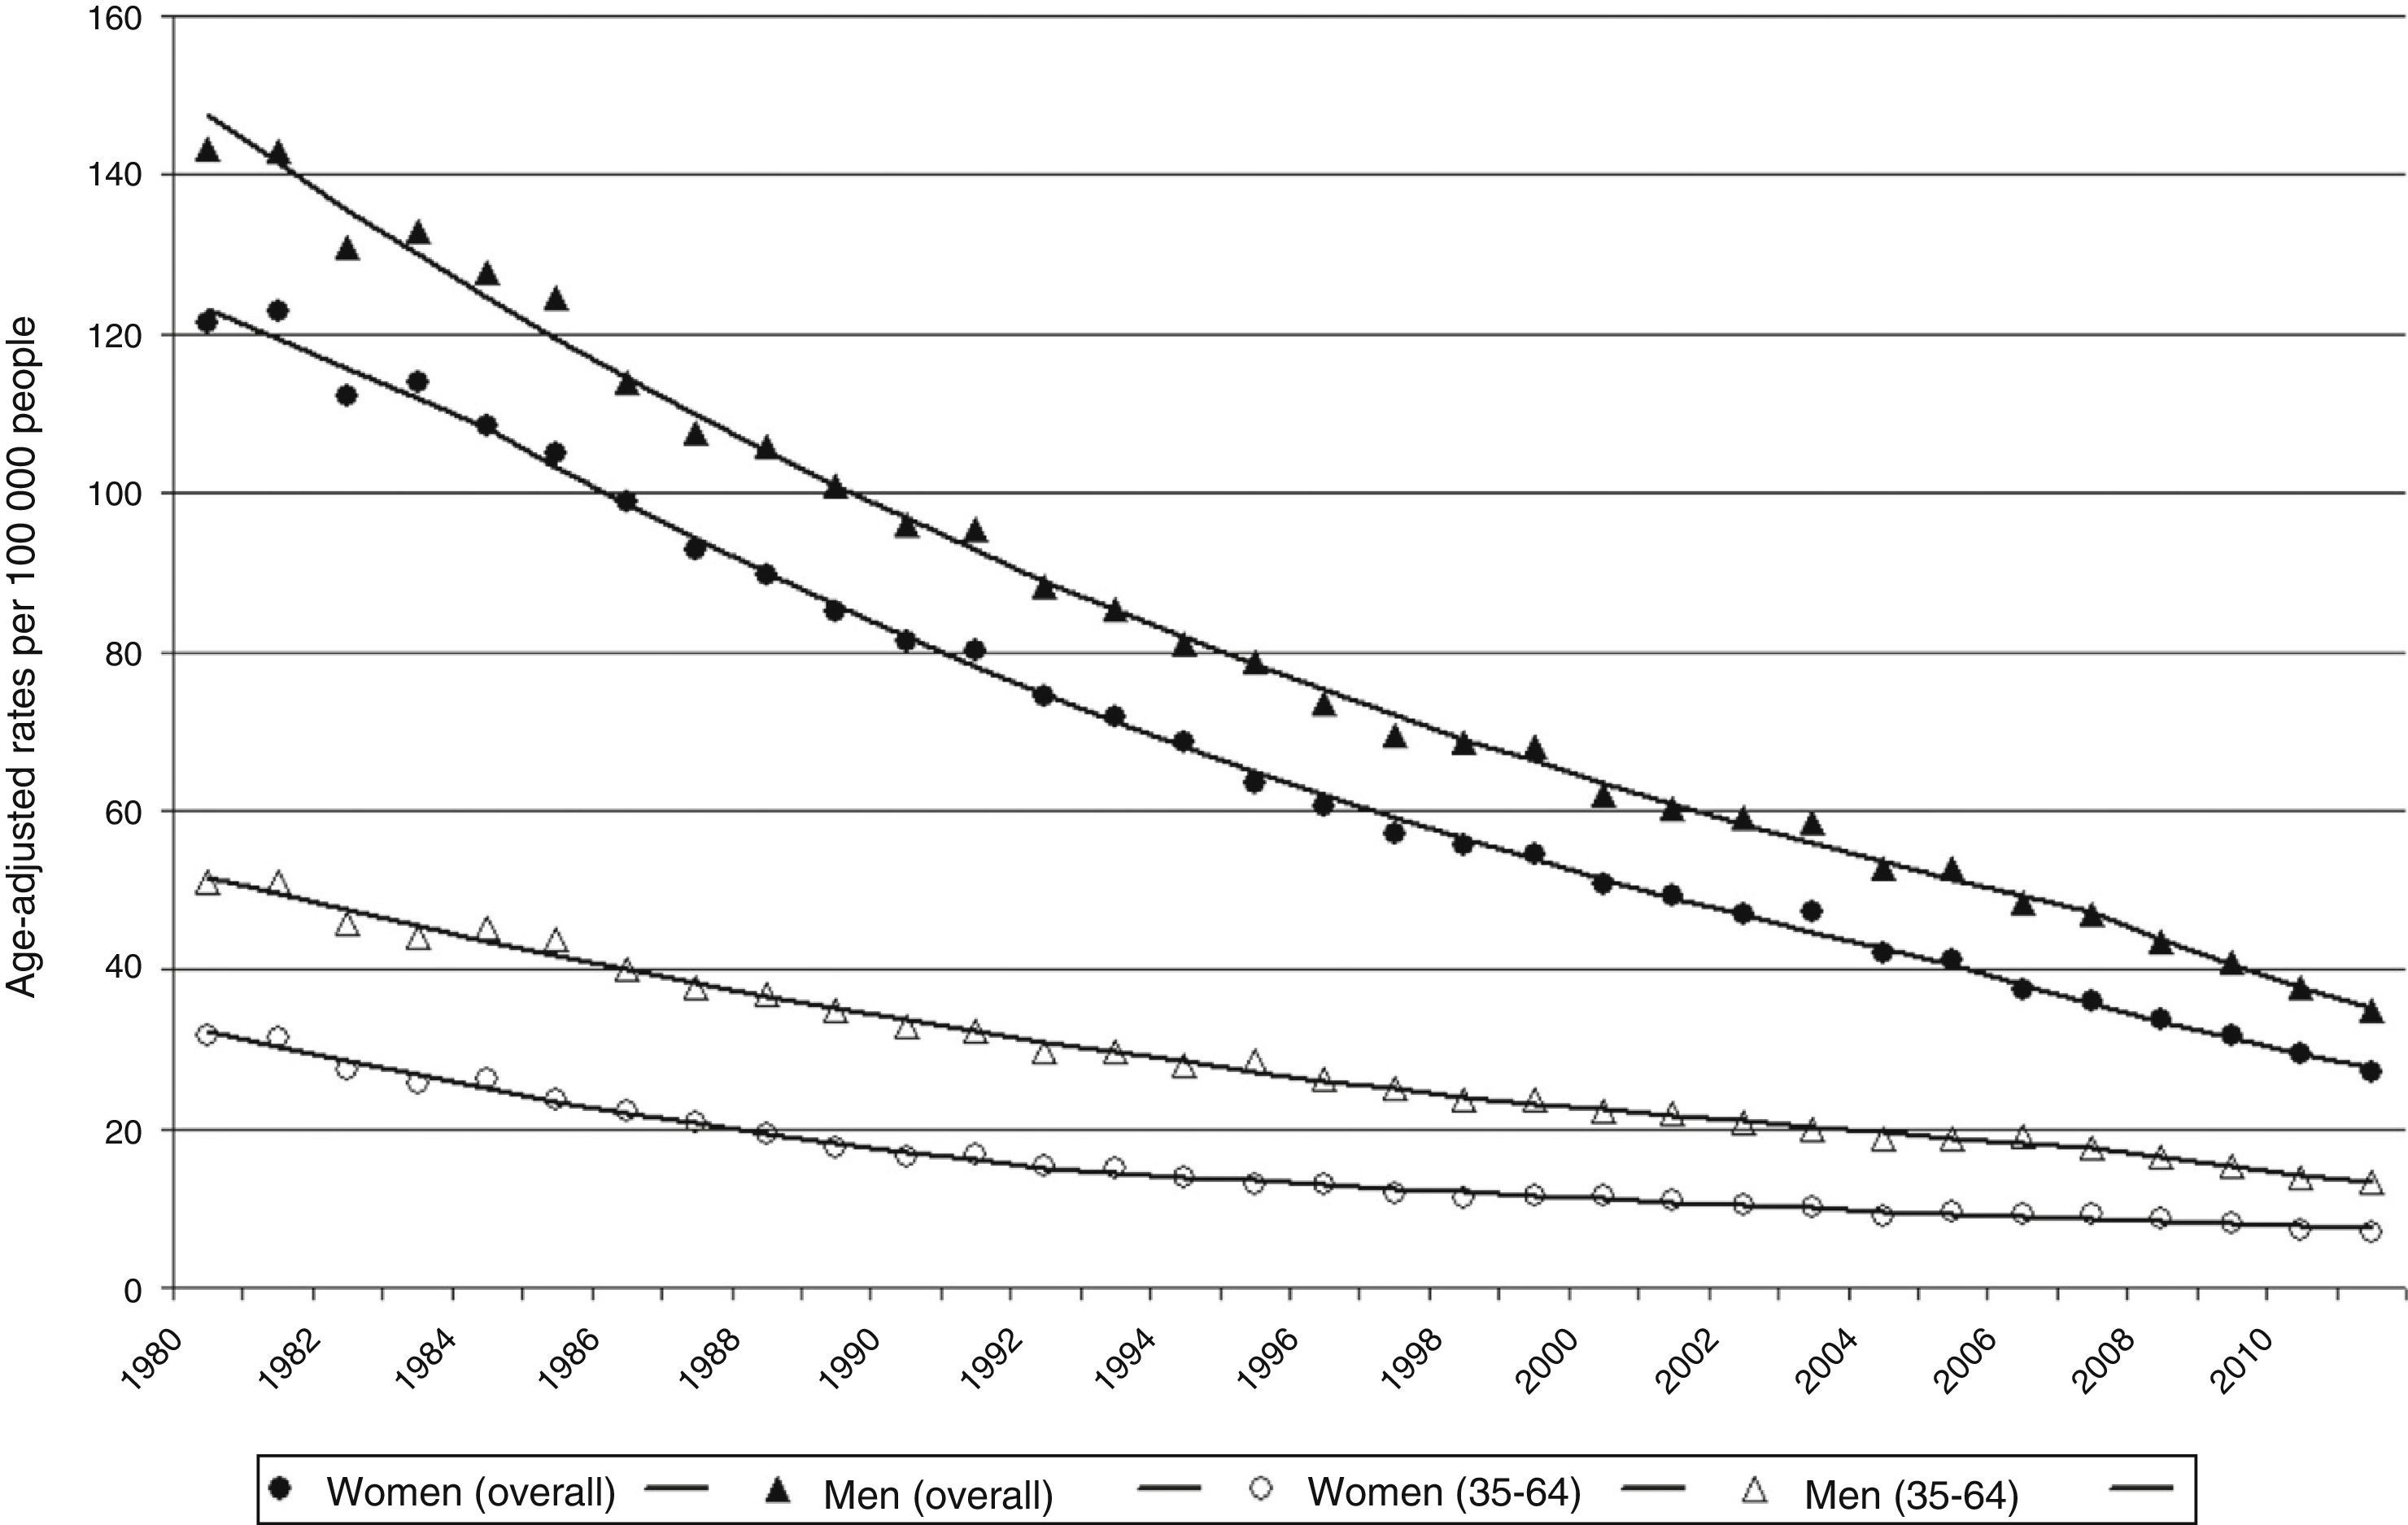
Fig. 4 shows age-adjusted CVD mortality rates (overall and truncated) and trends for both sexes analysed using joinpoint regression. The male/female ratio of overall standardised mortality rates evaluated employing joinpoint regression models changes only slightly (1.2-1.3) throughout the study period. Truncated age-standardised rates showed greater variations, ranging between 1.6 in 1980 and 2.1 in 2007.
 and trends for both sexes evaluated using joinpoint regression models.")
Adjusted CVD mortality rates show a marked and steady decrease in both men and women throughout the study period (Fig. 3 and Table 1). Overall age-adjusted CVD mortality rate in men changed from 143/100000 people in 1980 to 35/100000 people in 2011, with an APC of −4.3% (95% CI, −4.4% to −4.1%). The joinpoint analysis shows that this decrease was faster during the period between 2007 and 2011, in both overall rates (ACP: −7.2%; P<.05), and truncated rates (APC: −7%; P<.05) (Fig. 1 and Table 1).
Age-adjusted mortality rates in women are slightly lower than in men and do not show a parallel trend. During the study period, overall age-adjusted rates decreased an annual −4.6% (95% CI, −4.7% to −4.5%), from 121/100000 people in 1980 to 27/100000 people in 2011. The joinpoint regression analysis identified 3 periods in which rates decreased at a faster rate (1980-1984, APC: −3.2%; 1984-2005, APC: −4.5%; and 2005-2011, ACP: −6.3%). After a period of marked decrease (1980-1992, APC: −6.2%; P<.05), truncated age-standardised rates continued to decrease though at a lower speed (1992-2011, APC: −3.7%; P<.05).
Sex-specific mortality rates in men younger than 24 show a parallel trend to that of women of the same age, with an APC of −7.9% (95% CI, −8.6% to −7.2%) in the group younger than 15 years, and −5.7% (95% CI, −6.4% to −5.1%) in the 15-24 year group. The joinpoint analysis identified 3 periods; the second of which (1998-1994/1997) shows a markedly pronounced decrease: APC −15.6% (<15 years) and APC −10.6% (15-24 years).
Sex-specific rates in men older than 85 also show a parallel trend to those in women in the same age group, with an APC of −3.5% (95% CI, −3.7% to −3.4%). Again, the joinpoint analysis identified 3 periods: a first period (1980-1985) where rates remain stable, followed by 2 periods of significant decline (1985-2003, APC −3.2%, and 2003-2011, APC −5.8%).
Age-specific rates in 25-84 age groups distributed by sex did not follow a parallel trend pattern.
DiscussionAlthough the CVD mortality rate (age-standardised per 100000 people) has decreased worldwide over the last 20 years, the actual number of deaths related to this disease has increased by 26%.2
In 1980, CVD was the main leading cause of death in Spain (age-adjusted rate of 172 per 100000 people), and a frequent cause of death in developed countries.15 Despite the decrease observed in both sexes across all age groups, CVD is still an important cause of death, constituting the third leading cause after heart disease and lung cancer. This decline in mortality rates is accompanied by a reduction in the overall number of deaths (38% in women and 40% in men). It is important to understand the reasons for these decreases in order to better evaluate our achievements and focus our efforts on new challenges.
This decrease in stroke mortality has also been observed in other settings; in fact, stroke has now moved from the third to the fourth leading cause of death in the USA and this has been associated with a number of therapeutic interventions in a recent comprehensive study.16
In general terms, this decline in CVD mortality may be due to a decrease in incidence rates, increased survival of stroke patients, or a combination of both factors.
Incidence rates of CVD show marked spatial and temporal variations worldwide.17,18
The WHO predicts a 27% increase in stroke incidence rates between the years 2000 and 2025, taking into account population ageing. This, together with the decreases in stroke mortality rates, represents a significant socioeconomic challenge for the future, since prevalence and stroke-related disability will also increase.
Although CVD is an important public health problem, few incidence studies have been conducted in Spain and most of them analysed hospitalised patients. Population data is limited and very restricted geographically19; estimated incidence rates range between 132 and 202 cases per 100000 people per year for all ages.20–24
The NEDICES study shows a CVD prevalence adjusted to the standard European population of 4.9% in the elderly population (65 years or older) of central Spain.25
Discharge rates of stroke hospitalisations may be used, though with caution, as an estimation of incidence. Over the last 15 years, the number of CVD patients treated in Spanish National Health System hospitals has increased by 41.2% during the period 1997-2011 (2.6% per year). When considering reference populations (rates per 100000 people), this increase was somewhat more than half (21.3%) due to population growth. Hospital visits due to CVD have increased throughout the study period, with a mean annual increase of 1.4% until reaching 219 hospital discharges per 100000 people in 2010.26 This increase in hospital discharges does not necessarily represent an increase in incidence; rather, it may reflect better access to healthcare services, improved survival rates, or changes in healthcare patterns. In fact, one of the factors that coincides with the pronounced decrease in mortality registered from 2005 onwards is the implementation of numerous stroke units in different Spanish cities. The lower mortality rates and better functional outcomes observed in stroke units in comparison with conventional units reflects better adherence of stroke units to healthcare protocols.27 In addition, patients admitted to stroke units whose physiological parameters are continuously monitored present lower mortality rates28 and 2.5-times the likelihood of positive outcomes at discharge, as a result of early detection of complications and rapid therapeutic intervention before complications become symptomatic.
In addition, evidence suggests that a large quantity of CVD could be avoided.29 Knowledge of the modifiable risk factors and the availability of treatments for primary prevention has resulted in the drafting of clinical practice guidelines for treating patients at high risk.30 Several public health strategies aimed at gaining a deeper knowledge of the risk factors and promoting changes in population lifestyles (reducing salt intake, increasing fruit and vegetable consumption, maintaining a healthy weight, and engaging in physical exercise) have proven to be effective. For example, folate supplementation has been associated with a more marked decrease in stroke mortality in the USA and Canada.31
In Spain, there is little information on the prevalence and time trends of CVD risk factors. A recent study shows significant improvements in the control of hypertension in Spain (2002-2010), which could be at least in part related to an increased use of antihypertensive treatment, especially combination therapy.32 In contrast, the prevalence of obesity,33 diabetes,34 and tobacco consumption, especially in women,35 has increased.
Furthermore, new treatments, both for the acute phase (thrombolytic drugs) and for secondary prevention of new episodes (antiplatelets, anticoagulants, statins, endarterectomy), have reduced CVD mortality rates considerably.36–38 It is likely that reductions in the time from symptom onset to treatment initiation have significantly improved outcomes and reduced complications and mortality rates.39
This decrease observed in Spain may suggest that primary and secondary prevention measures, together with treatment, are responsible for the continuous improvement in mortality rates over the long term. The implementation of Spain's stroke care plan (2007) and the stroke strategy of the Spanish National Health System (2009) could be contributing to maintaining the pronounced decrease in mortality observed in the period 2005-2011.
A better understanding of this trend in CVD mortality in Spain may be achieved by studying incidence and fatality over time. Since we lack appropriate records, we cannot determine to what extent the decline in mortality was attributable to a decrease in incidence and fatality. Furthermore, rates may have decreased regardless of the decline in incidence if a significant number of patients recovered and subsequently died due to other causes.
Strengths and limitationsWe conducted a trend analysis of CVD mortality rates during a long period of time (32 years) by using joinpoint regression analysis, which can identify periods objectively. This avoids the need to pre-establish time periods, which may bias how trends are analysed.
The adoption of the tenth edition of the International Classification of Diseases is unlikely to have had an impact on CVD mortality rates, since this category is similar in the 2 editions used. Concordance between death certificates indicating stroke as the main cause of death and the reference cause of death determined by experts based on hospital reports is good.40,41 Furthermore, decreases in CVD mortality rates have also been observed in younger age groups, in which cause of death certification is more reliable.
In conclusion, our study shows a marked, steady decline in CVD mortality rates in Spain (1980-2011). Considering population ageing, the impact of CVD in terms of death, disability, and healthcare costs still poses a major challenge for preventive and healthcare policies. Our knowledge of the determinants of this decline is limited; therefore, more studies are needed. A better understanding of these determinants is essential for planning more efficient intervention strategies in order to maintain this trend in CVD mortality rates in Spain in the years to come.
Conflicts of interestThe authors have no conflicts of interest to declare.
Please cite this article as: Cayuela A, Cayuela L, Escudero-Martínez I, Rodríguez-Domínguez S, González A, Moniche F, et al. Análisis de las tendencias en la mortalidad por enfermedades cerebrovasculares en España 1980-2011. Neurología. 2016;31:370–378.
