


Creatinine is the most widely used renal failure biomarker; however, it has a lot of drawbacks. One of the major drawbacks is the blind range (does not increase until 50% of the kidney deteriorates). On the other hand, cystatin C has gained more attention as a promising biomarker due to several advantages over creatinine. Cystatin C levels are elevated as soon as any mild defect in the kidney occurs. Furthermore, cystatin C is influenced by several non-renal diseases which provide an additional prognostic value for this promising biomarker.
Objectives1. Study the effects of age, gender and smoking on cystatin C levels to. 2. Challenge the adoption of glomerular filtration rate equations for healthy population. 3. Compare the values generated from different glomerular filtration rate equations. 4. Evaluate the prognostic value of cystatin C for selected non-renal diseases.
MethodsUsing cross sectional analyses, we established the relationship between cystatin C levels and non-renal predictors. The quantification of cystatin C was performed by high performance liquid chromatographic method, while for creatinine by a colorimetric enzymatic method.
ResultsIn the healthy volunteers the levels of cystatin C were slightly higher in men than in women and in individuals older than 50 years old than those under 50 years old and in smokers than non-smokers, however, statistical data confirmed a non-significant relationship with respect to the aforementioned factors. For the recruited patients suffering from (diabetes, hyper- and hypothyroidism and cardiac dysfunctions) a clear increase in cystatin C levels were observed with the exception of hypothyroidism patients in which a decrease in their cystatin C levels were observed.
ConclusionDiabetes, thyroid and cardiac dysfunctions have a clear impact on the levels of cystatin C in human blood, whereas age, gender and smoking habit have no effect. Therefore, cystatin C could be considered as a useful biomarker of the aforementioned diseases, in turn, this requires extra precautions including the evaluation of several clinical conditions by physicians should CC is considered as a renal failure biomarker.
La creatinina es el biomarcador de la insuficiencia renal más utilizado; sin embargo, tiene muchos inconvenientes. Una de las principales desventajas es que los niveles no aumentan hasta que el 50% del riñón se deteriora. Por este motivo, la cistatina C ha ganado atención como biomarcador prometedor, los niveles de cistatina C se elevan tan pronto como aparece un defecto leve en el riñón, lo que permite una detección en estadios previos de deterioro. Además, la cistatina C está influenciada por varias enfermedades no renales que proporcionan un valor pronóstico adicional para este prometedor biomarcador.
Objetivos1. Estudio de los efectos de edad, género y tabaquismo en los niveles de cistatina C. 2. Verificación de la aplicabilidad de la ecuación de eGFR en poblaciones sanas. 3. Comparación de los valores de eGFR obtenidos mediante tres ecuaciones diferentes. 4. Evaluación de la utilidad de CC como biomarcador temprano de enfermedades diferentes a la insuficiencia renal como las disfunciones tiroidea y cardíaca y la diabetes.
MétodosUsando análisis transversales, establecimos la relación entre los niveles de cistatina C y los predictores no renales. La cuantificación de cistatina C se ha realizado mediante HPLC analítico, mientras que la creatinina se ha cuantificado mediante un método enzimático colorimétrico.
ResultadosEn los voluntarios sanos, los niveles de cistatina C fueron ligeramente más altos en hombres que en mujeres y en individuos mayores de 50 años que en menores de 50 años y en fumadores que en no fumadores; sin embargo, los datos estadísticos confirmaron una relación no significativa con respecto a los factores antes mencionados. Para los pacientes reclutados que padecen (diabetes, hiper e hipotiroidismo y disfunciones cardíacas) se observó un claro aumento en los niveles de cistatina C, con la excepción de los pacientes con hipotiroidismo, en los que se observó una disminución en sus niveles de cistatina C.
ConclusiónLas disfunciones tiroideas y cardíacas, así como la diabetes, tienen un impacto claro en los niveles de cistatina C en la sangre humana, mientras que la edad, el género y el tabaquismo tienen un efecto leve. Por lo tanto, cistatina C podría considerarse como un biomarcador de las enfermedades anteriormente citadas. A su vez, esto requiere precauciones adicionales, incluida la evaluación de varias condiciones clínicas por parte de los médicos si se considera que CC es un biomarcador renal.
Cystatin C (CC) is a cysteine protease inhibitor, positively charged, low molecular weight plasma protein, consists of 120 amino acids residues, freely filtered through the glomerulus.1–10 CC is also an early indicator of renal failure and superior to other markers, in which it changes before creatinine (Cr) becomes abnormal (Cr does not change until 50% of glomerular filtration rate (GFR) is reduced, or 50% of the kidney is damaged), accordingly, a therapeutic opportunity is going to be missed.2,4,11,12 It has been previously proved that CC does not depend on the non-renal factors such as (muscle mass, weight, gender, age).1,4,5,9,10,13–16 However, several studies have reported that some non-renal factors do have a clear impact on CC levels such as malignant diseases including metastatic melanoma, colorectal cancer, human immunodeficiency virus (HIV) infection, in vitro increase production of CC in presence of glucocorticoids, uncontrolled thyroid diseases,17–19 diabetes,2,13,20–22 and sepsis which is a systemic condition that cause both cardiac and renal dysfunction.23–27 Recent studies have highlighted the possibility of developing an acute kidney injury after cardiac surgery, which in turn necessitates the availability of ideal biomarker such as CC to quickly evaluate the situation CC.28
In this work, we investigated the effect of age and gender on CC levels, in addition, we sought to confirm the diagnostic ability of CC for the risk of selected dysfunctions (diabetes, hypo-/hyperthyroidism and cardiac dysfunctions), consequently, its prognostic ability with respect to Cr. Furthermore, utilizing our results, we compared the efficiency of the available estimated glomerular filtration rate (eGFR) equations (as an overall renal index) for all samples (healthy and pathological), also we challenged the validity of considering those equations as a diagnostic tool in healthy population. Statistical analysis was considered to investigate whether a relationship does present or not.
Due to several disadvantages of the available immunoassay methods; particle enhanced nephelometric immunoassay (PENIA),6 particle enhanced turbidimetric method (PET)29 and enzyme-amplified single radial immunodiffusion,30 a new high performance liquid chromatographic (HPLC) method has been developed and validated by our group and used for the quantification purpose of CC in human blood31 (inspired by the previously developed method for quantifying CC in human urine).32,33 It should be noted that, there are two HPLC-mass analytical methods for the determination of CC, however, one of them was only used for raw material34 and in the another one no real biological samples were introduced.35
Materials and methodsCC protein (>96%) was purchased from BBI Solutions (UK), HPLC grade acetonitrile, methanol, 1-hexane sulfonic acid sodium salt, trifluoroacetic acid (TFA), and acetone were purchased from Merck (Germany).
Sample selectionHealthy samples were divided according to age, gender and smoking habit. Accordingly, the statistical analyses were introduced for each group with respect to healthy control sample as follows: (different age intervals* within the same gender) were tested with respect to each other and likewise for (males and females within the same age intervals) and for (smokers and non-smoker within the same age and gender). The rest of pathological samples were divided with respect to the disease and compared with the healthy population of all samples.
*Age intervals: refer to categories under healthy samples section.
Blood samples collection and processingBlood samples from multiple patients with known history of certain diseases (renal failure, diabetes, thyroid and cardiac) were recruited from hospital into heparinized tubes and were kept cooled in an ice box.
Sample preparationBlood samples were centrifuged at (4400rpm, 4°C) for 5min. 2mL of supernatant plasma solution was withdrawn in a test tube and about 8mL of the acetone was added, then the resulting solution was mixed thoroughly by shaker for 20min, then centrifugation at (4400 rpm, 4°C) for 30min took place and the precipitate was dissolved in 4mL 0.05% TFA (v:v). Centrifugation was done at the same parameters for 30min and the supernatant was filtered through 0.45μm teflon filter prior to injection into the HPLC system.31
Chromatographic conditionsDionex HPLC system (Dionex, Germany) with a degasser, low pressure gradient pump, column oven, an autosampler, a UV detector was used. Data acquisition was performed with Chromeleon 7.2 SR2 software. A reversed phase Ace C8 (150×4.6mm i.d., 5μm) column (supported with a guard holder contains Ace 5 C8 100A guard cartridge) was placed in the column oven at 25°C. Mobile phase A of 0.01M 1-hexane sulfonic acid sodium salt in water plus 0.05% TFA, pH=2.4 filtered through 0.45μm teflon filter and mobile phase B (acetonitrile:methanol:mobile phase A) (300:300:225, v:v:v), pH=2.5 filtered through 0.45μm teflon filter, were pumped at a flow rate of 1.0mL/min and used for the elution of CC utilizing a gradient program. Before each run, the column was equilibrated with 65% of mobile phase B for 3min. The gradient was increased gradually to 80% in 3min and then to 100% in 5min lasted 2min to complete the separation. Then, the gradient was decreased to initial conditions 65% in 0.5min. At 14min, the HPLC system is ready for the next injection. The injection volume was 100μL. The eluent was monitored at 224nm (for detailed validation tests refer to our previous published work).31
Statistical workIBM SPSS statistics software (version 1.0.0.1012) was utilized to perform all the statistical analysis.
As the distributional assumptions could not be made; a non-parametric test (Mann–Whitney test) was used to evaluate the data (Supplemental data (Supplemental Tables 1–9).
Ethics statementThe study was approved by the institutional review board of King Fahad Medical City, Riyadh, Kingdom of Saudi Arabia (IRB review No. 17-051E, Category: Exempt).
Implied consent has been obtained from each volunteer.
Results and discussionHealthy samples16 healthy volunteers were divided into three categories, each category has two groups: i. non-smoker males with age ≥ and <50 years old, ii. Non-smoker females with age ≥ and <50 years old iii. Non-smoker males and females with age ≥50 years old, iv. Non-smoker males and females with age <50 years old, v. Smoker and non-smoker males with age <50 years old.
Slightly higher CC levels were observed in the subjects of ages ≥50 over those less than 50 (Supplemental Tables 1: a-c and 2: a-c), and it was more pronounced in males over females (Supplemental Tables 3: a-d) as well as in smokers over non-smokers (Supplemental Tables 4: a-c). The averages of each group were as follows: i. (1.41 and 1.11) mg/L CC, ii. (1.18 and 0.74) mg/L CC, iii. (1.15 and 1.00) mg/L CC. iv. (1.46 and 1.07) mg/L CC. However, by referring to the statistical data it was confirmed that those differences did not achieve the threshold of rejecting the null hypothesis, in which, the obtained p values for each category were (i. 0.400, ii. 0.667, iii. 1.000, iv. 0.178, v. 0.244), consequently, the aforementioned data have confirmed a non-significant relationship between each category and CC levels. As a conclusion our work is in line with the studies that support the independency of CC on age, gender and smoking habit.36,37
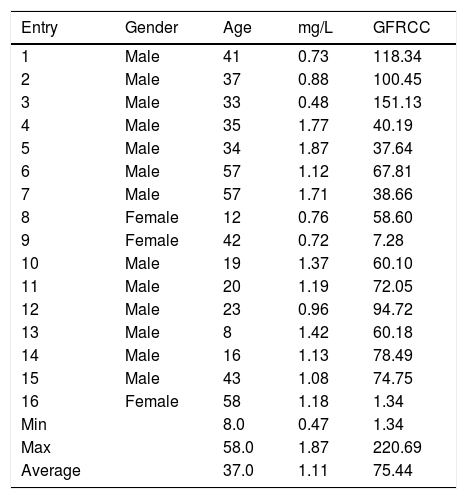
GFR is essential for diagnosing, staging, and management of chronic kidney disease (CKD), however, more studies need to be carried out to check the validity of the equations – in use – for non-CKD as well as healthy subjects. Bearing in mind that, such equations were initially derived based on the data acquired from CKD patients. eGFR values for healthy population utilizing those equations sometimes underestimates GFR, and consequently result in false positive data. For example, in (Table 1, entry 7) CC level of 1.71mg/L showed an eGFR value of 38.66mL/min, which is classified as a stage 3 kidney failure! Such underestimation can also be noticed in many of healthy samples that have been analyzed (Table 1, entries 4–11, 13, 15 and 16). As of yet, we can conclude that if the CKD – eGFR equations are used to calculate eGFR for the non-CKD patients, underestimated eGFR values (<80mL/min) are apparently expected (despite the normal levels of CC) as mentioned by Mussap et al., Shlipak et al., and Johnson et al.2,9,38 Same observations were noticed by Machado et al. when they introduced healthy and diabetes patients to those equations.39
CC levels and eGFRCC for healthy samples.
| Entry | Gender | Age | mg/L | GFRCC |
|---|---|---|---|---|
| 1 | Male | 41 | 0.73 | 118.34 |
| 2 | Male | 37 | 0.88 | 100.45 |
| 3 | Male | 33 | 0.48 | 151.13 |
| 4 | Male | 35 | 1.77 | 40.19 |
| 5 | Male | 34 | 1.87 | 37.64 |
| 6 | Male | 57 | 1.12 | 67.81 |
| 7 | Male | 57 | 1.71 | 38.66 |
| 8 | Female | 12 | 0.76 | 58.60 |
| 9 | Female | 42 | 0.72 | 7.28 |
| 10 | Male | 19 | 1.37 | 60.10 |
| 11 | Male | 20 | 1.19 | 72.05 |
| 12 | Male | 23 | 0.96 | 94.72 |
| 13 | Male | 8 | 1.42 | 60.18 |
| 14 | Male | 16 | 1.13 | 78.49 |
| 15 | Male | 43 | 1.08 | 74.75 |
| 16 | Female | 58 | 1.18 | 1.34 |
| Min | 8.0 | 0.47 | 1.34 | |
| Max | 58.0 | 1.87 | 220.69 | |
| Average | 37.0 | 1.11 | 75.44 |
Refer to Table 2 for eGFR equations.
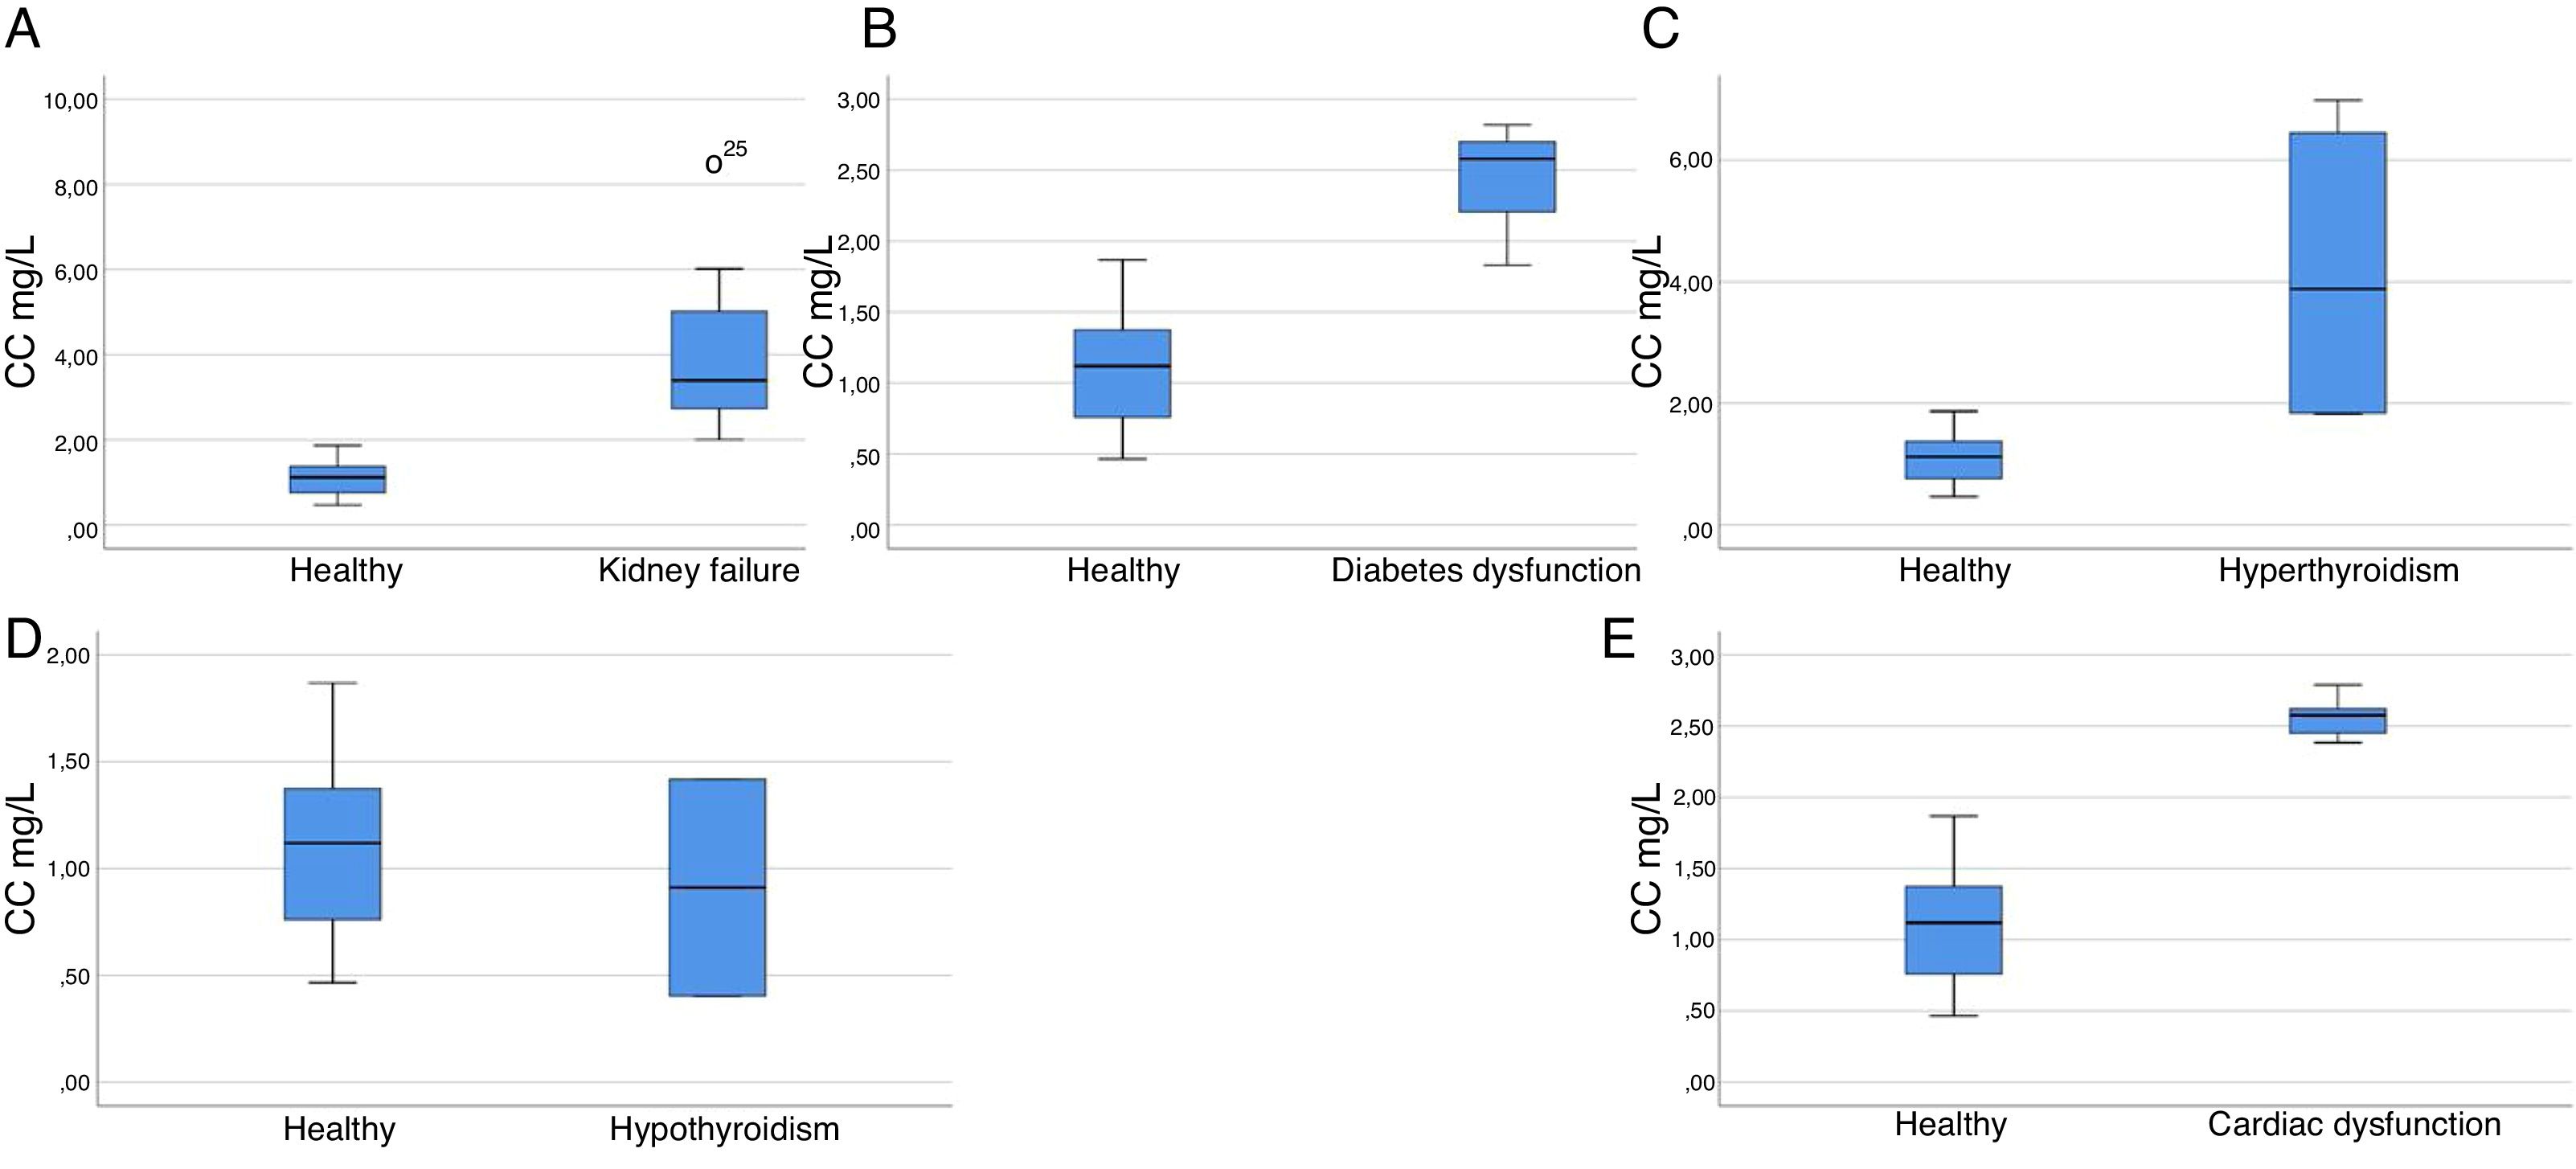
27 CKD patients (13 female and 14 male) with an age interval of (13–85) years old were included in the study. Obvious increase in CC and Cr levels has been observed (2.00–8.48 with an average of 3.97, normal 0.47–1.87) mg/L and (1.46–6.83 with an average of 3.42, normal 0.84–1.21) mg/dL, respectively. Concurrently, a reduction in their eGFR values were also observed (8.94–52.58 with an average 21.95, 0.04–34.71 with an average 9.58 and 8.80–32.65 with an average 16.42) mL/min, utilizing eGFRCr, eGFRCC, and eGFRCr – CC formula, respectively). Statistical data of CC levels in the kidney failure patients versus healthy subjects showed a significant relationship (p<0.001) (Fig. 1) (Supplementary Tables 5: a and b).
 CC levels in kidney failure patients vs. healthy volunteers: 27 samples (p<0.001, Z=−5.532), highly significant relationships, reject null hypothesis. (B) CC levels in diabetic patients vs. healthy volunteers: 3 samples (p=0.004, Z=−2.593), highly significant relationships, reject null hypothesis. (C) CC levels in hyperthyroidism patients vs. healthy volunteers: 4 samples (p=0.001, Z=−2.866), highly significant relationships, reject null hypothesis. (D) CC levels in hypothyroidism vs. healthy volunteers: 2 samples (p=0.655, Z=−0.531), non-significant relationships, retain null hypothesis. (E) CC levels in cardiac patients vs. healthy volunteers: 5 samples (p<0.001, Z=−3.330), highly significant relationships, reject null hypothesis.")
Box plot graph of CC levels in various diseases vs. healthy volunteers. (A) CC levels in kidney failure patients vs. healthy volunteers: 27 samples (p<0.001, Z=−5.532), highly significant relationships, reject null hypothesis. (B) CC levels in diabetic patients vs. healthy volunteers: 3 samples (p=0.004, Z=−2.593), highly significant relationships, reject null hypothesis. (C) CC levels in hyperthyroidism patients vs. healthy volunteers: 4 samples (p=0.001, Z=−2.866), highly significant relationships, reject null hypothesis. (D) CC levels in hypothyroidism vs. healthy volunteers: 2 samples (p=0.655, Z=−0.531), non-significant relationships, retain null hypothesis. (E) CC levels in cardiac patients vs. healthy volunteers: 5 samples (p<0.001, Z=−3.330), highly significant relationships, reject null hypothesis.
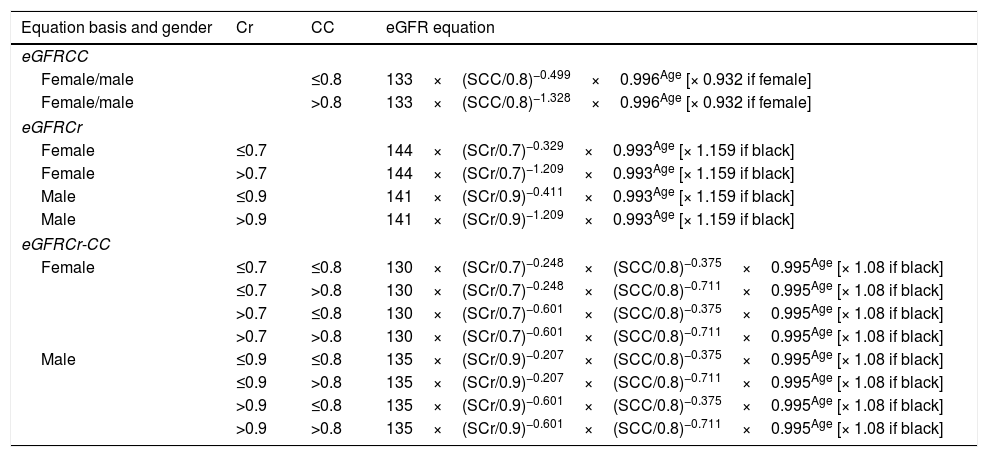
GFR values have been established using the equations stated by Inker et al.40 (Table 2). Its been reported by the national kidney foundation that an eGFR equation that uses both serums Cr and CC with age, sex and race is better than equations that use either of these two serum markers.40,41 Many studies have proved the superiority of CC marker and its more adequacy and accuracy in estimating eGFR than Cr,14,42 moreover, it has been reported by Gharaibeh et al. that CC is able to detect the renal recovery earlier than Cr.42 The obtained eGFR values proved the superiority of CC as a renal failure biomarker which is ascribed to its early prediction in response to any mild defect in renal functions. The overall relationship between the reciprocal level of CC and GFRCC-Cr values was stronger than that in case of Cr (r2=0.522 and 0.370, respectively). Utilizing Cr equation to calculate GFR might underestimate the severity of CKD stage! For example, Supplementary Table 5a, entry 6 with an eGFRCr value of (30.62mL/min) will be classified under stage 3 (Moderate GFR decrease), however, it must be classified under stage 4 (Severe GFR decrease) based on eGFRCC and eGFRCr-CC values (17.58 and 21.80) mL/min, respectively. Nevertheless, in some cases, there might be no major differences in the final calculated eGFR values using any of these equations and this is clear in Supplementary Table 5 a, entries 3 and 7, in which, the obtained eGFR values were (10.51, 8.74, 8.8) and (30.62, 34.71, 31.38) mL/min, (eGFRCr, eGFR CC, eGFRCr-CC, respectively). Statistical analyses showed significant differences between those equations (GFR CC to GFR Cr–CC), (GFR Cr to GFRCr–CC) (GFRCr–GFRCC) in CKD patients, p=0.008, 0.046 and <0.001, respectively. Although, significant relationships were observed for eGFR of both serums in comparison to the reference eGFRCr-CC equation, but a higher significance was for CC (p=0.008) and (p=0.046) for Cr, such closeness from the recommended formula (that utilizes both serums) is considered as an advantage for CC over Cr as prognostic biomarker. Same observation was also reported by Wasén et al. and Stevens et al.3,41 As a conclusion, in order to minimize the errors in the final eGFR value; we recommend considering the equation that utilizes both serums (Supplementary Tables 5: c-e).
eGFR equations.
| Equation basis and gender | Cr | CC | eGFR equation |
|---|---|---|---|
| eGFRCC | |||
| Female/male | ≤0.8 | 133×(SCC/0.8)−0.499×0.996Age [× 0.932 if female] | |
| Female/male | >0.8 | 133×(SCC/0.8)−1.328×0.996Age [× 0.932 if female] | |
| eGFRCr | |||
| Female | ≤0.7 | 144×(SCr/0.7)−0.329×0.993Age [× 1.159 if black] | |
| Female | >0.7 | 144×(SCr/0.7)−1.209×0.993Age [× 1.159 if black] | |
| Male | ≤0.9 | 141×(SCr/0.9)−0.411×0.993Age [× 1.159 if black] | |
| Male | >0.9 | 141×(SCr/0.9)−1.209×0.993Age [× 1.159 if black] | |
| eGFRCr-CC | |||
| Female | ≤0.7 | ≤0.8 | 130×(SCr/0.7)−0.248×(SCC/0.8)−0.375×0.995Age [× 1.08 if black] |
| ≤0.7 | >0.8 | 130×(SCr/0.7)−0.248×(SCC/0.8)−0.711×0.995Age [× 1.08 if black] | |
| >0.7 | ≤0.8 | 130×(SCr/0.7)−0.601×(SCC/0.8)−0.375×0.995Age [× 1.08 if black] | |
| >0.7 | >0.8 | 130×(SCr/0.7)−0.601×(SCC/0.8)−0.711×0.995Age [× 1.08 if black] | |
| Male | ≤0.9 | ≤0.8 | 135×(SCr/0.9)−0.207×(SCC/0.8)−0.375×0.995Age [× 1.08 if black] |
| ≤0.9 | >0.8 | 135×(SCr/0.9)−0.207×(SCC/0.8)−0.711×0.995Age [× 1.08 if black] | |
| >0.9 | ≤0.8 | 135×(SCr/0.9)−0.601×(SCC/0.8)−0.375×0.995Age [× 1.08 if black] | |
| >0.9 | >0.8 | 135×(SCr/0.9)−0.601×(SCC/0.8)−0.711×0.995Age [× 1.08 if black] | |
Inker et al.40
3 female patients with diabetes dysfunction with an age interval of (21–58) years were included in the study. An elevated CC levels were observed (1.83–2.82 with an average of 2.41, normal 0.47–1.87) mg/L. However, those patients have no recorded problems in their kidneys in addition to their normal Cr levels (0.49–0.84 with an average of 0.71, normal 0.84–1.21) mg/dL. Statistical data confirmed a highly significant relationship for the increased levels of CC in diabetic subjects, p=0.004 (Fig. 1) (Supplementary Tables 6: a and b). Based on the obtained data, CC is could be a promising biomarker to evaluate the involvement of diabetes in the renal failure as also shown by previous studies.
Thyroid patientsThyroid dysfunction was proved to have a direct influence on CC levels. In which, elevated CC levels were observed in hyperthyroidism patients, and a reduction in hypothyroidism patients.18,19 To validate those studies, 9 patients with thyroid hypothyroidism and hyperthyroidism dysfunctions (6 females and 1 male) with an age interval of (28–61) years were included in the study. An observed increase in CC levels was observed in hyperthyroidism cases (1.83–6.98 with an average of 4.14, normal 0.47–1.87) mg/L, however, these patients do not have any recorded problem in their kidneys based on their Cr results (for some of them based on their history as we do not have their Cr results). From the statistical data, a significant relationship has been confirmed for the increased levels of CC in the hyperthyroidism subjects (p=0.001) (Fig. 1) (Supplementary Tables 7: a and b). On the other hand, a decrease in CC levels was observed in hypothyroidism cases (0.40–1.42 with an average of 0.91, normal 0.47–1.87) mg/L, furthermore, CC levels in 3 samples were even below the detection limit of the method (Supplementary Table 8 a, entries 2-4).31 However, no significant relationship was observed in the hypothyroidism data (p=0.655) (Fig. 1) (Supplementary Tables 8: a and b); thus the null hypothesis could not be rejected. Apparently, such observation could be ascribed to the fact that the obtained CC levels in those hypothyroidism patients fall in the healthy range. Nevertheless, we still have a strong evidence that CC levels are depleted in hypothyroidism patients, in which, we had 3 samples with very low CC levels with respect to the normal range. As a conclusion we confirmed that CC levels are influenced in the case of thyroid dysfunction, so CC can be play a significant role in predicting thyroid dysfunctions as well, in turn, thyroid functions need to be considered when using CC as a renal failure biomarker.
Cardiac patients5 patients with cardiac dysfunction (1 female and 4 males) with an age interval of (23–60) years were included in the study; those patients have a history of elevated rates of lactate dehydrogenase (LDH) as well as creatine kinase-muscle/brain (CK-MB) markers. An observed increase in their CC levels was observed (2.38–2.62 with an average of 2.51, normal 0.47–1.87) mg/L. However, those patients have no recorded problems in their kidneys as can be observed from their normal Cr levels (0.83–1.02 with an average of 0.95, normal 0.84–1.21) mg/dL. Statistical data confirmed a significant relationship for the increased levels of CC in cardiac dysfunction subjects, p<0.001 (Fig. 1) (Supplementary Tables 9: a and b). Accordingly, we proved that CC is significantly affected in patients with cardiac abnormalities, consequently, CC can be considered as a marker for cardiovascular disease as well, the same conclusion was also stated by O’Neal et al.28
ConclusionSeveral studies have suggested the relationship between CC and other non-renal factors such as age, gender, smoking, etc. In our results we confirmed that CC is independent of those factors. However, it is worth mentioning that, additional studies with larger subjects is needed. Based on the data obtained from the comparison study among the three eGFR equations, we recommend using the equation that utilizes both markers (as also recommended by the national kidney foundation). Superiority of CC as a marker of kidney failure has been confirmed. Furthermore, we have proved the effectiveness of CC as a good biomarker of other diseases like (diabetes, thyroid, and cardiac) dysfunctions, as a clear effect on CC levels in the human blood was observed in those situations. However, this necessitates the evaluation of several health conditions by physicians in case of considering CC as a renal failure biomarker. Two main limitations of our study must be pointed out: (i) the small number of recruited samples, thus the non-parametric statistics were considered. (ii) all the analyzed samples were and the same population from the same region, so our findings might not be applicable to other populations, however, our data were comparable with several previously published studies.
Finally, based on the depicted advantages of CC in this work and elsewhere; is to be hoped that the near clinical and medical future will be more focused towards CC as a principal biomarker of renal failure rather than Cr and also of other diseases (included in this work), furthermore, we hope that the studies/investigations will continue, hence helping people to survive and having a healthy life.
Clinical perspectivesDifferent research groups have emphasized on the validity of CC as a promising renal failure biomarker, in contrast to Cr, CC does not suffer from blind range (major drawback of Cr), accordingly, CC is highly recommended as a first choice for evaluating kidney functions.
CC is an ideal biomarker of renal failure, however, several non-renal diseases (investigated in this study and previously) have a clear impact on its levels, accordingly, physicians must keep an eye on those diseases should CC is considered as renal failure biomarker.
Confidentiality of dataThe authors declare that they have followed the protocols of their work center on the publication of patient data.
Conflict of interestThe authors declare no competing financial interest.
All authors have contributed equally to this work.
This work was completely funded by “King Abdul Aziz City for Science and Technology (KACST)” “Grant# SP – 36-16”. Cordial thank to the University of Hail for their support. Special thanks to “King Fahd Medical City”, “King Khalid General Hospital”, and “Salamat Hospital”. The authors would like also to express gratitude toward Professor Beatriz G. de la Torre for her appreciated contribution in providing the Spanish part of this article.
The following are the supplementary data to this article:
