

The Non-obese diabetic (NOD) mice exhibit a susceptibility to spontaneous development of autoimmune diabetes and is the most widely used experimental model for the study of the disease. The NOD strain was established by inbreeding in 1980. This model has a MHC-matched diabetes resistant homologous, NOR/Lt mice, an insulitis-resistant and diabetes-free strain produced from an isolated genetic contamination within a NOD/Lt line. To evaluate the role of transgenes, transgenic mice can be generated in CD-1 mice for technical advantages and then backcrossed to inbred strains. To obtain transgenic mice in NOD or NOR background starting from CD-1, at least 20 backcrosses are required, spending more than two years in the process.
Nucleotide repeats (microsatellites) mapped to specific locations on each chromosome are used to evaluate genomic polymorphism. From 23 microsatellites we selected eleven that were variant in PCR amplimer size between CD-1 colony and NOD or NOR strains. We used these microsatellites to identify individuals that were used for backcrossing, thus accelerating the acquisition of a new genetic background. Results yield a defined analysis of the genome in question and profiles were compared to detect genetic variation among individuals. After the selection of mice for backcrossing at the third generation, the 11 specific markers were acquired at the 5th generation and maintained to the 10th generation. Diabetes incidence and insulitis score correlated with the acquisition of genetic background, demonstrating that using this strategy, 5–6 crosses are enough to obtain the genotype of interest, shortening the process in more than one year and a half.
Los ratones diabéticos no obesos (NOD) presentan susceptibilidad al desarrollo espontáneo de diabetes autoinmunitaria y son el modelo experimental más utilizado para el estudio de la enfermedad. La cepa NOD fue establecida por endogamia en 1980. Este modelo tiene un homólogo resistente a la diabetes con MHC compatible, el ratón NOR/Lt, una cepa sin diabetes y que no desarrolla insulitis producida a partir de una contaminación genética aislada en una línea de NOD/Lt. Para evaluar la función de los transgenes, los ratones transgénicos pueden generarse en ratones CD1 por sus ventajas técnicas y luego cruzarse con cepas consanguíneas. Para obtener ratones transgénicos con genotipo NOD o NOR a partir de CD1, se requieren como mínimo 20 retrocruzamientos, lo que supone un proceso de más de dos años.
Las repeticiones de nucleótidos (microsatélites) identificadas en localizaciones específicas de cada cromosoma se utilizan para evaluar el polimorfismo genómico. De 23 microsatélites, seleccionamos 11 con tamaños de amplímero de PCR divergentes entre la colonia de CD1 y las cepas NOD o NOR. Utilizamos estos microsatélites para identificar individuos que se utilizaron para los retrocruzamientos, con lo que se aceleró la adquisición de unos nuevos genotipos. Los resultados produjeron un análisis definido del genoma en cuestión y se compararon los perfiles para detectar variaciones genéticas entre los individuos. Tras la selección de ratones para llevar a cabo el retrocruzamiento en la tercera generación, los 11 marcadores específicos se adquirieron en la 5.ª generación y se mantuvieron hasta la 10.ª generación. La puntuación de insulitis e incidencia de diabetes se correlacionó con la adquisición de genotipos, lo que demostró que mediante esta estrategia bastaban 5–6 retrocruzamientos para obtener el genotipo de interés, reduciendo así el proceso en más de un año y medio.
Type 1 diabetes (T1D) is an autoimmune disease caused by the selective destruction of pancreatic beta cells 1. Genetic factors of susceptibility are important for the development of the disease as there is a strong association with specific alleles of MHC class II genes, in human, HLA-DR and HLA-DQ 2. Due to the lack of access to the human pancreas, most of the research in diabetes is being done in animal models of the disease 3, including induced, spontaneous and transgenic models. The most widely used spontaneous model for the study of autoimmune diabetes is the Non Obese Diabetic mice (NOD) 4. This model has a MHC-matched diabetes resistant homologous: NOR/Lt is an insulitis-resistant and diabetes-free strain produced from an isolated genetic contamination within a NOD/Lt pedigree line 5.
Production of fertilized oocytes and generation of transgenic mice is generally more efficient using hybrid embryos than embryos from inbred mice. Due to its good reproductive performance and fast growth rate, the CD-1 (ICR) outbred model is often used as an embryo donor and/or recipient mother in transgenic mouse labs. Then, to obtain transgenic mice in NOD or NOR background starting from CD-1, at least 20 backcrosses are required, taking approximately two year and a half. In this case, genetic monitoring is an essential component of mouse colony management.
Here we provide evidence of the acceleration of NOD and NOR genetic background acquisition by means of the analysis of a panel of diabetes susceptibility related microsatellites and the selection of the individuals with more markers inherited for backcrossing. Using this strategy, 5–6 backcrosses are enough to obtain the genotype of interest, shortening the process in one year and a half.
Materials and methodsMiceTransgenic mice expressing human IFN-beta under the control of the rat insulin I promoter 6 in outbred albino CD-1 background (RIP-HuIFN-beta) were generated at the Universitat Autónoma de Barcelona 7. Non obese diabetic (NOD) and Non Obese non diabetic resistant (NOR) mice were obtained from The Jackson Laboratory (Bar Harbor, Maine). Mice housed in the Germans Trias i Pujol facility were maintained under specific pathogen free conditions (kept at 20–22°C, 60–70 % humidity under a light–dark cycle of 12 hours) and allowed free access to irradiated food (Charles River, Barcelona, Spain) and water. The Catalan Government's guidelines for the use and care of laboratory animals were followed and the protocols were approved by our Institutional Animal Care and Use Committee. For the generation of RIP-HuIFN-beta NOD and RIP-HuIFN-beta NOR, the RIP-HuIFN-beta CD-1 mice were backcrossed a minimum of 5 times onto the NOD or NOR background.
Detection of the transgeneThe presence of the transgene was determined by performing a standard PCR with genomic DNA obtained from mice tails using standard methods as described 8. Briefly, an aliquot of 200ng of genomic DNA was amplified using specific primers to human IFN-beta: Hu-IFN-beta sense, 5’-TCACCAGGGGAAAACTC-3’ and Hu-IFN-beta antisense, 5’-CAGTCACTTAAACAGCATCT-3’ in 10mM Tris-Cl (pH 8.8), 50mM KCl, 1.5mM MgCl2, 0.1 % Triton X-100, 1mM of each dNTPs, 1mM of each primer and 1,25 U Thermus aquaticus DNA polymerase (Promega, Madison, WI). The PCR products were resolved by 2 % agarose gel and ethidium bromide staining.
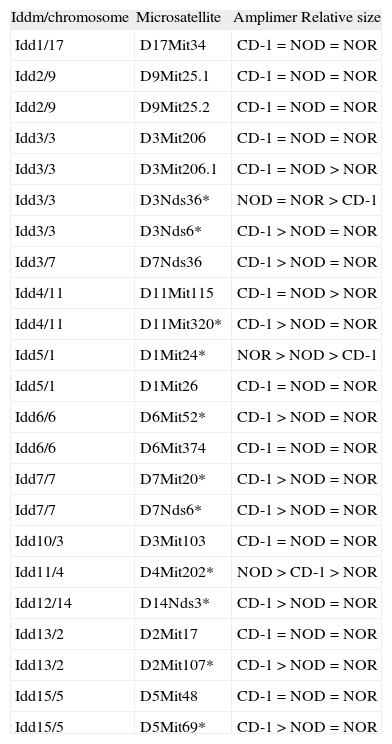
Genotyping: microsatellite analysis and mice selectionA set of 23 markers for microsatellite distributed along the 20 mouse chromosomes was screened by PCR with genomic DNA obtained from mice tails to determine the markers with differences in amplimer size between CD-1 colony and NOD or NOR strain (table 1). PCR was performed by incubating 200ng of DNA with 10mM Tris-Cl (pH 8.8), 50mM KCl, 1.5mM MgCl2, 0.1 % Triton X-100, 1mM of each dNTPs, 1mM of each primer and 1,25 U Thermus aquaticus DNA polymerase (Promega, Madison, WI). The primers were obtained from www.informatics.jax.org and purchased from Sigma (St. Louis, MO). PCR products -between 100 and 250 pb- were electrophoresed in 4 % agarose gel during 3 hours. The markers giving differences on size in different strains were selected for analysis.
List of microsatellite markers used to improve the efficiency of the backcrosses. Microsatellites selected for the analysis are marked with an asterisk (*)
| Iddm/chromosome | Microsatellite | Amplimer Relative size |
| Idd1/17 | D17Mit34 | CD-1=NOD=NOR |
| Idd2/9 | D9Mit25.1 | CD-1=NOD=NOR |
| Idd2/9 | D9Mit25.2 | CD-1=NOD=NOR |
| Idd3/3 | D3Mit206 | CD-1=NOD=NOR |
| Idd3/3 | D3Mit206.1 | CD-1=NOD>NOR |
| Idd3/3 | D3Nds36* | NOD=NOR>CD-1 |
| Idd3/3 | D3Nds6* | CD-1>NOD=NOR |
| Idd3/7 | D7Nds36 | CD-1>NOD=NOR |
| Idd4/11 | D11Mit115 | CD-1=NOD>NOR |
| Idd4/11 | D11Mit320* | CD-1>NOD=NOR |
| Idd5/1 | D1Mit24* | NOR>NOD>CD-1 |
| Idd5/1 | D1Mit26 | CD-1=NOD=NOR |
| Idd6/6 | D6Mit52* | CD-1>NOD=NOR |
| Idd6/6 | D6Mit374 | CD-1=NOD=NOR |
| Idd7/7 | D7Mit20* | CD-1>NOD=NOR |
| Idd7/7 | D7Nds6* | CD-1>NOD=NOR |
| Idd10/3 | D3Mit103 | CD-1=NOD=NOR |
| Idd11/4 | D4Mit202* | NOD>CD-1>NOR |
| Idd12/14 | D14Nds3* | CD-1>NOD=NOR |
| Idd13/2 | D2Mit17 | CD-1=NOD=NOR |
| Idd13/2 | D2Mit107* | CD-1>NOD=NOR |
| Idd15/5 | D5Mit48 | CD-1=NOD=NOR |
| Idd15/5 | D5Mit69* | CD-1>NOD=NOR |
To improve the efficiency of the backcross, genotyping for the microsatellite markers linked to diabetes susceptibility loci (Idd1 to Idd15) 9 was performed on genomic DNA from mice from the third to the eight generation as previously described 10,11, using the selected primers specific for 11 different loci that are polymorphic between NOD/NOR and CD-1: D3Nds36, D3Nds6, D11Mit320, D1Mit24, D6Mit52, D7Mit20, D7Nds6, D4Mit202, D14Nds3, D2Mit107 and D5Mit69 (table 1). Markers chosen were evenly spaced across the genome. PCR products were electrophoresed in 4 % agarose gel for 3 hours. Breeder mice shown to be homozygous for Idd NOD or NOR-derived alleles (including Idd1 for H-2g7) were selected.
Assessment of diabetesStarting at 21 days of age, mice were monitored daily for glycosuria using urine test strips. Blood glucose was measured (Glucocard, Menarini, Barcelona, Spain) and mice were considered diabetic after two consecutive determinations of glycaemia over 300mg/dl.
Insulitis developmentPancreases from mice were used to determine insulitis development. Glands were snap frozen in an isopentane/cold acetone bath and stored at −70°. 5mm cryostat sections were performed at five no overlapping levels. The sections were stained with haematoxylin and eosin. Six mice of each group were analyzed at six and twelve weeks of age assessing aproximately 40 islets per animal. Insulitis was scored on a 0–4 scale as described 12.
Statistical analysisStatistical analyses between results obtained from various groups of mice were performed with SPSS 9.0 software using the Mann–Whitney U test. A value of P<0.05 was taken as indication of significance. In addition, when needed, results were analyzed using the Student's t test.
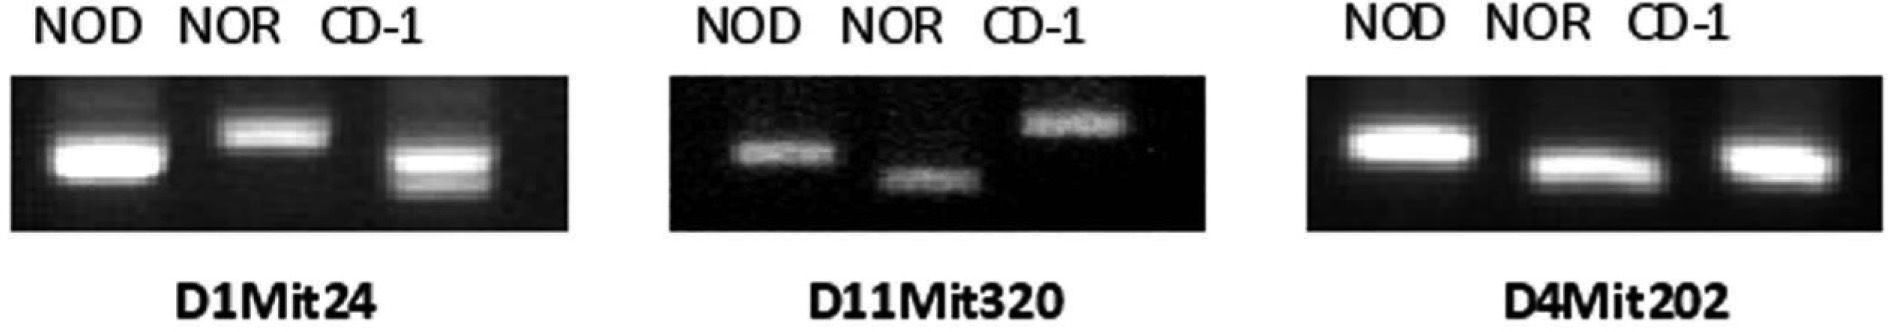
ResultsEleven microsatellites were selected for CD-1 and NOD/NOR differentiationFrom the initial group of 23 pairs of primers, we identified microsatellite markers that were variant between CD-1 colony and NOD or NOR strains, based on the band size, allowing us to differentiate CD-1 mice from NOD, NOR and CD-1 genotypes (table 1). Eleven microsatellites were selected according to the following criteria: First, primer sets that give PCR products distinguishable in size by simple 4 % agarose gel electrophoresis (polymorphisms greater than 4 base pairs). Second, microsatellites showing always differences between at least 10 mice from CD-1 colony and NOD or NOR strain. Three of these microsatellite markers (D1Mit24, D11Mit320, and D4Mit202) also allow to distinguish between NOD and NOR strains (fig. 1). In these cases we found that relative amplimer size is NOR>NOD>CD-1 (D1Mit24), CD-1>NOD>NOR (D11Mit320) and NOD>CD-1>NOR (D4Mit202). The low level of polymorphism was expected in strains with a common origin.

Analysis of microsatellites allow the identification of different mouse strains. Image of an 4 % agarose gel with three PCR products corresponding to microsatellite markers D1Mit24, D11Mit320, and D4Mit202 in NOD and NOR strains and CD-1 colony. The three markers give differences on size in different genetic backgrounds and were selected for microsatellite analysis.
All the 11 microsatellite markers were positive at the 5th generation of NOD and NOR mice and maintained to the 10th generation. During breeding, no significant fluctuations in litter size and sex ratios have been observed.
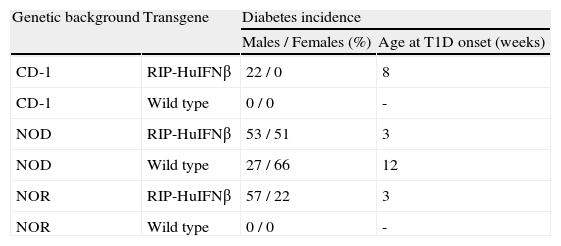
Diabetes incidence correlates with background acquisitionIn CD-1 RIP-HuIFN-beta mouse colony, only males developed type 1 diabetes with an incidence of 22 % and starting after 8 weeks of age (table 2). To confirm the acquisition of the NOR and NOD background, the percentage of diabetes was assessed in transgenic and non-transgenic NOR and NOD mice resulting from backcrosses. Six backcrosses with NOR mice showed spontaneous development of diabetes with an acceleration and increase of incidence of the disease: Fifty seven percent (57 %) of male (M) and 22 % of female (F) NOR RIP-HuIFN-beta mice became diabetic starting the disease at 3 weeks of age (table 2). Wild type NOD mice presented an incidence of 66 % in female and 27 % in male at 30 weeks of age and the age of disease onset was after 12 weeks of age. By contrast the incidence of diabetes in transgenic mice after 6 backcrosses to NOD, was 51 % in female, and 53 % in male at 30 weeks of age, starting diabetes at 3 weeks of age (table 2). Diabetes incidence in NOD non-transgenic littermates was identical to that in wild type NOD: 27 % and 66 % in male and female respectively. As expected, neither CD-1 nor NOR non-transgenic mice developed diabetes during the study.
Diabetes incidence in RIP-HuIFNb transgenic mice and control mice depending on genetic background acquired after backcrosses controlled by microsatellite analysis
| Genetic background | Transgene | Diabetes incidence | |
| Males / Females (%) | Age at T1D onset (weeks) | ||
| CD-1 | RIP-HuIFNβ | 22 / 0 | 8 |
| CD-1 | Wild type | 0 / 0 | - |
| NOD | RIP-HuIFNβ | 53 / 51 | 3 |
| NOD | Wild type | 27 / 66 | 12 |
| NOR | RIP-HuIFNβ | 57 / 22 | 3 |
| NOR | Wild type | 0 / 0 | - |
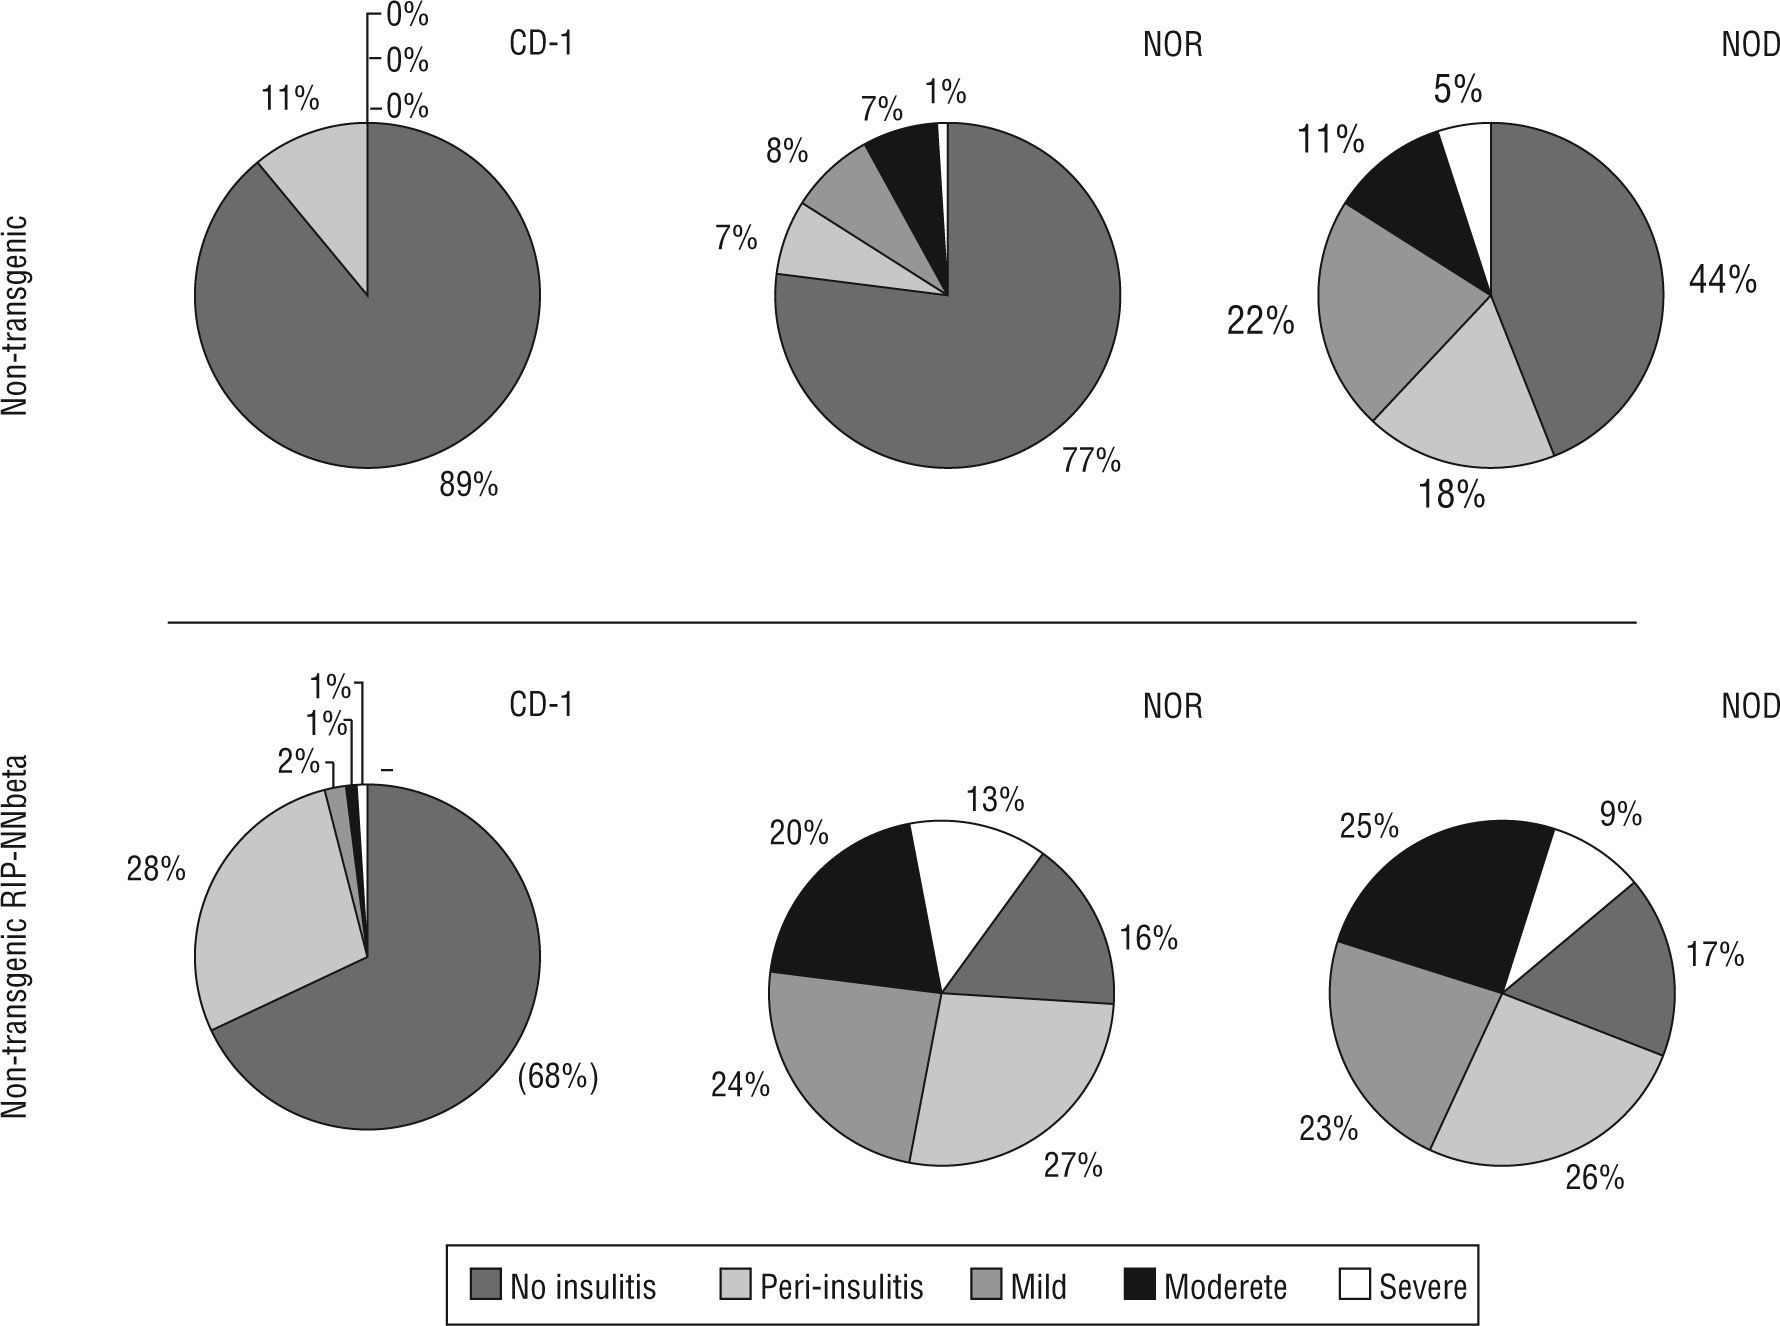
Insulitis score also correlates with the acquisition of genetic background: non transgenic mice resulting from the sixth backcrossing showed the same insulitis score that wild type NOD (insulitis score=0.31±0.09 at six weeks of age and 1.15±0.12 at twelve weeks of age) or wild type NOR (insulitis score=0.47±0.17 at twelve weeks of age. Transgenic mice showed a high degree of insulitis both in the NOD (insulitis score=2.05±0.22 at six weeks of age and 2.42±0.13 at twelve weeks of age) and NOR (insulitis score=2.23±0.25 at six weeks of age and 2.31±0.17 at twelve weeks of age) backgrounds respectively. Moderate and severe insulitis were the predominant categories in transgenic mice (NOD and NOR) whereas peri-insulitis and mild insulitis were the most represented categories in CD-1 transgenic mice (fig. 2).
 in each group of mice, non-transgenic and transgenic RIP-HuIFN-beta mice in the three genetic backgrounds (original CD-1 and backcrossed to NOR and NOD strains).")
Insulitis score correlated with the acquisition of genetic background and he presence of the transgene. Percentage of islets of Langerhans with different degrees of infiltration (from 0 to 4, no insulitis, peri-insulitis, mild, moderate and severe) in each group of mice, non-transgenic and transgenic RIP-HuIFN-beta mice in the three genetic backgrounds (original CD-1 and backcrossed to NOR and NOD strains).
The influence of genetic background on gene expression in mice was documented many years ago 13. The choice of the genetic backgrounds of mouse models used in biomedical research is very important and the use of models whose genetic backgrounds are well defined, stable, and reported is essential. Because alleles of interest such as transgenes may be maintained on one to several mouse genetic backgrounds, it is advisable to put into practice a method to speed up the change of genetic background. Historically, non-DNA based tests were used to assess relatedness, the most rudimentary being coat colour. Skin grafting was also commonly used, and prior to DNA-based testing, the establishment of allelic profiles using biochemical and immunological markers was considered to be the gold standard. Now, genetic testing allows researchers to directly analyze the DNA.
Microsatellites are used as molecular markers in genetics, for kinship, population and other studies and these DNA regions owe their variability to an increased rate of mutation compared to other neutral regions of DNA. Microsatellites can be amplified, similarly to other DNA sequences in the genome, by polymerase chain reaction (PCR) using unique sequences of flanking regions as primers. This process results in the aplification of DNA bands of different size, according to the particular mouse strain.
Knowing that animal models are an important tool for the study of type 1 diabetes 14 and that transgenic mice can be generated in the CD-1 background and backcrossed to NOD or NOR background, we designed a simple system, based on PCR, to control the acquisition of the inbred NOD or NOR genotype. A similar strategy was previously described to accelerate the cross of the original IL-4 knock-out mice (129×B6 F2) onto the NOD genetic background 15. In our case, the main aim was to accelerate the acquisition of NOD and NOR genetic background and to that end we selected mice for backcrossing at the 3rd generation and confirmed that all the microsatellite markers were positive at the 5th generation and maintained to the 10th generation. The metabolic follow up of these mice demonstrated that diabetes incidence increases in transgenic mice after the acquisition of NOD or NOR genetic background. These results indicate that the antiviral cytokine IFN-beta breaks peripheral tolerance to the beta cells and accelerates autoimmunity in diabetes and non-diabetes prone mice8. The acceleration of the onset of the disease was observed, correlating well with the presence of the transgene in a diabetogenic and non-diabetogenic genetic background. As expected, insulitis score also correlates with the acquisition of genetic background in NOD mice. Non-transgenic littermates served as controls for the gradual change of genotype.
In conclusion, we used a set of 11 available microsatellite markers, representing 9 chromosomes and standard PCR to develop a fast method (results can be obtained in a working day) for genetic monitoring of the acquisition of a specific genetic background. We have demonstrated that the acceleration of the acquisition of NOD and NOR genetic background can be achieved by typing a group of DNA microsatellites with differences in size with the original colony or strain. We have demonstrated that using this strategy, 5 or 6 backcrosses are enough to obtain the genotype of interest. In terms of time, it means that the process takes approximately 10 months, thus shorting the process in more than one year and a half.
Conflict of interestsThe authors declare no financial conflict of interests.
Our work in this field is supported by a grant from the 'Fondo de Investigaciones Sanitarias, ISCiii', Spanish Ministry of Science and Innovation (Project PS09/00253). Special thanks to Dr. Sandra Barbosa, veterinarian (Universitat Autónoma de Barcelona) and to Mr. Albert Salvatella for animal care.