


Carotid intima media thickness (CIMT) is used as a marker of subclinical and asymptomatic atherosclerotic vascular disease. Increased CIMT is associated with future cerebrovascular and cardiovascular events. There is limited data on the profile and correlates of CIMT in Africa. The aim of this study was to describe the profile and correlates of CIMT in apparently normal younger-age adults in an urban setting in Kenya.
MethodsThis study used population-based data collected from 2003 adults between the ages of 40 and 60 years in two slums of Nairobi as part of a genetic study. CIMT was measured using LOGIQ e (GE Healthcare, CT, USA) ultrasound on both left and right carotid arteries, whereby maximum, mean, and minimum values were recorded. Age- and sex-specific CIMT measurements were calculated and their association with basic sociodemographic, behavioral and body composition indicators were investigated.
ResultsThe median (IQR) CIMT were 0.58 (0.51, 0.66) and 0.59 (0.53, 0.66) in men and women, respectively. About 16% of the study population had CIMT greater than 0.7mm, the cut off for higher CIMT. Nearly 60% had CIMT values ≥75th percentile. Age, current use of alcohol, systolic blood pressure, subcutaneous fat thickness, pulse rate and pulse pressure were found to be the main predictors of CIMT in our study population.
ConclusionThis study provided population-based reference values and predictors for CIMT for an adult population living in urban poor settings in Kenya. Future studies need to consider biochemical and genetic predictors of CIMT in this population.
El grosor de la íntima-media carotídea (GIMc) se utiliza como marcador de la aterosclerosis subclínica y asintomática. El incremento del GIMc está asociado a episodios cerebrovasculares y cardiovasculares futuros. Existen datos limitados sobre el perfil y la correlación del GIMc en África. El objetivo de este estudio fue describir el perfil y la correlación del GIMc en adultos jóvenes aparentemente normales en un contexto urbano de Kenia.
MétodosEste estudio utilizó datos basados en población de 2.003 adultos con edades comprendidas entre 40 y 60 años en dos suburbios de Nairobi, como parte de un estudio genético. El GIMc se midió utilizando el ecógrafo LOGIQ E (GE Healthcare, CT, EE. UU.) en ambas carótidas, izquierda y derecha, donde se registraron los valores máximo, medio y mínimo. Se calcularon las medidas de GIMc específicas de la edad y el sexo, así como su asociación con los indicadores sociodemográficos, conductuales y corporales básicos.
ResultadosLos valores medios (RIC) de GIMc fueron 0,58 (0,51, 0,66) y 0,59 (0,53, 0,66) en hombres y mujeres, respectivamente. Cerca del 16% de la población de estudio tuvo un GIMc superior a 0,7mm, siendo el punto de corte de GIMc elevado. Cerca del 60% reflejó valores de GIMc ≥percentil 75. La edad, el consumo actual de alcohol, la presión arterial sistólica, el grosor de la grasa subcutánea, la frecuencia cardiaca y la presión del pulso fueron los principales factores predictivos de GIMc en la población de nuestro estudio.
ConclusiónEste estudio aportó valores de referencia basados en población y factores predictivos de GIMc para una población adulta en un entorno urbano de pocos recursos de Kenia. Los estudios futuros deberán considerar los factores predictivos bioquímicos y genéticos de GIMc en dicha población.
Cardiovascular disease (CVD) resulting from atherosclerosis is a major cause of morbidity and mortality in many developing countries. Carotid intima-media thickness (CIMT) is commonly used as a surrogate marker of subclinical atherosclerosis for guiding risk prediction and medical intervention. Though CIMT alone could be weak in predicting CVD risk, combining this measure with an assessment of carotid plaque formation improves the prediction of risk.1 Consequently, ultra-sonographic measurement of CIMT has been applied to detect the early stages of atherosclerosis, since the procedure is safe, noninvasive and cost-effective in identifying early atherosclerotic vascular diseases.2
CIMT is also used in clinical trials as a surrogate endpoint for CVD on the assumption that slowed progression of CIMT resulting from cardiovascular risk interventions, reflects a reduction in cardiovascular events.3,4 In addition, increased CIMT has been reported as a risk factor for ischemic stroke. In patients with ischemic stroke, there is an increase in CIMT when compared to the expected CIMT values for their age.4,5 Greater baseline CIMT was independently associated with the risk of mild cognitive impairment and dementia in elderly subjects.6
Age, increased blood pressure, abnormal lipids and diabetes are common risk factors that contribute to the development of atherosclerosis, including carotid artery disease. A study that evaluated the relationship between these risk factors and degree of carotid severity and CIMT in high-risk subjects showed a positive correlation between the degree of severity of carotid damage and CIMT, and cardiovascular risk factors, especially with older age and increased blood pressure.7 However, it is important to note that compared to carotid atherosclerosis, there is modest association between CIMT and coronary atherosclerosis, reflective of the variability in atherosclerosis development between the different vascular beds.4,8
During progression to early adulthood, CIMT is the only atherosclerotic marker of carotid atherosclerosis that can be tracked, since plaque formation typically occurs later in life.9,10 CIMT's easy applicability and the availability of its non-invasive Bright-mode (B-mode) ultrasonography, makes it suitable for use as a surrogate endpoint for measuring the atherosclerotic burden in people with cardiovascular risk factors. Its significant association with carotid atherosclerosis makes it more relevant in risk prediction as well as medical intervention.11 Given the importance of CIMT in the diagnosis of subclinical atherosclerosis, it is recommended that CIMT should be evaluated in every asymptomatic adult and hypertensive patient at increased risk for CVD. For this purpose, a carotid artery ultrasound scan is a suitable method of choice, with reliable results when certain standards are followed.10,12
Despite its importance, the use of CIMT measures in African settings is very limited, and an understanding of CIMT profiles for the African population is needed. In the South African black population, increased CIMT was correlated to angiographically proven coronary artery disease. A study by Holland and colleagues provided initial indication that CIMT could be useful as a screening tool for the presence of coronary artery disease in African populations.13 Diabetic and hypertensive Nigerians were found to have higher values of CIMT compared to normal subjects.14 The PARC-AALA study reported that some inter-geographical characteristics in demographic and risk factors were related to CIMT differences.15 However, more concise analysis of CIMT in African settings is needed. Consequently, the aim of this paper was to describe the profile and correlates of CIMT in apparently healthy adults in an urban poor setting in Kenya.
MethodsData sourceThe population based-cross-sectional analysis was nested within a larger AWI-Gen study (Africa Wits-INDEPTH Partnership for the Genomic Research) – Human Heredity and Health in Africa (H3Africa) study.16 The partnership and study was conducted in and included six Health and Demographic Surveillance System (HDSS) field sites of the INDEPTH Network across four countries, Ghana, Burkina Faso, Kenya and South Africa. This, study included a relatively sex-balanced sample of unrelated participants aged 40–60 years, recruited through random sampling. The broader aim of the study was to identify environmental and genetic factors that were associated with obesity and that increase susceptibility to cardio-metabolic disease.17–19 The sample size considered was based on power calculations and effect sizes as published elsewhere.20,21 The analyses presented herein focus solely on the data collected from 2003 adults aged 40–60 years in the Nairobi Urban Health and Demographic Surveillance System (NUHDSS), a pioneer urban-based Health and Demographic Surveillance System in sub-Saharan Africa (SSA) described elsewhere in detail.22
Definition of CIMTCarotid intima-media thickness (CIMT) is defined as the area of tissue starting at the luminal–intimal interface and the media–adventitia interface of common carotid artery (CCA). Since B-mode ultrasonography is a safe, noninvasive, and a cost-effective measure of CIMT, this study more precisely defined CIMT as the double-line pattern visualized by B-mode vascular ultrasound formed by two parallel echogenic lines representing the junction of the vessel lumen with intima and media–adventitia interface.
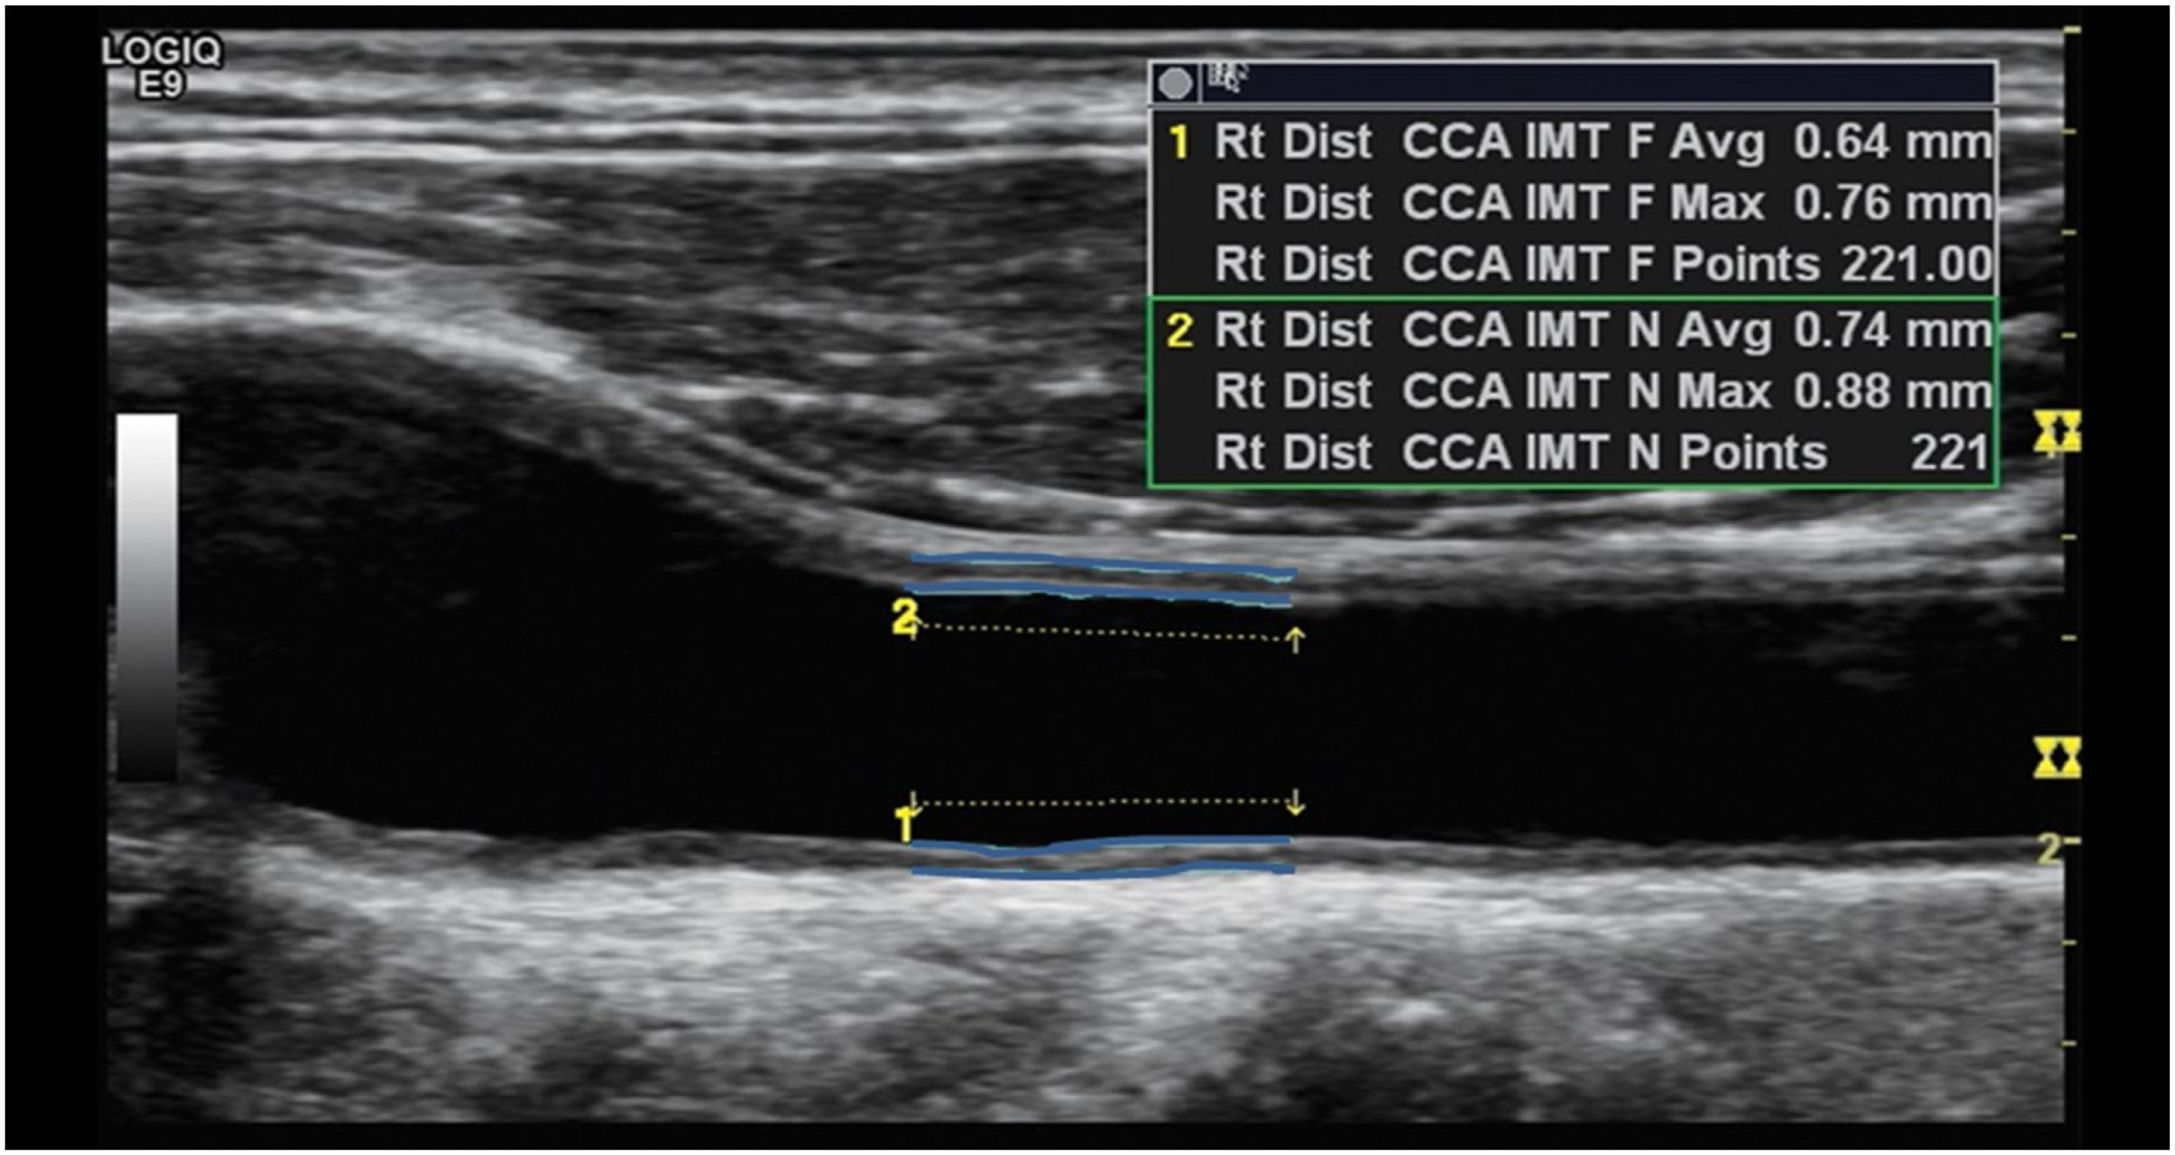
Ultrasonography examinationThe carotid artery ultrasound measurements were performed by a trained ultrasound nurse. Ultrasonography examinations were performed using LOGIQ e ultrasound system (USS) (GE Healthcare, CT, USA) equipped with an ML 6–15 transducer. Patients were in the supine position with the head slightly extended and rotated to the contralateral direction from the examination side. The far wall of the left main carotid artery, 2cm proximal to the bulb, was focused on and several longitudinal images were used to measure the inter-medial thickness (IMT) with the automatic IMT measurement program of the ultrasound system. The minimum, mean and maximum CIMT values on both carotid arteries were recorded. Briefly, the CIMT was determined first by scanning the neck area in a longitudinal plane to find the common carotid artery (CCA) and scanning the area immediately after for a length of about 2cm. The top line of the posterior intima was identified and fixed and the cursor was then moved along the anterior aspect of the intima and the line fixed as shown in Fig. 1. Readings for min, max and average thickness were recorded in mm. The right carotid was scanned first followed by the left carotid. Two sonography medical specialists were involved in the study data collection. In addition, the specialist nurse underwent additional centralized training for the study protocol on sonography measures to be taken. For data quality control, a medically trained expert reviewed a total of 10% of all ultrasound scans. During the quality control process intra- and inter-observer differences were estimated by calculating the mean and the 95% confidence interval of the arithmetic differences between measurements taken. There were no statistically significant differences observed (p<0.05) and the technical error of measurements was maintained at less than the 5% which is the recommended maximum level.
Normal values of CIMT
In healthy middle-aged adults, CIMT values between 0.6 and 0.7mm are considered normal, while a CIMT of 1mm or more has been associated with significant increased absolute risk of coronary heart disease. The American Society of Echocardiography (ASE) considers echocardiography reported CIMT values ≥75th percentile as the upper limit of normal ranges across age, gender, and race/ethnicity, and as an indicator of increased CVD risk, requiring medical intervention.23 CIMT values greater than 0.90mm are considered to be indicative of organ damage according to the European Society of Cardiology (ESC).24 CIMT values between the 25th and 75th percentiles are considered as acceptable. The guideline suggested that patients with CIMT values ≤25th percentile may be considered to have lower CVD risk.12 However, these guidelines were largely informed by data from western populations.
Definition of variablesCurrent smoking, use of alcohol, and unhealthy diet was defined as described.25 There 16 conditions that were included in this analysis. More information about these conditions are as earlier detailed.26 The 16 conditions were tuberculosis, HIV status, diabetes, stroke, hypertension, angina, heart attack, congestive heart failure, high cholesterol, kidney disease, thyroid disease, cancer, Asthma/reactive air disease, alcohol disorder, drug use and obesity.
Data analysisDescriptive statistics, including mean and standard deviation, median (interquartile range), minimum, maximum, frequency, and percentage, were calculated. The variables were investigated to determine whether or not they were normally distributed using skewness/kurtosis test of normality and Shapiro–wilk test of normality. Normal probability plots are presented. Spearman rank coefficient was used to assess the correlation between CIMT and other key parameters. CIMT data was transformed using natural logarithm before the application of parametric statistics. T-tests and ANOVA were used to test differences in means for various background characteristics in the study population. The background variables included in the model were age (recoded into two categories; 40–50 and 51–60), sex (male or female), education (categorized into four categories: no education, primary, secondary and tertiary), ethnicity (Kamba, Kikuyu, Luo, Luhya, others), employment (categorized into five categories: self-employed, fulltime employment, part-time employed, informal employment and unemployed), current use of alcohol, current smoker, unhealthy diet, work that involves mainly sitting and having at least one chronic condition. A multiple linear regression model was used to identify independent predictors of CIMT. A p-value of less than 0.05 was considered to be statistically significant.
ResultsBackground characteristicsThe socio-demographics, behavioral and clinical characteristics of the study participants are summarized in Table 1. A total of 2003 adults between the age of 40 and 60 were included in this study. Over half (54%) were women. Nearly two third of them were between 40 and 50 years of age. Majority (57%) of the study participants had attained up to a primary education level and 47% were self-employed. About a third were engaged in informal employment. More men were significantly consuming alcohol (p-value=0.000), taking tobacco products (p-value=0.000), had higher waist-to-hip-ratio (p-value=0.042), visceral fat thickness (p-value=0.000), systolic blood pressure (p-value=0.000) compared to females. Significantly more women had chronic conditions (p-value=0.001), higher BMI values (p-value=0.000), and higher waist circumference (p-value=0.000). Other details of background characteristics of the study participants are presented elsewhere.16,22
Characteristics of the study population by sex.
| Categories | Men | Women | Total | p-Value | |
|---|---|---|---|---|---|
| N | 922 | 1081 | 2003 | ||
| Socio-demographic factors | |||||
| Age groups | Mean±SD | 49.1±6.0 | 48.5±5.6 | 0.0174 | |
| 40–50 years | 549 (59.5%) | 705 (65.2%) | 1254 (62.6%) | 0.009 | |
| 56–60 years | 373 (40.5%) | 376 (34.8%) | 749 (37.4%) | ||
| Education | No formal education | 36 (3.9%) | 118 (10.9%) | 154 (7.7%) | 0.000 |
| Primary education | 469 (50.9%) | 682 (63.1%) | 1151 (57.5%) | ||
| Secondary education | 395 (42.8%) | 277 (25.6%) | 672 (33.5%) | ||
| Tertiary education | 22 (2.4%) | 4 (0.4%) | 26 (1.3%) | ||
| Ethnicity | Kamba | 197 (21.4%) | 196 (18.1%) | 393 (19.6%) | 0.000 |
| Kikuyu | 245 (26.6%) | 480 (44.4%) | 725 (36.2%) | ||
| Luhya | 179 (19.4%) | 143 (13.2%) | 322 (16.1%) | ||
| Luo | 215 (23.3%) | 159 (14.7%) | 374 (18.7%) | ||
| Others | 86 (9.3%) | 103 (9.5%) | 184 (9.4%) | ||
| Employment | Self-employed | 314 (34.2%) | 632 (58.5%) | 946 (47.3%) | 0.000 |
| Employed (full-time) | 217 (23.6%) | 50 (4.6%) | 267 (13.4%) | ||
| Employed (part-time) | 26 (2.8%) | 19 (1.8%) | 45 (2.3%) | ||
| Employed (informal) | 336 (36.6%) | 287 (26.5%) | 623 (31.2%) | ||
| Unemployed | 26 (2.8%) | 93 (8.6%) | 119 (5.9%) | ||
| Behavioral factors | |||||
| Alcohol use | % | 307 (33.3%) | 64 (5.9%) | 371 (18.5%) | 0.000 |
| Current smoking | % | 216 (23.5%) | 28 (2.6%) | 244 (12.2%) | 0.000 |
| Sedentary work | % | 487 (52.8%) | 615 (56.9%) | 1102 (55.0%) | 0.068 |
| Chronic condition | % | 563 (61.1%) | 739 (68.4%) | 1302 (65.0%) | 0.001 |
| Clinical factors | |||||
| BMI (kg/m2) | Mean±SD | 22.8±3.9 | 27.6±6.0 | 0.000 | |
| Waist circumference (cm) | Mean±SD | 83.5±10.9 | 90.7±14.3 | 0.000 | |
| Waist-to-hip-ratio | Mean±SD | 0.89±0.1 | 0.88±0.1 | 0.042 | |
| Visceral fat thickness | Mean±SD | 5.23±1.7 | 4.77±1.61 | 0.000 | |
| Subcutaneous fat thickness | Mean±SD | 1.14±0.6 | 1.94±0.77 | 0.000 | |
| Systolic BP mmHg | Mean±SD | 122.6±20.2 | 118±21.8 | 0.000 | |
| Diastolic BP mmHg | Mean±SD | 78.3±12.3 | 78.4±13.1 | 0.844 | |
BP: blood pressure.
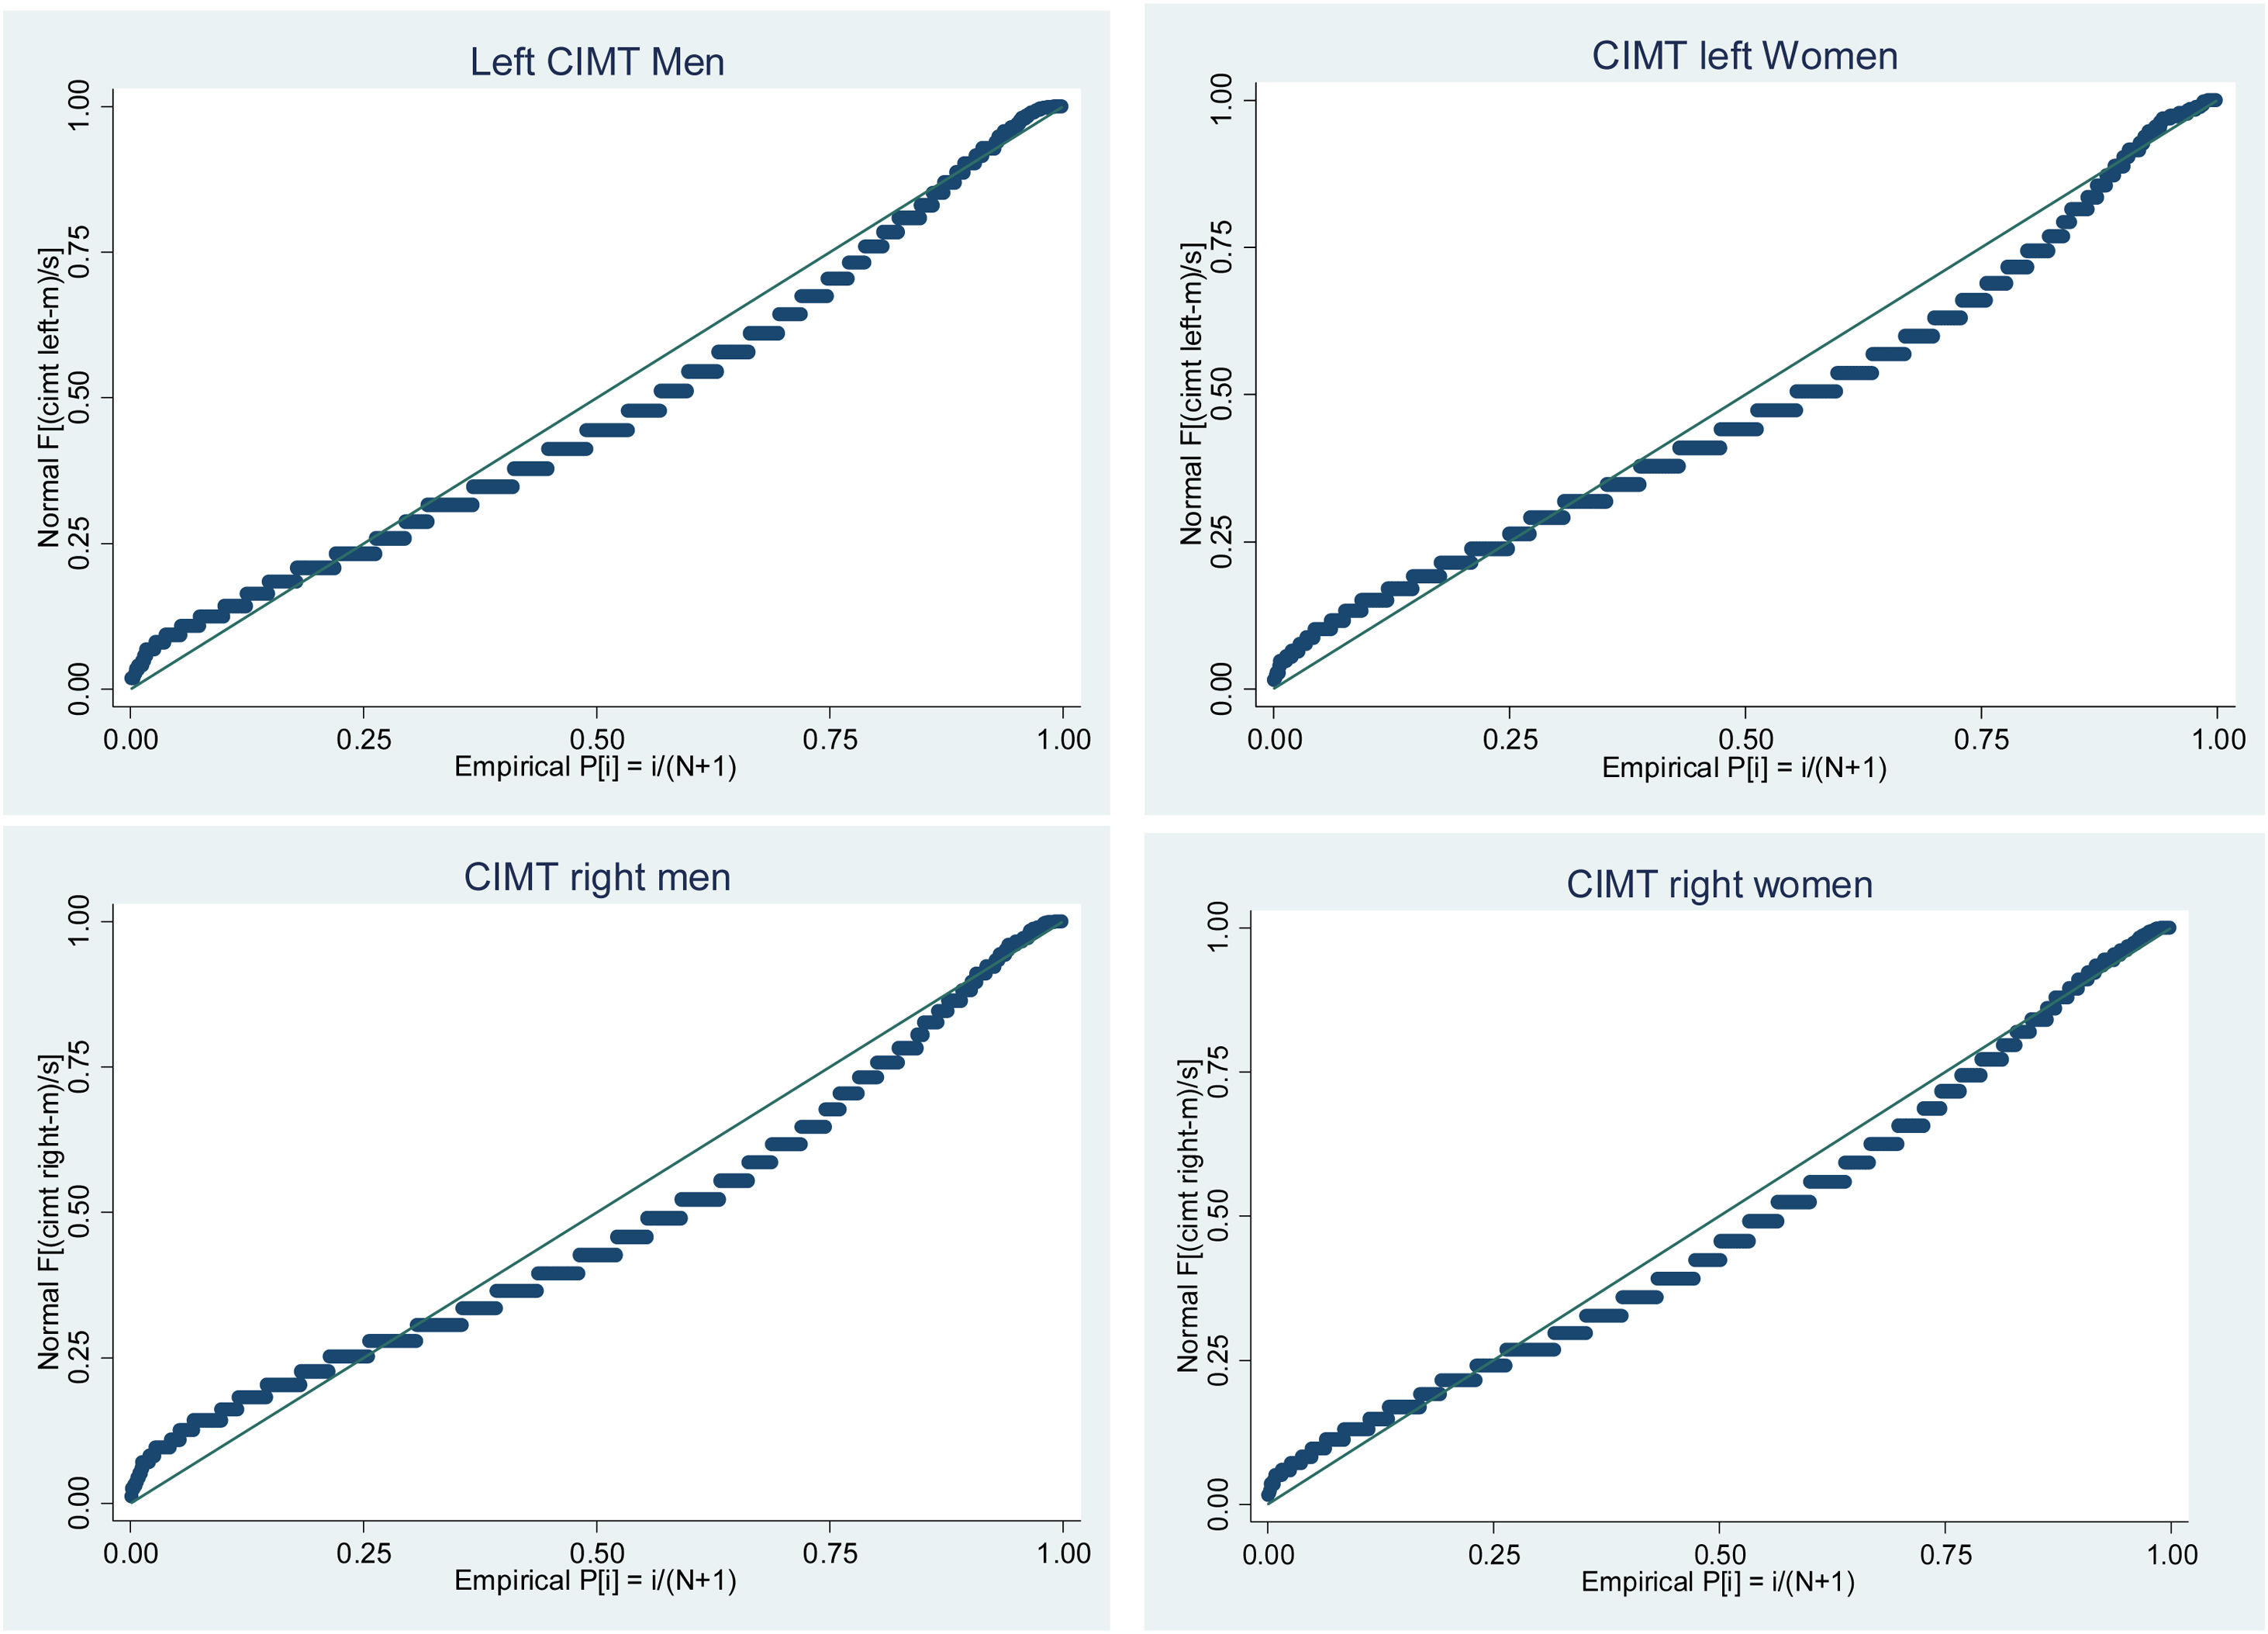
Analysis of the distribution of CIMT values shows that values on both left and right CIMT are not normally distributed and their distribution is skewed to the right. Skewness/kurtosis tests for normality and Shapiro–wilk test of normality are statistically significant for both left and right CIMT suggesting the null hypothesis of normal distribution. The normal probability plots of left and right CIMT by gender are shown in Fig. 2.

Descriptive analysis showed that CIMT values vary widely by age and gender in our study population. Women had higher CIMT values as compared to men. Those 40–50 years of age had lower CIMT values as compared to those 51–60 years of age. More details of these are shown in Table 2.
The median (IQR) CIMT values by gender and age.
| Age categories | Men | Women | Total |
|---|---|---|---|
| Left carotid | |||
| 40–50 years | 0.56 (0.50, 0.63) | 0.57 (0.51, 0.64) | 0.57 (0.51, 0.64) |
| 51–60 years | 0.61 (0.54, 0.69) | 0.62 (0.56, 0.73) | 0.62 (0.55, 0.70) |
| 40–60 years | 0.58 (0.51, 0.66) | 0.59 (0.53, 0.66) | 0.58 (0.52, 0.66) |
| Right carotid | |||
| 40–50 years | 0.53 (0.48, 0.59) | 0.54 (0.49, 0.61) | 0.54 (0.49, 0.60) |
| 51–60 years | 0.59 (0.52, 0.67) | 0.62 (0.54, 0.70) | 0.60 (0.53, 0.69) |
| 40–60 years | 0.55 (0.49, 0.63) | 0.56 (0.50, 0.65) | 0.56 (0.50, 0.64) |
In healthy middle age adults, a CIMT value of more than 0.70mm is considered high and CIMT values greater than 0.90mm are considered to be indicative of organ damage according to ESC. In this study, the overall prevalence of increased CIMT (of ≥0.7mm) was found to be 15.8%. Only 1.9% had CIMT values greater than 0.9mm About 54% of the study population had below average cardiovascular risk (i.e. <0.60mm).
The American Society of Echography (ASE) recommends that IMT ≥75th percentile is considered high. Values from the 25th–75th percentile are considered normal and values ≤25th percentile are considered low. Based on this recommendation, nearly 59% of the study population had increased left CIMT values. The prevalence of increased CIMT was higher in women than in men in both recommendations. Details of categories of CIMT values are shown in Table 3.
Number (%) of adults with increased left CIMT values by age and gender.
| Age categories | Men | Women | Total |
|---|---|---|---|
| ESC guideline (0.60–0.70mm) | |||
| 40–50 years | 60 (10.9%) | 73 (10.4%) | 133 (10.6%) |
| 51–60 years | 80 (21.5%) | 103 (27.4%) | 183 (24.4%) |
| 40–60 years | 140 (15.2%) | 176 (16.3%) | 316 (15.8%) |
| ASE guideline (>75th percentile) | |||
| 40–50 years | 260 (47.5%) | 491 (69.7%) | 751 (60.0%) |
| 51–60 years | 182 (48.8%) | 246 (65.4%) | 428 (57.1%) |
| 40–60 years | 442 (48.0%) | 737 (68.2%) | 1179 (58.9%) |
ESC: European Society of Cardiology; ASE: American Society of Echocardiography.
Bivariate analysis of the association between CIMT and sociodemographic or behavioral characteristics of participants showed that education, ethnicity, employment and current use of alcohol are associated with increased CIMT based on ASE criteria. Other behavioral factors such as current smoking, unhealthy diet, sedentary behavior and a history of a chronic condition were not significantly associated with increased CIMT. Table 4 shows results of bivariate analyses.
Association between CIMT and sociodemographic and behavioral factors.
| Predictor variables | CIMT values (ASE) | Crude OR | |
|---|---|---|---|
| Low/average | High | ||
| Education | |||
| No education | 35 (22.7%) | 119 (77.3%) | 1.00 |
| Primary | 493 (42.9%) | 657 (57.1%) | 0.39 (0.26, 0.58) |
| Secondary | 278 (41.5%) | 392 (58.5%) | 0.41 (0.27, 0.62) |
| Tertiary | 15 (57.7%) | 11 (42.3%) | 0.22 (0.09, 0.51) |
| Ethnicity | |||
| Kamba | 179 (45.5%) | 214 (54.5%) | 1.00 |
| Kikuyu | 318 (43.9%) | 405 (56.0%) | 1.06 (0.83, 1.36) |
| Luo | 120 (37.4%) | 201 (62.6%) | 1.40 (1.04, 1.89) |
| Luhya | 135 (36.1%) | 239 (63.9%) | 1.48 (1.11, 1.98) |
| Others | 69 (36.5%) | 120 (63.5%) | 1.45 (1.02, 2.07) |
| Employment | |||
| Self-employed | 359 (58.0%) | 586 (62.0%) | 1.00 |
| Full time employed | 129 (48.5%) | 137 (51.5%) | 0.65 (0.49, 0.86) |
| Part-time employed | 20 (44.4%) | 25 (55.6%) | 0.76 (0.42, 1.39) |
| Informal employment | 272 (43.7%) | 351 (56.3%) | 0.79 (0.64, 0.97) |
| Unemployed | 351 (33.1%) | 79 (66.9%) | 1.24 (0.82, 1.86) |
| Current use of alcohol | |||
| No | 248 (42.4%) | 337 (57.6%) | 1.00 |
| Yes | 208 (56.1%) | 163 (43.9%) | 0.57 (0.44, 0.74) |
| Current smoking | |||
| No | 156 (47.6%) | 172 (52.4%) | 1.00 |
| Yes | 134 (55.1%) | 109 (44.9) | 0.73 (0.52, 1.02) |
| Unhealthy diet* | |||
| No | 601 (40.9%) | 868 (59.1%) | 1.00 |
| Yes | 220 (41.4%) | 311 (58.6%) | 0.97 (0.80, 1.19) |
| Work involves mostly sitting | |||
| No | 375 (41.6%) | 525 (58.3%) | 1.00 |
| Yes | 446 (40.5%) | 654 (59.5%) | 1.04 (0.87, 1.25) |
| At least one chronic condition** | |||
| No | 304 (42.6%) | 410 (57.4%) | 1.00 |
| Yes | 517 (40.2%) | 769 (59.8%) | 1.10 (0.91, 1.32) |
Though most of the coefficients for the correlation between CIMT and other key parameters were statistically significant, stronger correlations were observed between CIMT and systolic blood pressure and pulse pressure. Table 5 shows the correlation matrix of CIMT and other variables.
Correlation between CIMT and other key parameters.
| CIMT | BMI | WC | WHR | VFT | SCFT | SBP | DBP | Pulse | PP | |
|---|---|---|---|---|---|---|---|---|---|---|
| CIMT | 1 | |||||||||
| BMI | 0.1635* | 1 | ||||||||
| WC | 0.1643* | 0.8637* | 1 | |||||||
| WHR | 0.1042* | 0.3646* | 0.6508* | 1 | ||||||
| VFT | 0.0892* | 0.3583* | 0.4384* | 0.3438* | 1 | |||||
| SCFT | 0.0871* | 0.8031* | 0.7573* | 0.3433* | 0.2348* | 1 | ||||
| SBP | 0.2276* | 0.0875* | 0.1264* | 0.1782* | 0.1858* | 0.0048 | 1 | |||
| DBP | 0.1738* | 0.1800* | 0.2112* | 0.1824* | 0.1899* | 0.1419* | 0.8604* | 1 | ||
| Pulse | −0.0690* | 0.1471* | 0.1424* | 0.0993* | 0.0232 | 0.2208* | −0.0025 | 0.1398* | 1 | |
| PP | 0.2182* | −0.0457* | −0.0132 | 0.1133* | 0.1149* | −0.1501* | 0.8114* | 0.4334* | −0.1764 | 1 |
BMI: Body Mass Index; WC: waist circumference; WHR: waist to hip ratio; VFT: visceral fat thickness; SCFT: sub-cutaneous fat thickness; SBP: systolic blood pressure; DBP: diastolic blood pressure; PP: pulse pressure.
*: the significant correlations.
Using the logarithmic transformed CIMT data as a dependent variable, we ran two multiple linear regression models. In model 1, the predictor variables were sociodemographic and behavioral factors. In model 2, predictor variables were anthropometric measures, fat thickness, blood pressure and heart rate. In model 1, age and current use of alcohol were significantly associated with CIMT, while in model 2 sub-cutaneous fat thickness, systolic blood pressure, pulse pressure and pulse rate were significantly associated with CIMT. Details of the regression analyses are shown in Table 6.
Predictors of CIMT – outputs of regression analysis.
| Coefficient | Std. Err. | T | p>t | [95% conf. interval] | ||
|---|---|---|---|---|---|---|
| Model 1 | ||||||
| Gender | −0.0209077 | 0.0240347 | −0.87 | 0.385 | −0.0681291 | 0.0263137 |
| Age | 0.0710815 | 0.0164515 | 4.32 | 0.000 | 0.038759 | 0.1034041 |
| Education | 0.0081921 | 0.0139868 | 0.59 | 0.558 | −0.0192881 | 0.0356723 |
| Occupation | 0.0047552 | 0.0055359 | 0.86 | 0.391 | −0.0061213 | 0.0156317 |
| Current use of alcohol | −0.0380607 | 0.0187462 | −2.03 | 0.043 | −0.0748917 | −0.0012296 |
| Current smoking | 0.0016639 | 0.018196 | 0.09 | 0.927 | −0.0340861 | 0.037414 |
| Unhealthy diet | 0.0072023 | 0.0176663 | 0.41 | 0.684 | −0.027507 | 0.0419117 |
| Sedentary behavior | −0.003709 | 0.0159107 | −0.23 | 0.816 | −0.034969 | 0.0275511 |
| Chronic condition | 0.0126107 | 0.0189244 | 0.67 | 0.505 | −0.0245703 | 0.0497918 |
| Model 2 | ||||||
| Body Mass Index | 0.0001283 | 0.0000697 | 1.84 | 0.066 | −8.38E−06 | 0.000265 |
| Waist circumference | 0.0002708 | 0.0001706 | 1.59 | 0.113 | −0.0000638 | 0.0006054 |
| Waist to hip ratio | −0.0091928 | 0.0089973 | −1.02 | 0.307 | −0.026838 | 0.0084524 |
| Visceral fat thickness | 0.0033031 | 0.0025439 | 1.3 | 0.194 | −0.0016859 | 0.0082922 |
| Sub-cutaneous fat thickness | 0.0189829 | 0.0058995 | 3.22 | 0.001 | 0.007413 | 0.0305527 |
| Systolic blood pressure | 0.0013327 | 0.000274 | 4.86 | 0.000 | 0.0007954 | 0.0018701 |
| Pulse rate | −0.0008527 | 0.0002636 | −3.24 | 0.001 | −0.0013696 | −0.0003358 |
| Pulse pressure | 0.0021385 | 0.0005546 | 3.86 | 0.000 | 0.0010508 | 0.0032262 |
Bold values: the statistically significant variables.
This study presents CIMT profiles on 2003 apparently healthy adults between 40 and 60 years of age living in an urban poor settings. Women had higher CIMT values than men. Those above 50 years of age had higher CIMT values as compared to those below 50. In the regression analysis, age, current use of alcohol, systolic blood pressure, subcutaneous fat thickness, pulse rate and pulse pressure were found to be the main predictors of CIMT in our study population.
In the presented study, the sex differences in CIMT measures are likely due to the differences in cardiovascular risk factor levels between men and women; particularly by differences in obesity levels, waist circumference measures, visceral fat thickness, and sub-cutaneous fat thickness. These differences would be influenced by the extent of physical activity.27 This is so because, findings in the same study setting have shown that more men are involved in physical activity than women. This is true for all the three major domains of physical exercise that include work-related, transport-related, and recreation-related physical activity.28
Well known approaches and gold standard techniques such as Framingham risk factors score (a multifactor risk scores based on traditional risk factors such as age, smoking, hypercholesterolemia, hypertension and diabetes mellitus) have persisted in the clinical identification of individuals who are at higher risk of cardiovascular disease or events. However, clinicians are increasingly dealing with clinical CVD cases after they become symptomatic, or when atherosclerosis is well established. This hampers earlier detection for prevention of possible acute events.29 Noting the CVD global burden trends and more specifically in sub Saharan Africa30 and the need to complement traditional approaches with less contemporary techniques for early detection, there is an increasing need for applicability of techniques such as CIMT, which can aid earlier identification, before acute symptoms manifest.31,32 While the presented findings examined a “general healthy” population who may not have had any prior history of CVD, the observed results importantly emphasize the possible additional benefit of CIMT. That is, its benefit in complementing typical risk score algorithms for use in identification of those at the early development stages and asymptomatic intermediate risk which is increasingly becoming a common and challenging group to deal with under the traditional approaches available.33 Thus, this supports the fact that CIMT uptake and its utility clinically where possible and feasible, as a non-invasive approach that can provide additional relevant information that would have otherwise been missed if prognosis was based solely on clinical risk scores.33,34
Prior findings have pointed to association between increased cardiovascular risk as well as cardiovascular events (such as myocardial infarction and stroke) with decreasing/low sociodemographic/socioeconomic status alongside behavioral related factors.35,36 Importantly, this association and related subclinical outcomes were explored through CIMT measurement.37 From the present study, bivariate analysis on associations between CIMT and sociodemographic or behavioral factors pointed to education, ethnicity, employment and current use of alcohol as being associated with increased CIMT. Important to note are the varied trends observed within the education level and employment level that contradict earlier findings notion that low education, low income, or manual occupation are associated with carotid wall thickness.37,38 However, in those comparator/earlier findings, age variation (younger age groups) influencing social dynamics trends like risk exposure time or period among the study participants sampled would aid elaborate the differences observed; some of the studies had much younger participants.
The impact of urbanization on non-communicable disease (NCD) risk as considered in the recent past has shown that CVD risk factors are higher or more frequent in rural to urban migrants within a country (when followed up overtime on migrants to urban settings) than in the rural groups.39,40 This may possibly account for ethno-lingua difference in CIMT as observed in this study. For instance, there may be influence of genetics in the observed ethno-differences in CIMT.
With increasing observations that a larger proportion of CVD only becomes clinically apparent at a point where related clinical pointers are well established and often at a point of an acute event, there is little potential to use clinical signs and symptoms to identify those at high risk early enough.31,32 Efforts geared toward such a solution have been ongoing across a diverse range of populations and clinical based studies in most developed countries. The focus has been on utilizing ultrasonography and other advanced techniques as promising approaches to complement the well validated conventional approach of risk scores, filling the gap on early risk detection. Limited evidence has emanated from the developing countries and precisely sub-Saharan Africa to help contextualize the applicability, scalability relevance and additional value of such techniques to inform better approaches to this end. Such evidence can potentially guide operational national and regional health management policies and guidelines toward improved early prognosis and intervention. Hence, the provided findings serve as one among the few population based sources of insights on the profile and correlates of CIMT and associated NCDs risk factors in Kenya.
Limitations of the studyThis study has some limitations. First, we described CIMT in a study population living in urban poor settings in Kenya. Hence, this study does not represent the variabilities of CIMT among population segments living in other residential domains. Second, our study population was limited to 40–60 years of age and the CIMT profiles described in this paper may not be transferred beyond this population group. Third, this analysis is limited to sociodemographic, behavioral, and anthropometric predictors. Further studies that consider biomedical and genetic predictors along with the prediction of cardiovascular risk will be of incremental evidence base benefit. Fourth, given the cross sectional nature of the current study, we are unable to see the changes in the CIMT values in individual over time which is usually considered a more accurate way to identify individuals that have an increased cardiovascular risk. There is need to have CIMT measures collected over time consistently to accurately identify individuals at increased risk early.
Conclusion and recommendationsAs a growing cardiovascular risk predictor, the role and value of CIMT in relation to traditional risk prediction scoring methods has been underscored. Women and older individuals had higher CIMT values than their counterparts. Age, current use of alcohol, systolic blood pressure, subcutaneous fat thickness, pulse rate and pulse pressure were found to be the main predictors of CIMT in the study population. The CIMT findings and cardiovascular risk factors investigated in this study map well onto other validated multifactor risk scores algorithms available and commonly applied in clinical settings. The observations emphasize the plausible benefit of CIMT in complementing validated risk score algorithms. There is a need for CIMT to be tested over and above traditional risk scores in large cohorts and at-risk populations in a temporal trend for greater insight. Equally, related biochemical and genetic markers are needed for better assessment of correlation with phenotypic factors across countries, regions and ethnicities.
Ethical approvalThe study protocol was approved by the Human Research Ethics Committee (Medical) of the University of the Witwatersrand (Wits) (M121029) and the AMREF-Health Ethics and Scientific Review Committee in Kenya (P114/2014). Informed written consent was sought before interview and examination.
Authors’ contributionSFM and TNH conceived the study, developed the analysis plan, conducted the literature review and analysis, and wrote the first draft manuscript. CKW, SKM, and TNH reviewed the draft manuscript, provided substantial inputs, critical comments and suggested additional analyses. SFM finalized the manuscript which was subsequently approved by all authors.
FundingThis work was supported by the National Human Genome Research Institute (NHGRI), the Eunice Kennedy Shriver National Institute of Child Health & Human Development (NICHD) and Office of the Director (OD) of the National Institutes of Health (NIH) of the USA under grant number U54HG006938, as part of the H3Africa Consortium. The funding sources had no involvement in the study design, in data collection, analysis and interpretation of data, in writing the manuscript and in the decision to submit for publication.
Competing interestsNone declared.
We would like to thank all the individuals and organizations that provided technical support for the design and implementation of the main survey. The authors would like to thank the study participants for their time and the field team and other staff that contributed to the data collection.
We would also like to thank the investigators responsible for the conception and design of the AWI-Gen study including the following Michèle Ramsay (PI, Wits), Osman Sankoh (co-PI, INDEPTH), Stephen Tollman and Kathleen Kahn (Agincourt, PI), Marianne Alberts (Dikgale, PI), Catherine Kyobutungi (Nairobi, PI), Halidou Tinto (Nanoro, PI), Abraham Oduro (Navrongo, PI), Shane Norris (Soweto, PI), and Scott Hazelhurst, Nigel Crowther, Himla Soodyall and Zane Lombard (Wits). We would like to acknowledge each of the following investigators for the significant contributions to this research, mentioned according to affiliation are: Wits AWI-Gen Collaborative Center – Stuart Ali, Ananyo Choudhury, Scott Hazelhurst, Freedom Mukomana, and Cassandra Soo.