

The financing of antiretroviral therapy (ART) is generally determined by the cost incurred in the previous year, the number of patients on treatment, and the evidence-based recommendations, but not the clinical characteristics of the population.
ObjectiveTo establish a score relating the cost of ART and patient clinical complexity in order to understand the costing differences between hospitals in the region that could be explained by the clinical complexity of their population.
MethodsRetrospective analysis of patients receiving ART in a tertiary hospital between 2009 and 2011. Factors potentially associated with a higher cost of ART were assessed by bivariate and multivariate analysis. Two predictive models of “high-cost” were developed. The normalized estimated (adjusted for the complexity scores) costs were calculated and compared with the normalized real costs.
ResultsIn the Hospital Index, 631 (16.8%) of the 3758 patients receiving ART were responsible for a “high-cost” subgroup, defined as the highest 25% of spending on ART. Baseline variables that were significant predictors of high cost in the Clinic-B model in the multivariate analysis were: route of transmission of HIV, AIDS criteria, Spanish nationality, year of initiation of ART, CD4+ lymphocyte count nadir, and number of hospital admissions. The Clinic-B score ranged from 0 to 13, and the mean value (5.97) was lower than the overall mean value of the four hospitals (6.16).
ConclusionsThe clinical complexity of the HIV patient influences the cost of ART. The Clinic-B and Clinic-BF scores predicted patients with high cost of ART and could be used to compare and allocate costs corrected for the patient clinical complexity.
La financiación de la terapia antirretroviral (ART) se determina generalmente por los costos incurridos en el año anterior, el número de pacientes en tratamiento y las recomendaciones basadas en la evidencia, pero no por las características clínicas de la población.
ObjetivoEstablecer un índice que relacione el coste de ART y los pacientes de elevada complejidad clínica con el fin de entender las diferencias de coste entre los hospitales de la región que podrían explicarse por la diferente complejidad clínica de sus poblaciones.
MétodosAnálisis retrospectivo de los pacientes que reciben TAR en un hospital terciario entre 2009 y 2011. Los factores potencialmente asociados con un mayor coste de TAR se evaluaron mediante análisis bivariado y multivariado. Se desarrollaron dos modelos de predicción de “coste elevado”. Se calculó el coste estimado normalizado (ajustado por el índice de complejidad) y se comparó con el coste real normalizado.
ResultadosEn el hospital índice, 631 (16.8%) de los 3.758 pacientes que recibieron TAR asumió “coste elevado”, definido como el 25% más alto del gasto en TAR. Las variables basales que fueron asociadas a alto coste en el modelo Clínic-B en el análisis multivariado fueron: vía de transmisión del VIH, criterios de sida, nacionalidad española, año de inicio del TAR, nadir de CD4+ y número de ingresos hospitalarios. El índice de complejidad Clínic-B varió de 0 a 13 puntos, y el valor medio (5.97) fue menor que el valor medio global de los cuatro hospitales (6.16).
ConclusionesLa complejidad clínica de los pacientes VIH influye en el coste de la TAR. Las puntuaciones Clínic-B y Clínic-BF predijeron los pacientes con alto costo de TAR y podrían utilizarse para comparar y asignar costes corregidos según la complejidad clínica de los pacientes.
HIV infection in Europe and, particularly in Spain, is an important and a costly public health problem.1,2 Increased survival of HIV-infected patients3,4 together with a relatively-high and stable level of new diagnoses and recommendations for earlier initiation of antiretroviral therapy (ART) have resulted in a linear increase in the number of ART prescriptions and their cost. In 2010, pharmaceutical expenditure on ART in Spain reached € 700 million, representing 5.54% of all public pharmaceutical expenditure,5 suggesting a need to optimize resources to ensure the sustainability of universal free treatment.5,6
Spanish law stipulates that the purchasing, management and dispensing of antiretroviral drugs is the responsibility of hospital pharmacies.7 The purchasing budget for antiretroviral drugs for each hospital is usually fixed year-to-year by the health system, and is normally determined by the expenditure incurred by the hospital on medical care during the previous year, anticipated changes in drug prices, the number of patients and recommendations on ART regimens.8 Thus, total expenditure per patient-year is fixed by parameters that do not take into account the complexity of the target population of each hospital.
The cost of ART, measured as a direct pharmacy cost per treated patient-year, in addition of being high, varies between hospitals and between patients within the same hospital.6 Funders should focus on determining the causes of these differences, which might be better understood if they were related to the different levels of clinical complexity of each patient. However, this variability would be less acceptable if it were a consequence of differences in prescribing habits of physicians or hospitals and was not related to patient complexity or clinical outcomes.9
The main objective of this study was to analyze which clinical factors at baseline and during follow-up were related to high ART cost and to define two validated scores of complexity (Clinic-B and Clinic-BF scores) in order to be able to predict and to adapt the costs to the clinical complexity of patients attended at different hospitals or even countries.
MethodsWe carried out a retrospective study of HIV-infected patients receiving ART between January 2009 and December 2011 at a referral hospital, denominated Hospital Index (HI). Subsequently, the results were validated in retrospective cohorts from three other hospitals (HV1, HV2 and HV3) selected among the reference hospitals for the treatment of HIV/AIDS in the Catalonia health region. Data were extracted from the electronic medical records of the infectious disease services of each institution. The objective was to establish a score relating the cost of ART and the patients’ clinical complexity in order to understand the costing differences between hospitals in the region that could be explained by their populations’ clinical complexity.
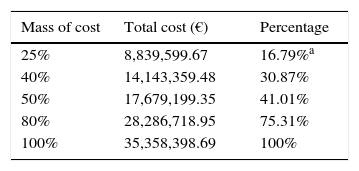
Variables measured and definitions of types of TAR costsThe main dichotomous variable, defined as high cost, was used as the response variable in the logistic regression analysis. It was designed by identifying patients who had a high individual cost of TAR. The cut-off point for the variable high cost was established by calculating the percentages of patients responsible for the different masses of high normalized real cost (Appendix 1). The definition of real cost is the amount billed by the hospital to national health system (total or per patient-year). The normalized real cost was calculated as the real billing for the study period if patients had completed one full year of treatment (total or per patient-year). This was obtained by summing the billings for each patient that had previously been normalized for a complete year of treatment using prices set by the regional health authority. Sensitivity analyze were repeated for different cut-off points in order to evaluate different cut-off points. Distributions of high cost groups that were too small to generate stable regression models were found. For this reason, the most-representative cut-off point was chosen, i.e., that which showed the greatest cost for the smallest mass of the sample, and assuming that this group represented a high percentage of the real total cost of ART treatment.10 The normalized estimated cost is the normalized real cost after correction according to the complexity score (total or per patient-year). In other words, it is the expected cost taking into account the clinical complexity of the patients.
The variables collected were classified into two groups: (1) baseline variables or clinical variables not directly related to medical practice and not influenced by the physicians clinical practice that could potentially modify the cost of ART: sociodemographic variables (age, sex and place of birth), variables related with the HIV infection (year of HIV diagnosis, the mechanism of transmission of HIV, first viral load, first CD4+ cell count and minimum CD4+ cell count from the date of diagnosis or nadir, variables related to clinical events and treatment (presence of HCV antibodies in the last available serology, number of hospital admissions per patient, AIDS criteria and number of years on ART and (2) follow-up variables: number of ART regimens received from the start of HIV treatment, total number of episodes of virological failure, number of documented resistance tests (phenotypic or genotypic tests) excluding those before ART if any, current viral load and current CD4+ cell count in the previous 12 months. Clinic-B Model includes only those variables available at baseline. Clinic-BF Model includes both baseline variables and available at follow-up.
Statistical analysisVariables were described using frequencies and percentages for qualitative variables and as mean and standard deviation for quantitative variables. Bivariate logistic regression analysis was used to study the factors associated with inclusion in the high cost group. Variables with a P-value <0.1 were included in the multivariate analysis. Possible collinearities between independent variables were analyzed using associations and regression analysis. The final model was selected using multivariate logistic regression using a stepwise method: variables with a P-value <0.1 were retained in the models. Two models were constructed, the first based on baseline factors exclusively and the second including follow-up variables, in order to study the possible modifying effect of medical intervention in the final score. After selecting the final model, we subjected it to internal and external validation using the three additional samples.
Internal validationThe model was validated using the bootstrapping technique: 100 random samples of HI patients were obtained from the initial population with the same sample size. The area under the curve (AUC) of the multivariate analysis was calculated for each of the 100 samples (see Appendix 2 for methodology remarks). This provided the standard error and its 95% confidence intervals (CI). The 2.5 and 97.5 percentiles of the AUC and their mean were calculated.11,12
External validationOnce the final index was modeled, it was applied to data from three tertiary hospitals in the same health region, HV1 (n=1461), HV2 (n=483), HV3 (n=2598) in order to evaluate the predictive capacity of the model.13 For each validation hospital, we defined the population with the highest individual cost that determined the 25% of the normalized total real cost. We evaluated the calibration and discrimination of the model when applied to the three validation samples. Discrimination was assessed using the AUC and the corresponding CI for each of the samples and comparing it with that observed for the HI sample (Appendix 2). The calibration study was examined using the Hosmer–Lemeshow statistic.14,15
Once the complexity score was obtained for the HI (see Appendix 3), the mean value of the index was calculated for each hospital as was the deviation from this mean relative to the mean value of the index of the four hospitals. The cost associated with the increase in each unit of the score was calculated using linear regression between the normalized real total cost per patient-year and the values of the index developed. The mean normalized estimated cost per patient-year was obtained by calculating the difference in euros using the deviation in the score of each hospital divided by the global mean score, indicating the correction in monetary terms that should be applied to each hospital. Application of this correction factor to the mean normalized total real cost per patient-year of each hospital provided the mean normalized total estimated cost per patient-year according to the level of complexity of each hospital.
The statistical analysis was made using the SPSS 18.0 for Windows statistical package.
Ethical aspectsThis study was carried out according to the basic ethical principles of the Declaration of Helsinki, Seoul, October 2008 and was approved by the Ethics Committee of the HI.16
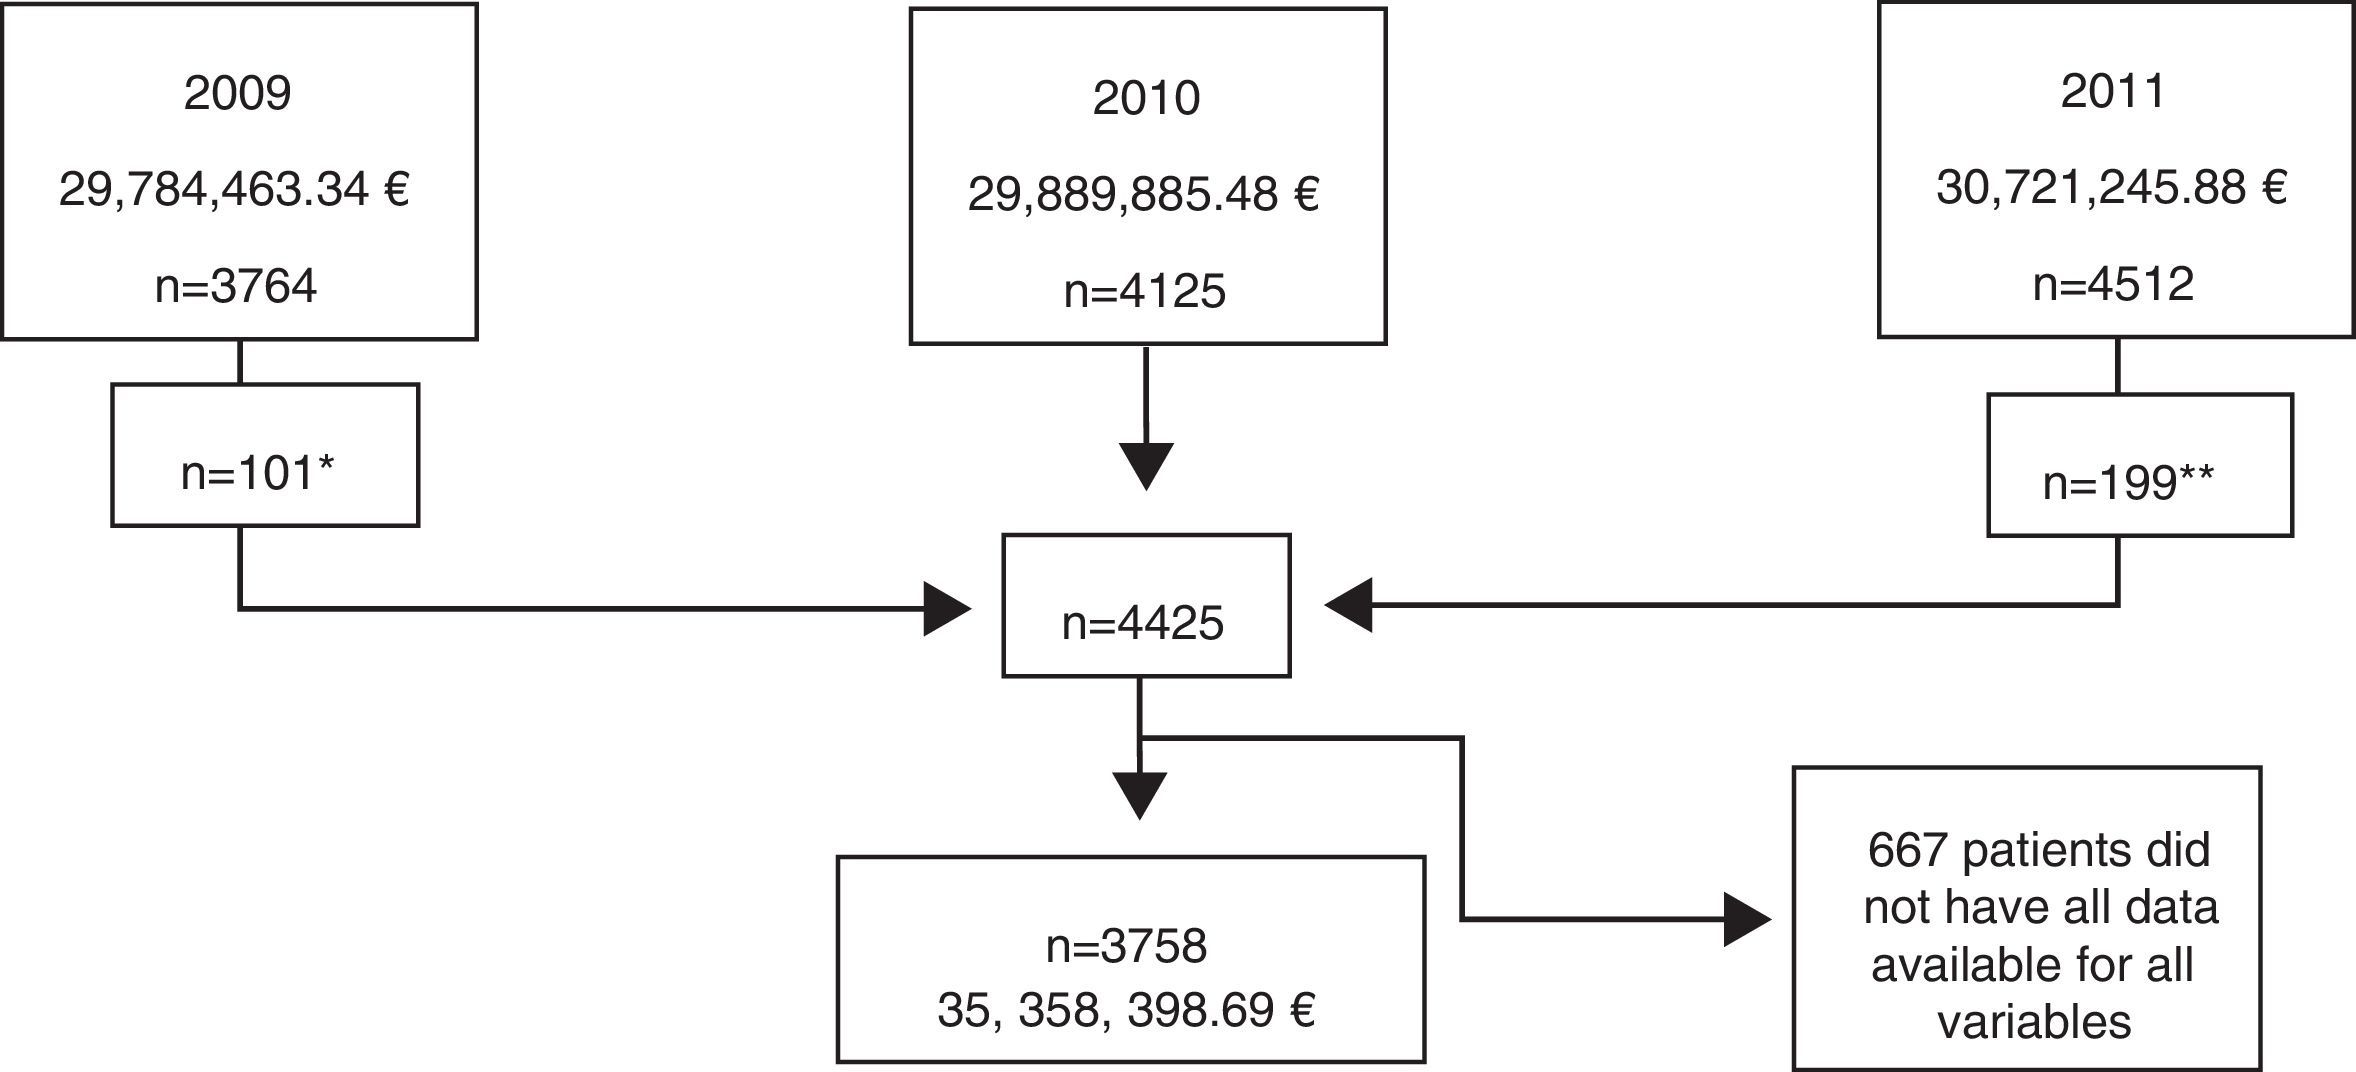
ResultsPopulation characteristics of the Hospital Index (HI)Data were obtained for the 4125 patients on ART registered from January 2009 to December 2011, resulting in a total population of 4425 patients (Fig. 1). After exclusion of patients without all data available for each of the variables, a final sample of 3758 patients was included in the analysis. The mean age was 44.2 years (SD 10.3), 77.3% (2907/3758) were male, 2907 (77.3%) had an undetectable current HIV-RNA viral load, 22.7% had criteria of AIDS (851/3758), 26.7% started ART before 1998, and 55.5% before 2005 (Table 1).
, indicating the year, the normalized (assuming all patients had received one complete year of treatment) real total cost and the number of patients included. Notes: *3.363 patients excluded as they were also registered in year 2010. **4.313 patients excluded as they were also registered in year 2010.")
Study population of the Hospital Index (HI), indicating the year, the normalized (assuming all patients had received one complete year of treatment) real total cost and the number of patients included. Notes: *3.363 patients excluded as they were also registered in year 2010. **4.313 patients excluded as they were also registered in year 2010.
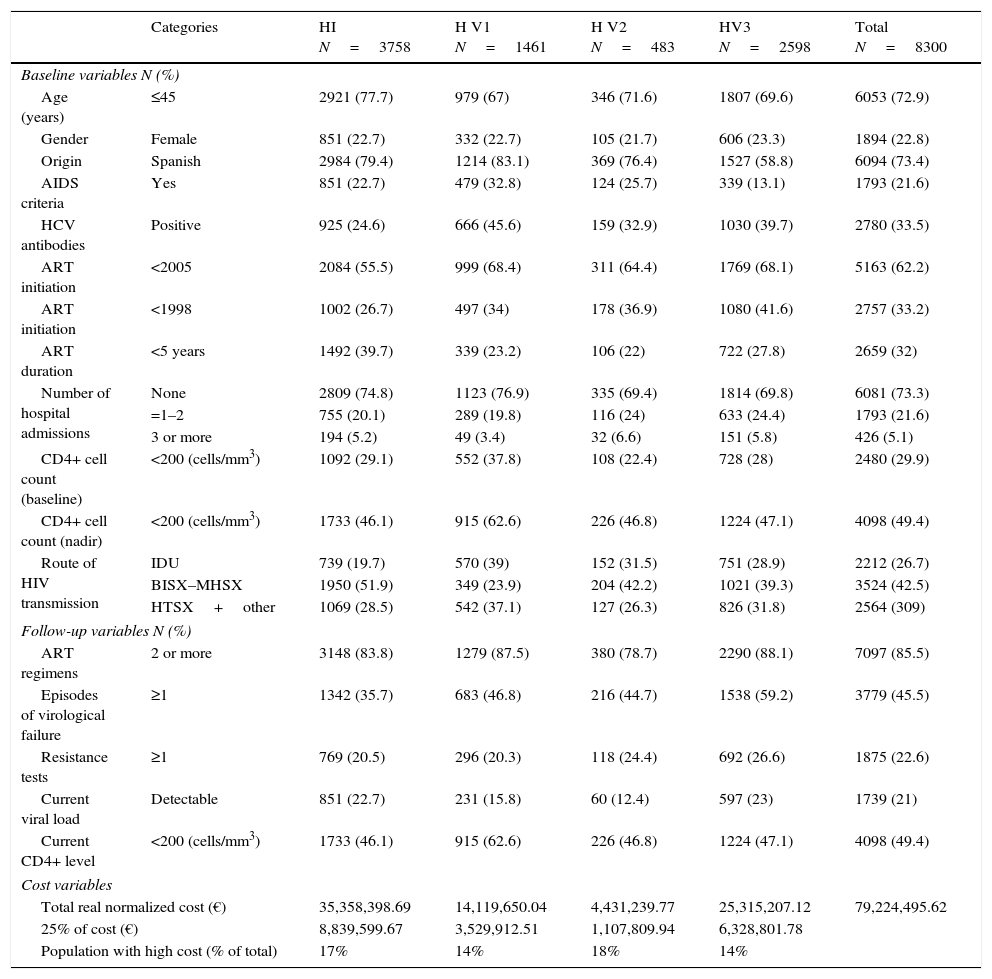
Baseline and follow up variables and cost characteristics of patients from the four study hospitals (Hospital Index or HI, and Validation Hospitals 1, 2 and 3 or HV1, HV2 and HV3).
| Categories | HI N=3758 | H V1 N=1461 | H V2 N=483 | HV3 N=2598 | Total N=8300 | |
|---|---|---|---|---|---|---|
| Baseline variables N (%) | ||||||
| Age (years) | ≤45 | 2921 (77.7) | 979 (67) | 346 (71.6) | 1807 (69.6) | 6053 (72.9) |
| Gender | Female | 851 (22.7) | 332 (22.7) | 105 (21.7) | 606 (23.3) | 1894 (22.8) |
| Origin | Spanish | 2984 (79.4) | 1214 (83.1) | 369 (76.4) | 1527 (58.8) | 6094 (73.4) |
| AIDS criteria | Yes | 851 (22.7) | 479 (32.8) | 124 (25.7) | 339 (13.1) | 1793 (21.6) |
| HCV antibodies | Positive | 925 (24.6) | 666 (45.6) | 159 (32.9) | 1030 (39.7) | 2780 (33.5) |
| ART initiation | <2005 | 2084 (55.5) | 999 (68.4) | 311 (64.4) | 1769 (68.1) | 5163 (62.2) |
| ART initiation | <1998 | 1002 (26.7) | 497 (34) | 178 (36.9) | 1080 (41.6) | 2757 (33.2) |
| ART duration | <5 years | 1492 (39.7) | 339 (23.2) | 106 (22) | 722 (27.8) | 2659 (32) |
| Number of hospital admissions | None | 2809 (74.8) | 1123 (76.9) | 335 (69.4) | 1814 (69.8) | 6081 (73.3) |
| =1–2 | 755 (20.1) | 289 (19.8) | 116 (24) | 633 (24.4) | 1793 (21.6) | |
| 3 or more | 194 (5.2) | 49 (3.4) | 32 (6.6) | 151 (5.8) | 426 (5.1) | |
| CD4+ cell count (baseline) | <200 (cells/mm3) | 1092 (29.1) | 552 (37.8) | 108 (22.4) | 728 (28) | 2480 (29.9) |
| CD4+ cell count (nadir) | <200 (cells/mm3) | 1733 (46.1) | 915 (62.6) | 226 (46.8) | 1224 (47.1) | 4098 (49.4) |
| Route of HIV transmission | IDU | 739 (19.7) | 570 (39) | 152 (31.5) | 751 (28.9) | 2212 (26.7) |
| BISX–MHSX | 1950 (51.9) | 349 (23.9) | 204 (42.2) | 1021 (39.3) | 3524 (42.5) | |
| HTSX+other | 1069 (28.5) | 542 (37.1) | 127 (26.3) | 826 (31.8) | 2564 (309) | |
| Follow-up variables N (%) | ||||||
| ART regimens | 2 or more | 3148 (83.8) | 1279 (87.5) | 380 (78.7) | 2290 (88.1) | 7097 (85.5) |
| Episodes of virological failure | ≥1 | 1342 (35.7) | 683 (46.8) | 216 (44.7) | 1538 (59.2) | 3779 (45.5) |
| Resistance tests | ≥1 | 769 (20.5) | 296 (20.3) | 118 (24.4) | 692 (26.6) | 1875 (22.6) |
| Current viral load | Detectable | 851 (22.7) | 231 (15.8) | 60 (12.4) | 597 (23) | 1739 (21) |
| Current CD4+ level | <200 (cells/mm3) | 1733 (46.1) | 915 (62.6) | 226 (46.8) | 1224 (47.1) | 4098 (49.4) |
| Cost variables | ||||||
| Total real normalized cost (€) | 35,358,398.69 | 14,119,650.04 | 4,431,239.77 | 25,315,207.12 | 79,224,495.62 | |
| 25% of cost (€) | 8,839,599.67 | 3,529,912.51 | 1,107,809.94 | 6,328,801.78 | ||
| Population with high cost (% of total) | 17% | 14% | 18% | 14% | ||
IDU, injection drug users; BISX, bisexuals; MHSX, male homosexuals; HTSX, heterosexuals; HCV, hepatitis C virus.
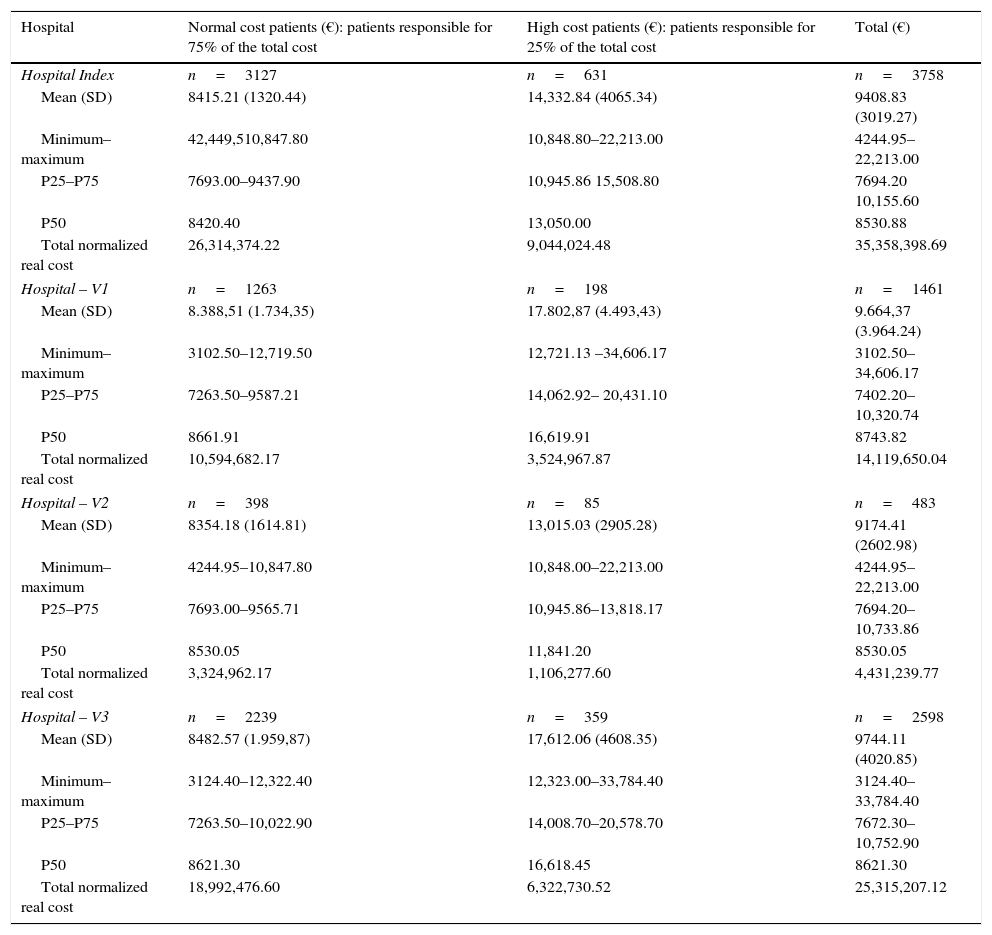
The normalized total real cost of ART was € 35,358,398.69 and the mean normalized real cost per patient-year was € 9408. The most-representative cutoff point was the 25% of the cost, which was € 8839, 599.67, and was accounted for by only 16.8% of patients (the most costly patients) (Table 1 and Appendix 4). The percentage of patients accounting for the 25% of the cost in the HV1, HV2 and HV3 hospitals were also around 15% and can be seen in Table 1.
The mean, median, minimum, maximum and interquartile range of the normalized real cost of ART per patient-year in the HI and in the HV1, HV2 and HV3 hospitals can be seen in Appendix 5.
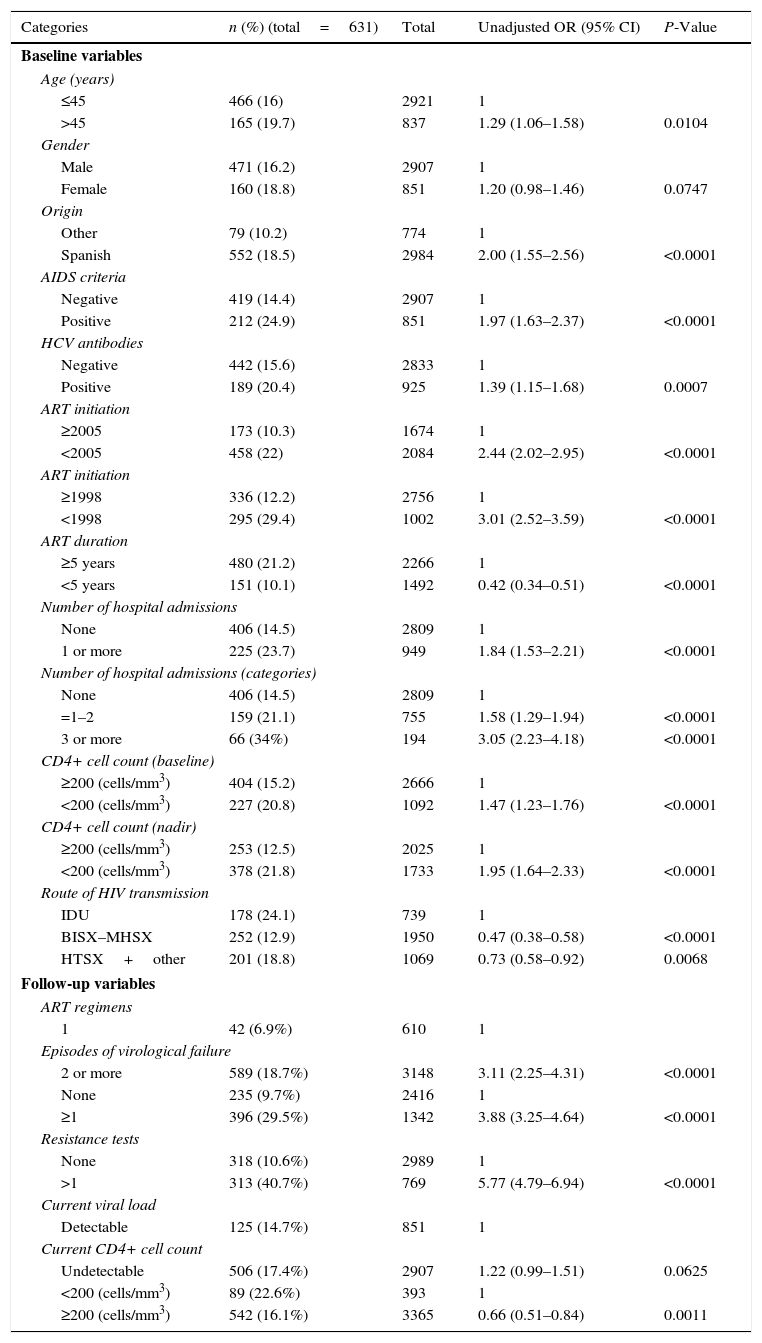
Bivariate and multivariate analysis for the HIAll baseline and follow-up variables studied by bivariate analysis (Table 2) showed a statistically significant association with high cost (P<0.1), and were included in the multivariate analysis.
Bivariate analysis of the Hospital Index or HI (n=3758).
| Categories | n (%) (total=631) | Total | Unadjusted OR (95% CI) | P-Value |
|---|---|---|---|---|
| Baseline variables | ||||
| Age (years) | ||||
| ≤45 | 466 (16) | 2921 | 1 | |
| >45 | 165 (19.7) | 837 | 1.29 (1.06–1.58) | 0.0104 |
| Gender | ||||
| Male | 471 (16.2) | 2907 | 1 | |
| Female | 160 (18.8) | 851 | 1.20 (0.98–1.46) | 0.0747 |
| Origin | ||||
| Other | 79 (10.2) | 774 | 1 | |
| Spanish | 552 (18.5) | 2984 | 2.00 (1.55–2.56) | <0.0001 |
| AIDS criteria | ||||
| Negative | 419 (14.4) | 2907 | 1 | |
| Positive | 212 (24.9) | 851 | 1.97 (1.63–2.37) | <0.0001 |
| HCV antibodies | ||||
| Negative | 442 (15.6) | 2833 | 1 | |
| Positive | 189 (20.4) | 925 | 1.39 (1.15–1.68) | 0.0007 |
| ART initiation | ||||
| ≥2005 | 173 (10.3) | 1674 | 1 | |
| <2005 | 458 (22) | 2084 | 2.44 (2.02–2.95) | <0.0001 |
| ART initiation | ||||
| ≥1998 | 336 (12.2) | 2756 | 1 | |
| <1998 | 295 (29.4) | 1002 | 3.01 (2.52–3.59) | <0.0001 |
| ART duration | ||||
| ≥5 years | 480 (21.2) | 2266 | 1 | |
| <5 years | 151 (10.1) | 1492 | 0.42 (0.34–0.51) | <0.0001 |
| Number of hospital admissions | ||||
| None | 406 (14.5) | 2809 | 1 | |
| 1 or more | 225 (23.7) | 949 | 1.84 (1.53–2.21) | <0.0001 |
| Number of hospital admissions (categories) | ||||
| None | 406 (14.5) | 2809 | 1 | |
| =1–2 | 159 (21.1) | 755 | 1.58 (1.29–1.94) | <0.0001 |
| 3 or more | 66 (34%) | 194 | 3.05 (2.23–4.18) | <0.0001 |
| CD4+ cell count (baseline) | ||||
| ≥200 (cells/mm3) | 404 (15.2) | 2666 | 1 | |
| <200 (cells/mm3) | 227 (20.8) | 1092 | 1.47 (1.23–1.76) | <0.0001 |
| CD4+ cell count (nadir) | ||||
| ≥200 (cells/mm3) | 253 (12.5) | 2025 | 1 | |
| <200 (cells/mm3) | 378 (21.8) | 1733 | 1.95 (1.64–2.33) | <0.0001 |
| Route of HIV transmission | ||||
| IDU | 178 (24.1) | 739 | 1 | |
| BISX–MHSX | 252 (12.9) | 1950 | 0.47 (0.38–0.58) | <0.0001 |
| HTSX+other | 201 (18.8) | 1069 | 0.73 (0.58–0.92) | 0.0068 |
| Follow-up variables | ||||
| ART regimens | ||||
| 1 | 42 (6.9%) | 610 | 1 | |
| Episodes of virological failure | ||||
| 2 or more | 589 (18.7%) | 3148 | 3.11 (2.25–4.31) | <0.0001 |
| None | 235 (9.7%) | 2416 | 1 | |
| ≥1 | 396 (29.5%) | 1342 | 3.88 (3.25–4.64) | <0.0001 |
| Resistance tests | ||||
| None | 318 (10.6%) | 2989 | 1 | |
| >1 | 313 (40.7%) | 769 | 5.77 (4.79–6.94) | <0.0001 |
| Current viral load | ||||
| Detectable | 125 (14.7%) | 851 | 1 | |
| Current CD4+ cell count | ||||
| Undetectable | 506 (17.4%) | 2907 | 1.22 (0.99–1.51) | 0.0625 |
| <200 (cells/mm3) | 89 (22.6%) | 393 | 1 | |
| ≥200 (cells/mm3) | 542 (16.1%) | 3365 | 0.66 (0.51–0.84) | 0.0011 |
HCV, hepatitis C virus; CI, confidence interval; OR, odds ratio; ART, antiretroviral treatment; IDU, injection drug users; BISX, bisexuals; MHSX, male homosexual; HTSX, heterosexuals.
Analysis of collinearities resulted in the exclusion from the final model of the following variables: presence of HCV antibodies, years on ART treatment, number of resistance tests, and current level of CD4+ cell count.
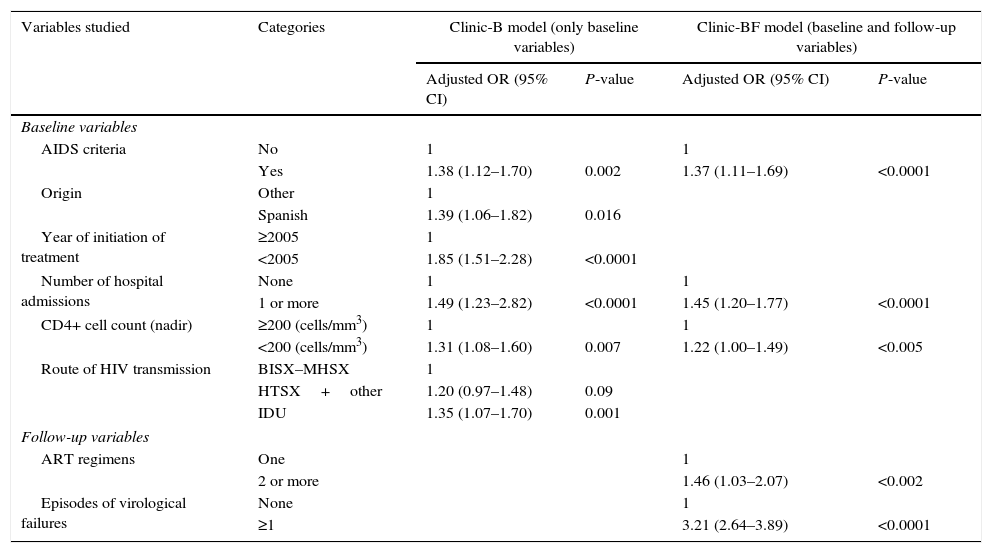
In Clinic-B model (Table 3), six variables were significantly associated with high cost: AIDS criteria, Spanish nationality, starting ART before year 2005, ≥1 hospital admissions, a CD4+ cell count nadir <200cells/mm3 and the route of HIV transmission (intravenous drug users had a 35% of risk increased of having a high cost than homosexual/bisexual patients, but heterosexual or other groups had a 20% of risk increase of having a higher cost than male homosexuals). In Clinic-BF model (Table 3), AIDS criteria remained significant, while Spanish nationality, year of initiation of treatment and route of HIV transmission did not retain statistical significance. Patients with ≥1 hospital admission and those with a CD4+ cell count nadir <200cells/mm3 had a 45% and 22% greater risk of a high cost, respectively. Follow-up variables associated with high cost were the number of ART regimens and one or more episodes of virological failures. The AUC was 0.66 for Clinic-B model and 0.70 for Clinic-BF model. The Hosmer–Lemeshow goodness of fit test showed a good fit for the two models (Appendix 6).
Result of the multivariate analysis of the Hospital Index (HI). Significant predictors of the high cost of ART in both models.
| Variables studied | Categories | Clinic-B model (only baseline variables) | Clinic-BF model (baseline and follow-up variables) | ||
|---|---|---|---|---|---|
| Adjusted OR (95% CI) | P-value | Adjusted OR (95% CI) | P-value | ||
| Baseline variables | |||||
| AIDS criteria | No | 1 | 1 | ||
| Yes | 1.38 (1.12–1.70) | 0.002 | 1.37 (1.11–1.69) | <0.0001 | |
| Origin | Other | 1 | |||
| Spanish | 1.39 (1.06–1.82) | 0.016 | |||
| Year of initiation of treatment | ≥2005 | 1 | |||
| <2005 | 1.85 (1.51–2.28) | <0.0001 | |||
| Number of hospital admissions | None | 1 | 1 | ||
| 1 or more | 1.49 (1.23–2.82) | <0.0001 | 1.45 (1.20–1.77) | <0.0001 | |
| CD4+ cell count (nadir) | ≥200 (cells/mm3) | 1 | 1 | ||
| <200 (cells/mm3) | 1.31 (1.08–1.60) | 0.007 | 1.22 (1.00–1.49) | <0.005 | |
| Route of HIV transmission | BISX–MHSX | 1 | |||
| HTSX+other | 1.20 (0.97–1.48) | 0.09 | |||
| IDU | 1.35 (1.07–1.70) | 0.001 | |||
| Follow-up variables | |||||
| ART regimens | One | 1 | |||
| 2 or more | 1.46 (1.03–2.07) | <0.002 | |||
| Episodes of virological failures | None | 1 | |||
| ≥1 | 3.21 (2.64–3.89) | <0.0001 | |||
CI, confidence interval; OR, odds ratio; ART, antiretroviral treatment; IDU, injection drug users; BISX, bisexuals; MHSX, male homosexuals; HTSX, heterosexuals.
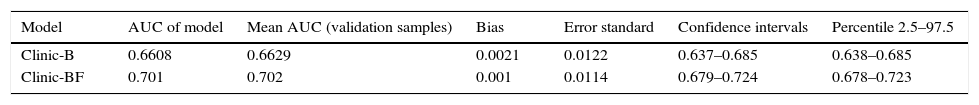
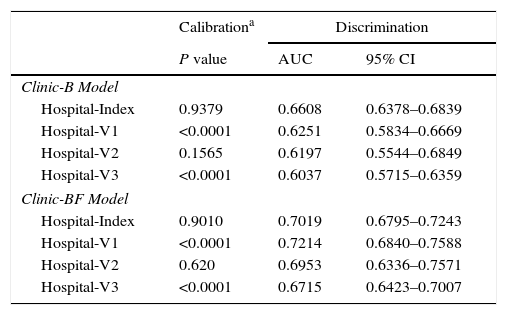
In the internal validation, the approximate CI and the interval of percentiles (percentile 2.5 and 97.5) showed that the AUC of the two regression models studied was within the expected parameters, with a bias of <0.001. The AUC of both models respected the interval between the 2.5 and 97.5 percentiles, thus showing a good fit (Appendix 6). AUC values for external validation were close to observed value in HI model in all validation samples suggesting good discrimination. Hosmer–Lemeshow tests of the accuracy of calibration showed that 2 of the 3 validation centers were detectably less than perfect (P<0.05), with all of the models tending to predict better outcomes than were observed. The Hosmer–Lemeshow test showed that these were not perfectly calibrated but the calibration appears to be adequate for a model that accurately distinguishes patients in the high cost group from those in the normal-low cost group (Appendix 7).
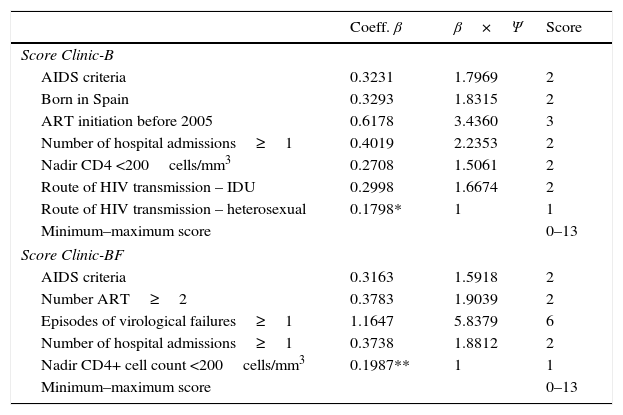
Complexity scores (Clinic-B and Clinic-BF scores)A score ranging from 0 (for absence) up to 6 (for presence) was calculated and assigned to all the variables selected in both models. The Clinic-B scores ranged from 0 to 13 and the same was the case for the Clinic-BF scores (see Table 4).
β coefficients, normalized β coefficients (β×Ψ) and assigned score for each variable in the logistic regression analysis for both models.
| Coeff. β | β×Ψ | Score | |
|---|---|---|---|
| Score Clinic-B | |||
| AIDS criteria | 0.3231 | 1.7969 | 2 |
| Born in Spain | 0.3293 | 1.8315 | 2 |
| ART initiation before 2005 | 0.6178 | 3.4360 | 3 |
| Number of hospital admissions≥1 | 0.4019 | 2.2353 | 2 |
| Nadir CD4 <200cells/mm3 | 0.2708 | 1.5061 | 2 |
| Route of HIV transmission – IDU | 0.2998 | 1.6674 | 2 |
| Route of HIV transmission – heterosexual | 0.1798* | 1 | 1 |
| Minimum–maximum score | 0–13 | ||
| Score Clinic-BF | |||
| AIDS criteria | 0.3163 | 1.5918 | 2 |
| Number ART≥2 | 0.3783 | 1.9039 | 2 |
| Episodes of virological failures≥1 | 1.1647 | 5.8379 | 6 |
| Number of hospital admissions≥1 | 0.3738 | 1.8812 | 2 |
| Nadir CD4+ cell count <200cells/mm3 | 0.1987** | 1 | 1 |
| Minimum–maximum score | 0–13 | ||
ART, antiretroviral treatment; β, beta coefficient from logistic model; IDU, injection drug users.
Ψ=1/0.1798*=5.56 for Clinic-B model and Ψ=1/0.1987**=5.03 for Clinic-BF model.
See also Appendix 6.
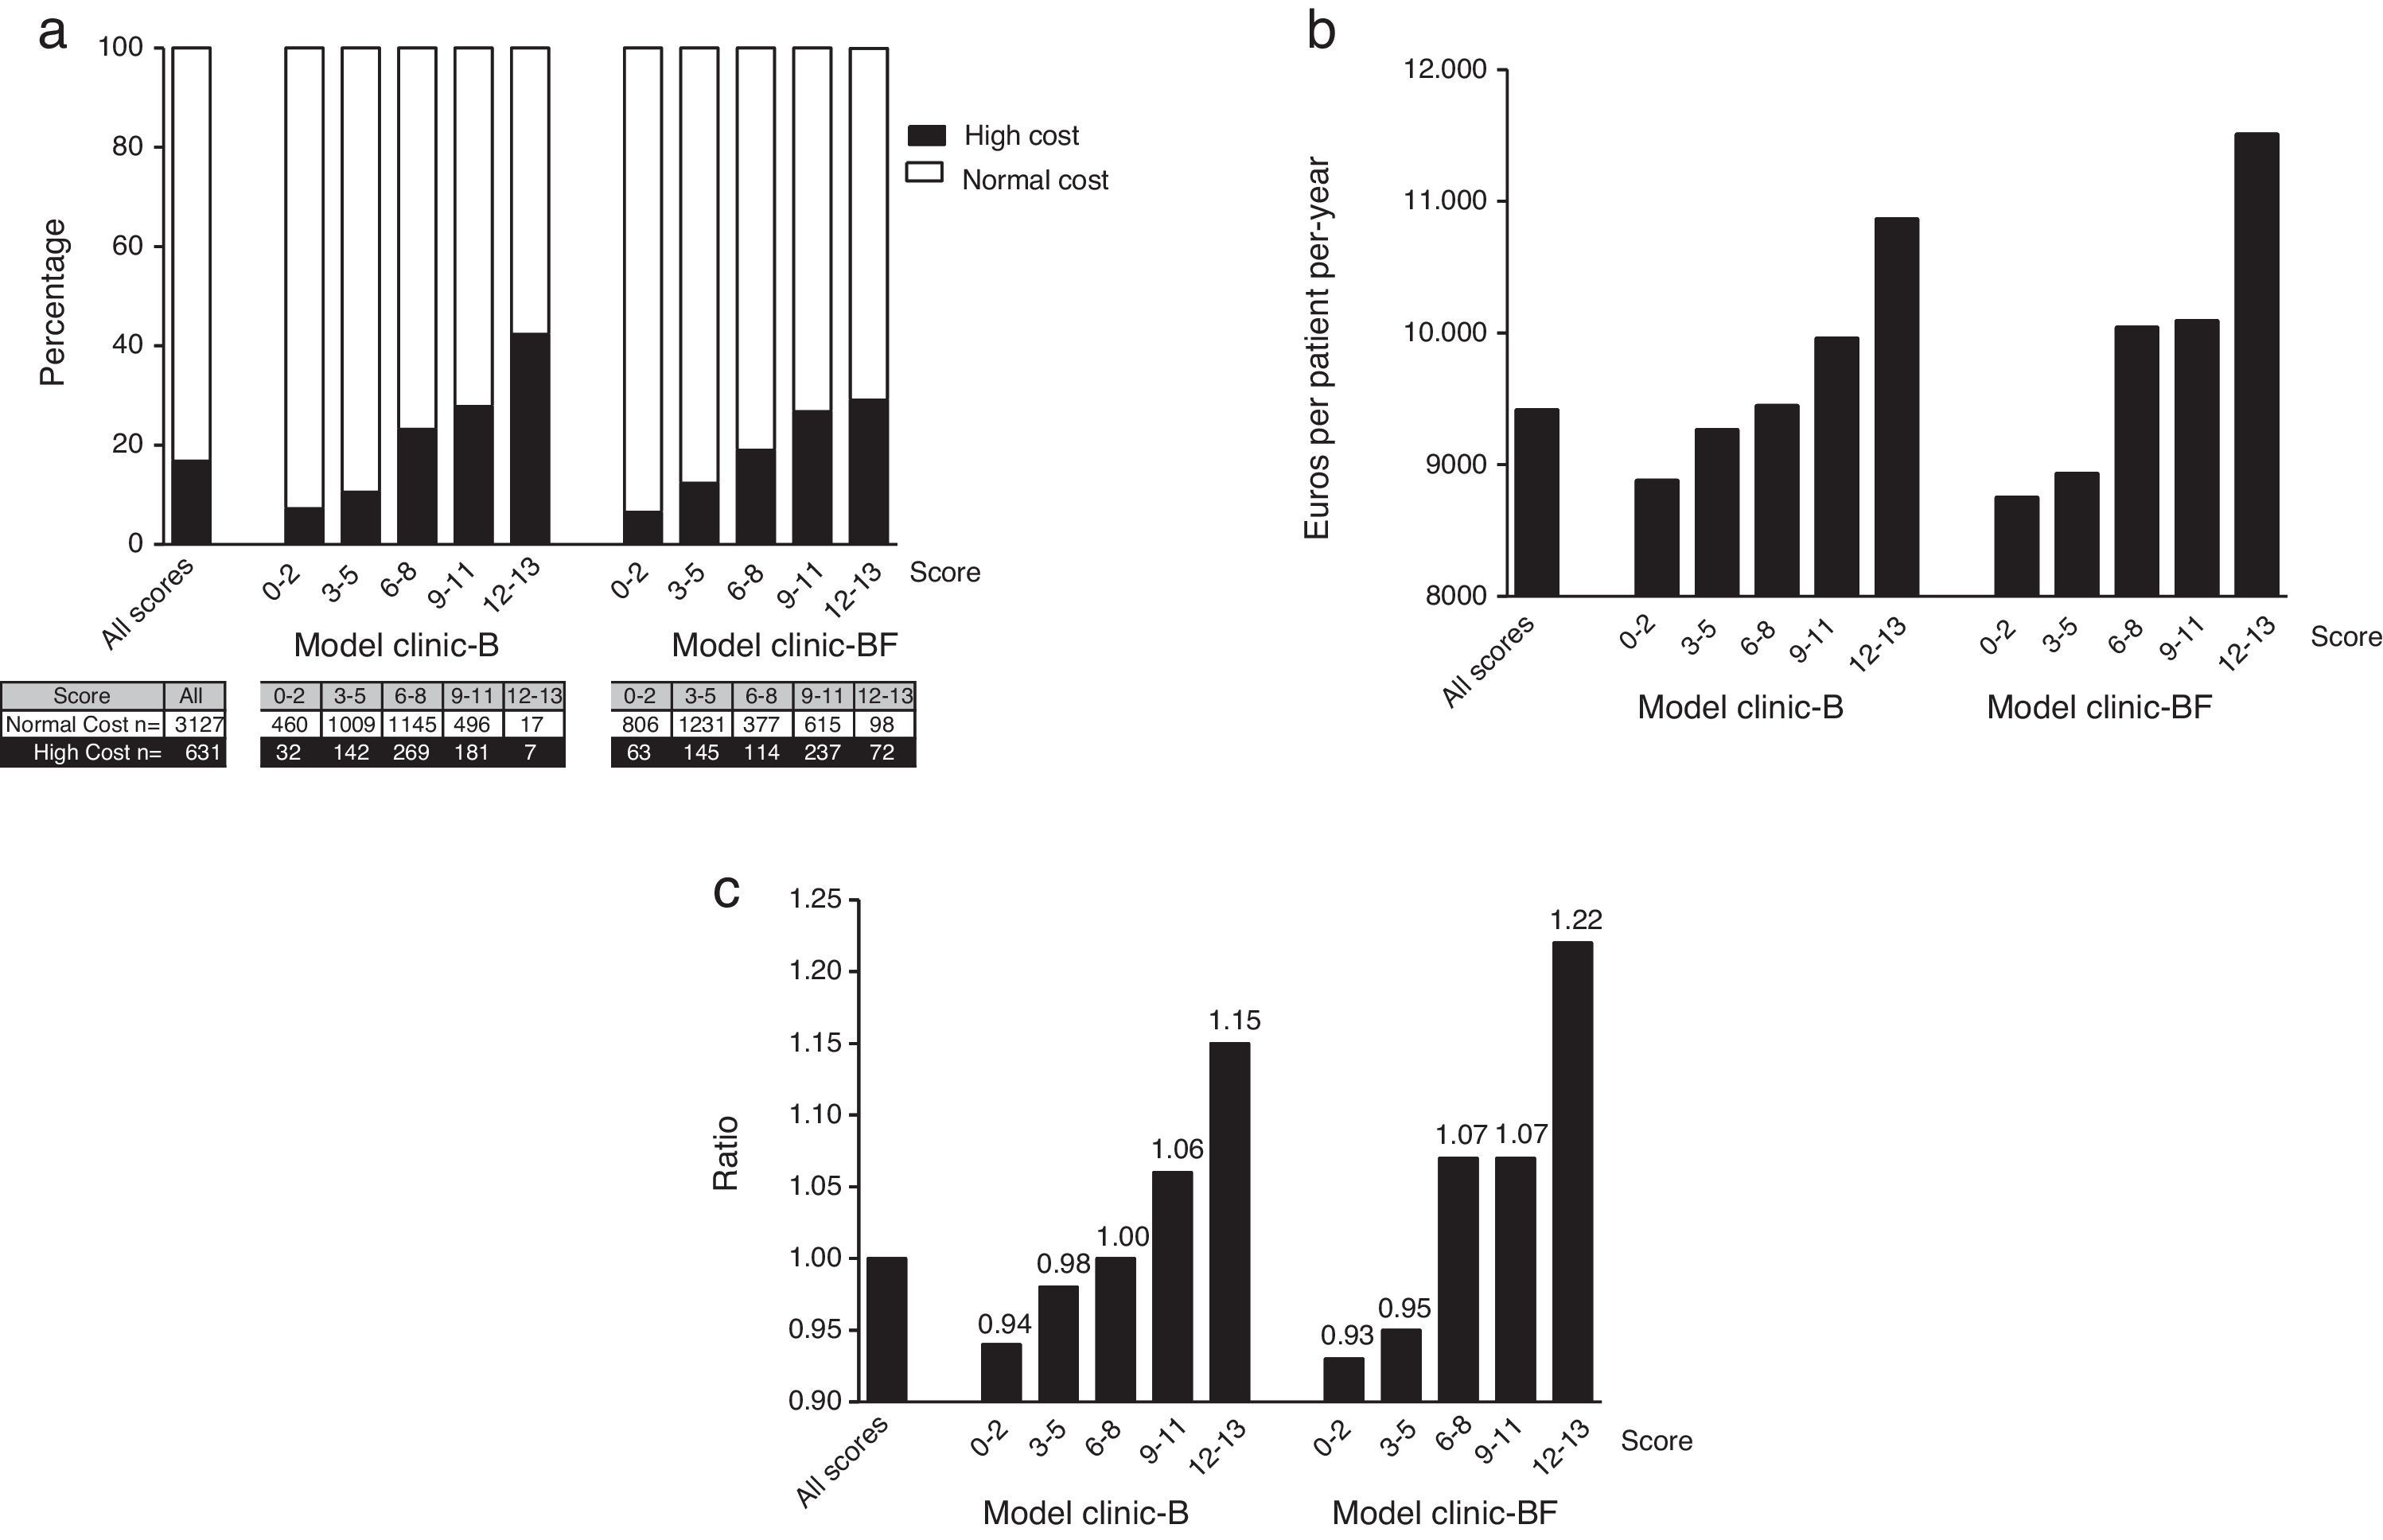
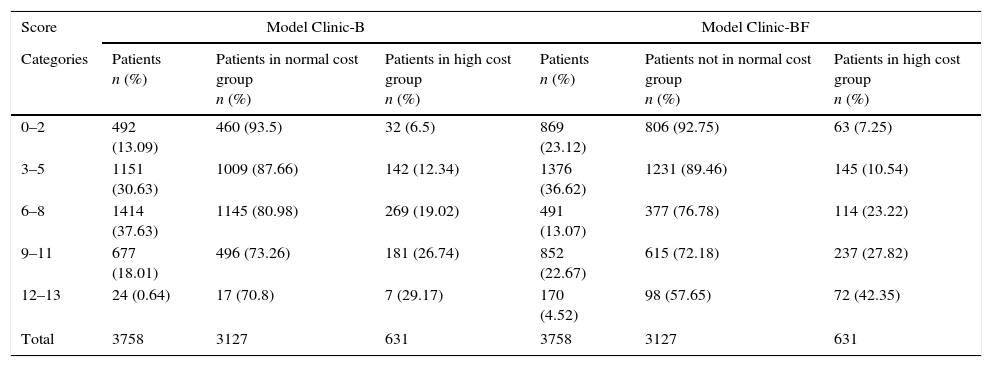
In both models the normal cost tended to concentrate in the lower score groups. Conversely the higher cost patients do concentrate in the higher score groups (see Appendix 8 and Fig. 2a).
 according to score ranges for both models: (a) distribution of the high cost (n=631) and normal cost (n=3127) patients (the ascending distribution shows that most high cost patients (in black) where assigned a high complexity score); (b) distribution of the mean normalized real cost per patient-year and (c) distribution of ratios between mean normalized real cost per patient-year of each score range and mean normalized real cost per patient-year of all population (all scores).")
Distribution of the 3758 patients of the Hospital Index (HI) according to score ranges for both models: (a) distribution of the high cost (n=631) and normal cost (n=3127) patients (the ascending distribution shows that most high cost patients (in black) where assigned a high complexity score); (b) distribution of the mean normalized real cost per patient-year and (c) distribution of ratios between mean normalized real cost per patient-year of each score range and mean normalized real cost per patient-year of all population (all scores).
The normalized mean real cost of the 3758 patients of the HI within the different score ranges for both models can be seen in Fig. 2b. Note that mean normalized real cost is higher among the patients with higher scores (Fig. 2c).
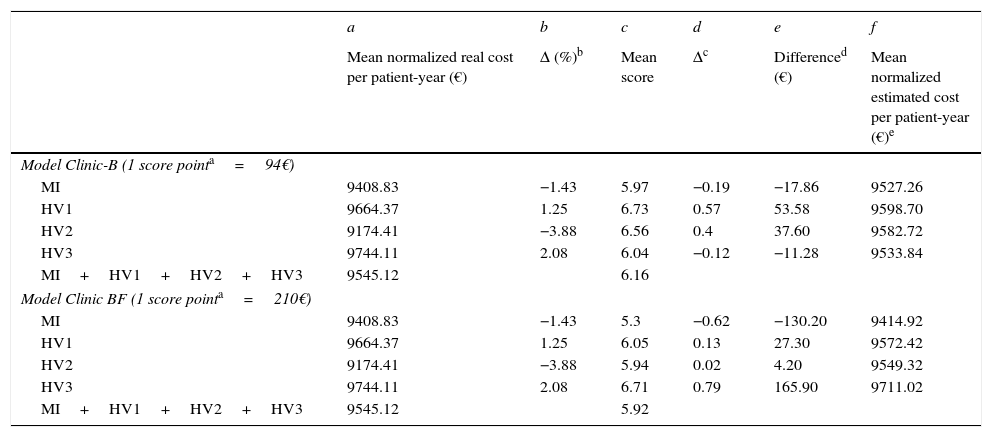
In Table 5 we have calculated the normalized estimated (after adjusting for the complexity scores) cost for both models and compared with the normalized real costs. Note that in two centers (HI and HV2) in both models the real costs were below the estimated (expected) costs. These two centers are saving money. Conversely in HV1 and HV3 the expected costs were under the real costs. The expenses of these two centers in ART were above the expectations. Also note that the difference between the complexity scores (for both models) and between the real and the expected costs (also in both models) were relatively small (<5%).
Comparison between normalized real and estimated (adjusted by complexity score) cost per patient-year for the Hospital index (HI) and for the validation HV1, HV2 and HV3 hospitals. Note that in both models, the differences between the four centers referring to the normalized real and estimated costs per patient-year are less than 6% in Clinic-B model and less than 3% in Clinic-BF model.
| a | b | c | d | e | f | |
|---|---|---|---|---|---|---|
| Mean normalized real cost per patient-year (€) | Δ (%)b | Mean score | Δc | Differenced (€) | Mean normalized estimated cost per patient-year (€)e | |
| Model Clinic-B (1 score pointa=94€) | ||||||
| MI | 9408.83 | −1.43 | 5.97 | −0.19 | −17.86 | 9527.26 |
| HV1 | 9664.37 | 1.25 | 6.73 | 0.57 | 53.58 | 9598.70 |
| HV2 | 9174.41 | −3.88 | 6.56 | 0.4 | 37.60 | 9582.72 |
| HV3 | 9744.11 | 2.08 | 6.04 | −0.12 | −11.28 | 9533.84 |
| MI+HV1+HV2+HV3 | 9545.12 | 6.16 | ||||
| Model Clinic BF (1 score pointa=210€) | ||||||
| MI | 9408.83 | −1.43 | 5.3 | −0.62 | −130.20 | 9414.92 |
| HV1 | 9664.37 | 1.25 | 6.05 | 0.13 | 27.30 | 9572.42 |
| HV2 | 9174.41 | −3.88 | 5.94 | 0.02 | 4.20 | 9549.32 |
| HV3 | 9744.11 | 2.08 | 6.71 | 0.79 | 165.90 | 9711.02 |
| MI+HV1+HV2+HV3 | 9545.12 | 5.92 | ||||
Cost in euros to increase 1 point score calculated from linear regression between mean normalized real cost per patient year and score.
Δ (%): percentage of deviation with respect to the mean cost per patient-year of the four centers. b=(a−9545.12)/9545.12×100.
Our results show that approximately 15% of patients treated in the HI were responsible for about 25% of the total cost of ART. The Pareto principle has been generalized and applied to various studies of health spending in the United States and shows that 20% of the population is responsible for approximately 80% of direct medical cost, and this subgroup can be designated as high cost patient.10 This concentration does exist in ART but is not so high.
Some clinical variables, such as AIDS criteria or previous hospital admissions were associated with greater complexity and also higher cost. The association between Spanish origin and high cost may be due to the greater compliance with ART in immigrants, who might be motivated by the incentive of a free access to medication or to other peculiarities related with native Spanish population.17,18 Higher clinical complexity and higher cost were significantly associated with the HIV transmission route. Homosexual/bisexual patients showed the lower cost and complexity in the analysis. Both heterosexual and intravenous drug user mode of transmission were associated with higher level of clinical complexity and ART cost. The incremental distribution of the ART cost can be explained by the low clinical complexity of the HMX/BSX population combined with psychosocial factors such us treatment acceptance, HIV community support and access to information. In addition, the increasing number of gay men living with HIV in Catalonia has resulted in public health campaigns with the involvement of NGO's and other social and healthcare actors in the region. Both facts combined with early diagnosis campaigns oriented to LGBT collectives and with the e-communication generation have resulted in a young healthy LGBT population living with HIV and with a good access to health and sexual education. Nevertheless, all this efforts should be increased in order to prevent new cases and to cover the most vulnerable groups within this population. HIV-transmission by heterosexual route implies a delay in diagnosis, and is associated with a higher cost in Catalonia and in other European regions.19,20 Follow-up variables associated with high cost were two or more antiretroviral regimens and number of episodes of virological failure. Both are associated with the complexity of the treatment and with a greater difficulty for disease control.
High cost was associated with the complexity of the population served. Clinic-B model was more sensitive to baseline clinical characteristics as was expected. Conversely, Clinic-BF model better reflected the variability associated with medical care. The HI had a normalized mean real cost per patient-year lower than that estimated or expected by the two models, suggesting that spending in the HI was smaller than expected according to patient complexity. Conversely HV1 and HV3 had normalized real costs per patient-year higher than estimated costs. AUC near to 0.70 were found for both models, and the calculations may be considered correct.21 Our results suggest that the heterogeneity of the cost per patient-year between hospitals may be influenced by the variability of the population served and not only by clinical practice, as the final cost was associated with the clinical complexity of each reference population.22 Both models were useful in calculating the annual costs per patient adjusted for complexity, indicating that the presence or absence in the model of factors related to clinical practice does not change the predictive ability, and therefore it can be assumed that the results mainly depended on the characteristics of the population. The proposed model offers the possibility of adjusting annual budgets for antiretrovirals based on the complexity of the populations served and not only on the predictions made according to the previous year activity, the number of patients or the recommendations from experts or guidelines.
The strengths of the study include the large sample size, and the external validation of the models. The limitations of the study include the variability in the use of ART and the type of patients seen at the different hospitals. The HI might have different characteristics due to the health area served and to the transfer of patients with difficult-to-control therapeutic profiles reflecting its high specialization. HI patients may represent a higher percentage of men who have sex with men, and this may not be extrapolated to other groups of patients with HIV/AIDS. The score obtained required specific variables for its calculation, which may or may not be available in the databases of other hospitals, thus limiting its applicability. For this reason, only relatively easy-to-obtain variables were included in the study. The limitations of predictive models in predicting individual responses have been widely studied in other risk models.23 However, the consistency of our study was not compromised since the prediction was based on population-level costs. We could have obtained a more-accurate figure using the direct β coefficients of the logistic regression. However, this would have made calculating and reproducing the score more difficult.21 We believe that the cost score obtained is valid due to the consistency of the results and the representativeness of the study sample. Finally, further variables could be added to the model to increase its accuracy.
Correct distribution and allocation of health resources to hospitals with more-complex patients is essential for a more precise management of available resources. The cost adjustment model presented offers clear advantages over the method of assigning pharmaceutical budgets considering only previous spending. The model identifies distribution of vulnerable populations as the cause of cost differences between reference hospitals, excluding the physician's prescription habits. Models with these characteristics depend on the quantity and quality of data included in the calculation, so the ability to adjust the model improves as more data are incorporated.24 The methodology presented should be reproduced in more reference hospitals to increase the power of the model. With the current availability of health information, it is possible to generate software to calculate costs adjusted for clinical complexity using direct hospital data.25 This model is one step in the calculation of costs, but further large-scale studies including more variables are necessary.26
Estimating the cost per patient based on the score presented in this study (AIDS criteria, country of origin, year of initiation of treatment, number of hospital admissions, CD4+ cell count nadir and route of transmission) may aid in negotiations between hospitals and funding bodies. This may facilitate proper funding in clinical settings where HIV patients are clinically more complex.
ConclusionThe clinical complexity of HIV patients influences the cost of ART explaining the differences in the cost per patient between hospitals in the region. The Clinic-B and Clinic-BF scores predicted patients with a high cost of ART depending on clinical variables not associated with the physicians’ clinical practice. This scoring methodology can be reproduced in other settings in order to identify populations or regions with a high clinical complexity. This may help to understand the differences between hospitals or areas in ART costs and can be used to compare and allocate costs corrected for the clinical complexity of patients.
Conflicts of interestNo potential conflicts of interest were disclosed.
FundingThis work was supported in part by Subdireccion General de Redes of the Instituto de Salud Carlos III and RIS (RD12/0017).
Author contributionsConceived and designed the study: J.M.G, I.P and C.V. Performed the study: J.M.G, I.P and C.V and M.M. Analyzed the data: I.P, C.V and J.M.G. Wrote the paper: C.V and I.P. All the authors contributed to the study development and made comments on the paper and methodology.
To the memory of I. Pérez, a great professional and a better person. Special thanks to X. Salvador (Divisió d’Anàlisi de la Demanda i l’Activitat, CatSalut, Generalitat de Catalunya), M. Tuset and C. Codina (Hospital Pharmacy Service, Hospital Clínic de Barcelona, Spain), A.J. Arkaitz (HIV Unit, Infectious Disease Service, Hospital Universitari de Bellvitge, L’Hospitalet, Barcelona, Spain), J. Muñoz (Infectious Disease and HIV Service, Hospital Sant Pau, Spain), B. Clotet (IrsiCaixa, Unitat VIH, Hospital Germans Trias i Pujol, Badalona; UAB, UVic), J. Arribas (Infectious Disease and HIV Service, Hospital La Paz, Spain) and A.J. Blasco (Técnicas Avanzadas de Investigación en Servicios de Salud, Madrid, Spain), for his contribution to this article.
The main dichotomous variable, defined as high cost, used as the response variable in the logistic regression analysis was defined by a cut-off of the population with the highest individual cost that determined the 25% of the normalized total real cost.
The cut-off point for the variable high cost was established by calculating the percentages of patients responsible for the different masses of high normalized real cost. The definition of real cost is the amount billed by the hospital to national health system (total or per patient-year). Sensitivity analyzes were repeated for different cut-off points in order to evaluate different cut-off points. Distributions of high cost groups that were too small to generate stable regression models were found. For this reason, the most-representative cut-off point chosen was the 25% top cost, i.e., that which showed the greatest cost for the smallest mass of the sample, and assuming that this group represented a high percentage of the real total cost of ART treatment.
The ROC (receiver operating characteristic) curve and the area under the ROC curve (AUC) are commonly used to assess binary response models such as logistic models. It is a common practice to validate predictive models the use of a validation data set and to produce an ROC curve and estimate its area (AUC). AUCs for validation of models are commonly considered statistically acceptable when their value is bigger than 0.60. Confidence intervals (CI) can be calculated when mean AUC for different set of data is calculated. This CI is used to assess if the mean AUC value is significantly higher than the minimum (0.60) to consider the model as “fit”.
The internal validation of a scoring model can be optimistically biased if the data used to fit the model are also used in the assessment of the model. The way of dealing with this is to perform a cross validation (bootstrapping) which provides an unbiased assessment of the model without reducing the training data set. Once the model is reproduced using 100 random samples of the set of original patients the AUC for each of the 100 random samples is calculated.
To perform the internal validation the AUC of the model was calculated with the Hospital Index dataset (first column, Appendix 6). The mean AUC of the validation sample was calculated using the 100 random datasets (second column, Appendix 6). We also calculated the standard error and its 95% CI to ensure that the obtained values where significantly higher than 0.60. The results showed in Appendix 3 show that the internal validation of the model is successful as the AUC are higher than the agreed minimum value of 0.60.
The external validation of the model is calculated in the same way, but this time comparing the AUCs of the model with the different hospitals datasets. The difference with the internal validation presented before is the dataset used to validate the model. In the internal validation all data comes from the Hospital Index, The AUC of the model is compared with the mean AUC of the bootstrapping sample. Whereas in the external validation the data reported by the Validation Hospitals is compared to the Hospital Index by using the value of the resulting AUCs.
Hosmer–Lemeshow statistic is a conventional statistical test used to calibrate differences between AUCs. In external validation it is used to compare the AUC of the different Validation Hospitals Models to the Hospital Index Model.
The variables that were significant in the multivariate analysis were used to derive the score assigned to each variable in both models.21 The score assigned to each variable that was significant in the multivariate analysis was derived from the β coefficient. All the beta coefficients were normalized by multiplying by Ψ and rounded up or down to the nearest integer, so that the lowest had a value “1”. The value of Ψ was 1/lowest β coefficient.27
The β coefficient of the variable heterosexual route of HIV transmission was chosen to calculate Ψ in Clinic-B model, as it proved to have the lowest value in the model (β=0.1798), and was adjudicated a value of 1 in the score. We successively multiplied the β coefficients of the remaining variables in the model, configuring the score as shown in Table 4. Since the sum of the total of values of the score equals 13, it determines a range of 0–13 for the score of Clinic-B model. Clinic-BF Model had a minimum β coefficient of 0.1987 which, after calculation, provided Ψ=5.03271. Therefore the model rated variable CD4+ cell count (nadir) as “1” the variable number of virological failure as “6” and gave values of “2” to the other three variables. The range obtained was also 0–13 (Table 4).
For example, an individual from the treated population presenting AIDS criteria (score=2), who had received a single antiretroviral regimen (score=0), had one virological failure (score=6), had been admitted one or more times (score=2) and whose CD4+ cell count (nadir) was >200cells/mm3 (score=0), would have a total score of 2+2+6=10. From this individual score, the mean score of the hospital was calculated (sum of the individual scores of each patient divided by the number of patients).
| Mass of cost | Total cost (€) | Percentage |
|---|---|---|
| 25% | 8,839,599.67 | 16.79%a |
| 40% | 14,143,359.48 | 30.87% |
| 50% | 17,679,199.35 | 41.01% |
| 80% | 28,286,718.95 | 75.31% |
| 100% | 35,358,398.69 | 100% |
| Hospital | Normal cost patients (€): patients responsible for 75% of the total cost | High cost patients (€): patients responsible for 25% of the total cost | Total (€) |
|---|---|---|---|
| Hospital Index | n=3127 | n=631 | n=3758 |
| Mean (SD) | 8415.21 (1320.44) | 14,332.84 (4065.34) | 9408.83 (3019.27) |
| Minimum–maximum | 42,449,510,847.80 | 10,848.80–22,213.00 | 4244.95–22,213.00 |
| P25–P75 | 7693.00–9437.90 | 10,945.86 15,508.80 | 7694.20 10,155.60 |
| P50 | 8420.40 | 13,050.00 | 8530.88 |
| Total normalized real cost | 26,314,374.22 | 9,044,024.48 | 35,358,398.69 |
| Hospital – V1 | n=1263 | n=198 | n=1461 |
| Mean (SD) | 8.388,51 (1.734,35) | 17.802,87 (4.493,43) | 9.664,37 (3.964.24) |
| Minimum–maximum | 3102.50–12,719.50 | 12,721.13 –34,606.17 | 3102.50–34,606.17 |
| P25–P75 | 7263.50–9587.21 | 14,062.92– 20,431.10 | 7402.20–10,320.74 |
| P50 | 8661.91 | 16,619.91 | 8743.82 |
| Total normalized real cost | 10,594,682.17 | 3,524,967.87 | 14,119,650.04 |
| Hospital – V2 | n=398 | n=85 | n=483 |
| Mean (SD) | 8354.18 (1614.81) | 13,015.03 (2905.28) | 9174.41 (2602.98) |
| Minimum–maximum | 4244.95–10,847.80 | 10,848.00–22,213.00 | 4244.95–22,213.00 |
| P25–P75 | 7693.00–9565.71 | 10,945.86–13,818.17 | 7694.20–10,733.86 |
| P50 | 8530.05 | 11,841.20 | 8530.05 |
| Total normalized real cost | 3,324,962.17 | 1,106,277.60 | 4,431,239.77 |
| Hospital – V3 | n=2239 | n=359 | n=2598 |
| Mean (SD) | 8482.57 (1.959,87) | 17,612.06 (4608.35) | 9744.11 (4020.85) |
| Minimum–maximum | 3124.40–12,322.40 | 12,323.00–33,784.40 | 3124.40–33,784.40 |
| P25–P75 | 7263.50–10,022.90 | 14,008.70–20,578.70 | 7672.30–10,752.90 |
| P50 | 8621.30 | 16,618.45 | 8621.30 |
| Total normalized real cost | 18,992,476.60 | 6,322,730.52 | 25,315,207.12 |
SD, standard deviation; P25, percentile 25; P50 median; P75, percentile 75.
| Model | AUC of model | Mean AUC (validation samples) | Bias | Error standard | Confidence intervals | Percentile 2.5–97.5 |
|---|---|---|---|---|---|---|
| Clinic-B | 0.6608 | 0.6629 | 0.0021 | 0.0122 | 0.637–0.685 | 0.638–0.685 |
| Clinic-BF | 0.701 | 0.702 | 0.001 | 0.0114 | 0.679–0.724 | 0.678–0.723 |
Bias: difference between AUC of prediction model for HI and mean AUC of validation samples.
AUC, area under the curve.
See “Appendix 2” for methodology remarks on internal validation using AUC.
| Calibrationa | Discrimination | ||
|---|---|---|---|
| P value | AUC | 95% CI | |
| Clinic-B Model | |||
| Hospital-Index | 0.9379 | 0.6608 | 0.6378–0.6839 |
| Hospital-V1 | <0.0001 | 0.6251 | 0.5834–0.6669 |
| Hospital-V2 | 0.1565 | 0.6197 | 0.5544–0.6849 |
| Hospital-V3 | <0.0001 | 0.6037 | 0.5715–0.6359 |
| Clinic-BF Model | |||
| Hospital-Index | 0.9010 | 0.7019 | 0.6795–0.7243 |
| Hospital-V1 | <0.0001 | 0.7214 | 0.6840–0.7588 |
| Hospital-V2 | 0.620 | 0.6953 | 0.6336–0.7571 |
| Hospital-V3 | <0.0001 | 0.6715 | 0.6423–0.7007 |
Hosmer–Lemeshow goodness of fit test.
AUC, area under the curve; CI, confidence interval.
See “Appendix 2” for methodology remarks on external validation using AUC.
| Score | Model Clinic-B | Model Clinic-BF | ||||
|---|---|---|---|---|---|---|
| Categories | Patients n (%) | Patients in normal cost group n (%) | Patients in high cost group n (%) | Patients n (%) | Patients not in normal cost group n (%) | Patients in high cost group n (%) |
| 0–2 | 492 (13.09) | 460 (93.5) | 32 (6.5) | 869 (23.12) | 806 (92.75) | 63 (7.25) |
| 3–5 | 1151 (30.63) | 1009 (87.66) | 142 (12.34) | 1376 (36.62) | 1231 (89.46) | 145 (10.54) |
| 6–8 | 1414 (37.63) | 1145 (80.98) | 269 (19.02) | 491 (13.07) | 377 (76.78) | 114 (23.22) |
| 9–11 | 677 (18.01) | 496 (73.26) | 181 (26.74) | 852 (22.67) | 615 (72.18) | 237 (27.82) |
| 12–13 | 24 (0.64) | 17 (70.8) | 7 (29.17) | 170 (4.52) | 98 (57.65) | 72 (42.35) |
| Total | 3758 | 3127 | 631 | 3758 | 3127 | 631 |