

The study objectives were to analyze the presence of reduced bone mass in a sample of patients with anorexia nervosa (AN) and amenorrhea, to assess Bone Mineral Density (BMD) recovery after having a normal weight is reached and regular menses are resumed, and to predict BMD after a treatment period considering different variables (baseline BMD, baseline and final body mass index (BMI), treatment duration).
Material & Methods35 patients with AN (mean age 20.57±5.77) were studied at treatment start (T0) and after they had recovered their normal weight and regular menses (T1) in order to measure their BMD using quantitative computed tomography (QCT) of the lumbar spine (L2–L4).
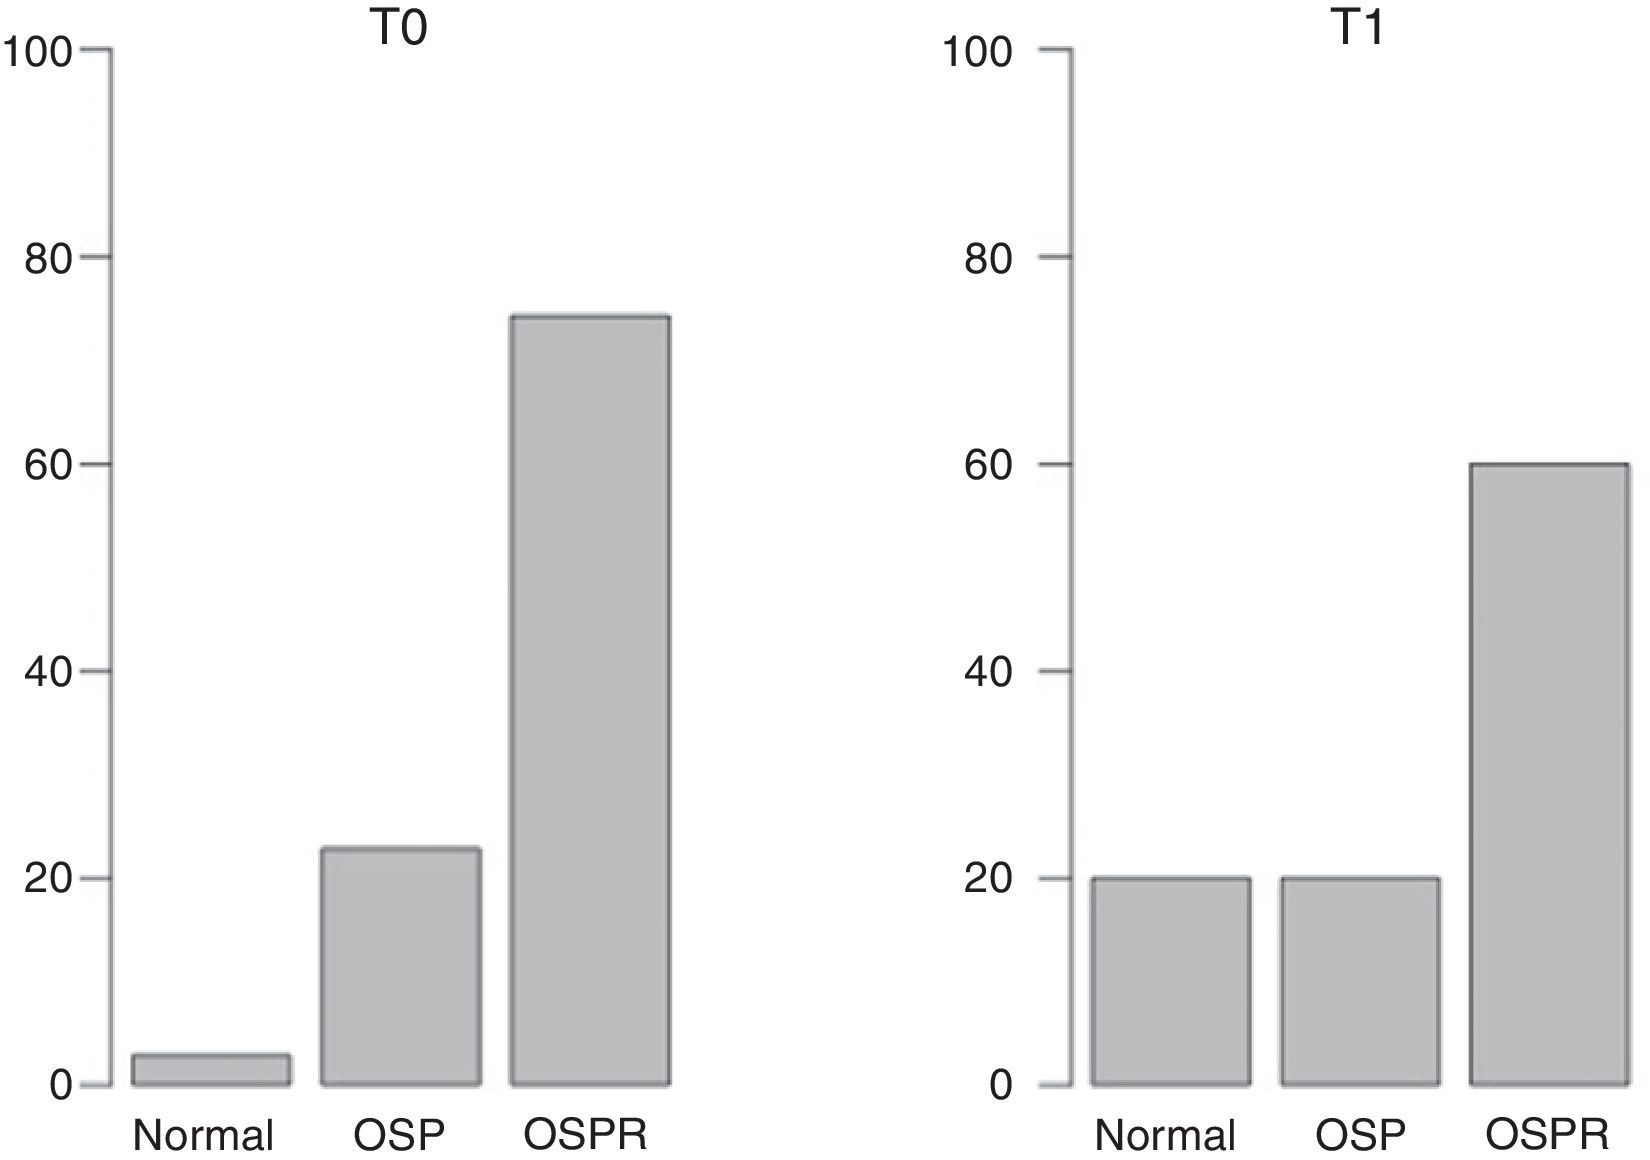
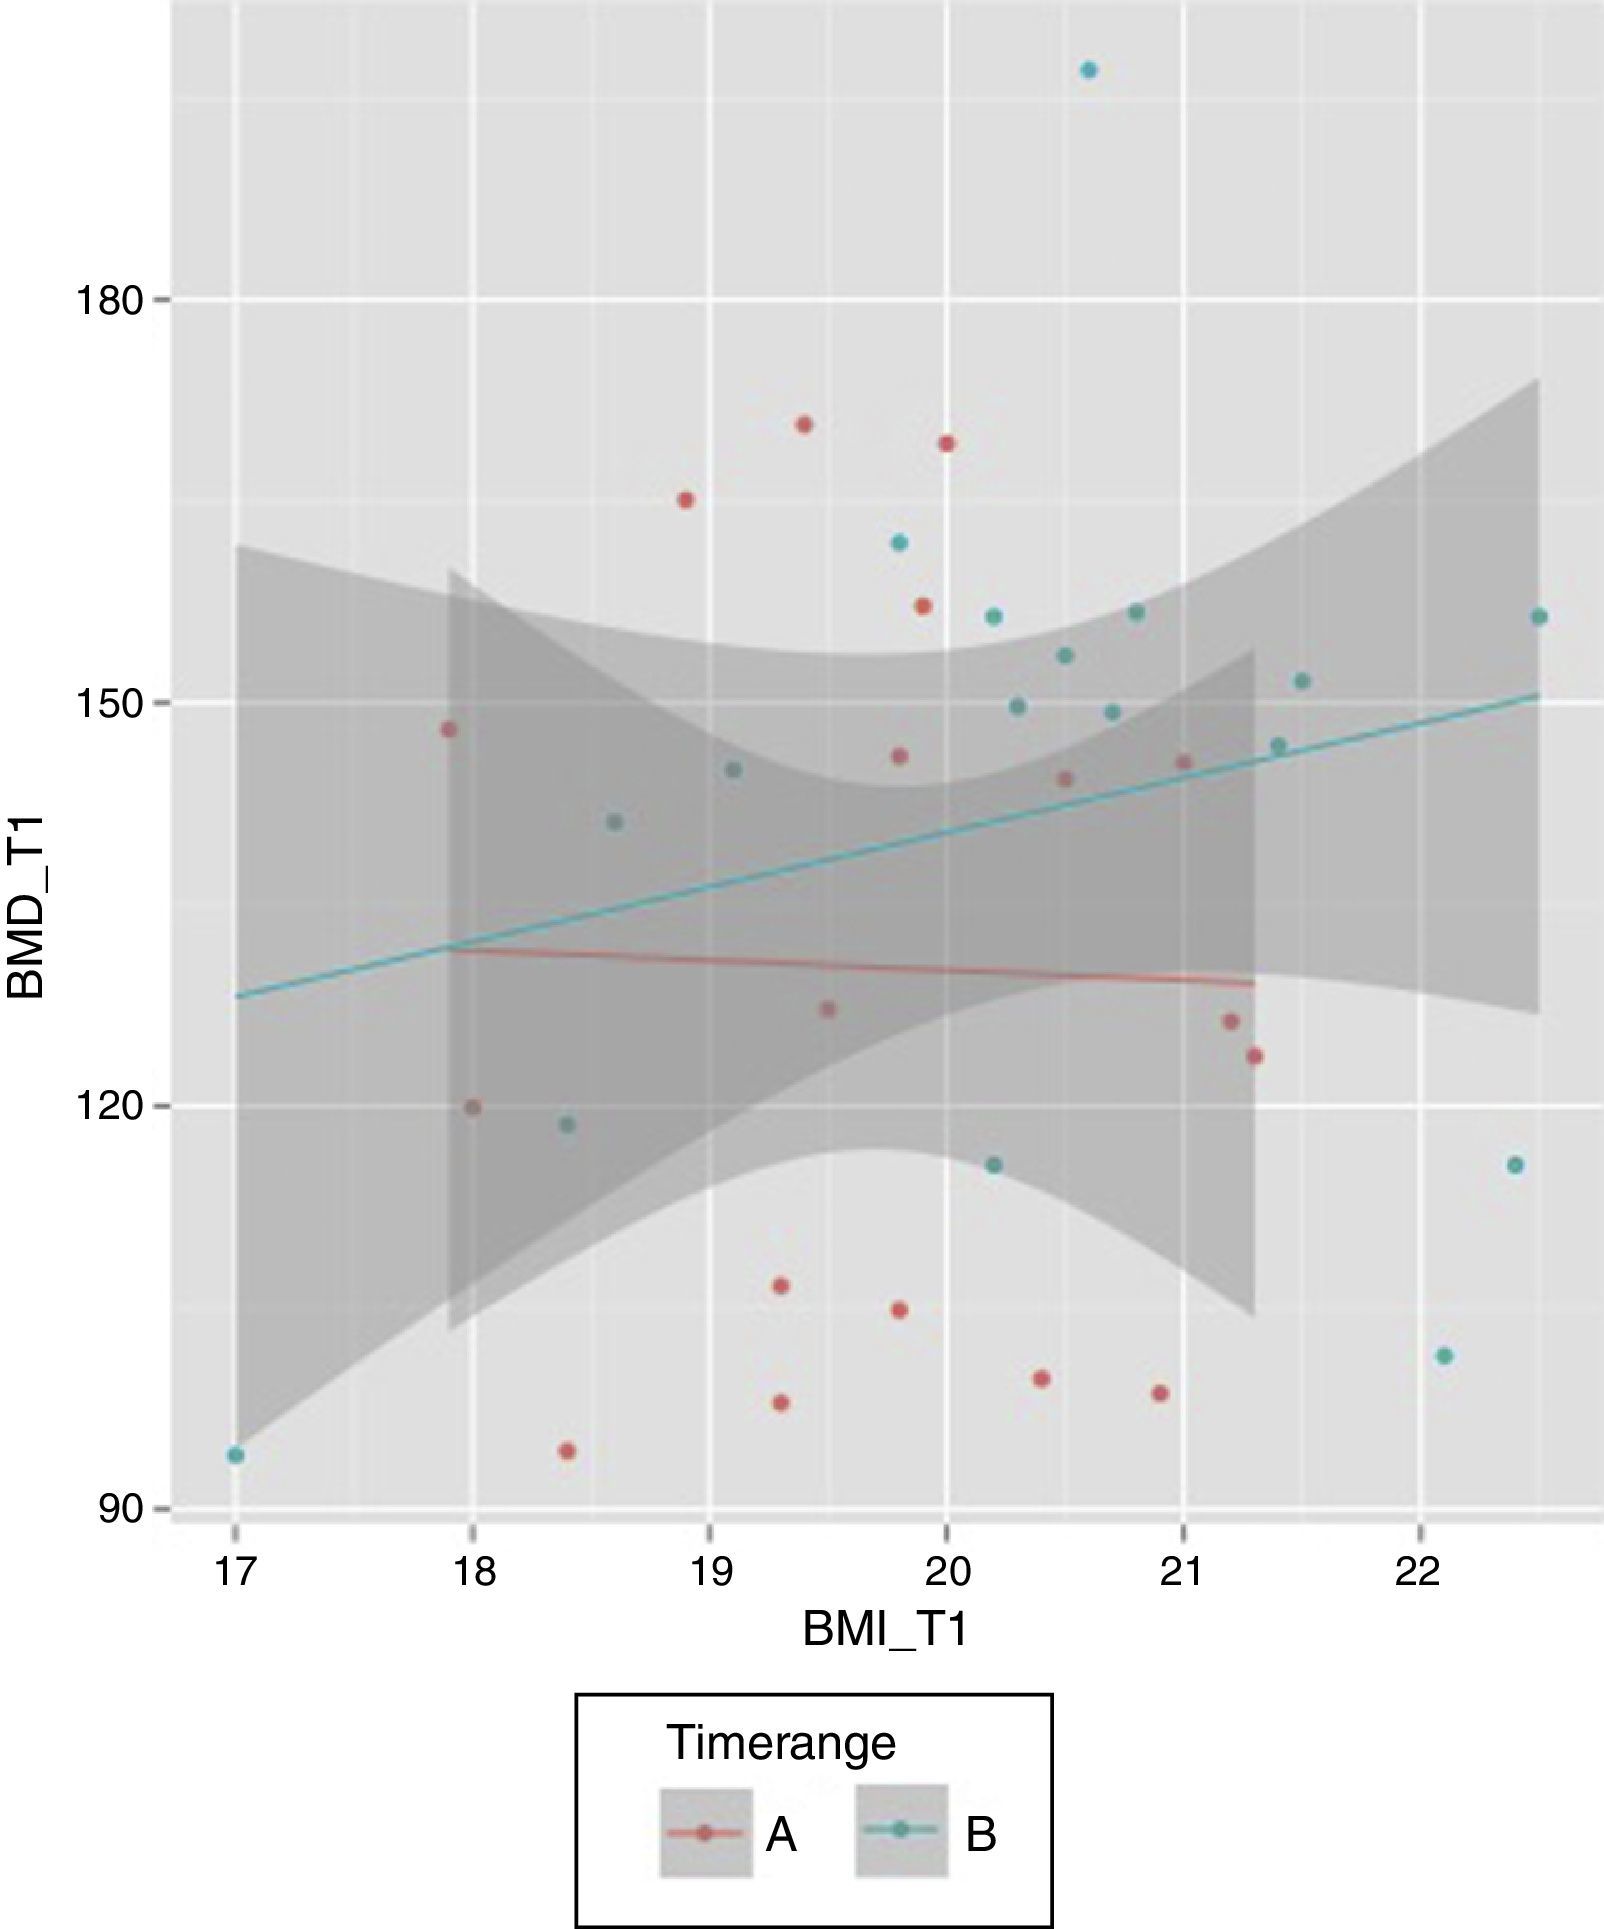
ResultsAt T0, 2.86% of patients had normal BMD, while a reduced bone mass consistent with osteopenia or with osteoporosis was found in 22.86% and 74.28% of patients respectively. At T1, the percentages were 20%, 20%, and 60% respectively. No significant differences were seen in L2–L3 and mean BMD (L2–L4). A significant difference was however found for L4 (p<0.05). A positive relationship was seen between final body mass index (BMI) and final BMD in patients with T0–T1>11 months, but not when the time period was ≤11 months.
ConclusionsThis follow-up study of changes not only in BMD but also in BMI and recovery of menses has clinical relevance from the viewpoint of the day-by-day treatment process. Use of QCT makes the study more relevant because this is a more advanced technique that allows for differentiating trabecular and cortical bone.
El objetivo de este estudio fue analizar la presencia de reducción de masa ósea en una muestra de pacientes con anorexia nerviosa y amenorrea, evaluar la recuperación de dicha masa ósea tras alcanzar un peso normal y reanudar la función menstrual y predecir la densidad mineral ósea tras un periodo de tratamiento considerando diversas variables (densidad mineral ósea inicial, Índice de Masa Corporal (IMC) inicial y final y duración del tratamiento).
Material y MétodosTreinta y cinco pacientes con anorexia nerviosa (edad media 20,57±5,77) fueron estudiados al iniciar tratamiento —T0 — y tras recuperar un peso normal y tener reglas regulares — T1 — con el fin de medir su densidad mineral ósea (DMO) mediante tomografía computarizada cuantitativa (QCT) de columna lumbar (L2-L4).
ResultadosEn el momento T0 el 2,86% tenía una DMO normal, el 22,86% presentaba menor masa ósea compatible con osteopenia y el resto compatible con osteoporosis (74,28%). En T1 los porcentajes fueron 20, 20 y 60 respectivamente. Con respecto a L2-L3 y la DMO media (L2-L4) no se encontraron diferencias significativas, mientras que en L4 sí se encontraron diferencias significativas (p<0,05). Se halló un correlación positiva entre el IMC final y la DMO final en aquellos pacientes con una diferencia T0-T1>11 meses, relación no observada cuando dicho periodo fue inferior.
ConclusionesEste estudio de seguimiento considerando no solo cambios en la DMO, sino también en el IMC y la recuperación menstrual, tiene relevancia clínica desde el punto de vista del día a día del proceso terapéutico. Además, el hecho de haber usado la tomografía computarizada cuantitativa añade mayor importancia la trabajo, ya que se trata de un método superior a otros en tanto que permite distinguir entre hueso trabecular y cortical.
Anorexia nervosa (AN) is a mental disorder, which is characterized by patient-induced and -maintained weight loss that leads to progressive malnutrition and specific pathophysiological signs (body image disturbances and fear of gaining weight).1 Complications in many organ systems are common, including the cardiovascular, gastrointestinal, hematological, renal, skeletal, endocrine and metabolic systems, amongst others. These alterations are not only related to the state of malnutrition, but also to the altered behaviors used by these patients to control their weight. The endocrine and metabolic disturbances include menstrual disturbances, delayed puberty, hypothyroidism, hypercortisolism, insulin-like growth factor (IGF)-I deficiency, electrolyte abnormalities, hypoglycaemia and hypophosphatemia, etc., with numerous studies of AN patients indicating a hypothalamic dysfunction as a possible pathophysiological base.1,2
Low bone mineral density (BMD) is an established risk in AN, with 50% of patients with AN demonstrating osteopenia within 20 months of amenorrhea and 38% developing osteoporosis with amenorrhea of less than 24 months duration.3–5 Thus osteopenia and osteoporosis are often chronic complications of AN, leading to clinical fractures and increased fracture risk throughout life.6,7 It must be noted that more than 50% of AN patients present with osteopenia and/or osteoporosis at the time of diagnosis and with an average illness duration of 5–6 years the annual fracture rate is about seven times greater than that of healthy women of the same age.8 Among AN patients with a poor outcome at long-term follow-up, bone fracturing occurs in more than 40%.9 Oestrogens deficiency is a risk factor for bone loss and osteoporosis, whereas malnutrition and low body weight may also increase the risk of osteoporosis by estrogen-dependent and non-oestrogens-dependent mechanisms.10 Bone density and bone metabolism change dramatically during adolescence, and the onset of AN during this critical time may interfere with the achievement of peak bone mass. In addition, significant changes in body weight and composition, pubertal development and pubertal hormones presented in these patients usually affect the bone metabolism. However, the effect of AN on bone turnover in adolescent girls remains poorly understood, several factors being possible involved mechanisms.6,11–13 Along with oestrogens deficiency and low body weight, other factors, such as insulin-like growth factor-I (IGF-I) deficiency, growth hormone (GH) resistance, ghrelin resistance, reduced leptin, exercise, etc., have been reported to be involved as causes of low bone mass in AN.14
With respect to the influence of the treatment on the recovery of a normal bone metabolism, it must be noted that illness recovery is usually associated with near normal BMD.15 Long-term studies show that patients at many years of recovery while showing reduced BMD at the femoral neck, the BMD of the lumbar spine is not significantly different from that of controls.16 The use of oestrogens and gestagens in adolescents with reduced BMD and amenorrhea for at least 1 year has shown that the osteopenia cannot be reversed.17 The reason why oestrogens are incapable of increasing bone mass in adolescents with AN and amenorrhea remains uncertain. Apart from the oestrogens deficiency, the decrease in other nutritional and hormonal factors is also involved in the pathogenesis of bone mass loss.18,19 Therefore, oestrogens replacement alone may not be sufficient for recovery of BMD. Weight is a significant predictor of BMD in women with AN.
Different factors, such as leptin, the bone isoenzyme of alkaline phosphatase or several growth factors (especially IGF-I), have been associated to the process of bone mineralization.2,14 In general, nutritional factors play an important role in this process supplying essential nutrients, which make it possible. In patients with AN, the mechanism of bone loss does not appear to be due to an increase in absorption over formation with respect to that seen in controls. The increase in bone remodeling that is observed might be a mechanism developed to restore bone mass.20,21 However, the large deficit of calcium in these patients (the calcium deficiency due to a poor alimentation produces liberation of bone calcium to maintain the homeostasis of extracellular fluid) and the deficit in amino acids as a result of fasting make it very difficult to restore bone mass.22
Up to the date, several longitudinal studies which have analyzed the recovery from osteoporosis in patients with AN are controversial. For some authors the recovery from osteoporosis is possible in some patients, others suggesting that only a partial BMD improvement is possible when normalization of menstrual function and weight improvement.9 Due to the relevance of getting a full health recovery, it is necessary to control the improvement of BMD during the complete therapeutic process, thus avoiding precipitated medical discharges and subsequent medical complications. In this regard, the aims of this study were: (a) to analyze the presence of reduced bone mass (compatible with osteopenia/osteoporosis) in a sample of patients with AN suffering from amenorrhea; (b) to assess the BMD recovery after having reached a normal weight and regular menses; and (c) to predict BMD after a period of treatment taking into account different variables (initial BMD, initial and final body mass index (BMI), period of time under treatment).
Material and methodsSampleThe sample was made up of 35 participants with an average age of 20.57 (SD=5.77), all females suffering from AN.23 The patients were studied in two occasions, which were closely matched with the therapeutical schedule established at the Eating Disorders Unit (EDU) from the Behavioral Sciences Institute (Seville, Spain) where they were treated. All of them voluntarily agreed to participate in the study.
SettingThe first session (T0) took place within the first two weeks after starting treatment and the second one (T1) after having reached a normal weight and regular menses provided that patients had maintained that status at least three months. Patients had an initial mean BMI of 16.87±1.16kg/m2 and they had secondary amenorrhea (inclusion criteria were to have a BMI<17 kg/m2 and amenorrhea – at least three months). Those patients with any associated comorbid physical pathologies as well as other DSM V disorders were excluded from the study (exclusion criteria). None of the subjects was taking any medications known to affect nutritional status or regulation of bone metabolism and none of them were taking any supplements (exclusion criteria). They were not allowed to practice physical exercise until their physical status was normalized. The mean duration of amenorrhea was 4.42±1.31 months (range 3.01–5.97). Ethical approval for the study was obtained from the corresponding committee of Behavioral Sciences Institute and then written informed consent from each participant (and from the parents when appropriate) enrolled into the study was obtained. All procedures complied with the Declaration of Helsinki. Although 41 patients were initially recruited for the study, only 35 fit the inclusion criteria and were able to complete the study.
ProcedureThe study lasted 36 months. The intervention consisted of an initial patients’ evaluation by means of a clinical interview and the assessment of common anthropometrical measures (weight, height, BMI) as well as the analysis of the nutritional intake. Within the first two weeks patients went to the Radiodiagnostic Service (Ecotest, Seville) for bone densitometry. As usual, all patients started their treatment focused on medical, psychological and nutritional orientation. The personalized nutritional program was performed according to a previous paper.24 The criterion established for patients to complete the study was to reach a BMI≥18.50, the cut-off point considered for normal range in the international classification (WHO),25 and regular menses at least three months. All measurements were performed at T0 and T1.
TreatmentAll patients were initially hospitalised following a multidisciplinary approach (psychological treatment, family support, nutritional treatment and medical/psychiatric intervention). As it was mentioned the personalized nutritional program was performed following our protocol.24 All patients received a calcium and vitamin D supplementation of 600mg/400IU per day respectively.
MeasuresAnthropometric/body mass index measurementsPatients were weighed and measured, and BMI scores (weight in kg/height in m squared) were then calculated. Height was measured using a wall-mounted estadiometer (Holtain, Dyfed, UK), to the nearest 0.5cm, with the participant's head in the Frankfort plane (a standard craniometric reference plane passing through the right and left porion and the left orbitale). Weight and body composition was assessed by means of a Tanita monitor BC 420 SMA (TANITA Europe GmbH, Sindelfingen, Germany) to the nearest 0.1kg. Measurements were performed with the participants wearing light indoor clothing and no shoes. A correction factor of −1kg was used to adjust for the weight of clothes.
Bone mineral densityNowadays QCT of the lumbar spine is one of the standard procedures in bone densitometry and typically three to four vertebrae in the range T12 to L4 are used.26 For this study, in order to assess the potential patients’ bone loss, BMD was assessed by means of volumetric quantitative computed tomography (QCT). Studies were conducted with a General Electric computerized axial tomography scan. One-cm slices were used and a standardized phantom was placed underneath the patient with some cylinders containing calcified hydroxyapatite (100%, 75%, 50%, 25%) and one more with distilled water. The cuts were made in vertebrae L2, L3 and L4, including only the trabecular bone, which is the only one metabolically active, thus avoiding measurement errors by including bone alterations and/or adjacent soft tissue calcifications. Density values measured in Hounsfield units were transformed into BMD measured in mg/cm3 of calcified hydroxyapatite and were compared with reference values obtained from the University of San Francisco California, mainly Caucasian population with similar number of daily hours of sunshine comparing with our region (Andalusia, Spain). Sunshine duration follows a general geographic pattern: dry areas in the subtropical latitudes (about 25° to 40° north/south) have the highest sunshine values, as these are the locations of the eastern sides of the subtropical high-pressure systems. In this regard Seville and San Francisco have similar latitudes (37°22.96′ and 37°46.49′ respectively).27 In addition the BMD values are compared with those of people with similar age and the same sex. Those values similar to the reference data were considered normal; up to two standard deviations were considered as compatible with osteopenia, and lower values were described as osteoporosis. As result, the Radiodiagnostic Service informed about BMD in mg/cm3 adding a consequent densitometric diagnosis: “this result is compatible with…” (Normality, Osteopenia or Osteoporosis). In this regard, the terms osteopenia and osteoporosis (defined by BMD) would only be applied to postmenopausal women (WHO). It would be more appropriate in premenopausal women to use terms such as “poor bone mass accumulation”, “reduced bone mass”, etc.14. In our case, the Radiodiagnostic Service compared the results (mg/cm3) with the above-mentioned reference values and finally considered the findings as compatible with normality, osteopenia or osteoporosis thus permitting a better clinical approach.
Statistical analysisConventional descriptive statistics (M, SD) were used to describe continuous variables and percentages for the categorical ones (N, %). Shapiro–Wilk normality test was used to determine whether the data fitted a normal distribution or not. As result, the paired samples generalization of Yuen's independent samples t-test on trimmed means was applied, as well as the robust Huber's model in order to test the influence of some variables analyzed (IV) on the BMD at T1 (DV). In case of categorical variables, the χ2-test or the Fisher's exact test was applied. All analyses were performed using R software, version 3.2.2.
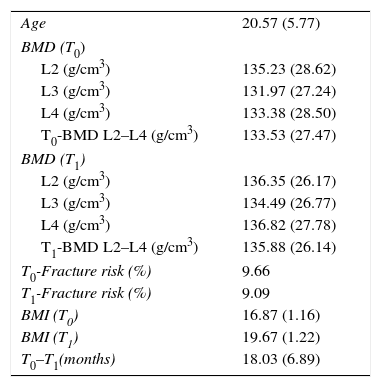
ResultsDescriptive statistics of the sample are shown in Table 1. At T0, 2.86% of participants had a normal BMD, 22.86% had reduced bone mass compatible with osteopenia and the rest (74.28%) had reduced bone mass compatible osteoporosis following the WHO criteria. At T1 the percentages were 20, 20 and 60 respectively (Fig. 1). Having observed a tendency to improve BMD (Table 1), in order to check possible BMD differences (T0–T1), the sample size was specially considered. When working with samples sizes of 30 or 50 subjects classical statistical tests, such as the t-test and the nonparametric tests usually have a high error rate in their decisions (10–20%).28 In this regard, the paired samples generalization of Yuen's independent samples t-test on trimmed means was applied (with an error rate around 5% of nominal alpha). With respect to L2–L3 and the mean BMD (L2–L4) there were not significant differences. As to L4 a significant difference was found (p<0.05). The improvement of nutritional status was significant considering the BMI (BMI at T0=16.87; BMI at T1=19.67; p<0.0001).
Descriptive statistics (M, SD; % for fracture risk).
| Age | 20.57 (5.77) |
| BMD (T0) | |
| L2 (g/cm3) | 135.23 (28.62) |
| L3 (g/cm3) | 131.97 (27.24) |
| L4 (g/cm3) | 133.38 (28.50) |
| T0-BMD L2–L4 (g/cm3) | 133.53 (27.47) |
| BMD (T1) | |
| L2 (g/cm3) | 136.35 (26.17) |
| L3 (g/cm3) | 134.49 (26.77) |
| L4 (g/cm3) | 136.82 (27.78) |
| T1-BMD L2–L4 (g/cm3) | 135.88 (26.14) |
| T0-Fracture risk (%) | 9.66 |
| T1-Fracture risk (%) | 9.09 |
| BMI (T0) | 16.87 (1.16) |
| BMI (T1) | 19.67 (1.22) |
| T0–T1(months) | 18.03 (6.89) |
BMD, bone mineral density; BMI, body mass index; L2–L3–L4: Lumbar vertebrae L2–L4; M, mean; SD, standard deviation; T0, first evaluation; T1, second evaluation.
 and second (T1) evaluation.")
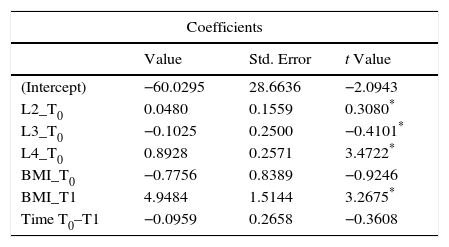
The variables measured at T0, as well as BMI at T1 and the period of time T0–T1, were tested as possible predictors of mean BMD at T1. In this regard, the robust Huber's model was applied in order to test the influence of those variables (IV) on the BMD at T1 (DV). BMD in L2, L3 and L4 at T0 and mean BMI at T1 had significant influence on the mean BMD at T1 (p<0.001), this influence being no significant for the rest of variables. The results of the Huber's M-estimator are shown in Table 2.
Huber's M-estimation for regression analysis.
| Coefficients | |||
|---|---|---|---|
| Value | Std. Error | t Value | |
| (Intercept) | −60.0295 | 28.6636 | −2.0943 |
| L2_T0 | 0.0480 | 0.1559 | 0.3080* |
| L3_T0 | −0.1025 | 0.2500 | −0.4101* |
| L4_T0 | 0.8928 | 0.2571 | 3.4722* |
| BMI_T0 | −0.7756 | 0.8389 | −0.9246 |
| BMI_T1 | 4.9484 | 1.5144 | 3.2675* |
| Time T0–T1 | −0.0959 | 0.2658 | −0.3608 |
Dependent variable: BMD at T1; independent variables: Bone Mineral Density in L2, L3 and L4 at T0 (L2_T0, L3_T0, L4-T0), Body Mass Index at T0 and T1 (BMI_T0 and BMI_T1), Period of time between T0 and T1 (Time T0–T1).
Considering the period of time T0–T1, the median was 11 so a new variable was created (“Timerange”) with two values: A≤11 months between T0 and T1; B>11 months. While there is a positive relationship between final BMI and final BMD in the case of those patients with a period of time higher than 11 months between the first and second BMD measurements, that relation is not observed when the period of time is equal/lower than 11 months (Fig. 2).
Discussion and bone mineral density (BMD) after two different periods of treatment (A, B).")
Most cases of AN present before the age of 25 years and early may have menstrual alterations.29 Low BMD is a well-known risk in AN with many patients suffering from reduced bone mass (compatible with osteopenia or osteoporosis) after months of amenorrhea.3–5 Full recovery, which always implies weight growth and menstruation, is usually reached in 50–70% of treated patients.30 Weight, menstrual status and mental health are important factors when treating AN patients, weight restoration remaining a primary treatment objective.31 With respect to bone consequences in AN, both cortical and trabecular bone are affected, although trabecular bone is more severely affected than cortical, which might reflect the impact of oestrogens deficiency.2 The bone alteration in AN is a major problem, both for its high incidence and for being often irreversible,32 recovery of BMD being a slow process.
Despite dual-energy X-ray absorptiometry (DXA) rather than Quantitative Computed Tomography (QCT) became the gold standard modality for measuring BMD in the 1990s,26 QCT can determine the volumetric bone density (mg/cm3), and therefore it can measure specifically the trabecular bone. In this regard, QCT is technically superior to other existing techniques as it can differentiate between trabecular and cortical bone. In addition it permits to take three-dimensional measures so the obtained values reflect more accurately the whole bone density. Bone mineral density (BMD), as measured by QCT, is a true density measured in mg/cm3, in contrast to DXA, which determines an areal density (BMD a) measured in g/cm2.26
With respect to the field of the imaging techniques to measure BMD, currently volumetric quantitative techniques are state of the art33 with some advantages over DXA: (a) it allows true volumetric measurements of the lumbar spine and proximal femur, which are independent of the body size; (b) it provides purely trabecular bone measurements, which are more sensitive to monitoring changes with disease and therapy; and (c) cross-sectional studies have shown that quantitative CT BMD of the spine allows better discrimination of individuals with fragility fractures.34
After a follow-up of 11.03 (6.89) months it was possible to recover a normal weight and menstruation reappeared. Despite the efficacy of the treatment regarding the increase of weight, bone condition varied slightly. In fact, 80% of patients maintained a reduced bone mass (compatible with osteopenia or osteoporosis) after finishing the study. On the other hand, only a significant difference between T0 and T1 was found in L4 (p<0.05). Recovery of BMD in AN is a slow process probably due to a complex interaction between hormonal and nutritional factors.35 BMD is rapid emerging relatively early in AN (after only some months of illness), and it seems to be associated to low body weight and longer duration of amenorrhea among others. As other authors our results show that weigh and menses recovery are not sufficient elements to clearly improve BMD.36 Nevertheless, weight restoration with resumption of menses is considered to be the base for long-term recovery of bone mass.14 In fact BMD is only partially improved with weight recovery alone if there is no restoration of gonadal function.37 Our results, as well as others, highlight the difficulty to recover a normal BMD in AN. Other studies have pointed out that irreversible bone loss may occur with onset of AN before or during adolescence.8,37 It is not surprising that after months of treatment and weight-menstrual recovery AN patients maintain reduced lumbar BMD compared with controls. The period of time (T0–T1) might be a crucial factor in this regard as other authors have demonstrated a normalization of lumbar BMD after 2.7 years.38 To some extent weight-menses recovery along with duration of treatment are relevant factors to recover BMD.
Calcium and vitamin D supplementation in children and adolescents have yielded inconsistent results due to the compliance among other factors.39 No correlation has been observed between BMD and calcium or vitamin D supplementation in AN.40,41 In our case, not having a control group without supplementation and despite parents assured the compliance, it is impossible to comment about a possible correlation between the supplementation and the BMD improvement.
Other factor, which has been noted in this field of study, refers to the exercise. It is generally accepted that exercise increases BMD42 but with respect to AN exercise is not recommended unless until weigh recovery. In fact our patients were not allowed to practice physical exercise until their physical status was normalized. With respect to estrogen therapy it has been concluded that there is limited evidence supporting a positive effect on BMD in AN.43 In this regard none of our patients received estrogen therapy or other medications.
Summarizing, the most effective strategy to recover BMD in AN is weight gain and menstrual recovery. Nevertheless it is necessary a long follow-up. A point to be noted is the correlation between BMI and BMD recovery. Some authors have reported that bone recovery is not influenced by BMI.36 In our study this correlation was clearly related to the period of time between the two measurements of BMD. The factors involved in the bone loss of AN patients remains unclear specially considering the complex pathways and the best therapeutic approach to improve BMD. In this regard, for example, the negative coefficient between L3 and T0 and the final BMD found in the regression analysis should be explored in detail in order to analyze possible different changes in the lumbar spine during the therapeutic process.
This study has some limitations, the main being the short follow-up and the sample size. A longer follow-up should be necessary in order to clarify the influence of time on bone recovery. Parameters such as levels of estradiol, cortisol, etc., were not considered and this should be taken into account for future studies. In our study only the BMI was considered as marker of the nutritional status. Other studies have studied the relationship between BMD recovery and fat mass or lean mass36,44 and some authors have reported that lean mass is an important determinant of BMD in AN, more so than BMI or fat mass.45 Having focused this study on AN patients during treatment a control group was not taken, which is another limitation. Nevertheless this follow-up considering change not only in BMD but in BMI and menses recovery has some clinical relevance with respect to the day-by-day therapeutic process. In addition the fact of having used QCT adds more relevance since this technique represents the gold standard to measure BMD.
FundingNo funding has been received for this research.
Conflict of interestIgnacio Jáuregui-Lobera, Patricia Bolaños-Ríos, and Juan Sabaté declare that they have no conflict of interest.