


To assess the degree of metabolic control and hypoglycemic treatments in a cohort of patients with type 2 diabetes mellitus (T2DM) after evaluation in an endocrinology clinic.
Material and methodsA prospective cohort study on 465 patients with T2DM who were not being monitored at an endocrinology clinic. Blood glucose control data and treatments received were recorded at an initial visit and after 26 weeks of follow-up.
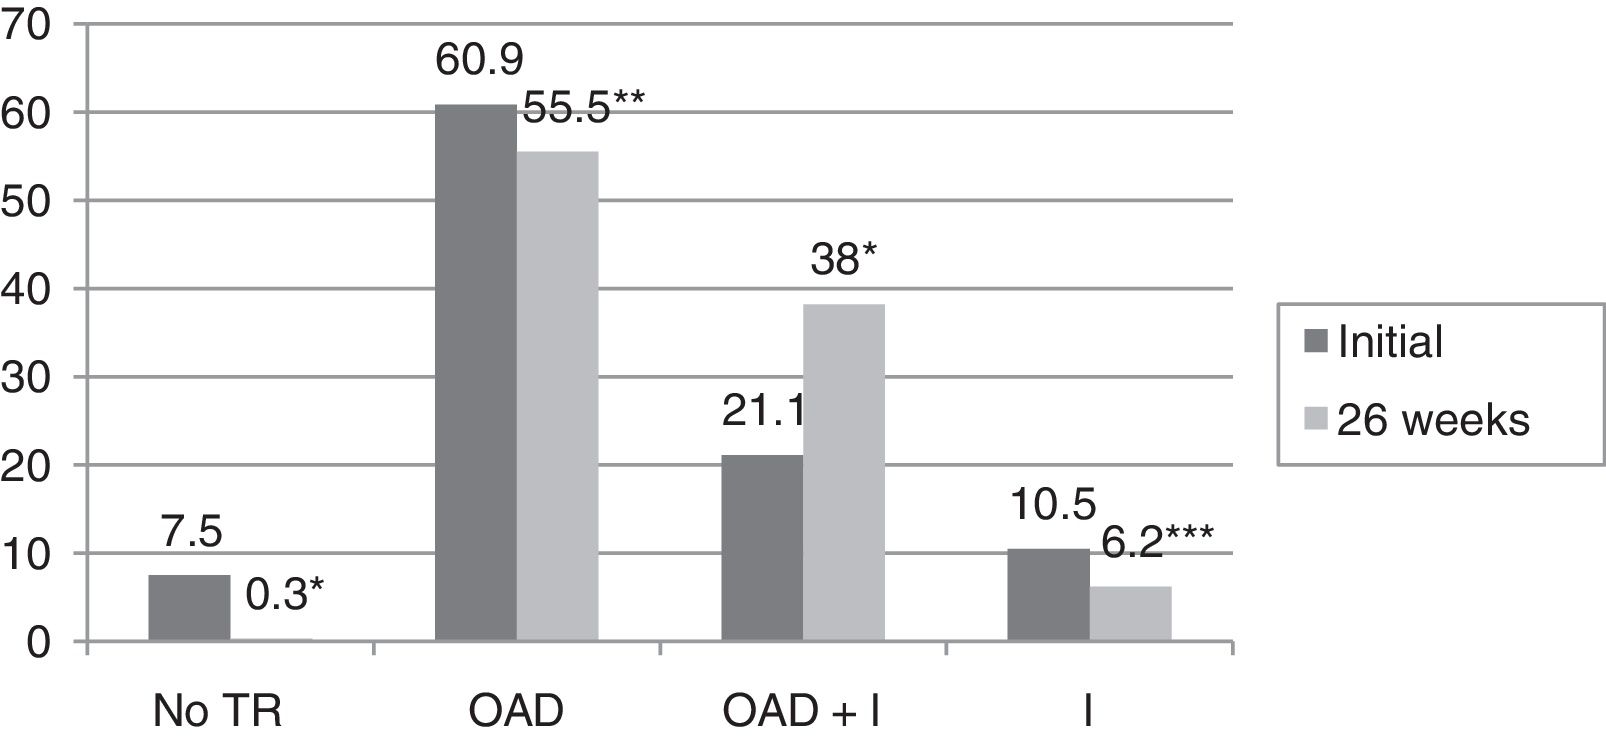
ResultsBaseline glycosylated hemoglobin (HbA1c) level was 8.3±1.8%, as compared to 6.6±0.9% after 26 weeks of follow-up (p<0.0001). The proportion of patients with HbA1c levels <7% increased from 33.1% to 71.3% (p<0.0001). In 59.9% of patients, a decrease ≥0.8% in HbA1c was seen. In the multivariate analysis, variables predicting for an improvement in the degree of metabolic control were older age (OR 1.038; 95%CI 1–1.07; p=0.041), higher baseline HbA1c values (OR 5.51; 95%CI 3.4–9; p<0.0001), T2DM duration <5 years (OR 4.63; 95%CI 1.6–13.3; p=0.005), and change in hypoglycemic treatment (OR 2.77, 95%CI 1.1–6.9; p=0.03). Hypoglycemic therapy was changed in 75.1% of study patients with T2DM. After 26 weeks of follow-up, decreases were seen in both the proportion of patients who receiveding no treatment (from 7% to 0.3%, p<0.0001) and the proportions of patients on oral antidiabetic therapy (60.9% versus 55.5%, p=0.003) and insulin (10.5% versus 6.2%, p=0.021). However, the proportion of patients receiving insulin combined with oral antidiabetic drugs increased from 21.1% to 38% (p<0.0001).
ConclusionsAn improved metabolic control was seen in this cohort of patients with T2DM after their evaluation in an endocrinology clinic. However, HbA1c levels <7% were not achieved in 28.7% of patients, which shows the difficulty to achieve adequate control in clinical practice.
Evaluar el grado de control metabólico y los tratamientos hipoglucemiantes en una cohorte de pacientes con diabetes mellitus tipo 2 (DM2) tras su valoración en endocrinología.
Material y métodosEstudio de cohortes prospectivo. Se incluyeron 465 pacientes con DM2 que no realizaban seguimiento en una consulta de endocrinología. Se recogieron datos de control glucémico y tratamientos recibidos en una visita inicial y tras 26 semanas de seguimiento.
ResultadosLa hemoglobina glucosilada (HbA1c) inicial fue de 8,3±1,8%, mientras que tras 26 semanas de seguimiento fue de 6,6±0,9% (p<0,0001). El porcentaje de pacientes con HbA1c<7% ascendió de 33,1 a 71,3% (p<0,0001). En el 59,9% de los pacientes se observó un descenso ≥0,8% de HbA1c. En el análisis multivariante, las variables que predijeron una mejoría en el grado de control metabólico fueron una mayor edad (OR 1,038; IC 95%: 1-1,07; p=0,041), una mayor HbA1c inicial (OR 5,51; IC 95%: 3,4-9; p<0,0001), un tiempo de evolución de la DM2<5 años (OR 4,63; IC 95%: 1,6-13,3; p=0,005) y el cambio de tratamiento hipoglucemiante (OR 2,77; IC 95%: 1,1-6,9; p=0,03). En el 75,1% de los sujetos con DM2 incluidos en el estudio se modificó el tratamiento hipoglucemiante. El porcentaje de pacientes que no recibía tratamiento disminuyó del 7% al 0,3% tras 26 semanas de seguimiento (p<0,0001), así como el porcentaje de pacientes que recibía tratamiento con antidiabéticos orales (60,9 vs 55,5%) (p=0,003) e insulina (10,5 vs 6,2%) (p=0,021). Sin embargo, aumentó el porcentaje de pacientes que recibían tratamiento con insulina combinada con antidiabéticos orales de 21,1% a 38% (p<0,0001).
ConclusionesSe produce una mejoría del control metabólico en esta cohorte de pacientes con DM2 tras su valoración en una consulta de endocrinología. No obstante, en el 28,7% no se alcanza un HbA1c<7%, lo que pone de manifiesto la dificultad en conseguir un buen control en la práctica clínica.
Diabetes mellitus (DM) is an serious public health problem, with a considerable healthcare and social impact due to the micro- and macroangiopathic complications of the disease and the high associated cardiovascular mortality rate.1 The treatment of DM and its complications has a strong financial impact upon the Spanish healthcare system. The Seccaid2 study indicates that the direct costs of DM in Spain total 5809 million euros annually, or 8.2% of the global healthcare expenditure in the country.
The prevalence of DM has increased dramatically in recent years, particularly type 2 diabetes mellitus (DM2), which represents 85–95% of all cases of diabetes in developed countries.3 According to the International Diabetes Federation, the estimated worldwide prevalence of diabetes was 415 million in 2015, and this figure is expected to increase to 642 million by the year 2040 if urgent actions are not taken.4 The Di@bet.es trial,5 conducted in a representative sample of the Spanish population, found the prevalence of carbohydrate metabolic disorders of any kind (DM, altered basal glycemia, or oral glucose intolerance) to be 30%. The prevalence of DM was 13.8%, of which almost one-half (6%) corresponded to unidentified cases. The PREDIMERC study, carried out in the Community of Madrid, found the global prevalence of DM2 to be 8.1%, the figure being higher in males than in females (10.2% versus 6%, respectively).6 Some of the causes that may account for this epidemic, such as obesity, a sedentary lifestyle and the aging of the population, are closely linked to consumerism in the western world and to lifestyle changes in developing countries.7 In the year 2012, a total of 53.7% of the Spanish population over 18 years of age was overweight or obese, and 41.3% claimed to be sedentary.8 Obesity is the main risk factor for developing DM2, and is moreover associated with poorer metabolic control.9
In Spain, DM2 is mainly diagnosed and managed in the primary care (PC) setting and by endocrinologists. Patient attendance at any healthcare level generally depends on the complexity of the disease and of the treatments. The Pathways study, which evaluated the reasons for referring patients with DM2 to PC or specialized care (SC), found the most frequent criterion for referral to SC to be the existence of metabolic instability (80.5% of the cases), while referral to PC was decided upon in order to secure the therapeutic objectives (96.5% of the cases).10
The treatment of patients with DM2 is based both on the optimization of glycemic control and on the management of other cardiovascular risk factors (CVRFs), with the aim of preventing chronic complications and death,11,12 although it often proves difficult to achieve the control objectives or targets in clinical practice.
The present study evaluates the degree of metabolic control, CVRFs and blood glucose-lowering treatments received by a cohort of patients with DM2 not subjected to routine follow-up in an endocrinology clinic, and the outcome of these parameters 26 weeks after their assessment in SC.
Material and methodsA prospective cohort study was carried out at the University Hospital of Guadalajara (Spain). Between November 2013 and March 2016, we recruited a total of 465 consecutive patients with DM2 seen for the first time at an endocrinology clinic as new patients. We also included those patients who had not been seen in the previous year and who had either abandoned follow-up or had been discharged, and were again referred to the clinic as new patients. The diagnosis of DM2 was based on the criteria of the American Diabetes Association (ADA).13 Those patients with other forms of DM (gestational diabetes, type 1 DM or DM associated with beta-cell genetic defects β) were excluded from the study, as were those who had undergone follow-up in the previous year. The same patients were evaluated after 26 weeks of routine follow-up at the endocrinology clinic. A total of 106 patients (22.8%) in the initial group were lost: 72 (67.9%) failed to report for follow-up; 15 (13.3%) died (8 as a result of background neoplastic disease, 5 due to cardiovascular disease, and 2 as a result of infectious processes); 15 (14.3%) were discharged on the first visit and did not undergo subsequent follow-up, since the study was carried out according to routine clinical practice; and four patients (3.8%) became pregnant.
The following clinical variables were recorded:
- 1.
Sociodemographic data: age and gender.
- 2.
The duration of DM2. The patients were divided into four groups according to the duration of the disease: <1 year; ≥1 and <5 years; ≥5 and <10 years; and ≥10 years.
- 3.
Initial CVRFs and CVRFs after 26 weeks of follow-up: arterial hypertension (AHT), dyslipidemia and obesity. Patients were considered to have AHT when systolic blood pressure (SBP) measured at the time of the visit was ≥140mmHg and/or diastolic blood pressure (DBP) was ≥90mmHg, and/or hypotensive drug treatment was being administered. Patients in turn were considered to have dyslipidemia in the presence of low density lipoprotein-cholesterol (LDLc) ≥130mg/dl or triglycerides ≥150mg/dl, and/or lipid lowering drug treatment was being administered. Lastly, the criterion of the Spanish Society for the Study of Obesity (Sociedad Española para el Estudio de la Obesidad), published in 2007,14 was used to define obesity as a body mass index (BMI) ≥30kg/m2. Smoking was assessed on the initial visit, and was defined as at least one cigarette a day over the previous month.
- 4.
Anthropometric variables recorded initially and after 26 weeks: weight, height, BMI, SBP and DBP.
- 5.
Laboratory test parameters: glucose, the glomerular filtration rate (GFR), LDLc, high density lipoprotein-cholesterol (HDLc), triglycerides and glycosylated hemoglobin (HbA1c). These variables were recorded initially (during the 6 months prior to inclusion in the study) and after 26 weeks of follow-up. Improvement in glycemic control was defined as an Hb1Ac decrease of ≥0.8%. In patients with a duration of DM2 of over two years we also analyzed the mean HbA1c level in the two years prior to their inclusion in the study. Glycosylated hemoglobin was measured using a high-pressure ion exchange chromatography (Menarini) method, certified by the National Glycohemoglobin Standardization Program (NGSP) and standardized to the reference method of the DCCT (normal range: 4–6%). The GFR was determined using the Chronic Kidney Disease Epidemiology Collaboration equation, which includes serum creatinine, age, gender and race as variables.15
- 6.
The degree of metabolic control (blood glucose, lipids and blood pressure): the recommendations of the ADA were followed.13 The following good control objectives were established: HbA1c <7%, LDLc <100mg/dl, HDLc >40mg/dl in males and >50mg/dl in females, triglycerides <150mg/dl, SBP <140mmHg and DBP <90mmHg.
- 7.
The presence of moderate or severe hypoglycemia episodes in the year prior to inclusion in the study and after 26 weeks of follow-up. Moderate or severe hypoglycemia was defined as hypoglycemia manifesting as neuroglycopenia or loss of consciousness and requiring the help of another person to resolve the episode.
- 8.
Treatments received initially and after 26 weeks:
- -
Treatment with oral antidiabetic drugs (OADs) only. Both the number and types of OADs were assessed: metformin, sulfonylureas (SFUs), glinides, thiazolidinediones (TZDs), disaccharidase inhibitors (DIs), dipeptidyl-peptidase 4 (DPP-4) inhibitors, glucagon-like peptide 1 (GLP-1) receptor agonists, and type 2 sodium-glucose co-transporter (SGLT2) inhibitors.
- -
Treatment with insulin only. The daily dose expressed as IU/kg/day was evaluated. Five insulin regimens were defined: basal insulin in one or two daily doses, a basal-plus regimen, a basal-bolus regimen, premixed insulins in two or three daily doses, and rapid acting insulin according to capillary blood glucose control.
- -
Treatment with insulin and OADs.
- -
A change in blood glucose-lowering treatment was considered when the type of OAD was modified and/or treatment with insulin was added and/or the insulin regimen was modified. A change in the dose of a previously used OAD or insulin was not regarded as a change in the type of blood glucose-lowering treatment.
- -
- 9.
Treatment with hypotensive drugs and lipid-lowering medication initially and after 26 weeks.
The study was approved by the Clinical Research Ethics Committee of the University Hospital of Guadalajara. Informed consent was obtained from each patient prior to participation in the study.
Statistical analysisQualitative variables were reported as percentages, while quantitative variables were reported as the mean and standard deviation (SD). Comparisons of qualitative and quantitative variables were based on the chi-squared test and Student t-test for independent samples, respectively. Related data comparison between two periods was carried out using the McNemar test or the Wilcoxon test for qualitative variables and the Student t-test for related samples in the case of quantitative variables. Stepwise exclusion multiple logistic regression analysis was performed, using as dependent variable the improvement in metabolic control (HbA1c decrease ≥0.8%) between the two time periods. The parameters found to be predictors of glycemic control in other studies were entered as independent variables. Two-tailed testing was conducted in all cases, with statistical significance being considered for p<0.05. Data analysis was performed using the SPSS version 20 statistical package.
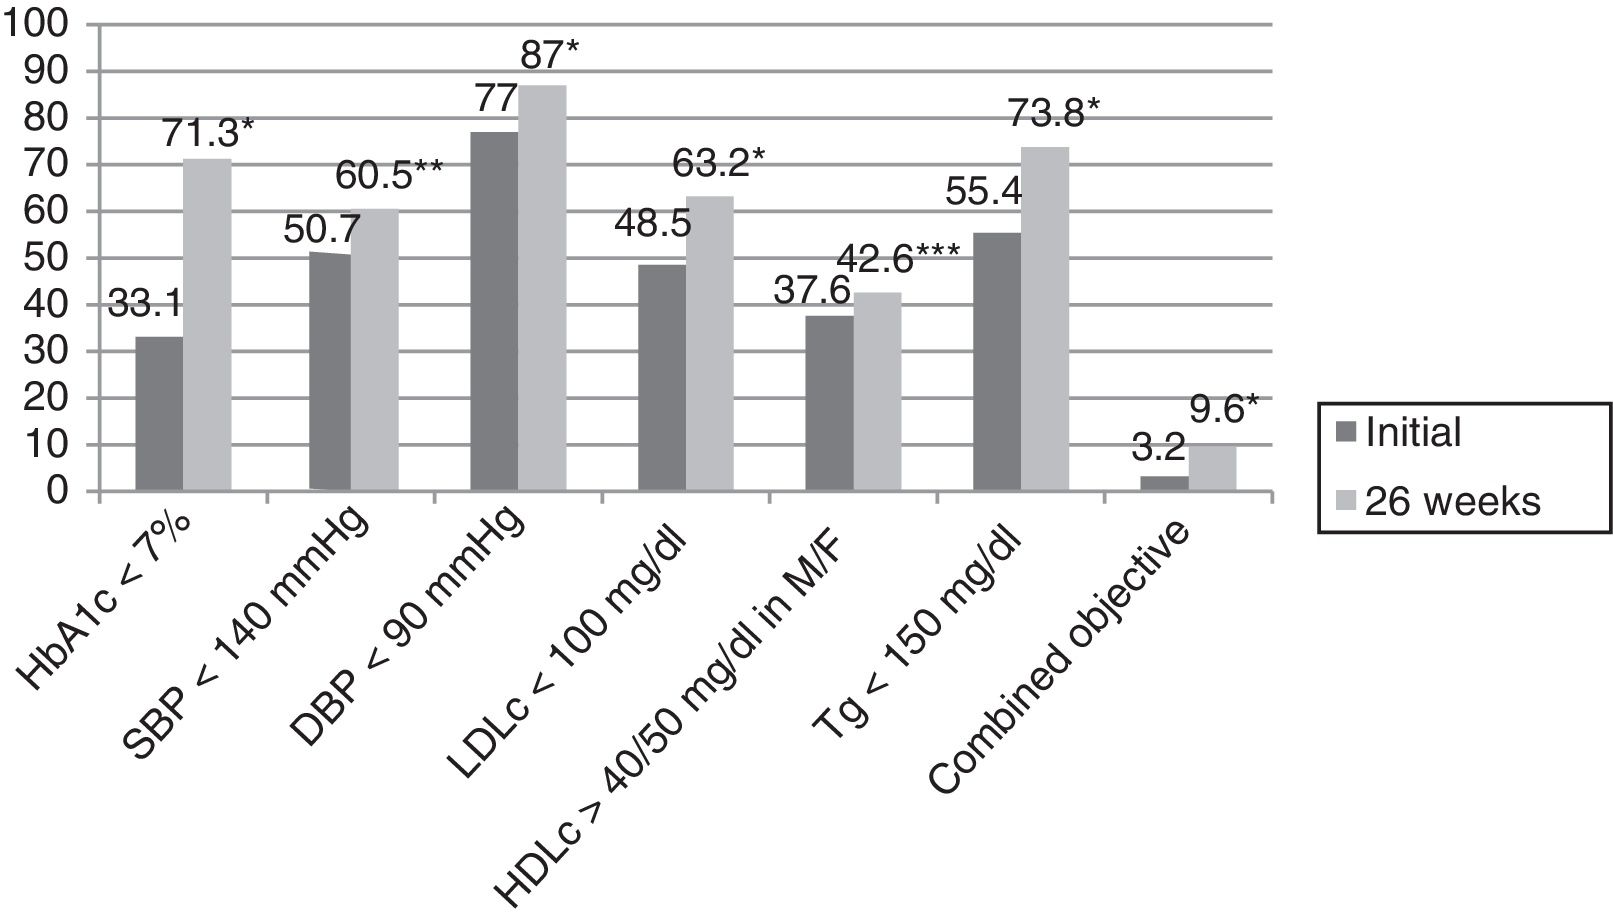
ResultsThe mean patient age was 63.4±12.5 years; 61.5% were males. The reasons for referral to the endocrinology clinic were DM in 73.3% of the cases, body weight assessment in 9%, study of thyroid gland disease in 8.6%, and assessment of nutritional status in 4.5% of the cases. The remaining 4.5% of the patients were referred for other reasons. The duration of DM2 was <1 year in 8.6% of the cases, ≥1 and <5 years in 21.5%, ≥5 and <10 years in 24.3%, and ≥10 years in 45.6%. In those patients where the reason for referral was DM, the duration of the disease was <1 year in 8.2% of the cases, ≥1 and <5 years in 18.2%, ≥5 and <10 years in 23.2%, and ≥10 years in 50.4% (p=0.03). A total of 25.4% of the patients had previously been seen at the endocrinology clinic. The number of HbA1c measurement requests in the previous two years among the patients with more than two years of DM2 was 2.3±1.4, with a mean concentration of 7.9±1.7%. In turn, 36.5% of the patients presented an HbA1c concentration in the previous two years of <7%, while 23.6%, 28.2% and 11.7% presented HbA1c ≥7% and <8%, ≥8% and <10%, and ≥10%, respectively. Eighty percent of the patients presented AHT initially, versus 80.6% after 26 weeks (p=0.35). On the other hand, 78.6% presented dyslipidemia initially, versus 83.1% after 26 weeks (p=0.009). Smoking was recorded in 16.8% of the subjects initially, though this information was not documented at the end of the study. Lastly, 61.5% versus 59.8% presented obesity initially and after 26 weeks (p=0.082). Table 1 describes the evolution of the clinical and anthropometric data in our patient cohort, while Fig. 1 reports compliance with the therapeutic objectives according to the ADA. Initially, 33.1% of the patients presented an HbA1c concentration of <7%, while 17%, 32% and 17.9% presented HbA1c ≥7% and <8%, ≥8% and <10%, and ≥10%, respectively. After 26 weeks of follow-up at the endocrinology clinic, 71.6% of the patients presented an HbA1c concentration of <7%, while 21%, 6.3% and 1.1% presented HbA1c ≥7% and <8%, ≥8% and <10%, and ≥10%, respectively (p<0.0001). A total of 25.9% of the patients had no HbA1c determination in the 6 months before the initial visit, this percentage being 23.1% among the patients referred to the SC clinic due to DM.
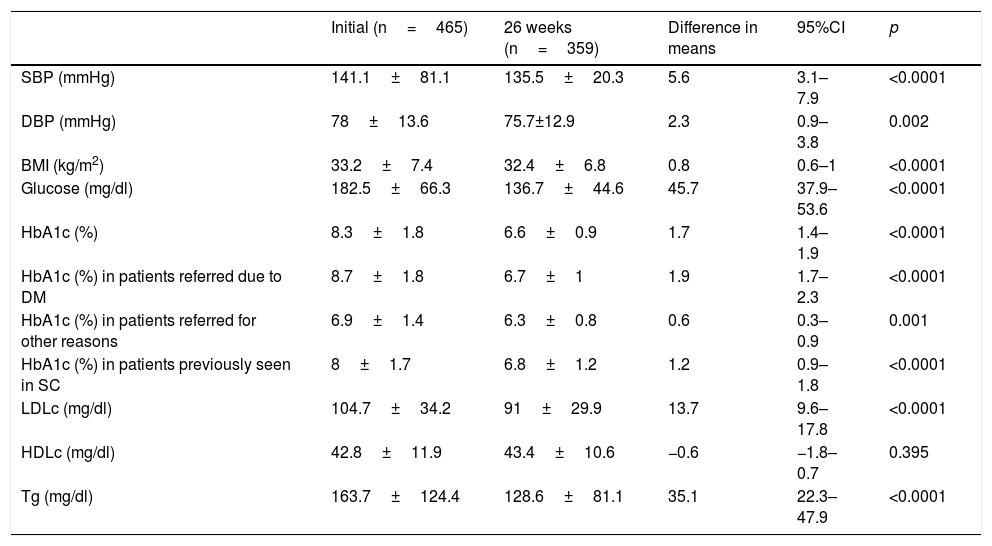
Evolution of the clinical and anthropometric data after 26 weeks of follow-up in the endocrinology clinic.
| Initial (n=465) | 26 weeks (n=359) | Difference in means | 95%CI | p | |
|---|---|---|---|---|---|
| SBP (mmHg) | 141.1±81.1 | 135.5±20.3 | 5.6 | 3.1–7.9 | <0.0001 |
| DBP (mmHg) | 78±13.6 | 75.7±12.9 | 2.3 | 0.9–3.8 | 0.002 |
| BMI (kg/m2) | 33.2±7.4 | 32.4±6.8 | 0.8 | 0.6–1 | <0.0001 |
| Glucose (mg/dl) | 182.5±66.3 | 136.7±44.6 | 45.7 | 37.9–53.6 | <0.0001 |
| HbA1c (%) | 8.3±1.8 | 6.6±0.9 | 1.7 | 1.4–1.9 | <0.0001 |
| HbA1c (%) in patients referred due to DM | 8.7±1.8 | 6.7±1 | 1.9 | 1.7–2.3 | <0.0001 |
| HbA1c (%) in patients referred for other reasons | 6.9±1.4 | 6.3±0.8 | 0.6 | 0.3–0.9 | 0.001 |
| HbA1c (%) in patients previously seen in SC | 8±1.7 | 6.8±1.2 | 1.2 | 0.9–1.8 | <0.0001 |
| LDLc (mg/dl) | 104.7±34.2 | 91±29.9 | 13.7 | 9.6–17.8 | <0.0001 |
| HDLc (mg/dl) | 42.8±11.9 | 43.4±10.6 | −0.6 | −1.8–0.7 | 0.395 |
| Tg (mg/dl) | 163.7±124.4 | 128.6±81.1 | 35.1 | 22.3–47.9 | <0.0001 |
SC: specialized care; HDLc: high density lipoprotein cholesterol; LDLc: low density lipoprotein cholesterol; DM: diabetes mellitus; HbA1c: glycosylated hemoglobin; BMI: body mass index; DBP: diastolic blood pressure; SBP: systolic blood pressure; Tg: triglycerides.
. HDLc: high density lipoprotein cholesterol; LDLc: low density lipoprotein cholesterol; M: males; HbA1c: glycosylated hemoglobin; F: females; DBP: diastolic blood pressure; SBP: systolic blood pressure; Tg: triglycerides; combined blood glucose, lipid profile and blood pressure objective. *p<0.0001. **p=0.003. ***p=0.027.")
Compliance with the therapeutic objectives according to the American Diabetes Association (ADA).
HDLc: high density lipoprotein cholesterol; LDLc: low density lipoprotein cholesterol; M: males; HbA1c: glycosylated hemoglobin; F: females; DBP: diastolic blood pressure; SBP: systolic blood pressure; Tg: triglycerides; combined blood glucose, lipid profile and blood pressure objective.
*p<0.0001.
**p=0.003.
***p=0.027.
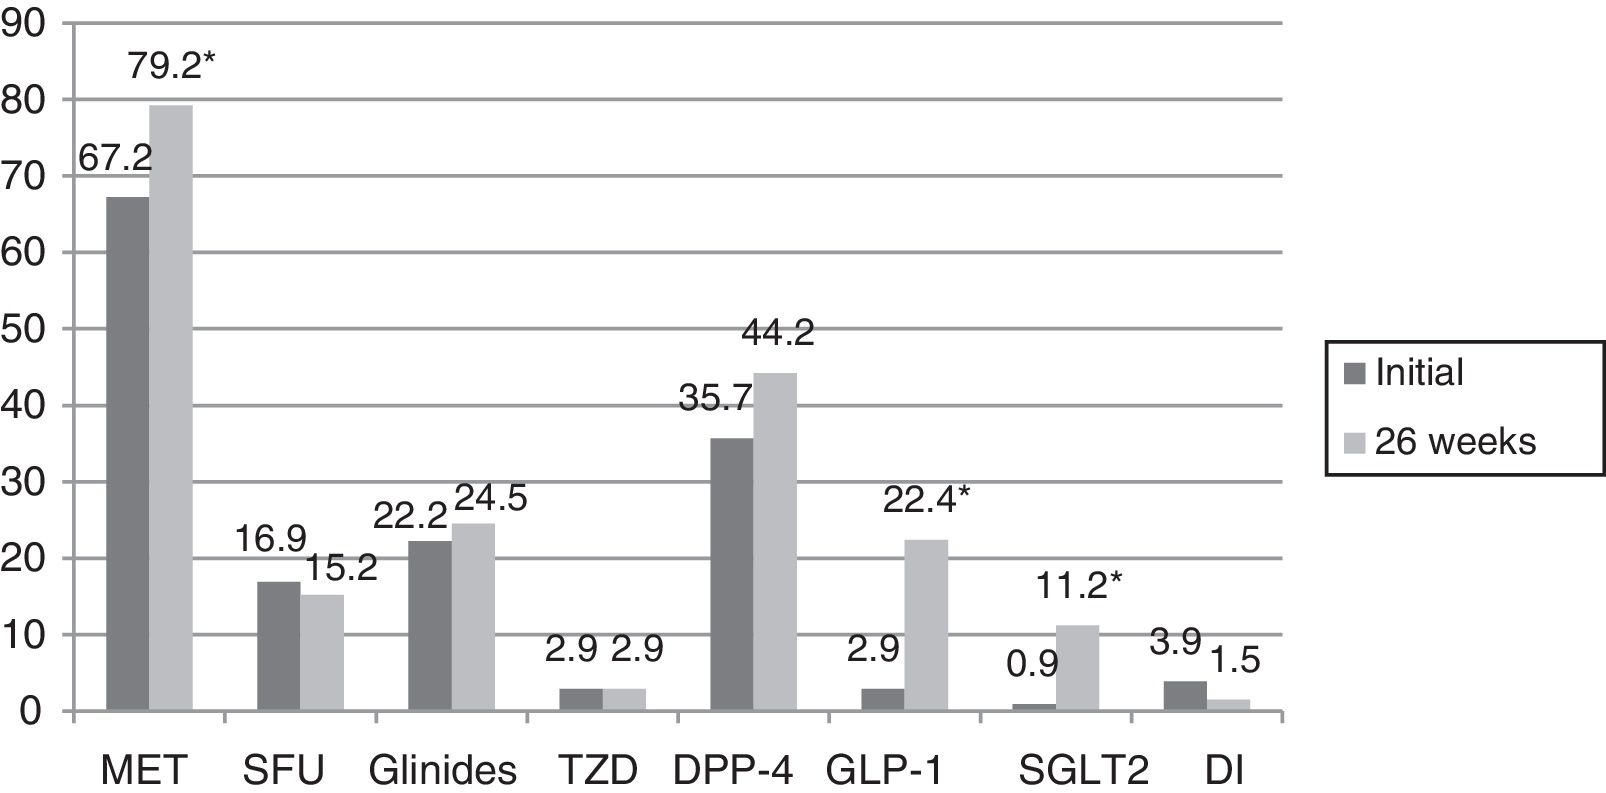
In turn, the blood glucose-lowering treatment was modified in 75.1% of the subjects with DM2 included in the study. The patients subjected to treatment modification presented a mean HbA1c concentration in the two years prior to inclusion in the study 0.83% greater than in those patients in which treatment was not modified (95%CI 0.4–1.2; p<0.0001). On the initial visit they also presented a 1.1% greater HbA1c concentration (95%CI 0.6–1.6; p<0.0001) and a 35.3mg/dl greater plasma glucose concentration (95%CI 21.5–49.1; p<0.0001). However, the change in treatment was not significantly associated with patient age, gender, the duration of DM2, the presence of other CVRFs (AHT, dyslipidemia, obesity) or the type of blood glucose-lowering treatment prescribed. Fig. 2 describes the type of blood glucose-lowering treatment received by the patients initially and after 26 weeks. On the first visit, 9.2% of the patients who had never been assessed at the SC clinic before had received no drug treatment; this percentage dropped to 2.5% in the case of those patients who had previously been seen at the SC clinic. On the other hand, 66.3% of the patients not previously seen versus 44.9% of those previously evaluated received treatment with OADs, and 24.5% versus 52.6% received insulin (alone or combined with OADs) (p<0.0001). As can be seen in Fig. 2, a total of 44.2% of the patients with DM2 received insulin therapy (alone or combined with OADs) after 26 weeks of follow-up. The patients receiving insulin presented a 6ml/min/1.73m2 lesser mean estimated GFR (95%CI 1.3–10.9; p=0.013). Insulin treatment was also associated with the duration of DM2 (insulin in 5.7%, 12%, 17.7% and 64.6% of the patients with a disease duration of <1 year, ≥1 and <5 years, ≥5 and <10 years, and ≥10 years, respectively; linear trend analysis: p<0.0001). It was also associated with poorer glycemic control (HbA1c in the previous 2 years 1.5% greater [95%CI 1.1–1.8; p<0.0001], HbA1c on the initial visit 1.5% greater [95%CI 1.1–1.9; p<0.0001] and HbA1c after 26 weeks of follow-up 0.5% greater [95%CI 0.3–0.7; p<0.0001]). However, insulin treatment on the final visit was not significantly associated with patient age, gender or the presence of other CVRFs in our cohort of patients with DM2. In those patients treated with insulin, the dose administered was 0.53±0.38IU/kg/day initially versus 0.52±0.33IU/kg/day after 26 weeks of follow-up (p=0.42). With regard to the insulin regimens employed, basal insulin in one or two doses was administered in 46.3% and 54.1% of the cases initially and after 26 weeks, respectively; basal bolus in one or two doses was used in 17.7% and 16.4%; premixed insulins in two or three doses were administered in 32% versus 27%; rapid acting insulin according to capillary blood glucose control was used in 2% and 0.6%; and basal insulin plus a rapid acting insulin dose was administered in 2% and 1.9% of the cases, respectively (p=0.261). Fig. 3 shows the types of OADs used. Initially, the number of OADs used was 1.7±0.9, while after 26 weeks the figure was seen to have increased to 2.1±0.8 (p<0.0001). After 26 weeks of follow-up at the endocrinology clinic, 31% of the patients received treatment with GLP-1 receptor agonists and/or SGLT2 inhibitors, with or without associated insulin. The patients in this group were an average of 9 years younger than those starting some other type of OAD (95%CI 6.6–11.4; p<0.0001), and had a longer duration of DM2 (treatment with GLP-1 receptor agonists and/or SGLT2 inhibitors in 9.5%, 28.6%, 34.8% and 37.1% of the patients with a disease duration of <1 year, ≥1 and <5 years, ≥5 and <10 years, and ≥10 years, respectively; linear trend analysis: p=0.046). Table 2 details the evolution of the laboratory test and anthropometric parameters in this patient group.


Type of oral antidiabetic drugs received by the patients with DM2 initially and after 26 weeks of follow-up.
GLP-1: glucagon-like peptide 1 receptor agonist; DI: disaccharidase inhibitor; DPP-4: dipeptidyl-peptidase 4 inhibitor; SGLT2: type 2 sodium-glucose co-transporter inhibitor; MET: metformin; SFU: sulfonylurea; TZD: thiazolidinedione.
*p<0.0001.
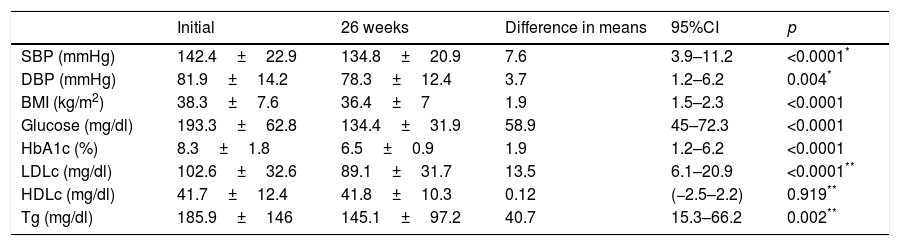
Evolution of the clinical and anthropometric data after 26 weeks of follow-up at the endocrinology clinic of patients receiving treatment with glucagon-like peptide 1 receptor agonists and/or type 2 sodium-glucose co-transporter inhibitors.
| Initial | 26 weeks | Difference in means | 95%CI | p | |
|---|---|---|---|---|---|
| SBP (mmHg) | 142.4±22.9 | 134.8±20.9 | 7.6 | 3.9–11.2 | <0.0001* |
| DBP (mmHg) | 81.9±14.2 | 78.3±12.4 | 3.7 | 1.2–6.2 | 0.004* |
| BMI (kg/m2) | 38.3±7.6 | 36.4±7 | 1.9 | 1.5–2.3 | <0.0001 |
| Glucose (mg/dl) | 193.3±62.8 | 134.4±31.9 | 58.9 | 45–72.3 | <0.0001 |
| HbA1c (%) | 8.3±1.8 | 6.5±0.9 | 1.9 | 1.2–6.2 | <0.0001 |
| LDLc (mg/dl) | 102.6±32.6 | 89.1±31.7 | 13.5 | 6.1–20.9 | <0.0001** |
| HDLc (mg/dl) | 41.7±12.4 | 41.8±10.3 | 0.12 | (−2.5–2.2) | 0.919** |
| Tg (mg/dl) | 185.9±146 | 145.1±97.2 | 40.7 | 15.3–66.2 | 0.002** |
HDLc: high density lipoprotein cholesterol; LDLc: low density lipoprotein cholesterol; HbA1c: glycosylated hemoglobin; BMI: body mass index; DBP: diastolic blood pressure; SBP: systolic blood pressure; Tg: triglycerides.
Initially, 71% of the patients with DM2 received hypotensive treatment, versus 71.3% after 26 weeks (p=0.083). By contrast, significant differences were observed with regard to lipid-lowering therapy, since initially 62.6% of the patients received such treatment, versus 71.3% after 26 weeks (p<0.0001).
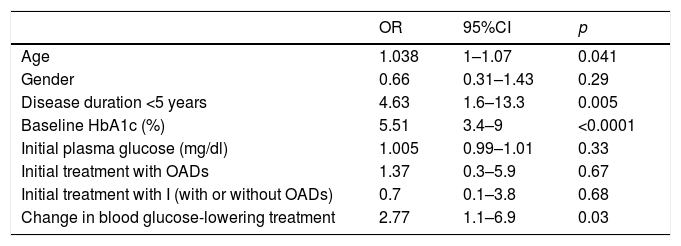
In our study, improved metabolic control (defined as an HbA1c decrease of ≥0.8%) was recorded in 59.9% of the patients. Table 3 shows the results of the logistic regression analysis for identifying the factors which correlated to improved metabolic control. The Nagelkerke R-square coefficient in the present model was 0.676; consequently, the variables entered in the model are able to explain 67.6% of the ≥0.8% decrease in HbA1c concentration.
Factors associated with improved glycemic control (HbA1c decrease ≥0.8%) in the multivariate logistic regression analysis.
| OR | 95%CI | p | |
|---|---|---|---|
| Age | 1.038 | 1–1.07 | 0.041 |
| Gender | 0.66 | 0.31–1.43 | 0.29 |
| Disease duration <5 years | 4.63 | 1.6–13.3 | 0.005 |
| Baseline HbA1c (%) | 5.51 | 3.4–9 | <0.0001 |
| Initial plasma glucose (mg/dl) | 1.005 | 0.99–1.01 | 0.33 |
| Initial treatment with OADs | 1.37 | 0.3–5.9 | 0.67 |
| Initial treatment with I (with or without OADs) | 0.7 | 0.1–3.8 | 0.68 |
| Change in blood glucose-lowering treatment | 2.77 | 1.1–6.9 | 0.03 |
OADs: oral antidiabetic drugs; HbA1c: glycosylated hemoglobin; I: insulin.
Initially, 1.3% of the patients had experienced a severe hypoglycemic episode in the year before their inclusion in the study, while after 26 weeks of follow-up a total of 1.4% had experienced an episode of this kind in the course of the study (p=0.7).
DiscussionThere is evidence of the importance of metabolic control in relation to the appearance and progression of complications associated with DM.11–13 However, reaching and maintaining the glycemic control targets constitutes a challenge in routine clinical practice, as does the management of the other associated risk factors. The two fundamental barriers facing optimum glycemic control in patients with DM2 are hypoglycemia and weight gain.16–18 Many studies in Spain have analyzed the degree of control in diabetic patients. In a study involving 3268 patients with DM2 in the Community of Madrid,19 the percentage of individuals that initially reached the glycemic control objective (HbA1c <7%) was 54.3%, while those that reached the blood pressure targets (SBP <130mmHg and DBP <80mmHg) totalled 35.3% and 51.4% respectively, and the percentage of patients that reached the lipid control objectives (LDLc <100mg/dl, HDLc >40mg/dl in males and 50mg/dl in females, and triglycerides <150mg/dl) totalled 32.7%, 57.3% and 66%, respectively. Another study conducted in PC centers throughout Spain20 analyzed data from 5382 patients, of which 49.7% presented HbA1c <7%. Lastly, a cross-sectional study carried out in Catalonia,21 involving 286,791 patients with DM2 followed-up on at PC centers, found that 56.1% of the subjects had HbA1c ≤7%; 31.7% reached the blood pressure target defined as ≤130/80mmHg; and 37.9% presented LDLc <100mg/dl. Discrepancies exist between the different studies carried out in the PC setting as regards the association between patient gender and age and the degree of blood glucose control, though it seems clear that a longer disease duration and insulin treatment are associated with a greater probability of unsatisfactory glycemic control.20–23 Studies have also been published involving diabetic patients monitored in the SC setting, where suboptimum control was likewise observed, though these were probably more complex patients. In a study of 343 type 1 and type 2 diabetic patients, only 26.5% of the subjects followed-up for four years in an endocrinology clinic achieved adequate glycemic control.24 In another published study comprising 1177 patients with DM2, only 30.4% presented HbA1c <7% after three years of follow-up in the SC setting. In turn, only 9.2% of the patients reached the combined management objective of HbA1c <7% and LDLc <100mg/dl.25 The Mediodía trial,26 comprising 1159 diabetic patients with over 10 years of disease (48% with type 1 diabetes), 25.5% were found to have HbA1c <7%, and only 4.3% of the patients reached the combined blood glucose, lipid profile and blood pressure objective. Our study revealed an improvement in glycemic control, with a statistically significant decrease in HbA1c concentration after 26 weeks of follow-up, independently of the reason for patient referral or of whether or not the patient had previously been evaluated in the SC setting. Likewise, there was an increase in the percentage of patients reaching HbA1c <7% without a rise in the number of moderate or severe hypoglycemic episodes. The parameters found to be independently associated with a decrease in HbA1c concentration of at least 0.8% were poorer initial metabolic control, a shorter duration of DM2 – probably related to a lesser deterioration of insulin secretion – and changes in blood glucose-lowering treatment. However, we did not take into account whether such changes consisted of an increase in dose or a switch to some other OAD, the start of insulin treatment, or a change in the insulin regimen. In our series, patient age was also associated with a greater probability of improved metabolic control. This was seen in another study in which older patients were found to have better glycemic control, thus bringing into question a purported lesser degree of intervention in such individuals.20 Despite the improvement in glycemic control, 28.4% of the patients failed to reach HbA1 <7% after evaluation and an intensification of their blood glucose-lowering treatment. This probably indicates that while not such strict glycemic control is pursued in some cases, in certain situations a change in treatment strategy is required, by adopting measures seeking on the one hand to promote the autonomy of the patient with DM2, and on the other to disrupt the therapeutic inertia which characterizes the management of diabetes. In turn, our study reflects improvements in the other studied parameters (SBP, DBP, LDLc, triglycerides and the BMI), indicating the global management of all the CVRFs. No improvement in HDLc levels was observed, though an increase was recorded in the percentage of patients reaching HDLc target concentrations after 26 weeks of follow-up. Likewise, there was an increase in the percentage of patients reaching the combined blood glucose, lipid profile and blood pressure objective, though the percentage remained very low.
The blood glucose-lowering treatment received by patients with DM2 has been analyzed in a number of studies. A study published in 2014,27 involving 286,791 patients diagnosed with DM2 before July 2009 and followed-up on in a PC setting, found 24.4% of the patients to be managed on the basis of changes in lifestyle only. With regard to drug treatment, 35.1%, 21% and 2.8% received one, two and three OADs, respectively, while 17.7% received insulin (alone or combined with OADs). In line with our observations, insulin therapy was basically prescribed in patients with long-evolving DM2, or in situations characterized by severe renal disease. In line with our own findings, other studies have shown poorer glycemic control to be associated with increased insulin use, either alone or combined with a larger number of OADs.23,28 Lastly, a recent study of DM2 patients followed-up on in a PC setting in the period 2007–201329 found the percentage of patients receiving drug treatment to be 71.9% in 2007, with an increase to 81.6% in 2013. The percentage of patients receiving OADs (alone or in combination) increased from 54.4% in 2007 to 61.6% in 2013. A rise in the prevalence of insulin use (alone or combined with OADs) was also observed over time, from 17.5% in 2007 to 20% in 2013. This latter study also evaluated the data according to the type of OAD involved. An increase was noted between 2007 and 2013 in the percentage of patients who were administered metformin, glinides, DPP-4 inhibitors and GLP-1 receptor agonists. By contrast, the percentage of patients receiving SFUs, DIs and glitazones was seen to decrease. In our study 75.1% of the patients received a change in treatment. After 26 weeks of follow-up, the percentage of patients receiving combination therapy with OADs plus insulin was found to have increased significantly, as had the number of OADs used. The percentage of patients receiving metformin, GLP-1 receptor agonists and SGLT2 inhibitors was seen to increase. There was also an increase in the use of DPP-4 inhibitors and glinides, though in this case statistical significance was not reached, as well as a decrease in the use of SFUs and DIs, while the percentage of patients receiving TZDs remained stable. A number of studies have reported an increase in metformin use among patients with DM2, and a decrease in the prescription of SFUs.29–31 In our case, we likewise recorded an increase in the use of GLP-1 receptor agonists and SGLT2 inhibitors, which in part could explain the decrease in the BMI recorded after 26 weeks of follow-up at the SC clinic, despite the improvement in metabolic control. However, it should be taken into account that these are drugs requiring (or which have required) inspection certification, a fact that complicates their use in a PC setting. Of note is the large percentage of patients receiving glinides, the figures being higher than those reported elsewhere.29
This study has a number of limitations. On one hand, the patients comprised those seen in two of the four endocrinology consulting rooms at Guadalajara University Hospital; as a result, the data cannot be extrapolated to all the DM2 patients referred to SC in our healthcare area. Another limitation is the large percentage of patients that had no HbA1c determination in the 6 months before the initial visit, even when DM was the reason for referral, as well as the high percentage of patients that failed to report for follow-up. These data point to the need to improve the management of patients with DM2, but limit interpretation of the information relating to improved glycemic control. Furthermore, in our series non-pharmacological interventions, such as follow-up at the educational nursing clinic or nutritional management, were not compiled. Finally, the proposed glycemic control objectives (HbA1c <7%) were not individualized according to the characteristics of the patients and the associated comorbidities. Nevertheless, a series of conclusions can be drawn from the study, such as the fact that DM2 patients very often present other CVRFs which, in turn, require an integral management approach, and the observation of improved glycemic control in this cohort of patients with DM2 after their evaluation by SC, though in many cases the treatment objectives may be difficult to achieve in routine clinical practice.
Conflicts of interestThe authors declare that they have no conflicts of interest.
Please cite this article as: Herranz-Antolín S, Álvarez-de Frutos V, Torralba M. Evolución clínica de una cohorte de pacientes con diabetes mellitus tipo 2 tras su valoración en endocrinología. Estudio a 26 semanas. Endocrinol Diabetes Nutr. 2018;65:220–228.