


The prevalence of type 2 diabetes (T2D) is high, it is increasing and its degree of control seems to be improvable with important social and health consequences. The objective of this study is to determine the regional differences in the degree of glycaemic control of T2D in Spain and its associated factors.
Material and methodsCross-sectional, multicentre, observational study in patients with T2D between 18 and 85 years of age selected by consecutive sampling between 2014 and 2018. The population was divided into four regions: north, centre, Mediterranean and south-east. The main variable was the value of glycated haemoglobin (HbA1c). Sociodemographic and clinical variables, presence or absence of other risk factors and treatment were recorded.
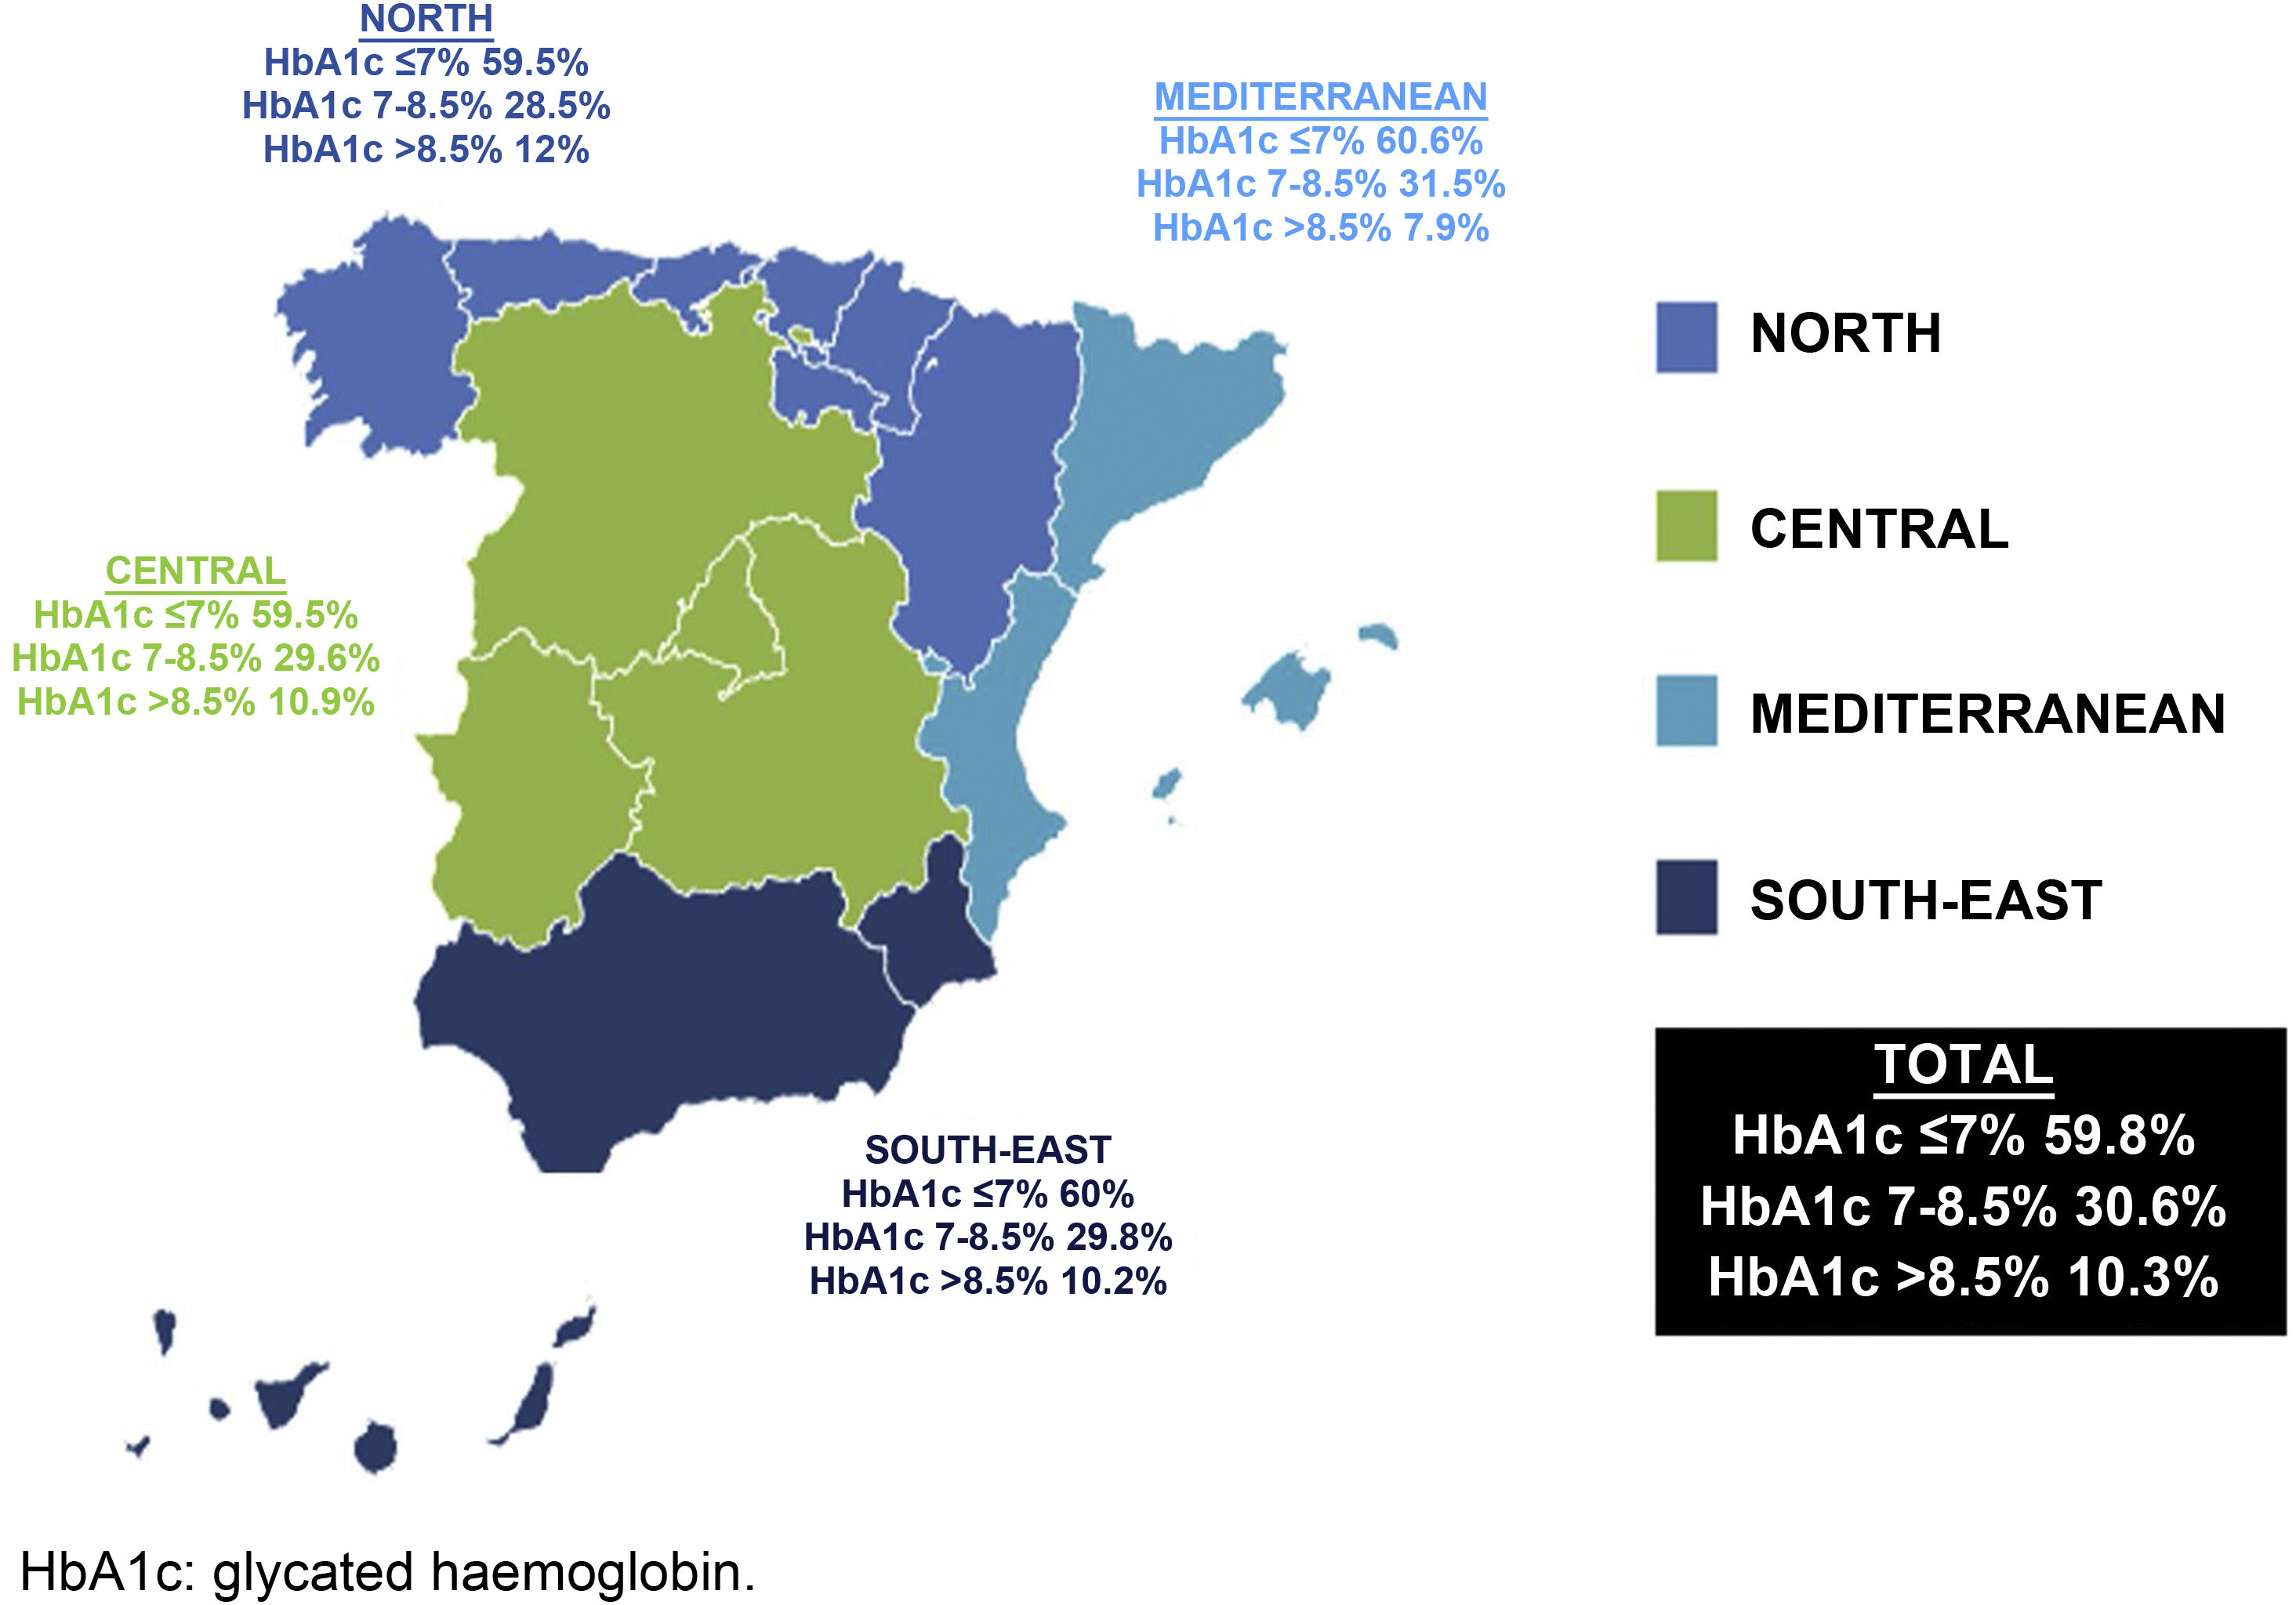
ResultsA total of 1587 patients with T2D were analysed, with a mean age of 65.93 years (standard deviation [SD] 10.14); 54.5% were men; the mean duration of T2D was 8.63 years (SD 6.64) and the mean HbA1c value was 7.05%. Of the total, 59.8% had an HbA1c value ≤ 7% (north 59.5%, centre 59.5%, Mediterranean 60.6% and south-east 59.8%; P=.99). The factors for poor control were: in the north, duration of T2D and being sedentary; in the centre, duration of T2D and having a low income; in the Mediterranean, duration of T2D; and in the south-east, duration of T2D and having a low level of education or income. Overall, 76.2% of the subjects had hypertension, 75.1% dyslipidaemia, and 51.7% obesity, with significant differences between regions only being observed in the case of dyslipidaemia (P<.001).
ConclusionsNo differences were observed in the degree of diabetes control in the different regions, with the percentage of patients needing intensification in their control being high in all of them. The factors associated with poor control were the duration of the disease, a low level of education or income, and a sedentary lifestyle.
La prevalencia de diabetes tipo 2 (DM2) es elevada, está aumentando y su grado de control parece mejorable, con importantes consecuencias sociosanitarias. El objetivo de este estudio es conocer las diferencias regionales en el grado de control glucémico de la DM2 en España y sus factores asociados.
Materiales y métodosEstudio transversal, multicéntrico, observacional en pacientes con DM2 entre 18 y 85 años seleccionados por muestreo consecutivo entre 2014 y 2018. Se dividió la población en cuatro regiones: Norte, Centro, Mediterráneo y Sureste. La variable principal fue el valor de la hemoglobina glucosilada (HbA1c). Se registraron variables sociodemográficas, clínicas, presencia o no de otros factores de riesgo y tratamiento.
ResultadosFueron analizados 1.587 pacientes con DM2, con una edad de 65,93 (desviación estándar [DE] 10,14) años, el 54,5% eran hombres, la antigüedad media de la DM2 era de 8,63 (DE 6,64) años y la HbA1c media era del 7,05%. El 59,8% tenían una HbA1c≤7% (Norte 59,5%, Centro 59,5%, Mediterráneo 60,6% y Sureste 59,8%; p=0,99). Los factores de mal control fueron en el Norte la antigüedad de la DM2 y ser sedentario; en el Centro, la antigüedad de la DM2 y tener un bajo nivel de renta; en el Mediterráneo, la antigüedad de la DM2, y en el Sureste, la antigüedad de la DM2 y tener un bajo nivel de estudios o renta. El 76,2% de los sujetos presentaban hipertensión; el 75,1%, dislipemia, y el 51,7%, obesidad, observándose solo diferencias significativas entre regiones en el caso de la dislipemia (p<0,001).
ConclusionesNo se observaron diferencias en el grado de control de la diabetes en las diferentes regiones, siendo el porcentaje de pacientes con necesidad de intensificación en su control elevado en todas ellas. Los factores asociados al mal control fueron la antigüedad de la enfermedad, un bajo nivel de estudios y de renta, y el sedentarismo.
Type 2 diabetes mellitus (T2DM) is a chronic and heterogeneous metabolic disease with incidence and prevalence rates that are continuously growing, making it one of the most significant health and social problems today.1 Therapeutic goals in diabetes are focused on avoiding acute complications, preventing or delaying the onset of chronic complications, reducing morbidity and mortality, and obtaining or maintaining an adequate quality of life for patients.1
The most recommended analytical parameter for monitoring glycaemic control is glycated haemoglobin (HbA1c),2 and most clinical practice guidelines (CPGs)3–5 indicate HbA1c ≤7% as the target for good control, which may be more or less lenient depending on age and other comorbidities. Although there are no recent Spanish studies on this subject, several published papers have shown that despite the available scientific evidence and the existence of multiple CPGs, the degree of control of T2DM remains suboptimal, with figures ranging from 30% to 69% of patients with HbA1c >7%.6–19 The criteria regarding degree of control differs among these studies and most of them analysed only one population or region, offering diverse information on factors that may be associated with glycaemic control.
Moreover, several studies have been published that show significant differences in cardiovascular mortality in the different autonomous communities and regions of Spain, it being lower in the northern communities and higher in the south-east.20 These findings motivated this study, which aimed to identify whether there are regional differences in the degree of diabetes control, as well as factors associated with poor control in each region.
Participants and methodsStudy designThis was a cross-sectional, multicentre, observational study in patients with T2DM aged 18–85 years selected with consecutive sampling between 2014 and 2018. The data analysed were collected at the inclusion visit of the IBERICAN study (identification of the Spanish population at cardiovascular and renal risk), which is an epidemiological, multicentre, observational and prospective cohort study conducted in the primary care setting in Spain.21
The study was approved by the Independent Ethics Committee of the Hospital Clínico San Carlos [San Carlos Clinical Hospital], Madrid on 21 February 2013 (C.P. IBERICAN-C.I. 13/047-E) and is registered at https://clinicaltrials.gov under number NCT02261441.
Inclusion and exclusion criteriaThe investigators, family doctors, included all users of the Spanish National Health System resident in Spain in the last five years as part of the study doctor's quota, of either gender, between 18 and 85 years of age, with and without cardiovascular risk factors (CVRF) and with or without previous cardiovascular disease, seen at primary care centres of all the autonomous communities of Spain. The exclusion criteria were change of habitual residence to another city or country in the following six years, terminal disease or life expectancy less than five years, manifest difficulty with follow-up in primary care and/or refusal to continue participating in the study.
The data obtained at the inclusion visit (2014–2018) from patients between 18 and 85 years of age diagnosed with diabetes and treated at primary care clinics in Spain were analysed. The investigators signed up voluntarily. Patients were selected by consecutive random sampling from those who attended a consultation during the recruitment period. For this analysis, the population was divided into four regions in Spain, similar to the methodology used by other studies22: north (Aragon, Cantabria, Galicia, La Rioja, Navarre, Basque Country and Principality of Asturias), central (Castile-La Mancha, Castile and Leon, Community of Madrid and Extremadura), Mediterranean (Catalonia, Valencian Community and Balearic Islands) and south-east (Andalusia, Canary Islands, Melilla and Region of Murcia).
Variables included in the study and evaluation criteriaThe primary variable of the study was HbA1c, with good glycaemic control defined as HbA1c ≤7%and poor control as >7%.3
Other variables taken into account were gender (male/female), age (>70 years/≤70 years), length of time with diabetes (>10 years/≤10 years), place of residence (urban/semi-urban/rural), level of education (no education or basic education/higher education or university), employment status (working, retired, unemployed, student or home-maker), income level (low or less than €18,000/medium-high or more than €18,000), baseline blood glucose, LDL and HDL cholesterol, triglycerides, systolic and diastolic blood pressure, the presence or absence of other CVRFs (arterial hypertension [whether previously diagnosed or otherwise], dyslipidaemia [whether previously diagnosed or otherwise], obesity [BMI>30kg/m2], smoking [never smoked, ex-smoker or active smoker]), presence or absence of increased abdominal girth (>102 in men and >88 in women), excessive alcohol consumption (toxic alcohol habit: daily consumption of more than four glasses of wine or four beers or three glasses of cognac, anis, patxaran or the like, or two whiskies or combination), doing physical exercise or physical activity for more than 60min compared to less than 30min of physical activity or absence of activity, the Diet Score as a method to evaluate adherence to the Mediterranean diet23 established in three categories (adherence is established by tertiles depending on gender, as per the following cut-off points in each case: low adherence [men: 0−33; women: 0−36], average adherence [men: 34−37; women: 37−40] and high adherence [men: ≥38; women: ≥41]), the presence or absence of treatment (hygienic-dietary measures, diet+exercise, metformin, sulfonylureas, glinides, glitazones, dipeptidyl peptidase 4 inhibitors [DPP-4 inhibitors], glucagon-like peptide 1 analogues [GLP-1 analogues], sodium-glucose cotransporter 2 inhibitors [SGLT2 inhibitors], insulin and others).
Statistical analysisQualitative variables were defined as absolute and relative frequencies, and continuous variables as mean (SD). Statistical tests were performed according to the nature of the variables. To study the relationship of the categorical variables, the chi-squared test (χ2) was used (where more than 20% of the cells had an expected frequency of less than five, Fisher's exact test was used). Student's t-test was used to compare continuous variables between groups of patients.
An unconditional binary logistic regression analysis was performed, taking as a dependent variable the degree of diabetes control (HbA1c), coded as 1 (poor control = HbA1c >7%) and 0 (good control=HbA1c ≤7%). All those variables that showed a p-value <0.05 in bivariate association with the dependent variable were included as independent variables in the initial model. From the initial model, the non-significant variables were manually eliminated, until the final model was reached. A model was developed for each of the four geographical areas.
All comparisons rejected the null hypothesis with an alpha error <0.05. IBM SPSS version 22.0 was used for data analysis.
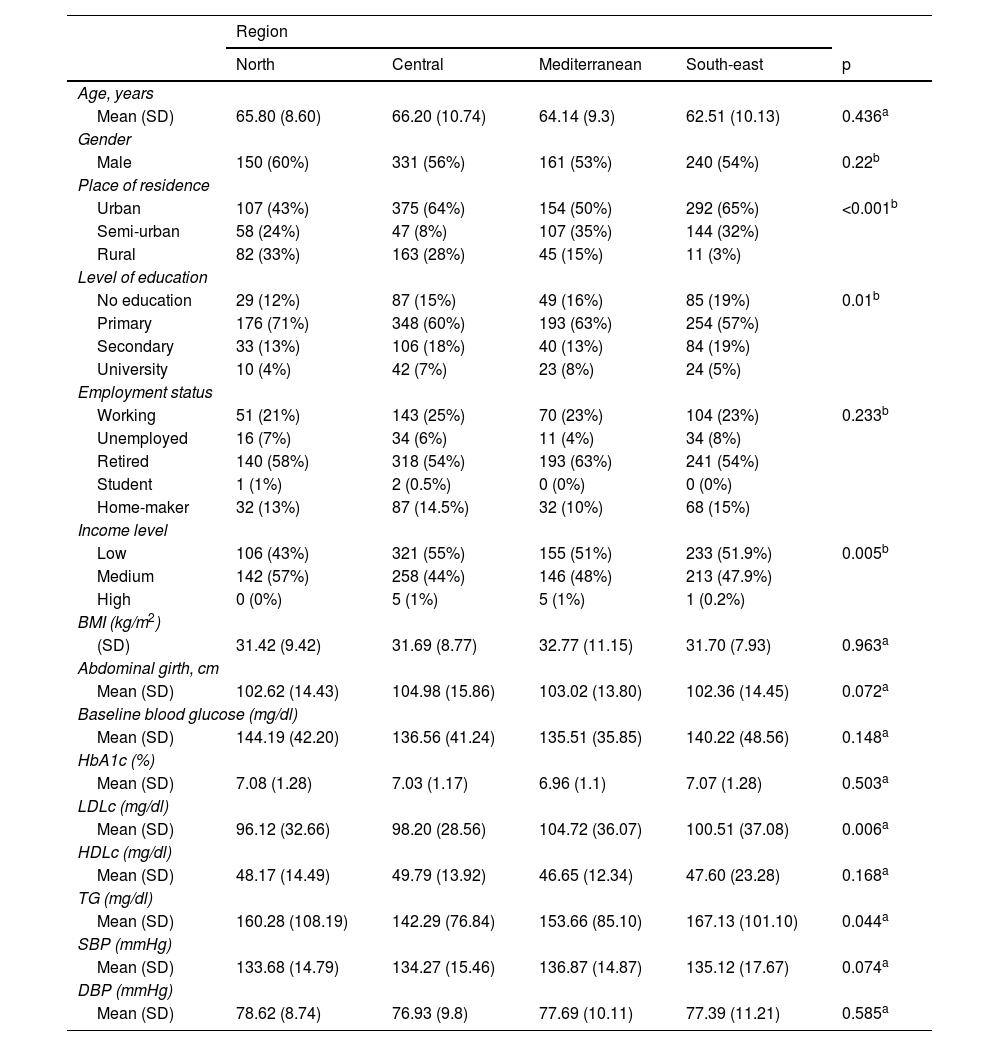
ResultsThe IBERICAN study cohort consisted of 8112 patients, of which 62 were eliminated due to lack of quality in the data collected, resulting in a final sample of 8050 patients. In this study, the data from the 1586 patients diagnosed with T2DM, collected at the first study visit from all the autonomous communities except the city of Ceuta, were analysed and distributed by region as follows: north (n=248), central (n=586), Mediterranean (n=306) and south-east (n=446). The main sociodemographic and clinical characteristics of the study population are summarised in Table 1. The sociodemographic profile of the patient with T2DM analysed in this study was male, retired, uneducated or with basic education living in an urban area with a low or average annual income, with significant differences observed between regions regarding the place of residence (p<0.001), the level of education (p=0.01) and the income level (p=0.005).
Sociodemographic and clinical characteristics of the study population and differences by geographical regions.
| Region | |||||
|---|---|---|---|---|---|
| North | Central | Mediterranean | South-east | p | |
| Age, years | |||||
| Mean (SD) | 65.80 (8.60) | 66.20 (10.74) | 64.14 (9.3) | 62.51 (10.13) | 0.436a |
| Gender | |||||
| Male | 150 (60%) | 331 (56%) | 161 (53%) | 240 (54%) | 0.22b |
| Place of residence | |||||
| Urban | 107 (43%) | 375 (64%) | 154 (50%) | 292 (65%) | <0.001b |
| Semi-urban | 58 (24%) | 47 (8%) | 107 (35%) | 144 (32%) | |
| Rural | 82 (33%) | 163 (28%) | 45 (15%) | 11 (3%) | |
| Level of education | |||||
| No education | 29 (12%) | 87 (15%) | 49 (16%) | 85 (19%) | 0.01b |
| Primary | 176 (71%) | 348 (60%) | 193 (63%) | 254 (57%) | |
| Secondary | 33 (13%) | 106 (18%) | 40 (13%) | 84 (19%) | |
| University | 10 (4%) | 42 (7%) | 23 (8%) | 24 (5%) | |
| Employment status | |||||
| Working | 51 (21%) | 143 (25%) | 70 (23%) | 104 (23%) | 0.233b |
| Unemployed | 16 (7%) | 34 (6%) | 11 (4%) | 34 (8%) | |
| Retired | 140 (58%) | 318 (54%) | 193 (63%) | 241 (54%) | |
| Student | 1 (1%) | 2 (0.5%) | 0 (0%) | 0 (0%) | |
| Home-maker | 32 (13%) | 87 (14.5%) | 32 (10%) | 68 (15%) | |
| Income level | |||||
| Low | 106 (43%) | 321 (55%) | 155 (51%) | 233 (51.9%) | 0.005b |
| Medium | 142 (57%) | 258 (44%) | 146 (48%) | 213 (47.9%) | |
| High | 0 (0%) | 5 (1%) | 5 (1%) | 1 (0.2%) | |
| BMI (kg/m2) | |||||
| (SD) | 31.42 (9.42) | 31.69 (8.77) | 32.77 (11.15) | 31.70 (7.93) | 0.963a |
| Abdominal girth, cm | |||||
| Mean (SD) | 102.62 (14.43) | 104.98 (15.86) | 103.02 (13.80) | 102.36 (14.45) | 0.072a |
| Baseline blood glucose (mg/dl) | |||||
| Mean (SD) | 144.19 (42.20) | 136.56 (41.24) | 135.51 (35.85) | 140.22 (48.56) | 0.148a |
| HbA1c (%) | |||||
| Mean (SD) | 7.08 (1.28) | 7.03 (1.17) | 6.96 (1.1) | 7.07 (1.28) | 0.503a |
| LDLc (mg/dl) | |||||
| Mean (SD) | 96.12 (32.66) | 98.20 (28.56) | 104.72 (36.07) | 100.51 (37.08) | 0.006a |
| HDLc (mg/dl) | |||||
| Mean (SD) | 48.17 (14.49) | 49.79 (13.92) | 46.65 (12.34) | 47.60 (23.28) | 0.168a |
| TG (mg/dl) | |||||
| Mean (SD) | 160.28 (108.19) | 142.29 (76.84) | 153.66 (85.10) | 167.13 (101.10) | 0.044a |
| SBP (mmHg) | |||||
| Mean (SD) | 133.68 (14.79) | 134.27 (15.46) | 136.87 (14.87) | 135.12 (17.67) | 0.074a |
| DBP (mmHg) | |||||
| Mean (SD) | 78.62 (8.74) | 76.93 (9.8) | 77.69 (10.11) | 77.39 (11.21) | 0.585a |
BMI: body mass index; DBP: diastolic blood pressure; HbA1c: glycated haemoglobin; HDLc: HDL cholesterol; LDLc: LDL cholesterol; SBP: systolic blood pressure; SD: standard deviation; TG: triglycerides.
Regarding the degree of control, it was observed that 40.9% of the patients had poor control (HbA1c >7%) (north 40.5%, central 40.5%, Mediterranean 39.4% and south-east 40%), without significant differences between regions (p=0.99). In patients over the age of 75 years (20.5% of the sample), with a more lenient degree of control target (HbA1c >8%), 20.1% had poor control (Fig. 1).

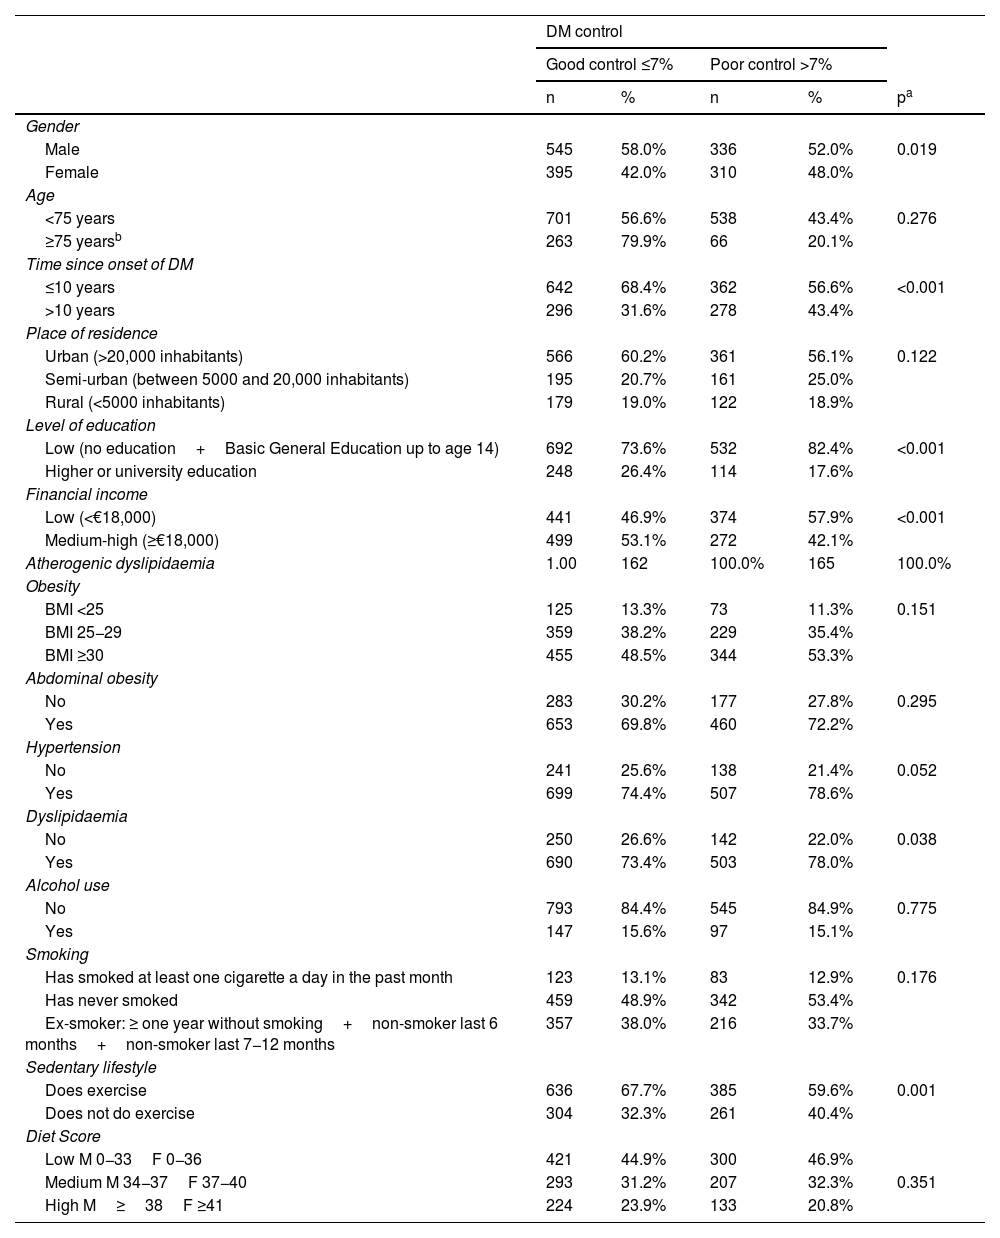
Regarding factors associated with poor diabetes control (Table 2), it was observed that being male, having had the disease for more than 10 years, having a low level of education or low income, dyslipidaemia or being sedentary were associated with worse glycaemic control. By region, the factors associated with poor control were: in the north, time since onset of T2DM and being sedentary; in the central region, time since onset of T2DM and having a low level of income; in the Mediterranean, time since onset of T2DM; and in the south-east, time since onset of T2DM and having a low level of education or income. In the unconditional binary logistic regression model, with the dependent variable HbA1c >7%, the following were observed as significant variables: having had T2DM for more than 10 years versus fewer than 10 years resulted in a 1.8-fold greater likelihood of HbA1c being poorly controlled (95% CI: 1.01–3.19) in the north; a 1.66-fold greater likelihood (95% CI: 1.17–2.34) in the central region; a 1.63-fold greater likelihood (95% CI: 1.02–2.60) in the Mediterranean; and a 1.67-fold greater likelihood (95% CI: 1.12–2.49) in the south-east. Not doing any exercise versus doing exercise multiplied the likelihood of poor glycaemic control by 1.85 (95% CI: 1.02–3.36) in the north and by 1.34 (95% CI: 0.96–1.89) in the central region. Having a medium-high income level compared to having a low income level multiplied the likelihood of poor glycaemic control by 0.64 (95% CI: 0.45−0.89) in the central region, and having higher or university education or a medium-high income level compared to having basic education or a low income multiplied the likelihood of HbA1c being poorly controlled by 0.47 (95% CI: 0.28−0.81), and by 0.63 (95% CI: 0.41−0.96) in the south-east, respectively.
Unconditional binary logistic regression model, taking the degree of diabetes control (HbA1c) as the dependent variable.
| DM control | |||||
|---|---|---|---|---|---|
| Good control ≤7% | Poor control >7% | ||||
| n | % | n | % | pa | |
| Gender | |||||
| Male | 545 | 58.0% | 336 | 52.0% | 0.019 |
| Female | 395 | 42.0% | 310 | 48.0% | |
| Age | |||||
| <75 years | 701 | 56.6% | 538 | 43.4% | 0.276 |
| ≥75 yearsb | 263 | 79.9% | 66 | 20.1% | |
| Time since onset of DM | |||||
| ≤10 years | 642 | 68.4% | 362 | 56.6% | <0.001 |
| >10 years | 296 | 31.6% | 278 | 43.4% | |
| Place of residence | |||||
| Urban (>20,000 inhabitants) | 566 | 60.2% | 361 | 56.1% | 0.122 |
| Semi-urban (between 5000 and 20,000 inhabitants) | 195 | 20.7% | 161 | 25.0% | |
| Rural (<5000 inhabitants) | 179 | 19.0% | 122 | 18.9% | |
| Level of education | |||||
| Low (no education+Basic General Education up to age 14) | 692 | 73.6% | 532 | 82.4% | <0.001 |
| Higher or university education | 248 | 26.4% | 114 | 17.6% | |
| Financial income | |||||
| Low (<€18,000) | 441 | 46.9% | 374 | 57.9% | <0.001 |
| Medium-high (≥€18,000) | 499 | 53.1% | 272 | 42.1% | |
| Atherogenic dyslipidaemia | 1.00 | 162 | 100.0% | 165 | 100.0% |
| Obesity | |||||
| BMI <25 | 125 | 13.3% | 73 | 11.3% | 0.151 |
| BMI 25−29 | 359 | 38.2% | 229 | 35.4% | |
| BMI ≥30 | 455 | 48.5% | 344 | 53.3% | |
| Abdominal obesity | |||||
| No | 283 | 30.2% | 177 | 27.8% | 0.295 |
| Yes | 653 | 69.8% | 460 | 72.2% | |
| Hypertension | |||||
| No | 241 | 25.6% | 138 | 21.4% | 0.052 |
| Yes | 699 | 74.4% | 507 | 78.6% | |
| Dyslipidaemia | |||||
| No | 250 | 26.6% | 142 | 22.0% | 0.038 |
| Yes | 690 | 73.4% | 503 | 78.0% | |
| Alcohol use | |||||
| No | 793 | 84.4% | 545 | 84.9% | 0.775 |
| Yes | 147 | 15.6% | 97 | 15.1% | |
| Smoking | |||||
| Has smoked at least one cigarette a day in the past month | 123 | 13.1% | 83 | 12.9% | 0.176 |
| Has never smoked | 459 | 48.9% | 342 | 53.4% | |
| Ex-smoker: ≥ one year without smoking+non-smoker last 6 months+non-smoker last 7−12 months | 357 | 38.0% | 216 | 33.7% | |
| Sedentary lifestyle | |||||
| Does exercise | 636 | 67.7% | 385 | 59.6% | 0.001 |
| Does not do exercise | 304 | 32.3% | 261 | 40.4% | |
| Diet Score | |||||
| Low M 0−33F 0−36 | 421 | 44.9% | 300 | 46.9% | |
| Medium M 34−37F 37−40 | 293 | 31.2% | 207 | 32.3% | 0.351 |
| High M≥38F ≥41 | 224 | 23.9% | 133 | 20.8% | |
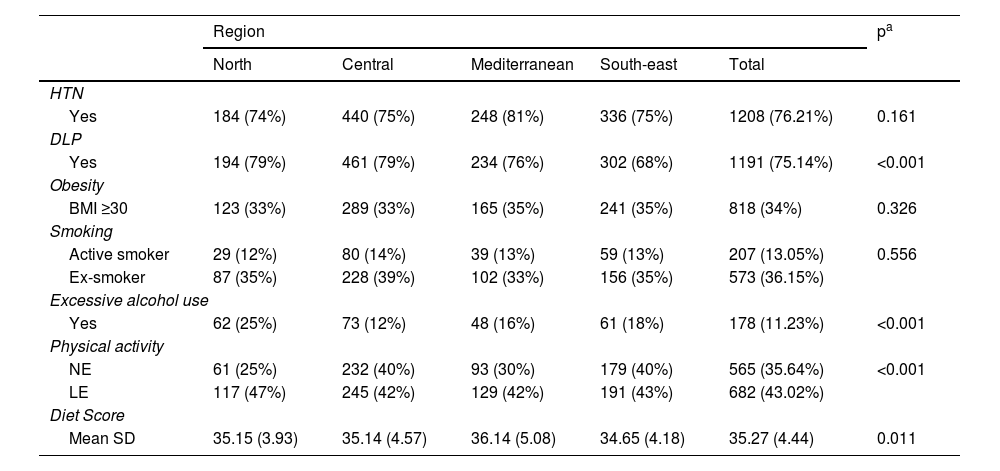
Regarding lifestyle, it was observed that most patients with T2DM are sedentary or have low levels of physical activity (78.66%), while 11.23% consume alcohol in excess and have low adherence to the Mediterranean diet (35.27 [SD 4.44] points), with differences observed between regions in all cases except in smoking. Regarding the prevalence of other CVRFs, it was observed that 76.2% of the subjects were hypertensive; 75.1% had dyslipidaemia and 51.7% lived with obesity, with significant differences between regions in the case of dyslipidaemia (p<0.001). The finding of several concurrent CVRFs in patients with T2DM was high: 78.3% had two or more CVRFs and 38.4% had three or more CVRFs (no differences between regions; p=0.144) (Table 3).
Distribution of other cardiovascular risk factors (CVRFs) and lifestyles by geographical region.
| Region | pa | |||||
|---|---|---|---|---|---|---|
| North | Central | Mediterranean | South-east | Total | ||
| HTN | ||||||
| Yes | 184 (74%) | 440 (75%) | 248 (81%) | 336 (75%) | 1208 (76.21%) | 0.161 |
| DLP | ||||||
| Yes | 194 (79%) | 461 (79%) | 234 (76%) | 302 (68%) | 1191 (75.14%) | <0.001 |
| Obesity | ||||||
| BMI ≥30 | 123 (33%) | 289 (33%) | 165 (35%) | 241 (35%) | 818 (34%) | 0.326 |
| Smoking | ||||||
| Active smoker | 29 (12%) | 80 (14%) | 39 (13%) | 59 (13%) | 207 (13.05%) | 0.556 |
| Ex-smoker | 87 (35%) | 228 (39%) | 102 (33%) | 156 (35%) | 573 (36.15%) | |
| Excessive alcohol use | ||||||
| Yes | 62 (25%) | 73 (12%) | 48 (16%) | 61 (18%) | 178 (11.23%) | <0.001 |
| Physical activity | ||||||
| NE | 61 (25%) | 232 (40%) | 93 (30%) | 179 (40%) | 565 (35.64%) | <0.001 |
| LE | 117 (47%) | 245 (42%) | 129 (42%) | 191 (43%) | 682 (43.02%) | |
| Diet Score | ||||||
| Mean SD | 35.15 (3.93) | 35.14 (4.57) | 36.14 (5.08) | 34.65 (4.18) | 35.27 (4.44) | 0.011 |
BMI: body mass index; DLP: dyslipidaemia; HTN: arterial hypertension; LE: low exercise (less than one hour per day); NE: no exercise; SD: standard deviation.
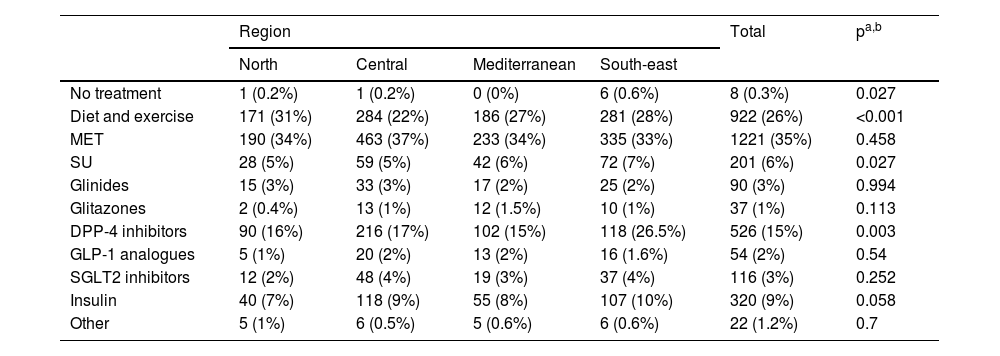
Regarding treatment, Table 4 describes the different treatments received by patients with T2DM in the regions analysed, with metformin being the most prescribed anti-diabetic agent in all, followed by DPP-4 inhibitors, insulins and sulfonylureas. Differences were observed between regions in the prescription of diet and exercise, sulfonylureas and DPP-4 inhibitors.
Distribution of the different treatments received by patients with T2DM by geographical region.
| Region | Total | pa,b | ||||
|---|---|---|---|---|---|---|
| North | Central | Mediterranean | South-east | |||
| No treatment | 1 (0.2%) | 1 (0.2%) | 0 (0%) | 6 (0.6%) | 8 (0.3%) | 0.027 |
| Diet and exercise | 171 (31%) | 284 (22%) | 186 (27%) | 281 (28%) | 922 (26%) | <0.001 |
| MET | 190 (34%) | 463 (37%) | 233 (34%) | 335 (33%) | 1221 (35%) | 0.458 |
| SU | 28 (5%) | 59 (5%) | 42 (6%) | 72 (7%) | 201 (6%) | 0.027 |
| Glinides | 15 (3%) | 33 (3%) | 17 (2%) | 25 (2%) | 90 (3%) | 0.994 |
| Glitazones | 2 (0.4%) | 13 (1%) | 12 (1.5%) | 10 (1%) | 37 (1%) | 0.113 |
| DPP-4 inhibitors | 90 (16%) | 216 (17%) | 102 (15%) | 118 (26.5%) | 526 (15%) | 0.003 |
| GLP-1 analogues | 5 (1%) | 20 (2%) | 13 (2%) | 16 (1.6%) | 54 (2%) | 0.54 |
| SGLT2 inhibitors | 12 (2%) | 48 (4%) | 19 (3%) | 37 (4%) | 116 (3%) | 0.252 |
| Insulin | 40 (7%) | 118 (9%) | 55 (8%) | 107 (10%) | 320 (9%) | 0.058 |
| Other | 5 (1%) | 6 (0.5%) | 5 (0.6%) | 6 (0.6%) | 22 (1.2%) | 0.7 |
DPP-4 inhibitors: dipeptidyl peptidase 4 inhibitors; GLP-1 analogues: glucagon-like peptide 1 analogues; MET: metformin; SGLT2 inhibitors: sodium-glucose cotransporter 2 inhibitors; SU: sulfonylureas.
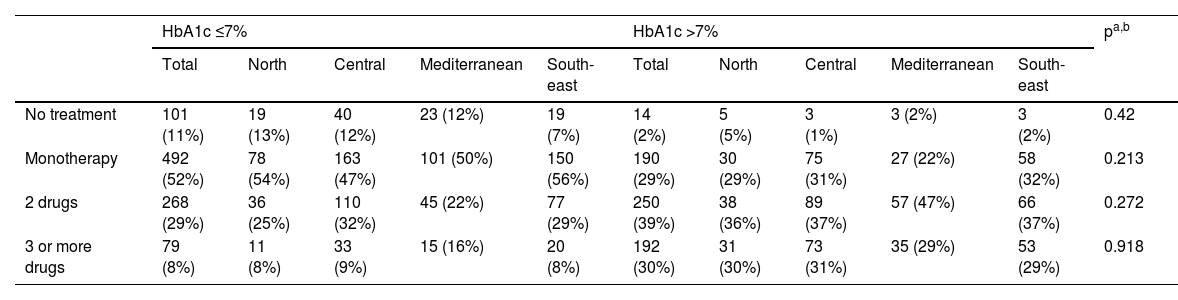
Table 5 shows the number of drugs used in each of the regions in patients with good and poor control. When assessing the number of drugs used in patients according to whether HbA1c was well or poorly controlled, it was observed that most of those with HbA1c ≤7% were on monotherapy (52%) while a significant proportion with HbA1c >7% were on two drugs (39%), with no significant differences between the different regions.
Treatment of patients with T2DM according to HbA1c level.
| HbA1c ≤7% | HbA1c >7% | pa,b | |||||||||
|---|---|---|---|---|---|---|---|---|---|---|---|
| Total | North | Central | Mediterranean | South-east | Total | North | Central | Mediterranean | South-east | ||
| No treatment | 101 (11%) | 19 (13%) | 40 (12%) | 23 (12%) | 19 (7%) | 14 (2%) | 5 (5%) | 3 (1%) | 3 (2%) | 3 (2%) | 0.42 |
| Monotherapy | 492 (52%) | 78 (54%) | 163 (47%) | 101 (50%) | 150 (56%) | 190 (29%) | 30 (29%) | 75 (31%) | 27 (22%) | 58 (32%) | 0.213 |
| 2 drugs | 268 (29%) | 36 (25%) | 110 (32%) | 45 (22%) | 77 (29%) | 250 (39%) | 38 (36%) | 89 (37%) | 57 (47%) | 66 (37%) | 0.272 |
| 3 or more drugs | 79 (8%) | 11 (8%) | 33 (9%) | 15 (16%) | 20 (8%) | 192 (30%) | 31 (30%) | 73 (31%) | 35 (29%) | 53 (29%) | 0.918 |
DPP-4 inhibitors: dipeptidyl peptidase 4 inhibitors; GLP-1 analogues: glucagon-like peptide 1 analogues; MET: metformin; SGLT2 inhibitors: sodium-glucose cotransporter 2 inhibitors; SU: sulfonylureas.
The results of our study, which was conducted on a sample of patients recruited from primary care throughout Spain, show that there are no statistically significant differences in the degree of diabetes control across the country. This is the first study to analyse regional differences in the degree of control of T2DM in Spain, including all the autonomous communities and using the same methodology. In addition, the factors associated with poor control in each region were identified and we gained a more up-to-date snapshot of the degree of control of T2DM in Spain.
The sociodemographic profile of the patients (54.5% male, mean age 65 years, uneducated or with basic education) is similar to that observed in other studies.9,10,12,14–17 Taking the di@bet.es study24 as a reference for an understanding of the characteristics of the population with T2DM in Spain, it can be seen that the prevalence of T2DM was higher in men (54.5%) and most patients were uneducated or only had primary education. The clinical profile (mean age, 65.93 years; BMI, 30.06kg/m2, mean HbA1c, 7.05; LDL cholesterol, 101.07mg/dl; HDL cholesterol, 48.88mg/dl; triglycerides, 149.08mg/dl; systolic blood pressure, 134.42mmHg; and diastolic blood pressure, 77.03mmHg) is also similar to that of other studies,8,9,14 except for LDL-cholesterol levels, which are lower than those found by Díaz Grávalos et al.8 and Vinagre et al.14 (LDL cholesterol, 120mg/dl and 112.5mg/dl, respectively).
The data from our analysis show that HbA1c control in patients with T2DM seen in primary care clinics throughout Spain is poor. Around 40% of patients have values higher than 7% in all regions, with no significant differences between them. These results are similar to those observed in other studies conducted in the same primary care setting in Spain.7–19,25 In the north, Díaz Grávalos et al.8 and Vidal Pardo et al.12 observed poor glycaemic control (HbA1c >7%) in 55.7% and 45.7% of patients, respectively. In the central region, Guerra-Bobo et al.9 observed poor control in 50% of cases. In the Mediterranean, Mengual et al.10, López-Simarro et al.13, Vinagre et al.14 and Mata Cases et al.17 found poor control in 45.2%, 33.6%, 44% and 44.8%, respectively. Finally, in the south-east, although the study by Escribano-Serrano et al.18 was conducted on a population base, poor control was observed in 31% of patients. Comparing these data with similar studies in primary care requires taking into account the fact that there is no uniformity in methodology, sample size or control criteria.
Regarding the factors associated with poor disease control, longer disease duration is the most frequently occurring factor associated with worse glycaemic control in all regions, consistent with the findings of other studies, which has traditionally been explained by the progressive deterioration of beta cells,10,16,17 emphasising the importance of early control. Other factors found to be associated with the failure to achieve glycaemic targets in our study were being male and low level of income and education, as has already been demonstrated in the PANORAMA study.6 According to data from the Instituto Nacional de Estadística [Spanish National Institute of Statistics] (INE),26 per capita income in Spain between 2014 and 2018 stood at around €18,000, with the northern and south-east regions having the highest and lowest incomes, respectively. Other studies27 have demonstrated that the most socially disadvantaged individuals have a higher percentage of unhealthy lifestyle habits, with more obesity, sedentarism and smoking, and that as their income level increases, HbA1c decreases, improving control of the disease; hence the importance of improving the socio-economic conditions of patients with T2DM. These data are consistent with the results of our study, in which the percentage of obese and sedentary patients in the south-east was higher than in the north. With regard to gender, in some studies, such as that by Sandín et al.,28 the results of T2DM control for men and women differ and depend on the context in which they live, although they tend to link women of lower socio-economic status with worse disease control. However, in our study there was a greater representation of men, which may have contributed to this difference regarding gender. Dyslipidaemia and sedentarism were also associated with worse control, which could be explained by the new lifestyles adopted in developed countries (high-calorie diets, rich in fast-absorbing carbohydrates, a sedentary lifestyle and an ageing population). It will be important in the future to continue to promote healthy lifestyles and avoid a sedentary lifestyle, as numerous studies have shown the clinical benefit of exercise with a reduction in HbA1c.29
On the other hand, our study showed a high prevalence of other CVRFs, such as arterial hypertension (HTN), obesity and dyslipidaemia, with no significant differences between regions except for dyslipidaemia. The observed differences in dyslipidaemia by region could be explained by a lower average age in the south-east. A large proportion of the population with diabetes had atherogenic dyslipidaemia, so a control target could be non-HDL cholesterol. Other primary care studies have shown similar figures for HTN prevalence (66%–78%),8,10,12,14 and lower figures for dyslipidaemia (in these studies it is less than 58%). The high percentage of patients with obesity (between 33% and 35%), a figure very similar to that observed in other studies,24,30,31 is striking, and may contribute to the worse control of patients with T2DM.
In total, 35.7% of patients had a sedentary lifestyle, which is a lower prevalence than that observed in other studies.29 However, if we consider only studies conducted in the population seen in primary care, it can be seen that the prevalence observed by region is somewhat lower than that found in other studies (over 45%).9,10,14,15
In relation to smoking, it was observed that around 14% of patients with T2DM were active smokers in all regions, a figure similar to that obtained in other studies.9,10 It is important to highlight the role of smoking as a CVRF to prioritise it being addressed alongside the other risk factors to prevent the onset of its complications (patients with T2DM who are non-smokers have a more favourable lipid profile, better control of their HbA1c and lower mortality).32
The aggregation of risk factors in people with T2DM could partly explain their higher cardiovascular risk and contribute to poor control, probably because they are polymedicated patients with higher risk of treatment non-adherence.
In the analysis of the treatment used, metformin continues to be the most prescribed anti-diabetic in all regions, with no significant differences between them, although our figures were higher than those observed by other authors9,10,15 (57.6%, 59.2% and 68%, respectively), followed by DPP-4 inhibitors (used less often in the south-east) and sulfonylureas. It seems that there is unanimous consensus on the first step of treatment, but no agreement on the second step.3–5 It is important to point out the high use of DPP-4 inhibitors in all regions and the lower use of sulfonylureas compared to other studies.8,9,17 The significant use of metformin may be due to the fact that clinical practice guidelines and algorithms3–5 continue to recommend it as the first line of treatment, except in the case of intolerance or contraindication.
The surge in the use of DPP-4 inhibitors at the expense of sulfonylureas in recent years could be attributed to the safety of the former versus the risk of hypoglycaemia posed by sulfonylureas and the recommendation to avoid their use in the elderly.17 The limited use of SGLT2 inhibitors and GLP-1 analogues in all regions is consistent with other studies,9,17 and these figures can probably be explained by the fact that these data were collected between 2014 and 2018, when they had only been on the market for a short period of time. The prescription of insulin was similar to that found in other studies,6,8,9 and although there were no differences between regions, there was significant interregional variability. It should also be noted that approximately 30%–50% of patients with T2DM in all regions did not have diet or exercise reflected in their treatment, despite it being the first line of treatment, over the prescription of drugs.3
When assessing the number of drugs prescribed to patients according to whether they were well or poorly controlled, it is striking that around 60%–70% of poorly controlled patients were only on one to two drugs (25%–30% monotherapy), which suggests that one of the reasons for poor control could be the therapeutic inertia of doctors and the opportunity to improve the control we have. The data are similar in all regions except the Mediterranean zone, where the use of combination therapy is somewhat greater, and in the north, less, so it seems that therapeutic inertia is a widespread problem. On the other hand, it also suggests some variability regarding healthcare professionals prescribing and intensifying treatment.
The data obtained on good control with monotherapy or combination therapy are similar to those observed in other studies, such as that of Mengual et al.,10 and follow the trend identified by Mata et al.33 in Catalonia, although the different methodology used between them must be taken into account.
Some authors1 propose therapeutic inertia, in addition to treatment non-compliance and the problems inherent in the health system as possible reasons to explain insufficient glycaemic control in Spain.
Given the impact of diabetes around the world, shedding light on an aspect as important in prognosis as degree of control is extremely interesting. Although this study does not allow us to make this deduction, it can be assumed that poor control can influence cardiovascular mortality in Spain; hence the importance of educational programmes adapted to the patient and their comorbidities.
The main limitations of this study were those inherent to observational studies, such as the absence of randomisation of the investigators and greater motivation by the participating investigators regarding the management of cardiovascular disease with the inclusion of a higher percentage of chronic patients, who are also those who most frequently attend consultations. Another possible limitation was the varying participation by region, with a smaller sample size than desired, which curbed the strength of this analysis and should be taken into account in the external validity of this study limited to the clinical population. This study did not assess therapeutic inertia, therapeutic compliance, nursing involvement in follow-up or the presence of other comorbidities as factors that could influence the degree of control. However, the results obtained are consistent with those published and congruent with the observed associations. Therefore, we believe that the results reveal a fairly representative snapshot of patients with T2DM seen in primary care consultations.
ConclusionsThere were no differences in the degree of diabetes control in the different regions, with a high percentage of patients requiring intensification in their control across the country. Being male, time since onset of diabetes, low socio-economic status and a sedentary lifestyle should be taken into account as risk factors in poor glycaemic control, and health programmes that take into account some of these risk factors should be implemented.
Ethical responsibilitiesProtection of people and animalsThe authors declare that the procedures followed complied with the ethical standards of the Responsible Human Experimentation Committee and with the World Medical Association and the Declaration of Helsinki.
Data confidentialityThe authors declare that they have followed their workplace protocols on the publication of patient data.
Right to privacy and informed consentThe authors have obtained the informed consent of the patients and/or subjects referred to in the article. This document is in the possession of the corresponding author.
FundingThis research received no funding of any kind.
Conflicts of interestThe authors declare that they have no conflicts of interest.