

The purpose of our study was to determine the QTc interval, QTc dispersion in CKD and HD patients, and to assess the effect of HD on QTc interval, QTc dispersion. Twenty-five HD and 20 CKD patients were included in the study. Serum concentrations of K+, Ca2, Mg2, creatinine, and albumin were monitored and QT interval and QT dispersion were measured from 12 lead ECG.
ResultsIn 5 of the patients with CKD abnormally prolonged QTc interval was found. In addition to the prolonged QTc dispersion was detected in three patients. Among pre-HD patients, 14 patients had prolonged QT interval, and 12 had QTc dispersion. The HD patients (pre-HD and post-HD) were found to have prolonged QTc interval compared to patients with CKD (p<0.001).
QTc interval increased significantly in post-HD, compared to pre-HD (p=0.007). This increase in QTc interval was not homogeneous; QTc interval increased in 16 patients, it reduced in 5 patients, in 4 patients it did not change.
No significant difference in QTc dispersion was found in post-HD compared to pre-HD (p>0.05). Post-HD while QTc dispersion increased in 14 patients, remained constant in 2 patients, in the remaining 11 patients decreased.
The patients with prolonged QT interval (n: 16) and QT dispersion (n: 14) in post-HD, only at the level of Mg2 significantly decreased (p<0.01).
ConclusionsHD patients (pre-HD and post-HD) had an abnormally prolonged QT interval compared to CKD patients.
The patients with prolonged QT interval and QT dispersion in after HD, only at the level of Mg2 significantly decreased. The low Mg level may predispose HD patients to risk factor for cardiac arrhythmias.
El objetivo del presente estudio fue determinar el intervalo QTc, la dispersión de QTc en pacientes con nefropatía crónica (NPC) y en pacientes sometidos a hemodiálisis (HD) y valorar el efecto de la HD sobre el intervalo QTc y dispersión de QTc. En el estudio se incluyeron 25 pacientes HD y 20 NPC. Se monitorizaron las concentraciones séricas de K+, Ca2, Mg2, creatinina y albúmina y se determinaron el intervalo QT y la dispersión QT a partir de un electrocardiograma (ECG) de 12 derivaciones.
ResultadosEn cinco de los pacientes con NPC se detectó un intervalo QTc prolongado anormalmente. Además, en tres pacientes se detectó dispersión QTc prolongada. Entre pacientes pre-HD, en 14 se detectó un intervalo QT prolongado y en 12, una dispersión QT prolongada. Los pacientes HD (pre-HD y post-HD) manifestaron un intervalo QTc prolongado, comparado con los pacientes NPC (p<0,001).
El intervalo QTc aumentó significativamente después de la HD, comparado con antes de ella (p=0,007). Este aumento del intervalo QTc no fue homogéneo; el intervalo QTc de 16 pacientes aumentó, en cinco disminuyó y en cuatro no se modificó.
No se observó una diferencia significativa de la dispersión QTc post-HD en comparación con pre-HD (p>0,05). Mientras que la dispersión QTc post-HD aumentó en 14 pacientes, permaneció constante en dos y en los 11 pacientes restantes disminuyó.
En el período post-HD, en los pacientes con prolongación del intervalo QT (n=16) y dispersión de QT (n=14), solo se identificó una disminución significativa de la concentración de Mg2 (p<0,01).
ConclusionesEn pacientes HD (pre-HD y post-HD) se identificó una prolongación anómala del intervalo QT en comparación con pacientes NPC.
En los pacientes con prolongación del intervalo QT y dispersión de QT después de HD, solo se detectó una disminución significativa de la concentración de Mg2. La baja concentración de Mg puede predisponer a los pacientes HD a un factor de riesgo de arritmias cardíacas.
Mortality risk related to cardiovascular disease in patients having kidney insufficiency is 10-fold higher compared with overall population, vast majority of death events comprise heart insufficiency, myocardium infarction and sudden cardiac deaths.1–3
Responsible mechanism for the sudden increase in risk of cardiac death is not completely known and also, at the end of the Holter monitoring, during hemodialysis and just after it arrhythmia and high incidence of early ventricular pulses were shown. During dialysis there is rapid change in intracellular and extracellular electrolytes causing these arrhythmias.4–6
QTc interval and QTc dispersion measurements are non-invasive methods. This is non-invasive measurement of myocardial repolarization in homogeneity and hence predisposition to re-entry arrhythmias.7 The purpose of our study was to determine the QTc interval and QTc dispersion in CKD and HD patients, and to assess the effect of HD on QTc interval and QTc dispersion.
Material and methodThis cross-sectional study was performed in Department of Nephrology between May 2008 and October 2008. Twenty-five HD patients (13 males, mean age: 43.04±14.04 years) and 20 CKD patients (9 males, mean age: 45.51±2.84 years, mean GFR: 42.05±24.6ml/min) were enrolled in the study. The patients signed a written informed consent form to participate in the study. The study was approved by the local ethics committee.
All patients were usually treated with a dialytic regimen of bicarbonate dialysis at the following electrolyte concentrations in the bath: K+, 2.0mmol/l; Ca2+, 1.5mmol/l; Mg2+, 0.5mmol/l; HCO3−, 32mmol/l; F60 (Polysulfon) dialysers, blood flow 350ml/min, dialysate flow 500ml/min. All subjects were on HD treatment for at least 3 months and they performed 4h HD sessions three times a week. Twenty CKD patients were normotensive with GFR 59–15ml/min (stages 3 and 4).
Exclusion criteria were (i) diabetes, (ii) overt ischaemic heart disease (IHD), (iii) ECG evidence of left ventricular hypertrophy (LVH) or left bundle-branch block (LBBB), (iv) atrial fibrillation, (v) patients taking class I or class III anti-arrhythmic drugs, and (vi) patients taking anti-hypertensives.
ECGs of the patients with CKD coming to policlinic follow-up were taken at a speed of 25mm/s and taking their blood samples their plasma electrolyte levels (K+, Ca2, Mg2) were detected on the same day. Standard dialysis was performed for 4h, three times a week. Twelve-lead ECGs were performed (Hewlett-Packard Page writer 100 with a 25mm/s paper speed, gain 10mm/mV) under identical conditions for all patients: 30min before and 30min after the morning, mid-week HD session.
The QT interval was measured from the onset of the QRS complex to the end of the T wave, defined by the return of the terminal T wave to the isoelectric TP baseline. When U waves were present, the end of the T wave was taken as the nadir between the T and U waves. If the end of the T wave was not clear in a particular lead then it was excluded from analysis; for any particular ECG, no more than three leads were excluded. Three successive QT interval measurements were performed in each of the 12 leads, and the mean value was calculated. The maximum QT interval was corrected for heart rate (QTc-max) using Bazett's formula QTc=QT/(RR)1/2. The QT (QTc) dispersion was determined as the difference between the maximum and the minimum of the QT (QTc) in different leads (minimum 10) on the same recording. All ECGs were manually investigated by one person.
Serum potassium, calcium, magnesium, creatinine and albumin were measured with an autoanalyzer. Calcium was corrected for hypoalbuminemia by adding 0.8mg/dl to the calcium concentration for each 1g/dl decrease in albumin concentration from the normal 4.0g/dl.
CKD was defined according to the presence or absence of kidney damage and the level of kidney function. Kidney damage was defined as pathologic abnormalities or markers of damage, including abnormalities in blood or urine tests or imaging studies. Among individuals with CKD, the stage was defined by the level of e-GFR (stages 1–5). Estimated glomerular filtration rate (e-GFR) was calculated by using the Cockcroft and Gault formula.
StatisticsFor statistical study SPSS 13.0 packet computer statistic program was used. Results are expressed as a mean±sd. Statistical evaluation was performed with the two-tailed paired and unpaired Student's test and Pearson correlation test. Differences were considered as statistically significant when the p value was <0.05.
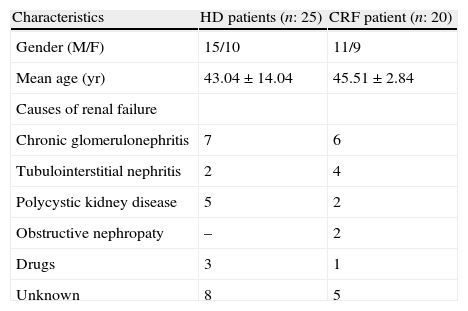
ResultsIn the HD patients, chronic glomerulonephritis and polycystic kidney disease, in the CKD patients, chronic glomerulonephritis and tubulointerstitial nephritis were the most common causes. We did not found significant difference in age and gender, as compared to all of patients (p>0.05) (Table 1).In 5 of the patients with CKD abnormally prolonged QTc interval was found. In addition to the prolonged QTc dispersion was detected in three patients. Among pre-HD patients, 14 patients prolonged QT interval, and 12 patients had prolonged QTc dispersion.
Baseline characteristics of the study patients.
| Characteristics | HD patients (n: 25) | CRF patient (n: 20) |
| Gender (M/F) | 15/10 | 11/9 |
| Mean age (yr) | 43.04±14.04 | 45.51±2.84 |
| Causes of renal failure | ||
| Chronic glomerulonephritis | 7 | 6 |
| Tubulointerstitial nephritis | 2 | 4 |
| Polycystic kidney disease | 5 | 2 |
| Obstructive nephropaty | – | 2 |
| Drugs | 3 | 1 |
| Unknown | 8 | 5 |
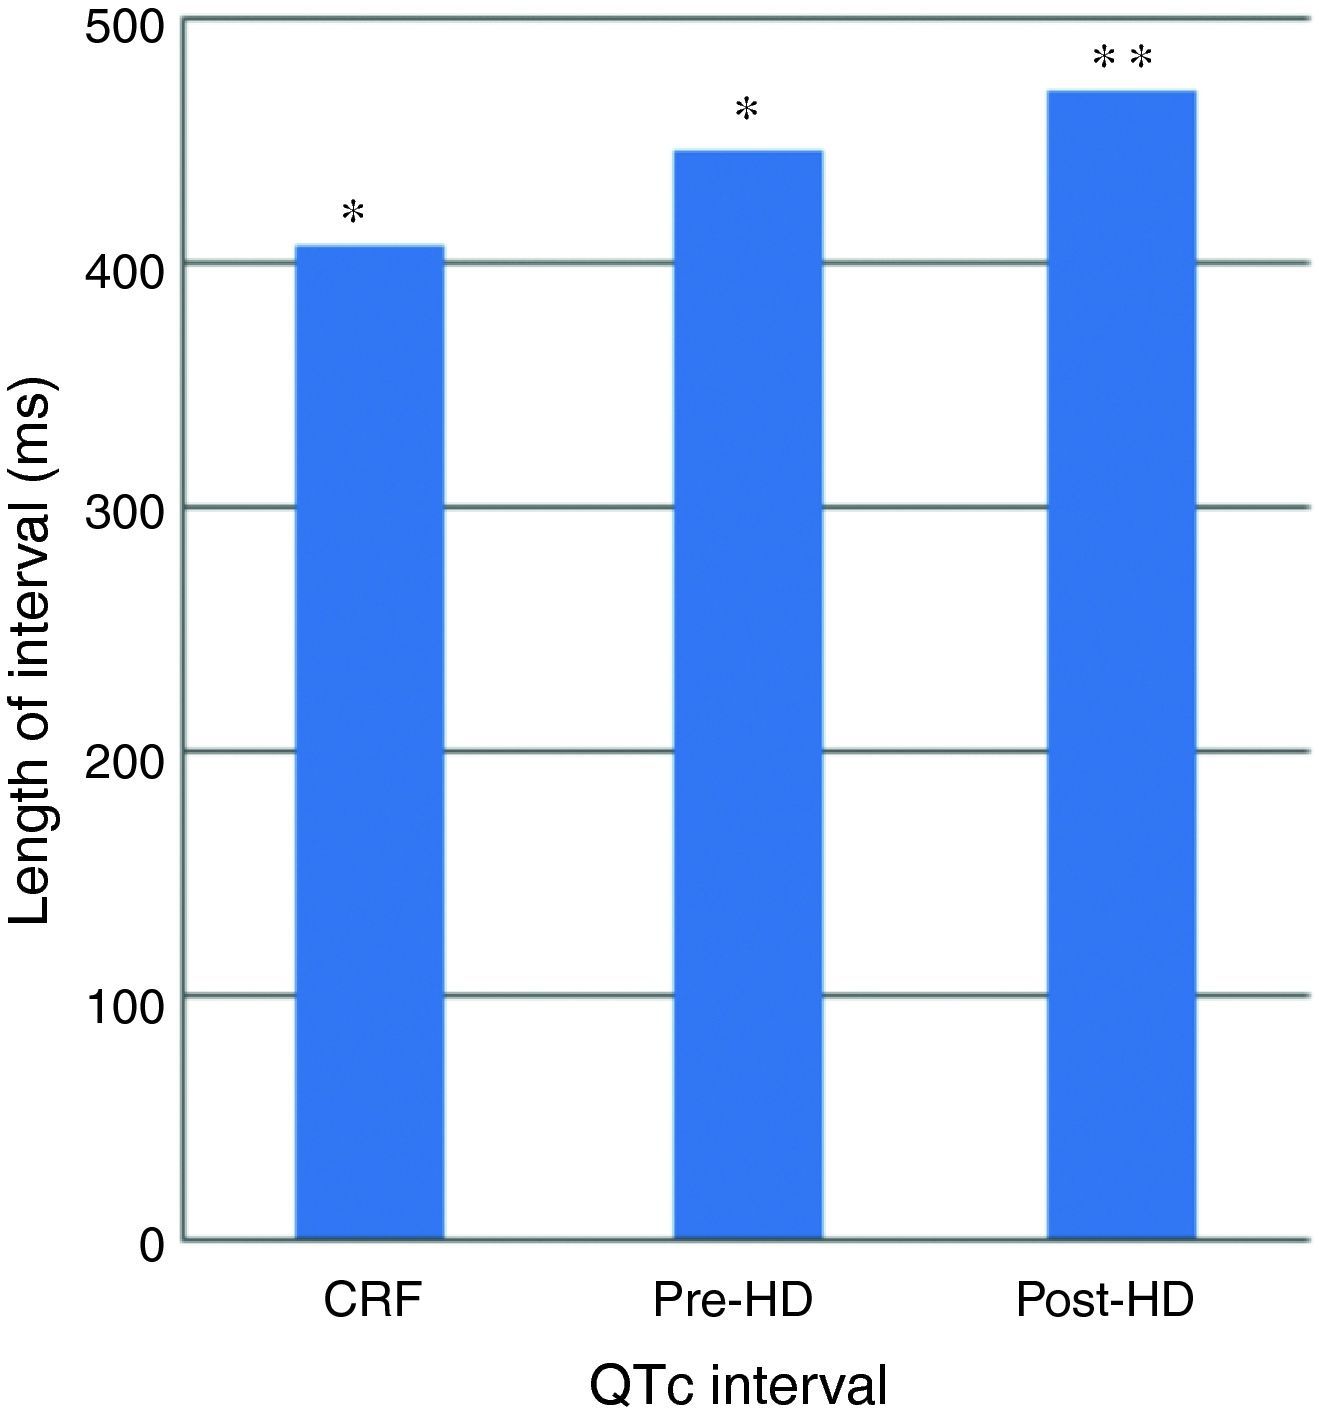
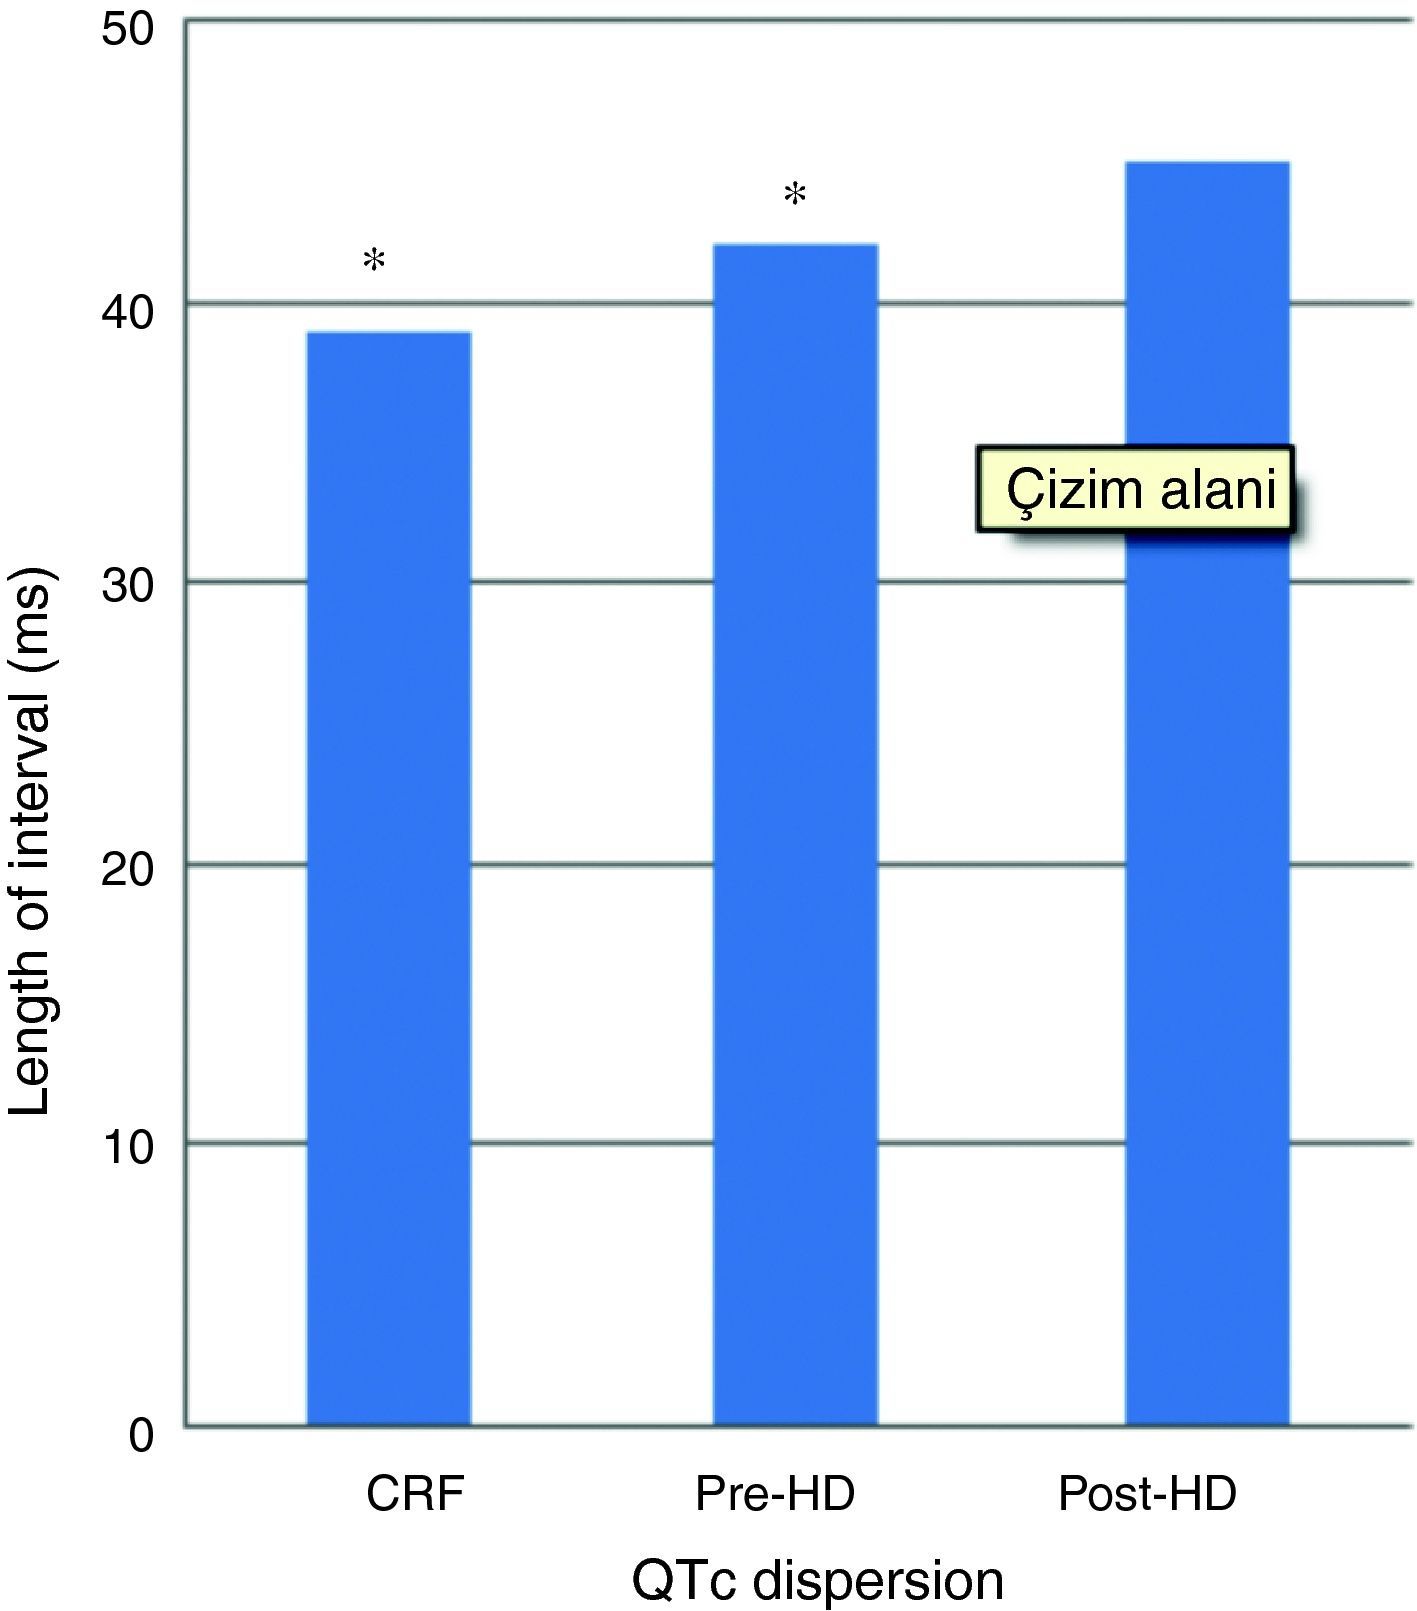
In patients with HD, QTc interval was prolonged in pre- (446±53ms) and post-HD patients (470±51ms) compared to the patients with CKD (408±40ms) (p<0.001) (Fig. 1). Pre and post HD in terms of QTc dispersion, there was no statistically significant variation between the patients with HD (42±15/45±18ms) and CKD (39±15ms) (p>0.05) (Fig. 2).


QTc interval was prolonged significantly in post-HD compared to pre-HD (470±51ms vs 446±5 3ms) (p: 0.007) (Fig. 1). This increase in QTc interval was not homogeneous; QTc interval increased in 16 patients, it reduced in 5 patients reduced, in 4 patients did not change.
No significant difference was found in QTc dispersion post-HD (45±18ms) compared to pre-HD (42±15ms) (p>0.05). Post-HD while QTc dispersion increased in 12 patients, it remained constant in 2 patients, and decreased in the remaining 11 patients (Fig. 2).
The serum K+ (5.62±0.94 and 3.35±0.72mEql/l, p<0.001) and Mg2 (3.06±0.75 and 2.43±0.58mg/dl p<0.001) concentrations significantly decreased, whereas the Ca2+ (8.31±0.63 and 9.68±0.87mg/dl, p<0.001), concentrations significantly increased in post-HD compared to pre-HD patients.
After HD, in patients with prolonged QTc interval (n: 16; 478±55ms) and QTc dispersion (n: 14; 52±20ms), serum Mg levels decreased (2.99 ±0.87/2.30±0.35mg/dl and 3.01±0.63/2.20±0.43mg/dl, respectively). There was significant correlation between the prolonged QTc interval and QTc dispersion and serum Mg level changes (r=−0.326, p<0.001).
DiscussionOur study demonstrates that, HD patients (pre-HD and post-HD) had an abnormally prolonged QT interval compared to CKD patients. In patients with prolonged QT interval and QT dispersion after HD, only the level of Mg2 significantly decreased.
Patients with advanced CKD have increased cardiovascular mortality of multifactorial aetiology including cardiac arrhythmia.8 Prolonged QT interval may be responsible for some of the cardiac deaths. The QT interval is a measure of the duration of ventricular depolarization and repolarization, and prolongation of the QT interval can predict cardiovascular death. QT dispersion is a marker of variability of ventricular repolarization and is known to be increased in various high-risk groups. Moreover recently these electrical markers were found to be independent predictors of total and cardiovascular mortality in both nonuremia and ureamic populations.9
The normal QTc interval varies from 350 to 450 milliseconds (ms). The normal range for QT dispersion is 40–50ms with a maximum of 65ms. In our study, HD and CRF patients were found to have longer QT interval and QT dispersion, so this group of patients may be at higher risk of sudden cardiac death and ventricular arrhythmia.
As a result of the studies conducted, in HD patients, compared with normal healthy individuals, QTc interval and QTc dispersion as a predisposal for sudden cardiac death and intensified ventricular arrhythmia were found long, and among the samples having long QTc interval and QTc dispersion cardiovascular death and cardiac morbidity were found to be higher.10
The hemodialysis patients have a wide variety of ECG abnormalities and, in certain instances; hemodialysis itself seems to be a cause of ECG changes and different kinds of dysrhythmias.11 Cardiac arrhythmia is more frequent in HD patients, during HD in intracellular and extracellular electrolytes, especially related to fast alterations emerged subject to dialyzable cations’; Ca, Mg and K concentrations, it had the possibility to emerge during HD and just after HD.12
Yetkin et al. showed that after HD a significant correlation between the increase in QTc interval, QTc dispersion and serum electrolyte variants occurred, and this relation might provide new insights into the evaluation of the ionic bases involved in inhomogeneous ventricular repolarization.13 Covic et al., in their study carried out over 68 non-diabetic patients found that, the increase in HD patients’ QTc interval was most of the times related with the rapid change in plasma electrolyte concentration, and impact over QTc dispersion was found less significant.14
In our study; the mean of pre- and post-dialysis cycle QT interval increased significantly (p: 0.007), there was no change in QT dispersion (p>0.05). This change in QTc interval and QT dispersion was not homogeneous. Prolonged QT interval, a measure of heterogeneity of vascular repolarization, has been linked with increased risk of sudden death in dialyzed patients and it may be more prolonged, after hemodialysis.
The serum K+ and Mg2 concentrations significantly decreased, whereas the Ca2+ concentrations significantly increased. In post-HD patients with prolonged QT interval and QT dispersion, only the level of Mg2 significantly decreased. The level of serum K+ and Ca2+ showed no significant difference.
Potassium and magnesium are two of the most important factors for the electrical stability of the myocardium, involved in creating normal cellular excitability, impulse propagation, and regular ventricular recovery.15 Magnesium depletion in general is associated with changes in the ECG. Widening of the QRS complex and peaking of T waves have been described with modest magnesium loss, whereas more severe magnesium depletion can lead to prolongation of the PR and QT intervals, progressive widening of the QRS complex, and diminution of the T wave.16 Possible candidates for this are free fatty acids17 catecholamines, and sympathetic stimulation.18
Cardiac arrhythmias are an important complication of magnesium depletion. This is an important concept because increases in QTc and QTc dispersion suggest that ventricular repolarization is delayed when intracellular magnesium concentrations are low, leading to increased risk for developing ventricular arrhythmia. In addition magnesium levels alter the generation of potassium into the cell through the membrane ATP. QT interval elongation in magnesium deficiency possibly arises from the incomplete membrane transportation of potassium.19,20 Cupisti et al. have suggested that magnesium could be the main cause of increased QT dispersion.15
Conclusion- 1.
Our study demonstrates that, HD patients (pre-HD and post-HD) had an abnormally prolonged QT interval compared to CKD patients.
- 2.
Hemodialysis increases the QTc interval in ESRD patients. However, the impact on QTc dispersion is not important. These changes are not homogeneous.
- 3.
The prolonged QT interval and QT dispersion in post-HD patients were only reduced at the level of Mg. The low Mg level may predispose HD patients to risk factor for cardiac arrhythmias. Therefore, further studies with different concentration of Mg2 containing dialysate (i.e. 0.75/1mmol/l) should be made.
The authors have no conflict of interest to declare.