


Introduction
Influenza has been defined as the last of the untamed plagues of humanity because of the health and economic impact of annual epidemics.1 The disease causes approximately 100 million cases and more than 30 000 deaths per year (in addition to considerable social and health costs) in developed countries, making it an important periodic pubic health problem.2,3 Between 5% and 20% of the population can become ill during a "normal" epidemic, with the figure rising to 50% during a pandemic.4 This has repercussions on primary care services, although only 25% of all acute febrile processes during the flu season can be attributed to influenza.5 Type A evidence exists that influenza vaccination (IV) is effective in diminishing morbidity and mortality in the population.6-8 Organisms such as the Spanish Society of Family and Community Medicine recommend IV in their preventive activity programs, with particular mention of groups at high risk, persons older than 65 years of age, children 6 months to 18 years of age, and persons receiving chronic treatment with acetylsalicylic acid during epidemics, travelers in areas where the disease is epidemic, and members of the general population who wish to be vaccinated.9 Decreasing the incidence in risk groups is one of the aims of the Health Plan devised for the Community of Valencia,10 but the desired levels of IV coverage are not always attained.11 There are no primary registries, and few studies have identified the factors that influence coverage.
A number of factors are related with rates of IV, and these factors pertain to the characteristics, attitudes and beliefs of patients and health care providers. The objectives of the present study were a) to quantify IV in Health Care Area 19 of the Community of Valencia by examining a specialized registry, and b) to determine whether particular characteristics of the physicians or the patients on their list were associated with IV rates for older people.
Methods
Design
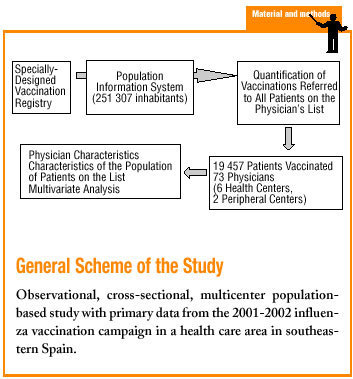
This observational, cross-sectional, multicenter, population-based study used primary data to analyze the 2001-2002 IV season. Data were from Health Care Area 19 (Bajo Vinalopó) in the Community of Valencia (251 307 inhabitants according to the population information system (Sistema de Información Poblacional) of the Health Council of the regional government of Valencia (Conselleria de Sanitat, Generalitat Valenciana), consulted in April 2002. Of this population, 13.8% of the inhabitants were
older than 65 years, and 50.4% were women. Two thirds (55%) of the population were served by health care centers operating under the reformed management model (RS), and one third (34%) attended centers operating under an older, unreformed system of administration (OS). In 2002 the mean number of visits to health centers per user was 4.8, and mean patient load in this area was 48.2 (SD 2.8)12.
Influenza vaccination in the region was one of the objectives of the regional health plan, and was included in the list of primary care services to be provided by the public health system. The target for the 2001-2002 season was to vaccinate 60% of the population of older people. Administration of the supply of vaccines and outcome measurement were managed by the General Directorate of Public Health (Dirección General de Salud Pública). All data for all vaccinations were entered into the recently created individualized vaccination registry (Registro Nominal Vacunal), a database that can be accessed and consulted from any health care center in the region. However, its use is still not widespread. We therefore used a specially designed registry created some years previously and approved by the General Directorate of Public Health to facilitate vaccination processes. This registry contains personal information about patients and identifies the physician they are assigned to. By generating a history of IV, the specialized registry obviates a number of administrative processes.
Inclusion and Exclusion Criteria
The number of patients needed to estimate the rate of IV in the area we studied was calculated with a formula to estimate proportions, assuming a maximum P value of .5, a precision of 1% and a 99.9% level of confidence. This yielded a sample size of 16 144 patients, although the final sample included all vaccinated patients in the lists of participating physicians (n=19 457).
Participating physicians were family and community doctors at primary care centers in the area who had used the vaccination registry in the 2001-2002 flu season (n=106 physicians). Of this number, 29 were excluded because they had been at their current post for less than 2 years at the time of the study, and 4 were excluded because they worked at peripheral health centers that lacked the administrative support necessary to use the vaccination registry. Medical records and doctor's written orders for vaccination were not taken into account.
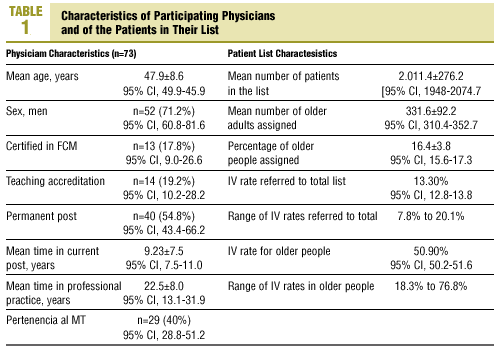
The physician-related variables analyzed here were age, sex, certification in family and community medicine (FCM), teaching accreditation as an FCM tutor, whether his or her current post was permanent, time in current post, years of professional practice (from the date of receipt of his or her medical degree), model of administration their center was managed with (RS or OS), total population of patients on his or her list, population of patients >65 years of age on the list, percentage of the population >65 years of age on the list, and IV rate (percentage of patients vaccinated referred to all patients in the list). The criterion evaluated in the present study was IV rate for persons >65 years old (percentage of persons >65 years old who were vaccinated, referred to total number of persons >65 years old on the list).
Statistical Analysis
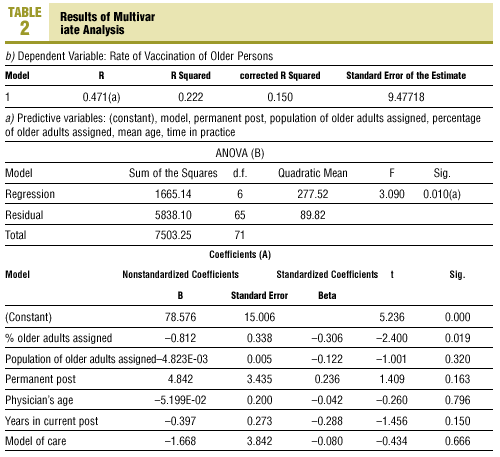
The SPSS (v. 11.0 for Windows) was used for all statistical analyses. Descriptive statistics were compiled and bivariate analysis was done. A multivariate model was developed with step-wise hierarchical regression, using IV rate in older people as the dependent variable to verify the results and corroborate the influence of different physician-related and patient population-related factors.
The chi-squared (*2) test was used for qualitative variables, and Student´s t test and analysis of variance were used for quantitative and qualitative variables. Correlation coefficients (Pearson's r) were calculated for the relationships between quantitative variables. The level of statistical significance was set at P<.05 with a 95% confidence interval.

Results
In all, 73 physicians and a vaccinated population of 19 457 patients were included. The characteristics of the physicians and their assigned patients are shown in Table 1. The IV rate for older adults was 50.9% (95% CI, 50.2%-51.6%), with considerable variability between physicians (18.2% to 76.8%) (Figure 1).
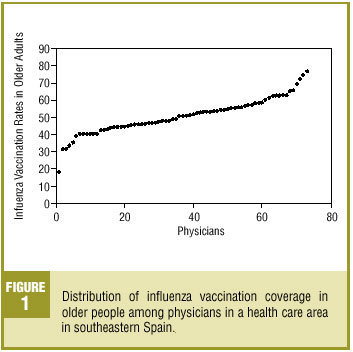
Distribution of influenza vaccination coverage in
older people among physicians in a health care area in southeastern Spain.

Physician Variables Related With Influenza Vaccination
We found no statistically significant differences in IV rates for all patients assigned according to physician´s age or sex, certification in FCM, whether the physician held a permanent post, time at current post, years of professional practice, health care administration model, teaching certification or population assigned. No significant differences were found in IV rate in older people in association with physician's age or sex, certification in FCM, whether the physician's post was permanent, teaching certification, or years of professional practice.
The mean number of patients and percentage of older people assigned were higher for physicians at centers operating under the OS (2157, 18.4%) than at RS centers (1832; 95% CI, 17.7-19.1, and 15%; 95% CI, 14.2%-15.8%). The IV rate for older people was significantly lower at OS centers (46.7%; 95% CI, 46.0%-47.4%) than at RS centers (53.8%; 95% CI, 53.1%-54.5%; P<.004).
Influenza vaccination rates in older people were lower for physicians who had been at their current post for longer (P=.01), with larger patient lists (P=.03), with larger numbers of older people on the list (P=.000), and with a larger percentage of older people in the list (P=.001) (Figure 2). Vaccination rates were also lower for older adults when the vaccination rate for the entire patient list was lower (P=.000). Although larger patient lists meant that the number of vaccinations indicated was larger (P=.000), this did not translate into an increase in the total rate of IV, but was instead associated with a decrease in IV rate for older people. Both in absolute numbers and in terms of percentage of the patient list, larger numbers of older people were associated with lower rates of IV (P=.000 for number of older people, P=.001 for percentage of older people), despite the fact that the total absolute number of vaccinations administered was larger.
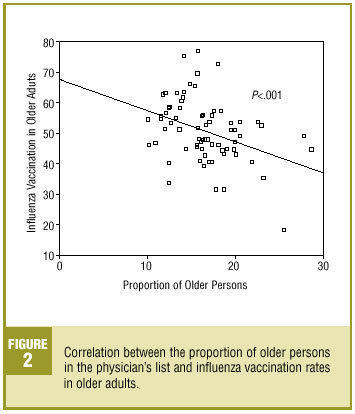
Correlation between the proportion of older persons in the physician's list and influenza vaccination rates in older adults.
Multivariate Analysis
The percentage of older people assigned to the physician was the only explanatory variable in the model, such that the higher the percentage of older people, the lower their vaccination coverage. The determination coefficient was R2=0.22 (Table 2).
Discussion
We believe the patients included in this study to be a representative sample of the outpatient population in the area, with the caveat that some of those excluded were assigned to physicians at peripheral health centers in very small villages. Nonetheless, the population in the area we analyzed resided in only three towns each with a population of more than 20 000, so the population can be considered mainly urban.
All patients who were vaccinated were included to avoid sampling bias, since the computerized registry made it possible to study all patients. This sample size allowed us to compare different physicians practicing in Health Care Area 19.
To rule out bias from the assignation of patients to different physicians, information from the vaccination database for the area of study was checked against data from the Population Information System, which comprises all users assigned to a primary care physician. This was intended to exclude patients who may have been vaccinated at the health center but who were not assigned to any given physician. If we had not taken this precaution, biases might have arisen from vaccinations of patients referred for vaccination to a physician other than their regular general practitioner, which would have led to inaccuracies in the data for their assigned physician. In addition, we aimed to obtain data for individual users rather than for centers or areas. Our sampling method ensured that the data we obtained were as reliable as possible.
We opted to exclude physicians who had been at their present post for less than 2 years because the influence of the physician on IV rates may need more than one flu season to become evident, and to avoid attributing the results attained by a given doctor to a different colleague who may have occupied the same post later.
We noted considerable variability in the patients assigned to each physician, with some physicians being responsible for twice as many patients as others, and with the proportion of patients older than 65 years being three times as large in some lists as in others. Influenza vaccination coverage also varied markedly between physicians, and this variation was only partly explained by the percentage of older adults on their list (R2=22%). This indicates that IV coverage is influenced by other, non-physician-related or unidentified variables (for example, qualitative physician- or patient-related variables having to do with beliefs or attitudes). Given that conditions at health centers were similar, these variables may explain the differences in coverage, and further studies will be needed to analyze them.
Although the variation explained by our model (22%) limits the conclusions that can be drawn, we believe our reasoning to be valid. What might have been expected was a clear difference in favor of RS centers, certification in FCM, teaching accreditation and use of informatics technology--in other words, aspects that professionals favor and that improve the quality of health care. The lack of such associations is in itself a startling result.
A number of studies have found low rates of IV in older adults, with figures not very different from ours ranging from 40% to 60%, and as high as 74% in well-organized vaccination programs.13-18 The report issued by the regional Directorate of Public Health for Area 19 overestimated the IV rate (62.8%) in comparison to our figure (50.9%).11 Thus there was a discrepancy between the IV rate we found and the official rate for Area 19 as reported by the regional Health Council. In absolute terms, we found IV coverage to be 17% lower, a figure that translates as 20% lower in relative terms. In other words, official figures for vaccination coverage overestimated the actual rate by 20%. One possible cause for this discrepancy is the method used by the regional authority to measure IV rates. Because the municipal census was used as the denominator, this failed to take into account inhabitants not included in the census although these persons are also vaccinated. The number of vaccines used, rather than vaccinations administered to specific users, was used as the numerator.
Several other variables have been reported to be related to IV rates. The variables analyzed most often are patient-centered. A study by Sarriá-Santamera et al of the population of older people in Spain19 found that the risk of not being vaccinated was greatest in persons aged 65 to 69
years, women, persons living in cities with a population of more than 1 million, smokers, persons with chronic diseases, and those who had not seen their doctor in the preceding months. Patients' previous beliefs have been explored and found to be associated with aspects such as age (directly related) and the belief that their general health is good (inversely related to IV rates). Fear of the side effects is the most frequent reason for not being vaccinated.20-22
Few studies have analyzed whether characteristics of health professionals influence vaccination rates. Of two recent studies that examined this issue, one found that coverage among hospital nurses was 62%, and was higher among those who responded correctly on a test of knowledge about IV (80%) than among those who responded incorrectly (49%).23 A study of pediatricians found that 50% of the participants were not vaccinated. The response rate for the survey was higher among vaccinated than among unvaccinated participants, and the latter expressed more skepticism as to the need, efficacy and side effects of IV. Almost all participants (98%) said they intended to be vaccinated, although only 60% actually were. A finding of particular note was that many professionals remained unconvinced by type A evidence of the effectiveness of IV in risk groups.24
Among factors associated with IV, some studies have identified the physician's own beliefs, i.e., knowledge of the patients´ attitude17, whether the physician had been vaccinated, female sex, and belief in the effectiveness and cost-effectiveness of vaccination.25
We found no studies that systematically investigated the influence of characteristics of the physicians and their population of assigned patients (age, sex, educational level, size of the list, proportion of older people on the list, frequency of health service use, etc) on IV rates. The study that comes closest to investigating this aspect analyzed physician-related factors that were related with the recommendation to be vaccinated.25
The objective of our study was to evaluate physician-related factors rather than all possible causes in general. In an earlier study in the Community of Valencia, Puig-Barberá and colleagues found with multivariate analysis that the number of practitioners per 1000 inhabitants and the coverage rates attained during the previous year were the variables that most strongly influenced IV.26 These findings are in partial agreement with our results regarding the importance of the patient load.
For some physicians the vaccination rate for older people was markedly low; these practitioners represent "vaccination sinks." We interpret this as an indication that if the patient does not request vaccination, the physician does not make efforts to provide it. This has direct consequences for morbidity and mortality in their patients, and for health costs in general.6-8,27-29
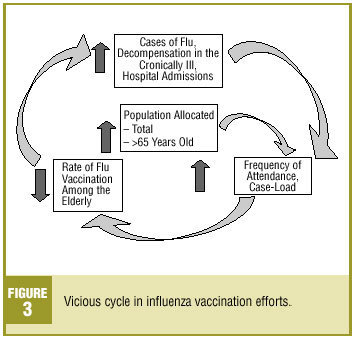
It could be thought a priori that the preventive activities of health centers are of higher quality than those of outpatient centers run under the previous (unreformed) model of administration. However, multivariate analysis showed that the lower vaccination rates of physicians at OS centers resulted from the higher percentages of older people on their patient lists. In view of the lack of differences between reformed and unreformed centers in the use of informatics technology, teaching activities and certification in FCM (factors all seen at RS health centers), it appears that health centers limit themselves to vaccinating on demand. We assume that problems with accessibility (attributable to the larger patient lists) lead to decreases in IV rates in older people. This gives rise to a vicious cycle as illustrated in Figure 3.

Vicious cycle in influenza vaccination efforts.
Influenza vaccination rates in older people were not related with the model of health care administration or other physician characteristics such as specialization, sex, age, whether their post was a permanent one, or years in practice. We believe that physicians do not maintain a vigilant attitude toward the indications for vaccination, as--surprisingly--time in the current post was associated with a decrease in vaccination rates in older people, despite the fact that the frequency of visits by these users to the health center would almost guarantee that patients were seen by their doctor, possibly several times during the year.30 Apparently, the importance of IV is underestimated and there is no systematic attempt at prevention. This notion is supported by research in the region of Valencia, Spain, that showed preventive care activities to be rare at health centers.31 Profound reflection is needed about our attitudes toward interventions such as IV, given that there is incontrovertible scientific evidence of its usefulness in public health.
Achieving improvements in preventive activities should be interpreted from a population-based perspective. Such improvements are influenced by many factors. Increases in vaccination coverage have been achieved with multifactorial interventions adapted to individual practitioners, whereas many studies have presented opposing views on the efficacy of training or general information activities.16,17,26,32-37
Changing the number of older people on a physicians patient list is one intervention that might improve vaccination coverage, but we should not assume that this is the only solution to the low rates of IV we found, nor should it serve as an excuse, particularly for physicians working in RS centers. At these health centers there are clear opportunities for improvement that are not fully exploited. To break the vicious cycle we posit, efforts to control the number of older patients in the physician's list as a way to increase IV rates should be accompanied by a series of additional measures. These include management of physician consultations to decrease the patient load, timely use by nursing staff of opportunities to vaccinate patients who consult for chronic illnesses, reorganization of health care centers to remove barriers to vaccination (especially during the early weeks of the campaign), involvement of residents and training units, and interventions aimed at reducing "vaccination sinks."
The coverage rate for IV in the health care area we analyzed here was higher than the mean figure reported for the entire region. This difference may be attributed in part to the use of a computerized registry that improves accessibility to IV and facilitates quantification of the number of patients actually vaccinated by each physician. In the Community of Valencia, the individualized vaccination registry (Registro Nominal Vacunal) is being introduced, and will eventually be linked via computerized access to the patient´s medical record. In this connection we feel that Area 19 has moved ahead of other health care areas in implementing a computer program adapted to the needs of the primary care system.
In our opinion, influenza vaccination should be based on an organized vaccination system that makes it possible to evaluate performance and to use a multifactorial approach to design interventions that can be personalized.
Acknowledgments
We thank the Health Council of the regional government of Valencia (Generalitat Valenciana) for permission to use digitally stored data, and offer our special thanks to the Servicio de Informática and the staff at the Unidad de Gestión, Área 19.