

In this paper, two kind of polyethylene terephthalate fibers and two woven textiles, taken from endovascular Stent-Grafts were analyzed by tensile tests. A non-contact video extensometer was used, which allowed precise strain measurements on material test samples. The technique used, allied with yarns image analysis, allowed to determine the yarn and textile stresses and to study their elastic/plastic deformation with much more accurate properties measurements. It was observed that the textiles present an anisotropic behavior although the textiles present similar weaving in the two woven directions. The yarns specimens were also analyzed by differential scanning calorimetry in order to study their crystallinity ratio, when subject to different stress levels. The properties measured are important for future performance analyses by finite element modeling and for defining improvements in devices design.
Abdominal aortic aneurysm (AAA) disease is a degenerative process, often without symptoms which can conduct, to the rupture of the vessel wall resulting in profuse internal bleeding and often conduct to death. In 1991, Parodi et al. [1] presented the “endovascular stent placement” as a new technique for the treatment of AAAs and in 1999 the first aortic stent grafts for the treatment of AAAs became commercially available [2]. The stent-graft is a tubular prosthetic vascular device, typically made with a woven textile composed by polyethylene terephthalate (PET) fibers, commercially known by Dacron or made by a polytetrafluoroethylene membrane (ePTFE). This tubular graft is reinforced by a metallic structure called stent, made of nitinol alloy or stainless steel.
Despite the advances regarding materials development and design of endovascular prosthesis, during the two past decades some problems have been reported with endovascular stent-grafts after implantation [3–6], namely: inflammatory process, endovascular graft leaks, kinking, abrasion (related motion between stent and graft) and fatigue (due to changes in blood pressures - systolic to diastolic). Abrasion is one of the most frequent wear mechanisms on the surface of the polymeric material and it was previously studied [7].
Polyethylene terephthalate (PET) fibers are used, since many years, in multiple engineer applications, due to its low price and high level of production, but nowadays they are also commonly used in medical applications, mostly in cardiovascular surgery and in orthopedics devices [8] mainly as surgical suture membranes, large diameter vascular grafts, surgical meshes, ligament and tendon repair [9]. The biostable characteristic of this polymer is related to the presence of hydrophobic aromatic groups with long crystallinity which restricts hydrolytic breakdown [10].
PET fibers present important properties like biological and chemical stability and biocompatibility [10]. On the other hand their flexibility and strength makes them very interesting materials for the biomedical area.
However, in terms of biocompatibility, it presents some limitations like the poor blood compatibility and the poor cell-adhesion properties, which are important for the vascular grafts [10,11]. To avoid the formation of blood clots, the antithrombogenic properties of PET can be improved by coating with antithrombogenic molecules or by endothelialization of the inner surfaces of the vessels [11]. Surface functionalization has been used to improve PET polymer-cell interaction, which is important on tissue engineering applications [10].
Although extensively studied since the 70's, this new areas of application obliges to accomplish new studies regarding PET performance under special conditions and better understand their behavior when loaded, namely regarding their anisotropic behavior in textiles applications.
This paper presents a study about the tensile behavior of PET fibers for biomedical applications, performed using multifilament yarns taken from textiles grafts in the weft and warp directions. The crystallinity induced by stress application is also analyzed by differential scanning calorimetry (DSC). Subsequently, the tensile behavior of the woven textiles is studied to conclude if the textile exhibits an isotropic or anisotropic behavior. The technique of non-contact video extensometry allied with image analysis of the yarns and textiles, was used, giving rise to much more accurate properties measurements. Most of the textiles studies analyze the load/displacement curves in yarns, which present some limitations. However using microscopy with image analysis it's possible to determine yarn and textile sections to measure the real stresses applied. On the other hand the video extensometry allows accurate strains measurements. Using both techniques together it's possible to determine the mechanical properties of yarns and textiles in a more accurate way. Many stent-graft models consider that these materials present an isotropic behavior and with this technique it is possible to have more accurate properties which can be used in future finite element models.
2Structure and behavior of PET fibersThe effect of chain orientation and the crystallization of PET have been analyzed in different situations once the orientation of the amorphous chain segments greatly influence the performance of the polymer [12]. Oriented amorphous fibers are usually obtained by drawing or stretching fibers just below their glass transition temperature. This process produces an external layer in the fibers whose orientation is significantly higher than the existent in the core [13]. The crystals formed, during the processing of fibers, act as mechanical cross-links, holding together the amorphous chains, leading to an improvement of the mechanical properties [14]. During the processing of PET fibers by high-speed melt spinning process, strain induced crystallization takes place generally when the take-up velocity reaches around 4800 m/min. Below this critical take-up velocity, the oriented chains in the fiber remain non crystalline [15]. Besides, the cooling rate applied to the melted polymer it's of fundamental importance, once it is known that this cooling rate will determine the polymer crystallinity degree. If high cooling rates are applied, the material will not have time to reorganize and highly amorphous structures can be obtained. Usually, in the industrial processing of PET, highly oriented amorphous fibers are heat-treated. The heat treatment produces a microstructure that improves the dimensional stability and mechanical behavior of the fibers [16], due to the fact that it induces a significant increase of density and of the crystalline perfection. In fact, the imperfect and instable crystals, during the heat treatment recrystallize, as a consequence, the molecular orientation decreased with the concomitantly reduction of the entropic relaxation [17]. J.K. Keum et al. showed also that during heat treatment of fibers, under constrained conditions, the crystallinity of fibers increased due to the contribution of the oriented amorphous phase, while the isotropic amorphous fraction, remained nearly constant [18]. Several authors found a transient structure (transient mesophase) prior to the final triclinic crystal structure formation. This phase consists of layers with paracrystalline or mesophasic order which is formed during the mechanical drawing of PET and acts as a precursor of the final crystal structure [19].
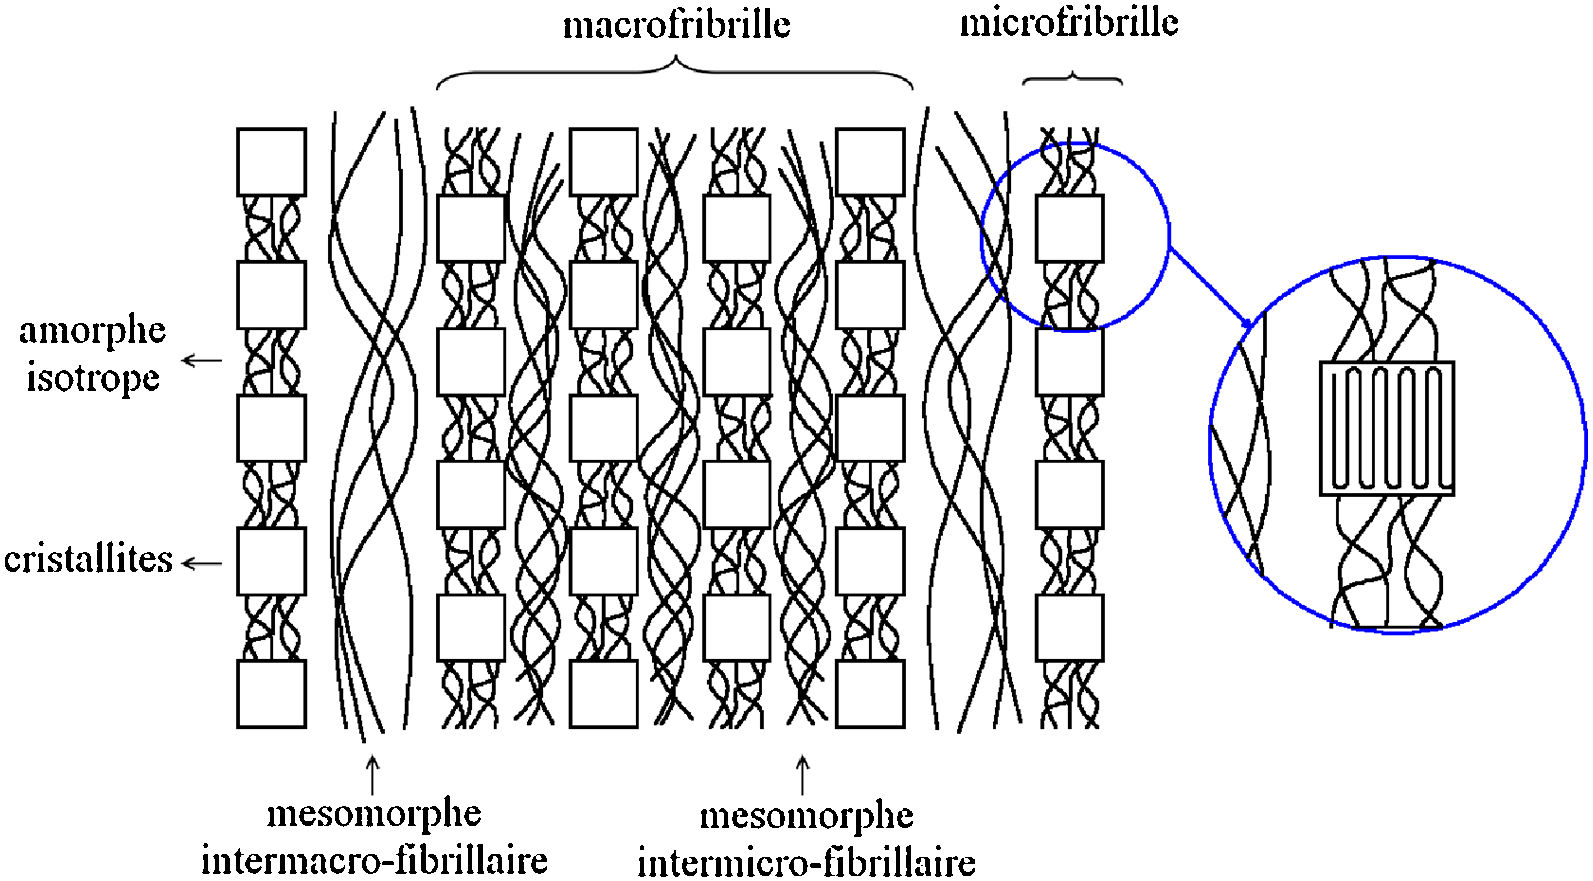
The structure of polymeric fibers is very complex and depends highly of the processing parameters; however some models have been proposed, by several authors, which describe well the general structures obtained in fibers [20–22]. One of the purposed models [23], considers that the fiber is composed by microfibrils, which are long elements aligned with the fiber axis, being the basic structural element. Microfibrils are composed by crystalline blocks (crystallites) which are linked by an isotropic amorphous phase oriented in the fiber axis direction. Microfibrils are then linked to each other (transverse direction) through another type of amorphous phase, also oriented along the fiber axis, and called mesamorphous phase. Microfibrils are grouped to form a macrofibril. A mesamorphous phase with lower density links macrofibrils, as observed in Fig. 1.
3Materials and methods
Two different fibers and two different fabrics used currently by prosthesis manufacturers were analyzed in terms of mechanical behavior, during tensile tests. The fibers tested were polyethylene terephthalate (PET) and polyethylene terephthalate low profile (PET-LP). The crystallinity evolution of PET and PET-LP fibers submitted to different stress levels was evaluated by DSC.
The PET textiles used in the current study present a plain weave characterized by a very regular pattern, with yarns arranged along two orthogonal directions, with additional reinforcement yarns over the plain fabric which resembles to a twill weave. PET-LP fabric is similar to PET but without the reinforcement yarns and it is produced with thinner fibres. The grafts samples tested exhibit thickness of 0.18mm for PET and of 0.10mm for PET-LP.
The materials were kindly supplied by COOK Medical in the form of tubular textiles, without stents attachment.
3.1SpecimensSquare textile samples (10×10 [mm]) were cut from the tubular prosthesis, for material characterization by Scanning Electron Microscopy (SEM) and optical microscopy.
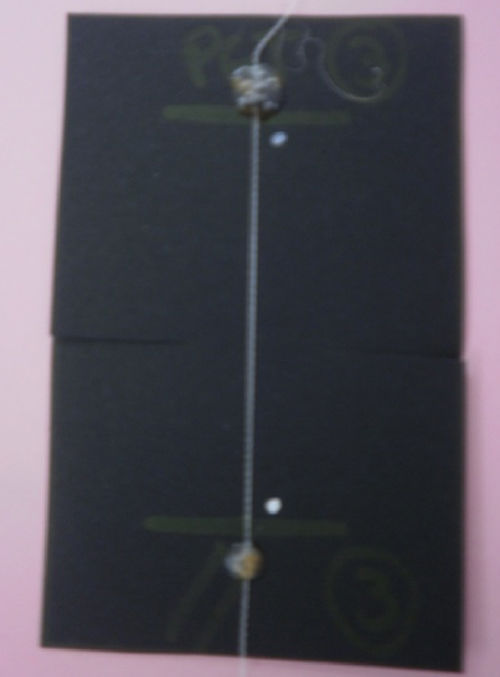
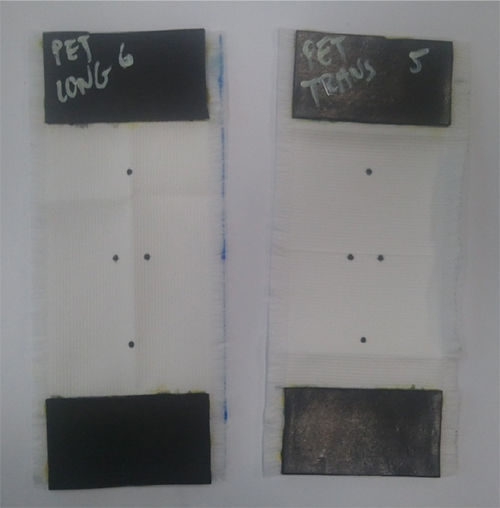
For the fiber tensile tests, yarns were taken from the prosthesis in the longitudinal direction (parallel to the prosthesis main axis) and in the transversal direction (perpendicular to the prosthesis main axis), and glue in black cards (80×50mm) for machine clamping. The black cards were marked with white dots, with a distance of 50mm, for strain measurement with a video extensometer, as can be observed in Fig. 2.

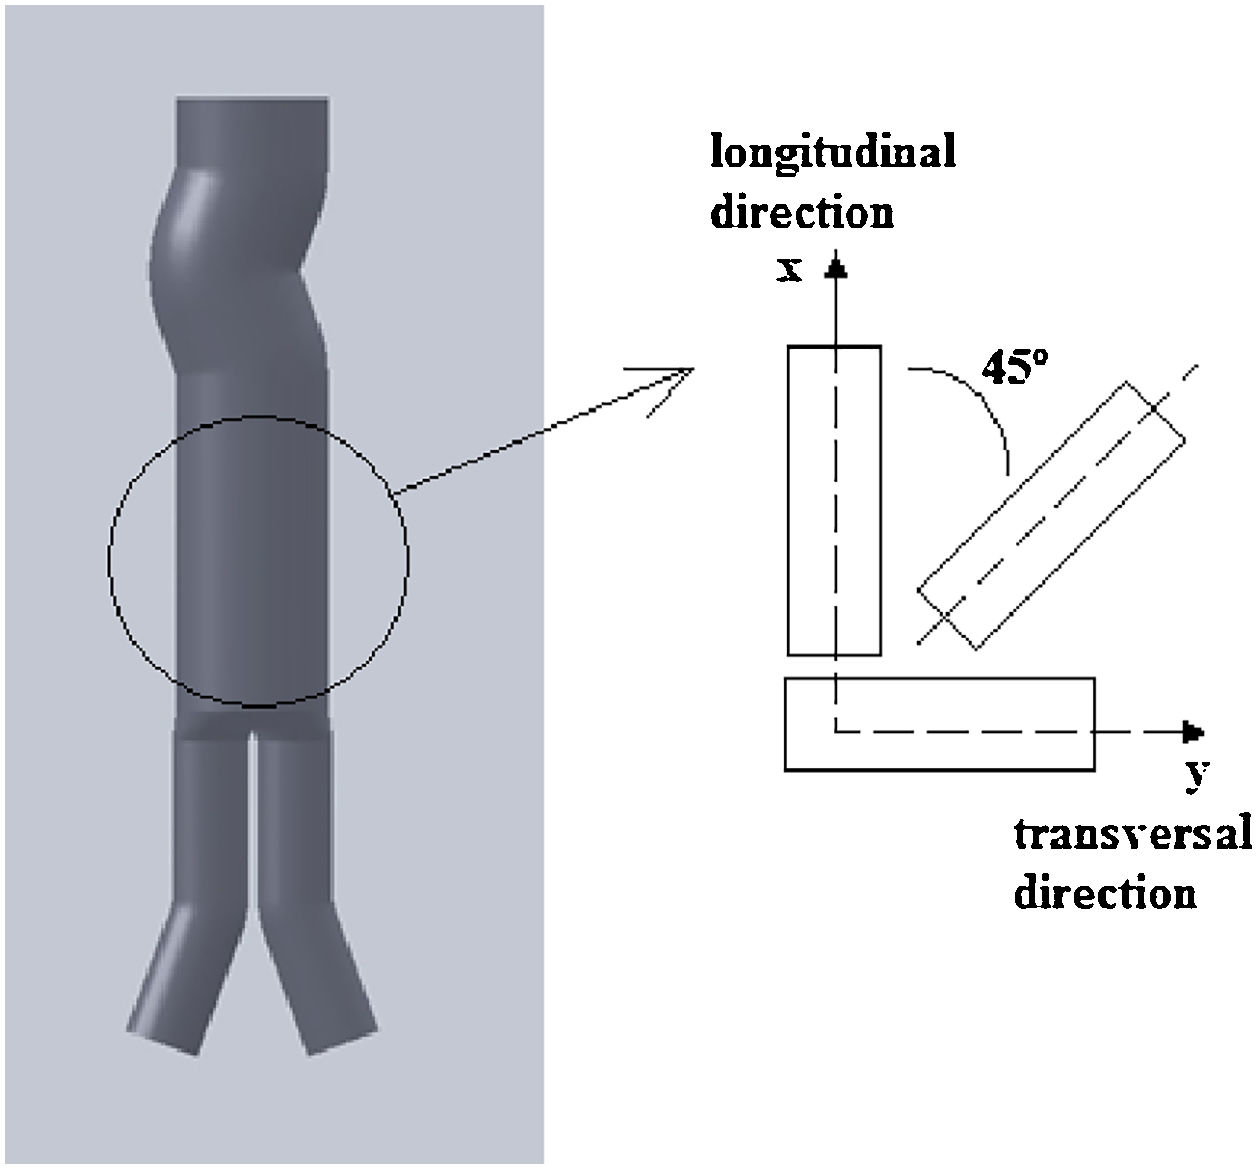
For the textile tensile tests, samples were taken from the prosthesis in the longitudinal direction, in the transversal direction and with 45° with the longitudinal axis, as observed in Fig. 3. The fabrics were cut with a rectangular shape of 130×60mm and at each lateral side a fringe of 5mm was produced according to standard ISO 13934-1. At the specimens tops, two rubber pieces, with 25×50 [mm], were glued (front and reverse) for better adhesion to the machine grips, avoiding slippage during the tests (Fig. 4). Thus, the specimens tested presented a dimension between grips of 80×50 [mm].


The specimens were marked with 4 black dots for strain measurement with a video extensometer (2 in the axial direction and 2 in the transversal direction), as can be observed also in Fig. 4.
3.2Microscopic and image analysisThe knowledge regarding real cross section of the yarns tested is of fundamental importance for accurate properties determination. Thereby the samples in the current study were observed by microscopy and analyzed using image analysis software.
The square fabric samples, for microscopic analyses, were placed in a mold, clamped with plastic clips for vertical standing and then mounted in cold resin. After 24h, for resin hardening, the specimens were demoulded and grinded in a grinding and polishing machine, with silicon carbide sandpapers between 200-grit and 2000-grit, using stream water, until a smooth surface was reached.
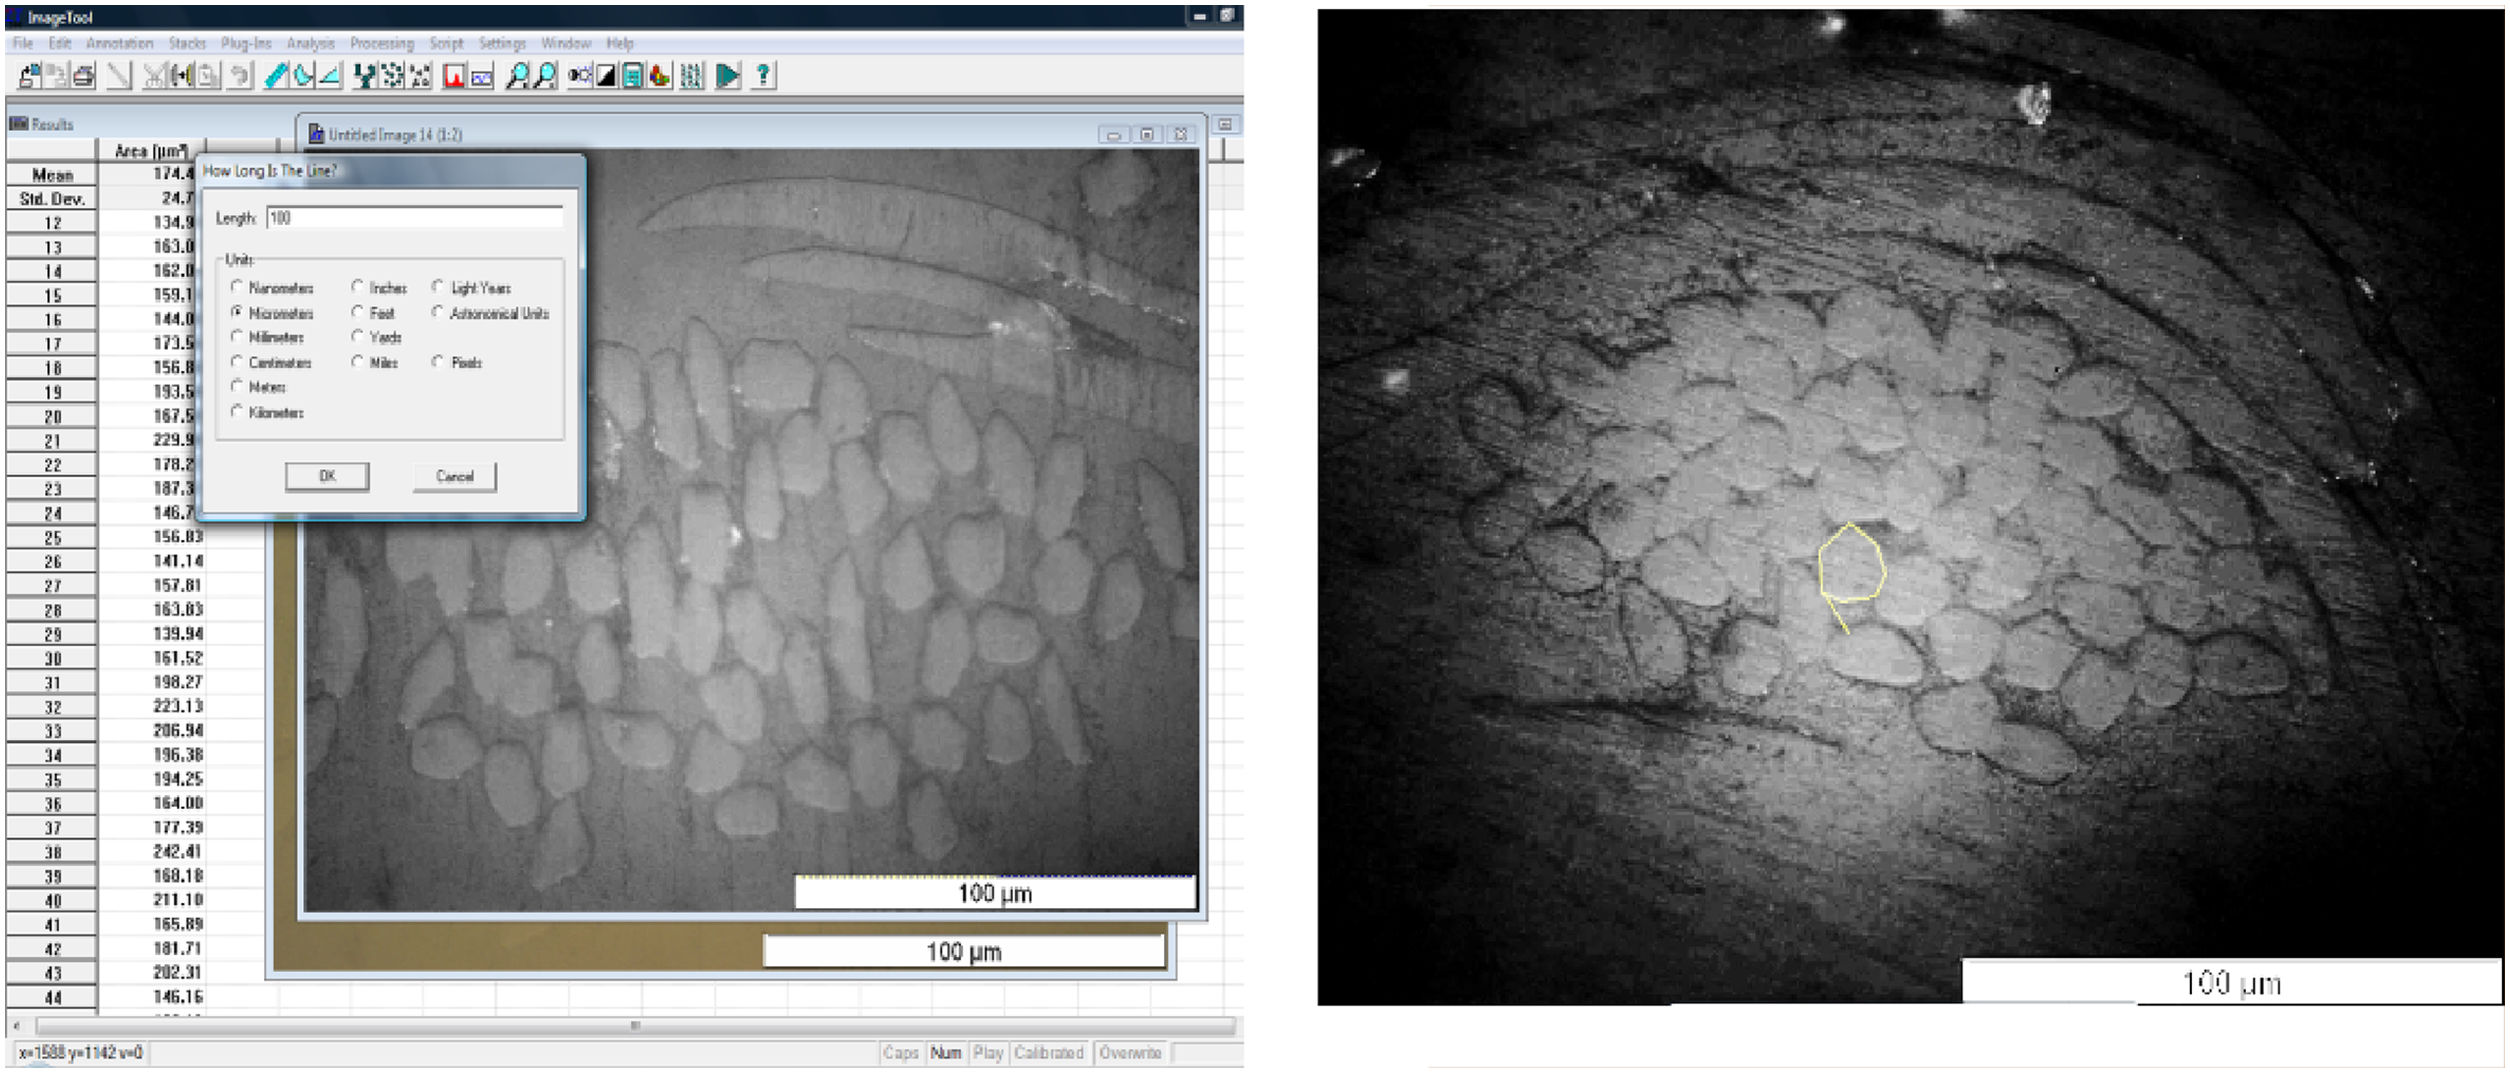
After abraded, the samples cross-sections were observed by an optical microscope (Olympus model BX51) coupled with a Linkam hot stage LTS 350 and Olympus SC-30 digital camera to analyze the fibers. Photographs were taken to analyze the fibers cross-section geometries and to count the number of monofilaments in each yarn. A computer with image analyzer software (UTHSCSA ImageTool program developed at the University of Texas Health Science Center at San Antonio, Texas and available from the Internet by anonymous FTP from maxrad6.uthscsa.edu) was used for the measurements, as can be seen in Fig. 5.
 and photomicrograph of the textiles under study (right), for determination of the fibers cross-section areas and number of monofilaments in a yarn (UTHSCSA ImageTool software).")
Scanning Electron Microscopy analyses were conducted on small fabric samples to observe the woven structures, the real cross section areas (for yarn tensile tests) and to count the number of yarns by mm in order to determine the exact cross section area of textile specimens with 50mm of width.
The samples were plated with a gold/palladium alloy and analyzed in a FEG – SEM equipment, model JSM-7001F, from JEOL with an energy of 5 or 10kV.
3.3Mechanical tests procedureThe tensile tests were performed in an universal testing machine from Instron (Model 5566) with a video extensometer (AVE) from Instron with a field of view of 200mm, for strain measurements in the axial (x) and transversal (y) directions.
The advanced non-Contacting video extensometer was of particular importance due to the fact the majority of the studies done on fibers and textiles use the extension measured by the machine to calculate strains and to calculate the Young modulus, which gives rise to measurement errors. With the video extensometer it is possible to measure the real strains suffered by the polymer fibers or the textiles, giving rise to a more accurate properties measurement. The Bluehill software was used to define the testing parameters.
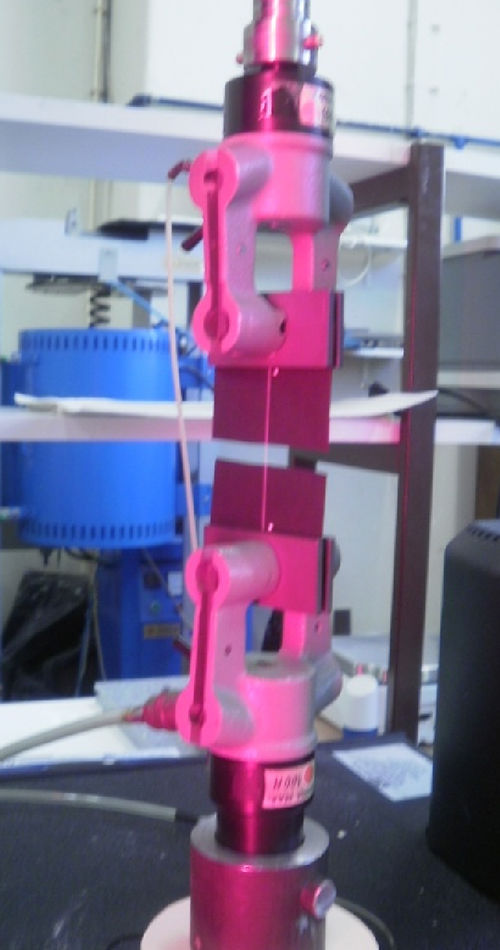
3.3.1Yarn testingDue to the small dimension of yarns cross-sections a load cell of 10N was used. The samples were clamped in the machine, in the vertical position, using pneumatic grips, in such a way that the white dots stay in the edge of the grips, as observed in Fig. 6, in front of the video extensometer for axial strain measurements. After clamping the specimens, the black cards were cut, letting just the yarn subjected to tension.

The tests were performed with a crosshead velocity of 5mm/min, in a controlled environment, at 20°C. For each kind of fabric and for each direction (longitudinal and transversal) 8 specimens were tested.
To better understand the yarns performance when different stresses levels are applied, tensile tests were also done on some PET and PET-LP yarns, stopping the test in different zones of the tensile curve, to analyze microscopically the polymer chains behavior. The tests were performed exactly with the same procedure as explained in the above paragraph and then unloaded. PET and PET-LP longitudinal yarns were subjected to three distinct stress levels of: 75MPa, 150MPa and 275MPa. After unloading, DSC analyses were conducted on those specimens. Yarns in the transversal direction were not analyzed due to the fact that their behavior, regarding slope evolution, was very similar to the one observed in the longitudinal direction.
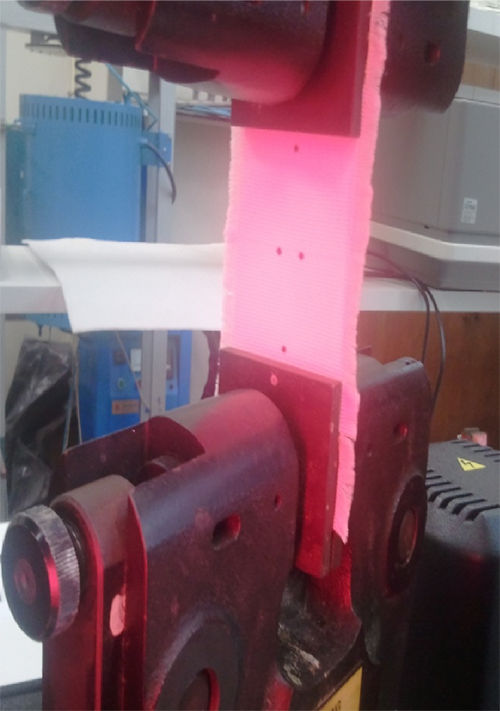
3.3.2Textile testingThe tensile tests were performed with a load cell of 10kN and with a video extensometer for strain measurements in the axial and transversal directions. The rectangular samples were clamped in the machine, in the vertical position, using pneumatic grips, as observed in Fig. 7. The tests were performed with a crosshead velocity of 20mm/min, in a controlled environment, at 20°C. For each kind of fabric and for each direction (longitudinal, transversal and 45°) 6 specimens were tested.

The samples were marked with 4 black dots: 2 dots in the axial direction with a distance of 50mm and 2 dots in the transversal direction with a distance of 10mm. The measurements of the strains in both directions allowed the determination of the textiles Poisson coefficient.
3.4DSC analysisThe DSC analyses were performed with an equipment from TA Instruments, Model 2920 MTDSC, operating in the conventional mode. The samples were sealed under air in aluminum crucibles and weighted on a Mettler UMT2 ultra-micro balance. Helium at 0.5cm3/s flow rate was used as purging gas. The temperature and heat flow scales of the instrument were calibrated according to the procedure described by Moura-Ramos [24]. Samples were submitted to a heating ramp of 10°C/min between the ambient temperature and 300°C. All characteristic temperatures and enthalpies were measured on the first cycle. The Thermal Advantage software was used for the test control and the Universal Analysis 2000 software was used for data treatment.
Measuring the area under the melting event allows calculating the melting enthalpy ΔHm. Based on the value for the melting enthalpy of 100% crystalline material, found in literature ΔHlit, it is possible to estimate the crystallinity ratio (Xc) of the specimen analyzed:
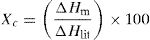
For the calculation, a value of ΔHlit=135J/g was used [25].
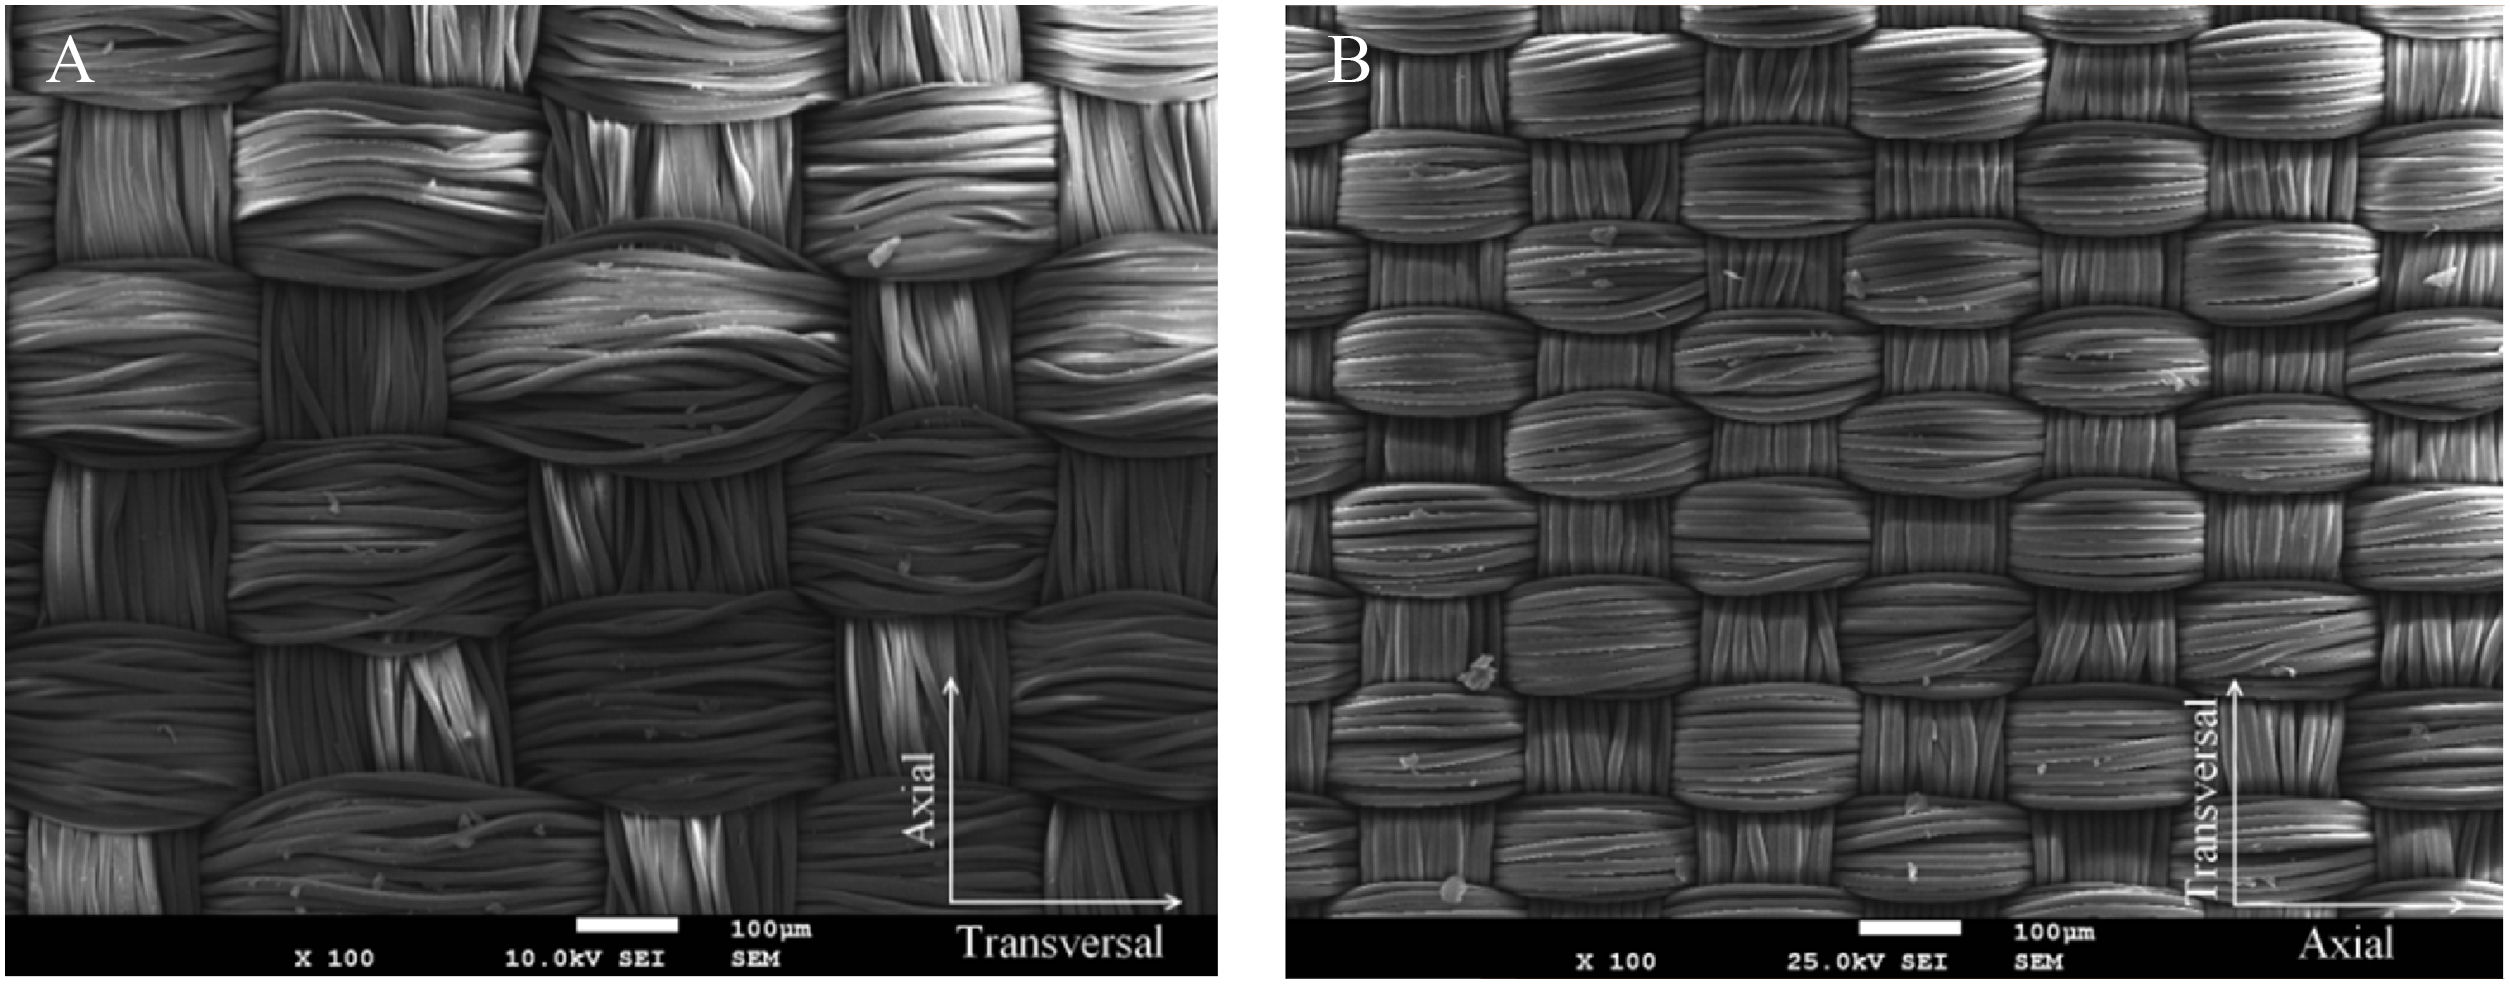
4Results and discussion4.1Microscopic and image analysisThe analysis done with SEM allows to characterize the woven textiles in terms of weaving and observe the differences between the two grafts under study (Fig. 8).
 PET fabric; (B) PET-LP fabric.")
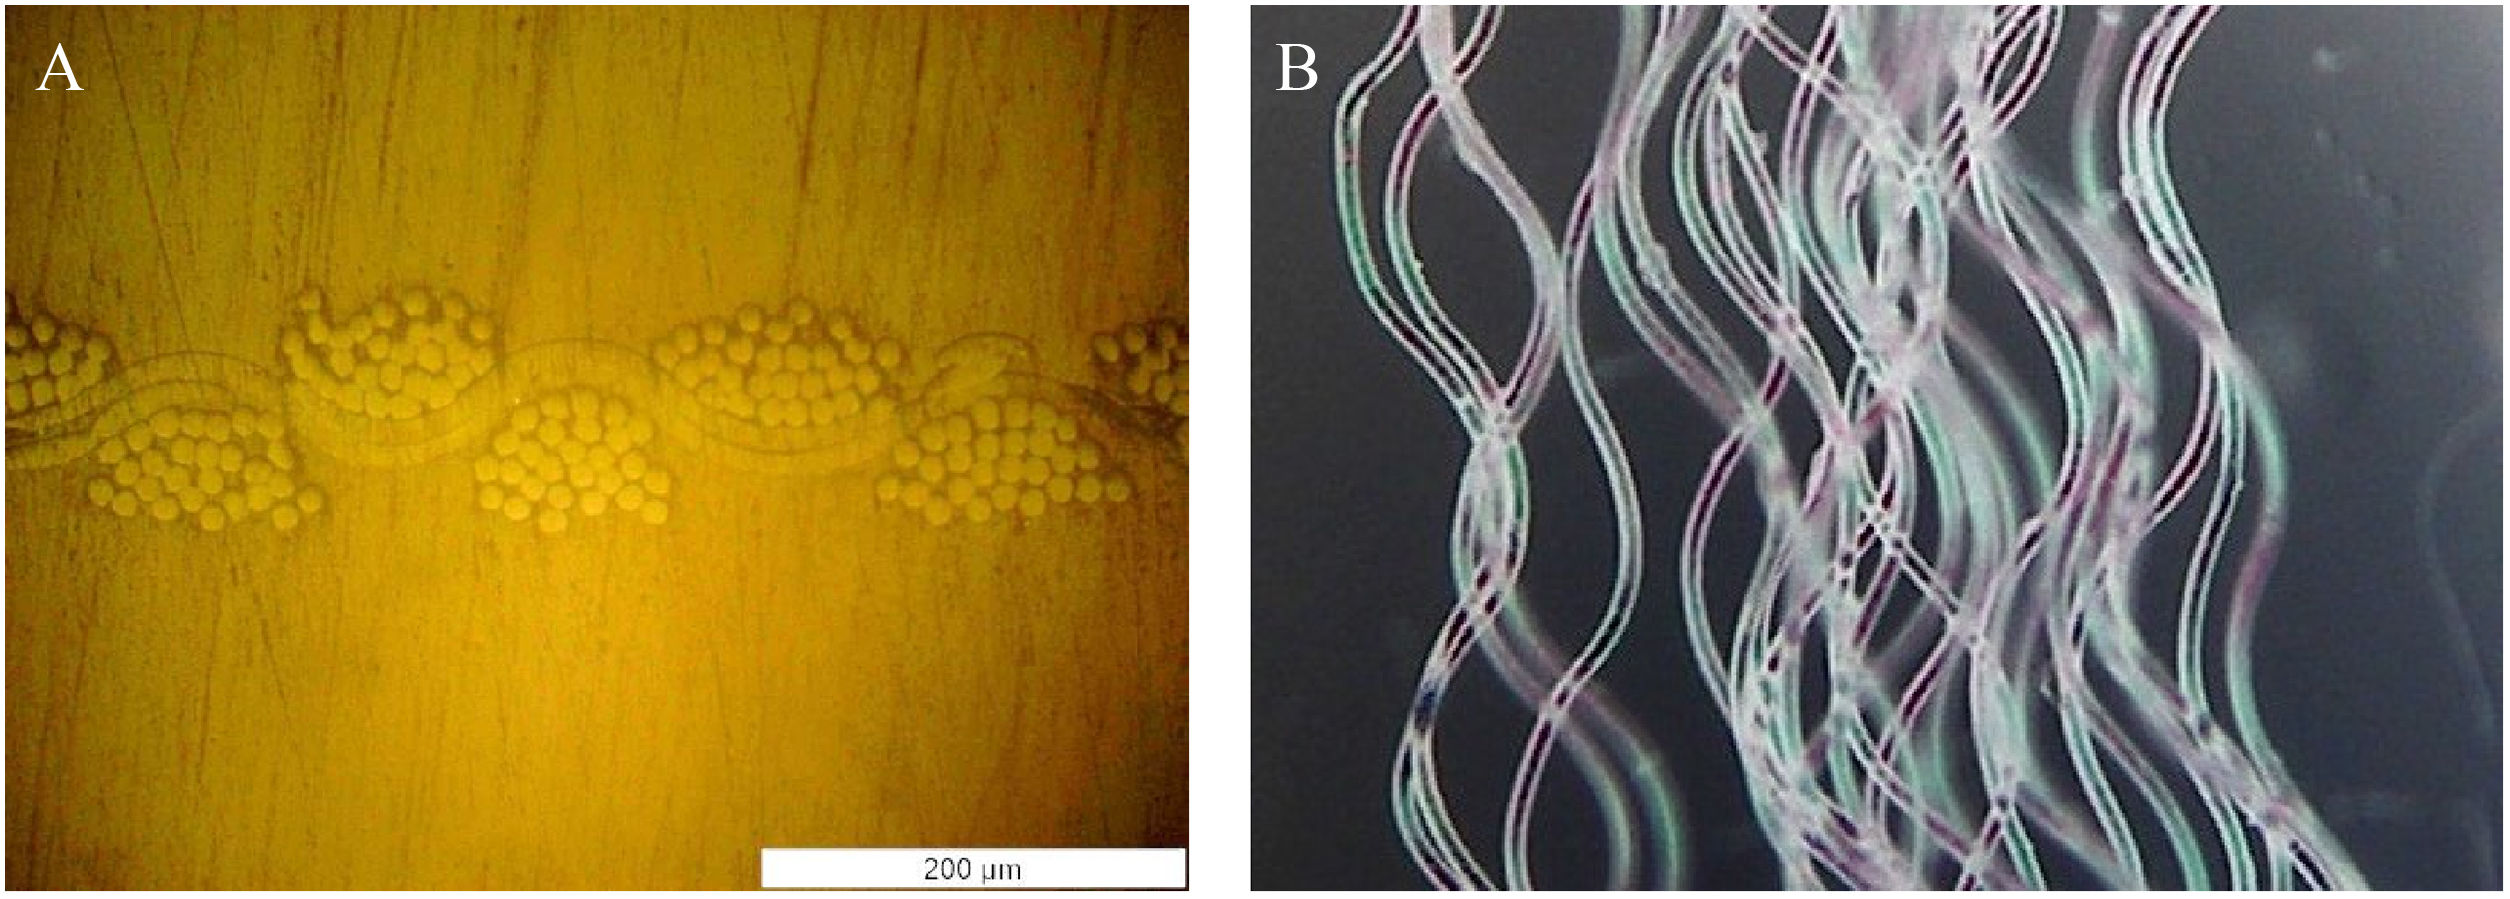
With the optical microscope and with the image processing software it was possible to observe and measure the monofilaments cross sections. It was observed that PET monofilaments present an irregular polygon cross section (Fig. 5) while PET-LP presents monofilaments with circular cross section, with diameter around 13.2μm as observed in Fig. 9-A. The observations done allowed to determine that each PET yarn is composed of 54 monofilaments with an average area of 136.6μm2/each, thus each yarn has a cross section area of 7376.4μm2. It was also observed that each transversal yarn of PET fabric in fact is made of two yarns with 27 monofilaments each (making 54 monofilaments in the total). Each PET-LP yarn is composed of 27 monofilaments with 13.2μm of diameter, thus each yarn has a cross section area of 3693.0μm2. Due to the textile weaving, the yarns removed from the grafts presented a weaved profile as observed in Fig. 9-B.
 fabric cross section observed by optical microscopy; (B) weaved profile of PET-LP yarns.")
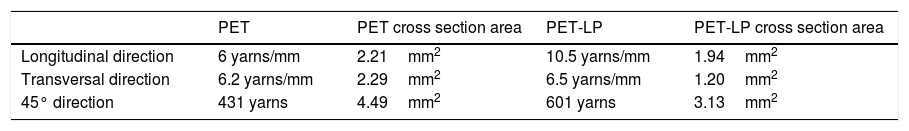
With the SEM equipment it was possible to observe the woven surfaces and measure the bundles in the two directions. PET presents bundles with a dimension around 171μm in the axial prosthesis direction and 200μm in the transversal direction (Fig. 8A). PET-LP presents much more regular braiding with bundles dimensions around 121μm in the axial prosthesis direction and 130μm in the transversal direction (Fig. 8B). Using an image analysis software it was also possible to count the number of yarns by mm and to estimate de textile cross section area in specimens with 50mm of width (tensile specimens), as presented in Table 1. The cross section areas for the specimens making 45° with the main prosthesis axis were calculated estimating the number of yarns in a width of 50mm and considering that the real yarn area subjected to tension is equal to the original yarn area (perpendicular to the fibre axis) dividing by cos45°.
Determination of cross-section areas for textiles specimens with 50mm width, for tensile tests.
| PET | PET cross section area | PET-LP | PET-LP cross section area | |
|---|---|---|---|---|
| Longitudinal direction | 6 yarns/mm | 2.21mm2 | 10.5 yarns/mm | 1.94mm2 |
| Transversal direction | 6.2 yarns/mm | 2.29mm2 | 6.5 yarns/mm | 1.20mm2 |
| 45° direction | 431 yarns | 4.49mm2 | 601 yarns | 3.13mm2 |
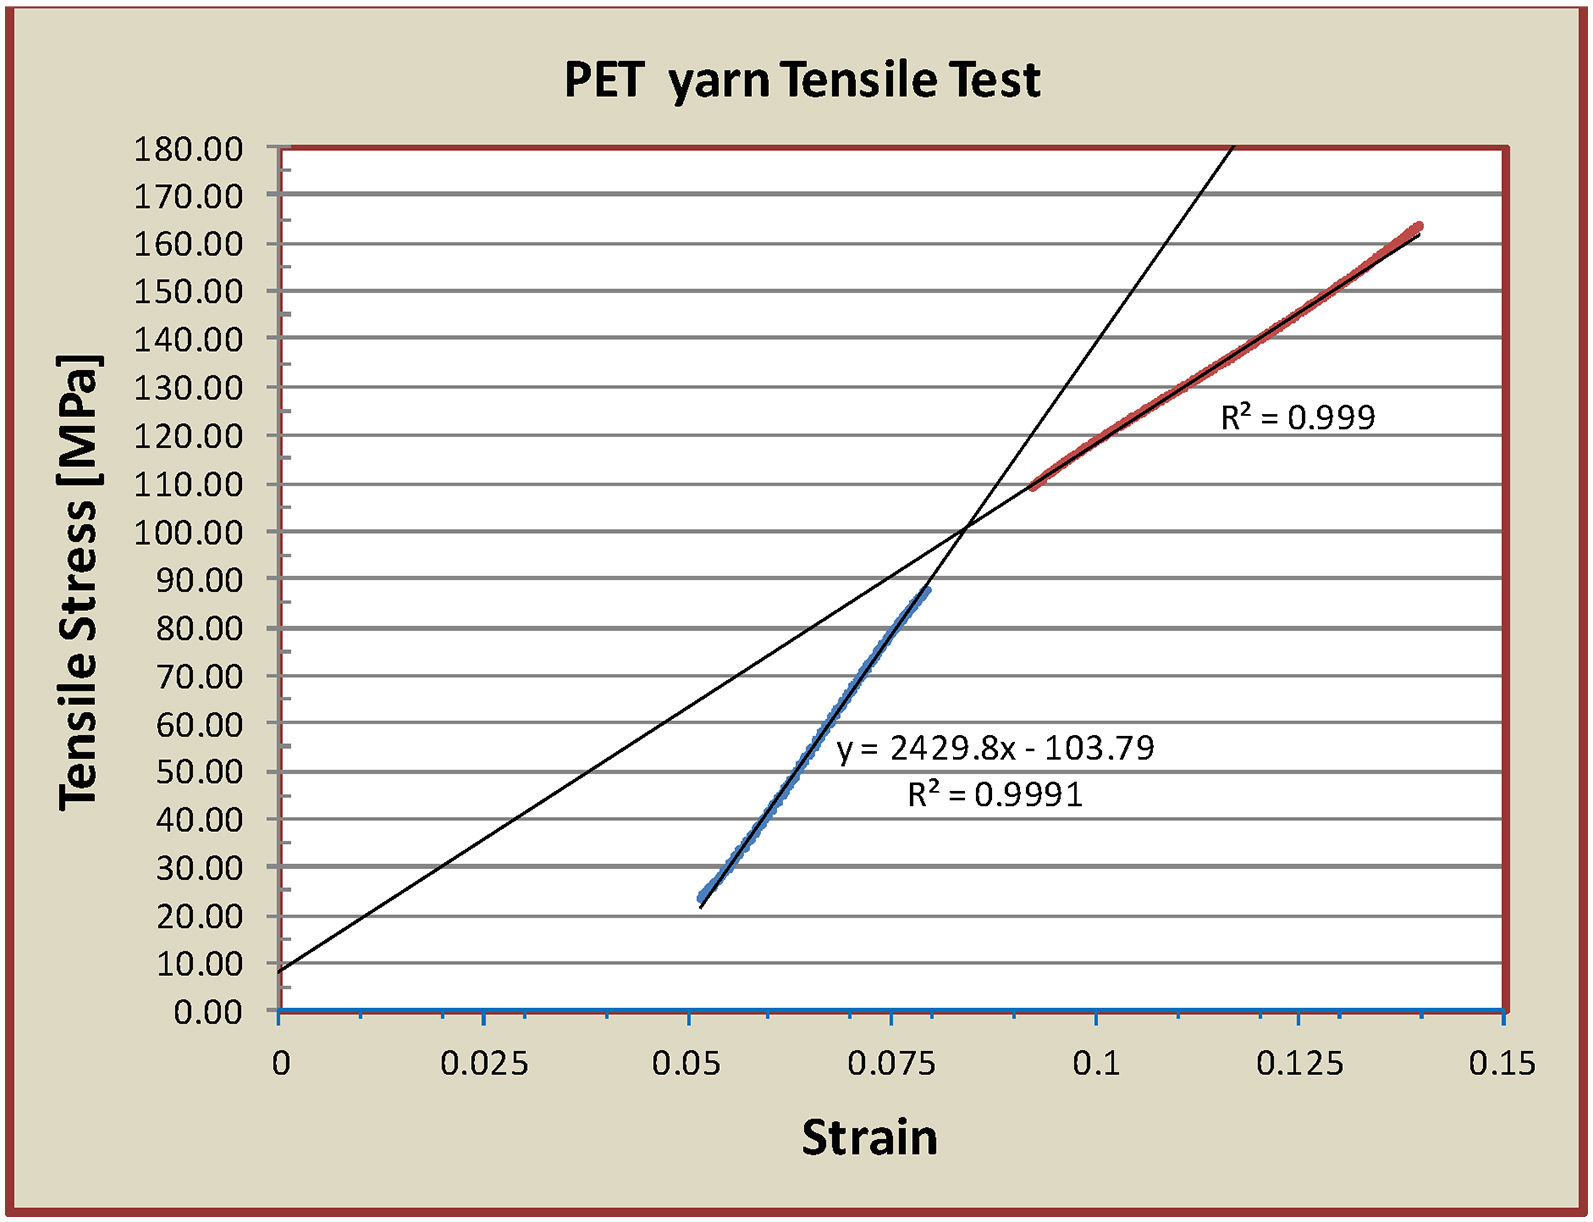
After testing the yarns and the textiles, the stress/strain curves were plotted and the elastic modulus (E) was determined by the line slope obtained by the interpolation of the points in the elastic zone. The yield stress (σyld) was determined using the Coplan method [26,27] as observed in Fig. 10 and the rupture stress (σR) was determined as the maximum stress achieved before the yarn/textile break up. The rupture strain (ɛR) was also determined, corresponding to the yarn/textile strain at maximum stress.
 by the Coplan method, where the first linear zone is intersected with the second linear zone of the curve obtained, being the Yield stress determined by the intersection point.")
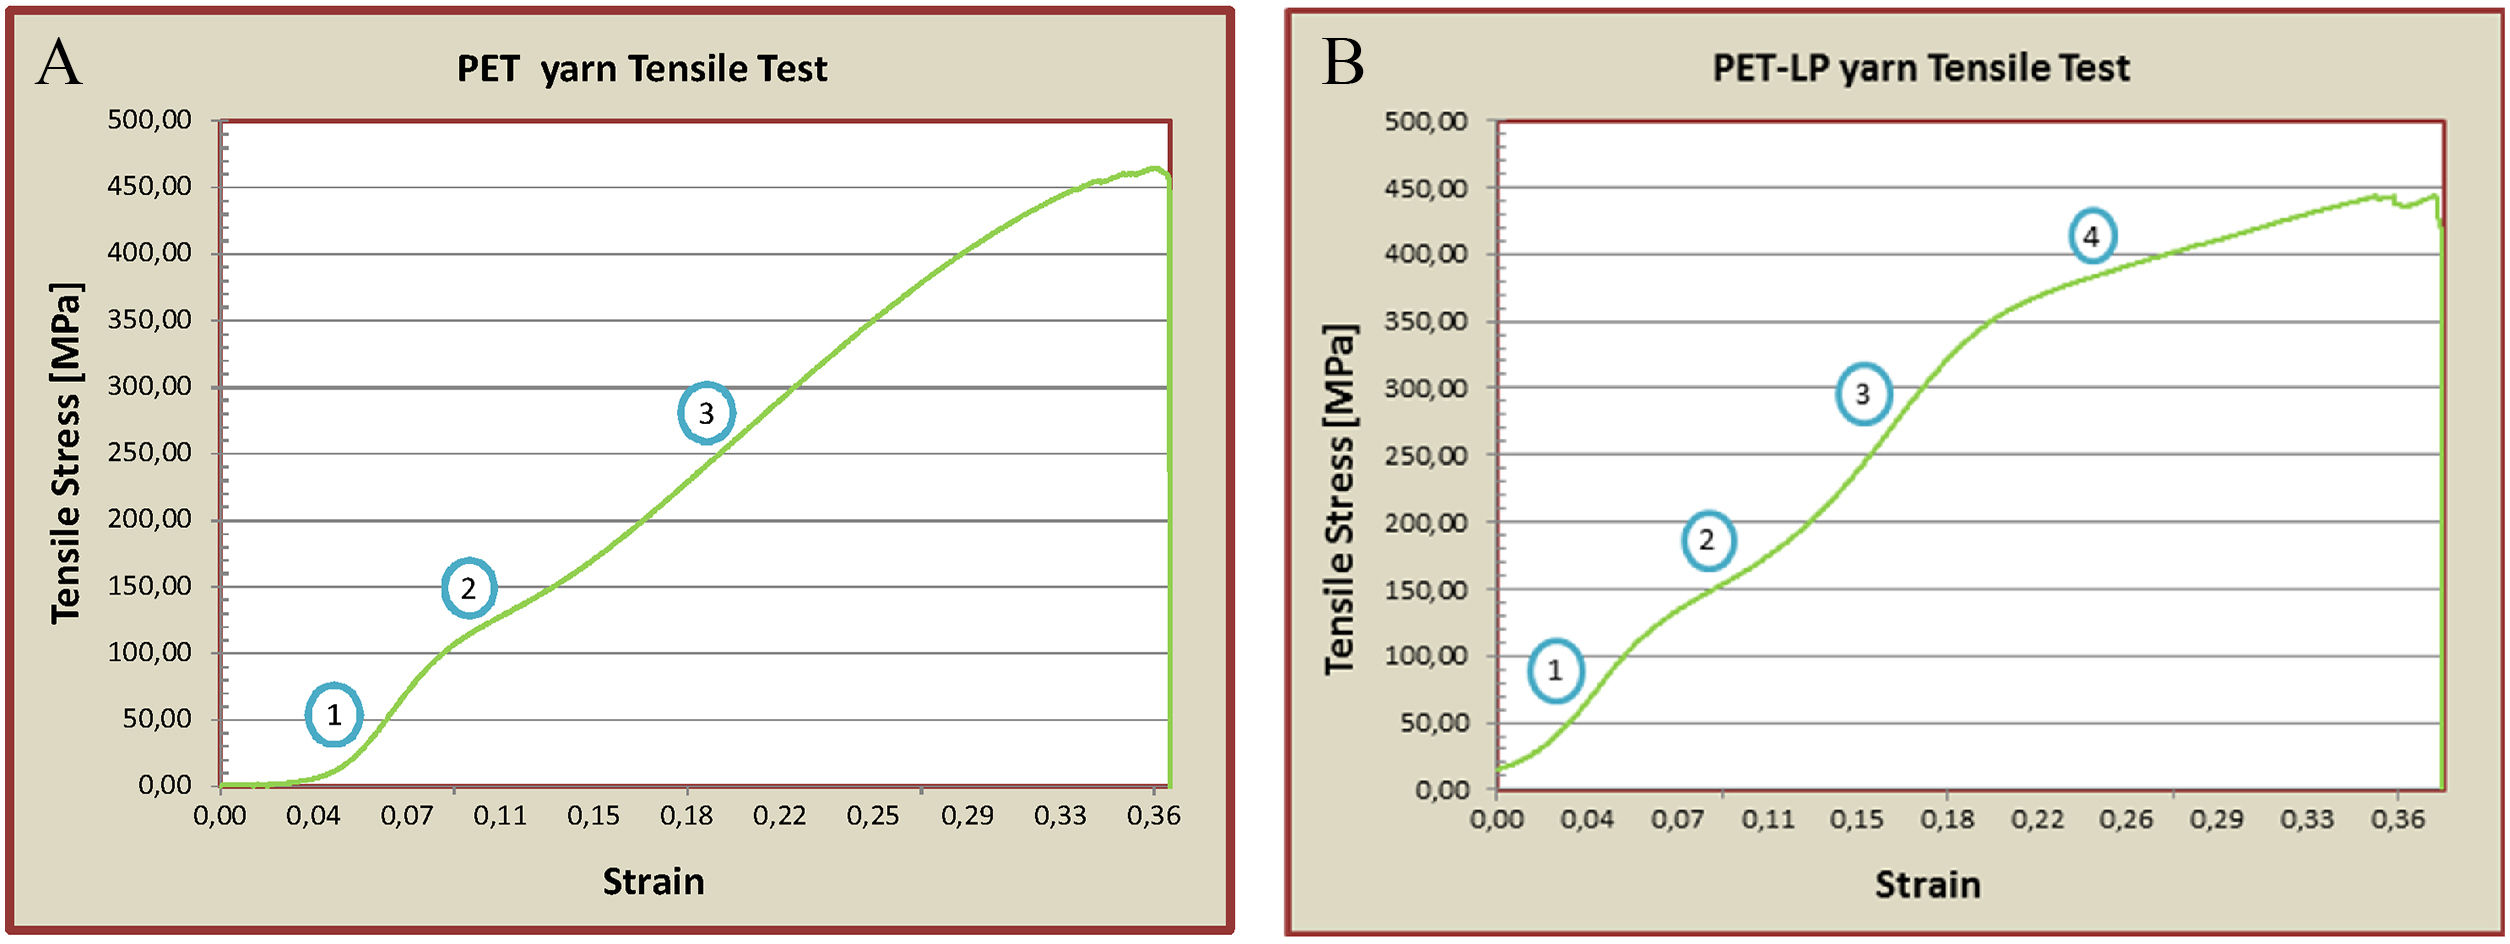
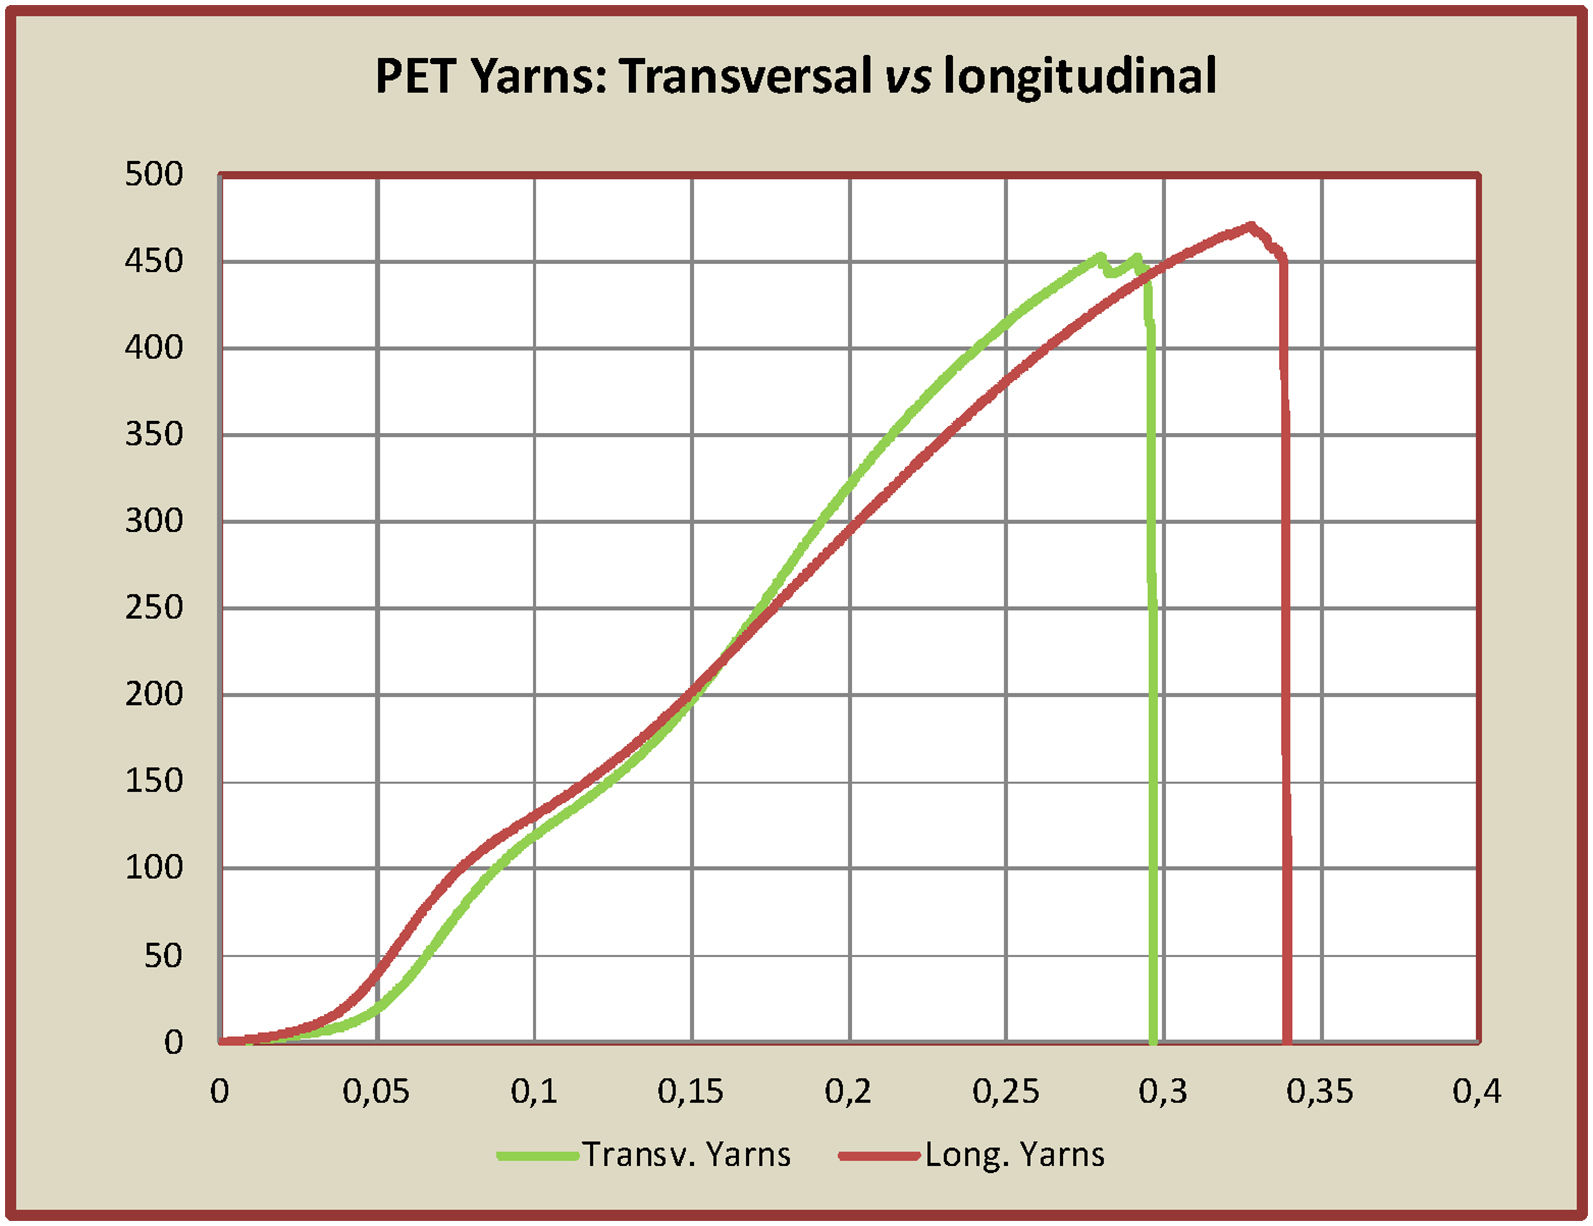
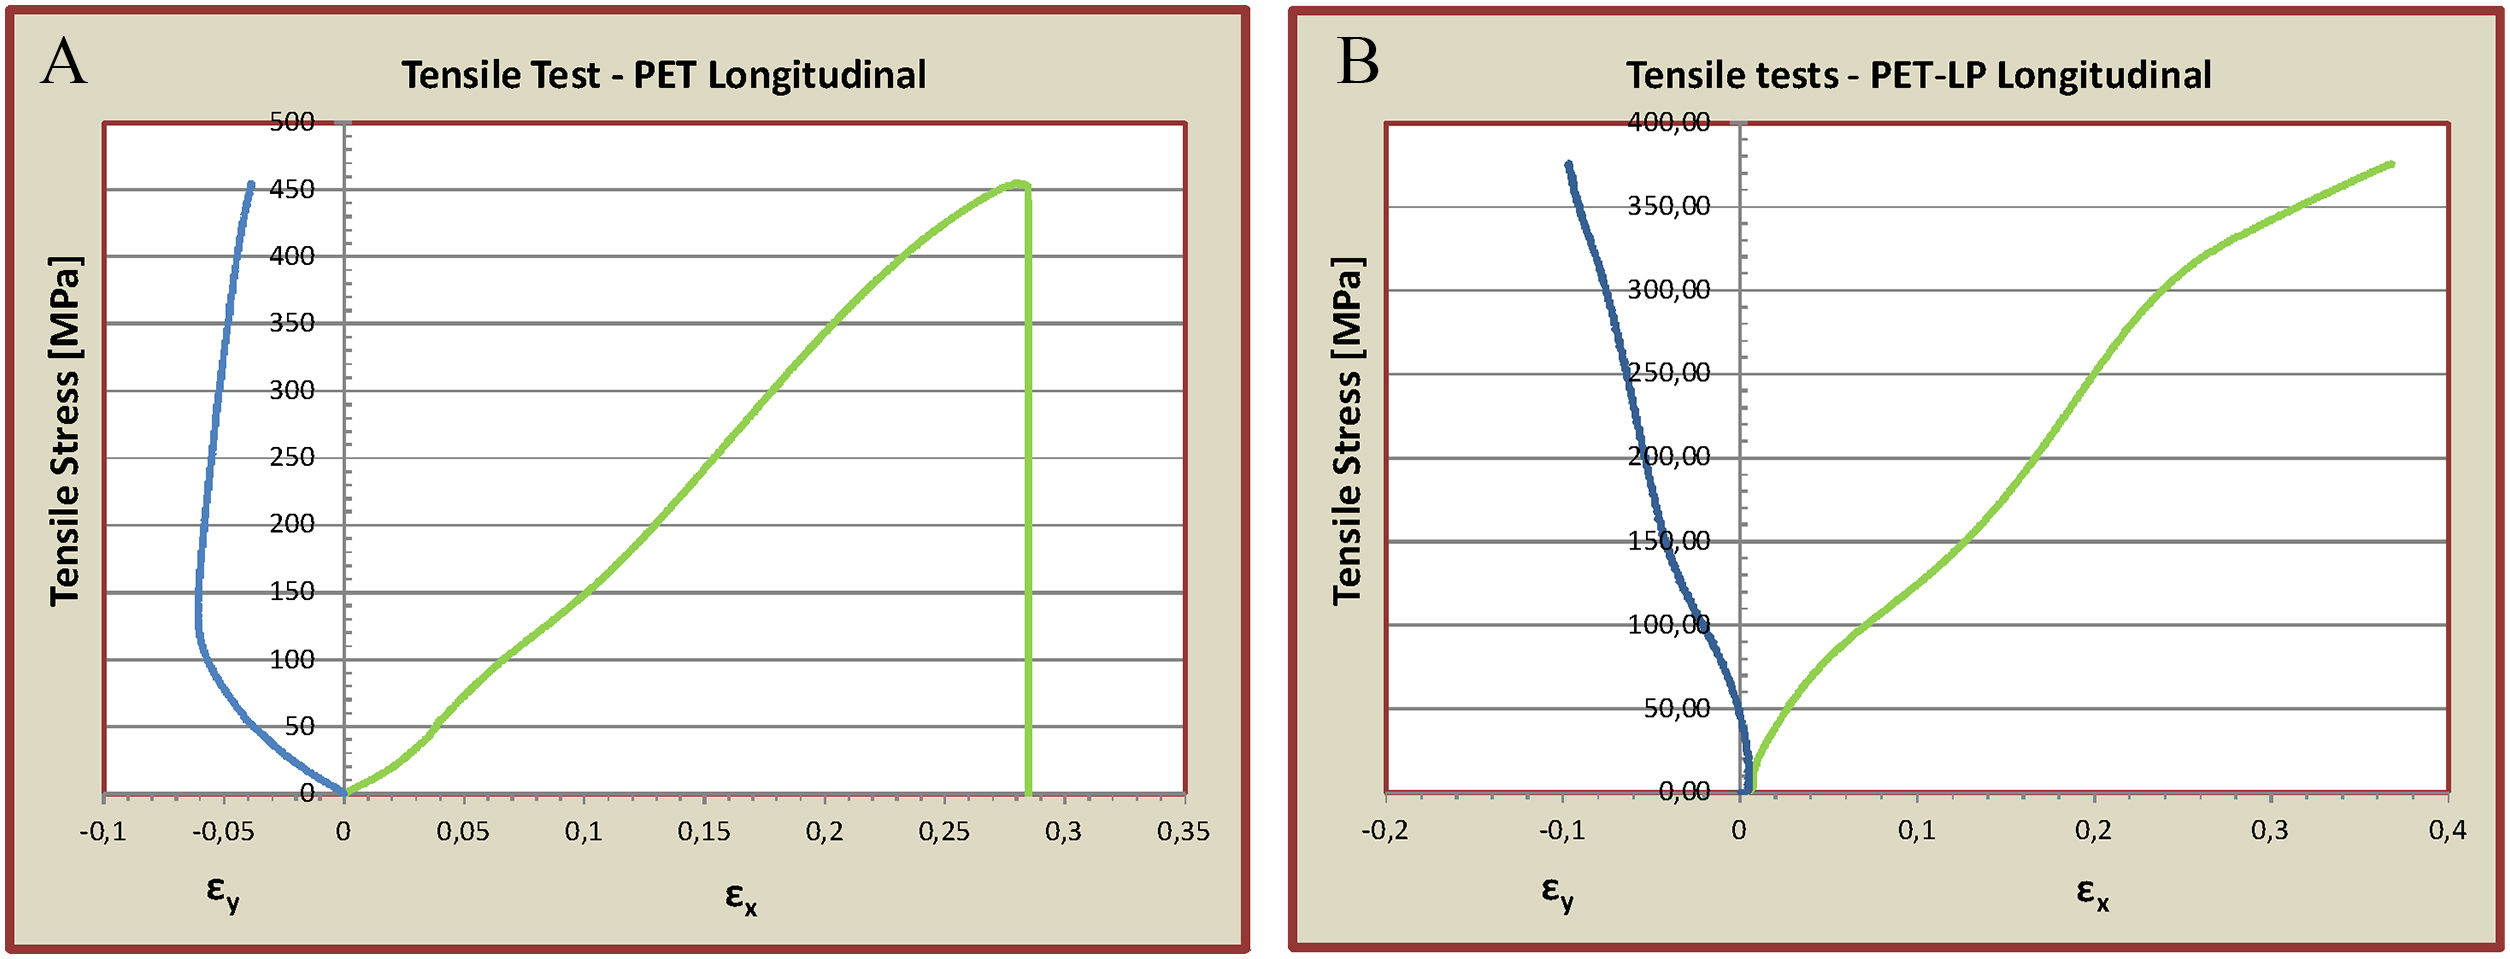
In Fig. 11 it can be seen two of the graphics obtained, with the tensile stress plotted as function of the applied axial strain (ɛx), for PET and for PET-LP yarns. Table 2 presents the average values, with standard deviation, obtained in all the experiments.
 PET and (B) PET-LP specimens.")
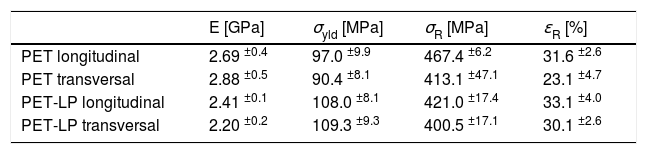
Mechanical properties obtained in tensile tests for PET and PET-LP yarns.
| E [GPa] | σyld [MPa] | σR [MPa] | ɛR [%] | |
|---|---|---|---|---|
| PET longitudinal | 2.69 ±0.4 | 97.0 ±9.9 | 467.4 ±6.2 | 31.6 ±2.6 |
| PET transversal | 2.88 ±0.5 | 90.4 ±8.1 | 413.1 ±47.1 | 23.1 ±4.7 |
| PET-LP longitudinal | 2.41 ±0.1 | 108.0 ±8.1 | 421.0 ±17.4 | 33.1 ±4.0 |
| PET-LP transversal | 2.20 ±0.2 | 109.3 ±9.3 | 400.5 ±17.1 | 30.1 ±2.6 |
As can be observed in Fig. 11-A, PET yarns presented 3 different slopes during deformation. The curve obtained is typical of heat treated PET fibers. On the other hand, tensile tests done on PET-LP specimens present four different slopes during deformation (Fig. 11-B). All specimens, of the some material, exhibited the same behavior. As can be observed in Table 2 the fibers tested exhibited high strength and a medium modulus. It was observed that PET yarns exhibited some differences in the 2 prosthesis directions, mainly regarding the rupture stress attained, although yarns present similar geometry in both directions. PET-LP yarns exhibited similar behavior in both directions. It was observed that the rupture stress was a beat higher for PET longitudinal yarns but the maximum deformation achieved was a beat higher for PET-LP longitudinal yarns. The yarns which exhibited higher elastic modulus were PET transversal yarns, which also exhibited the lowest rupture strain.
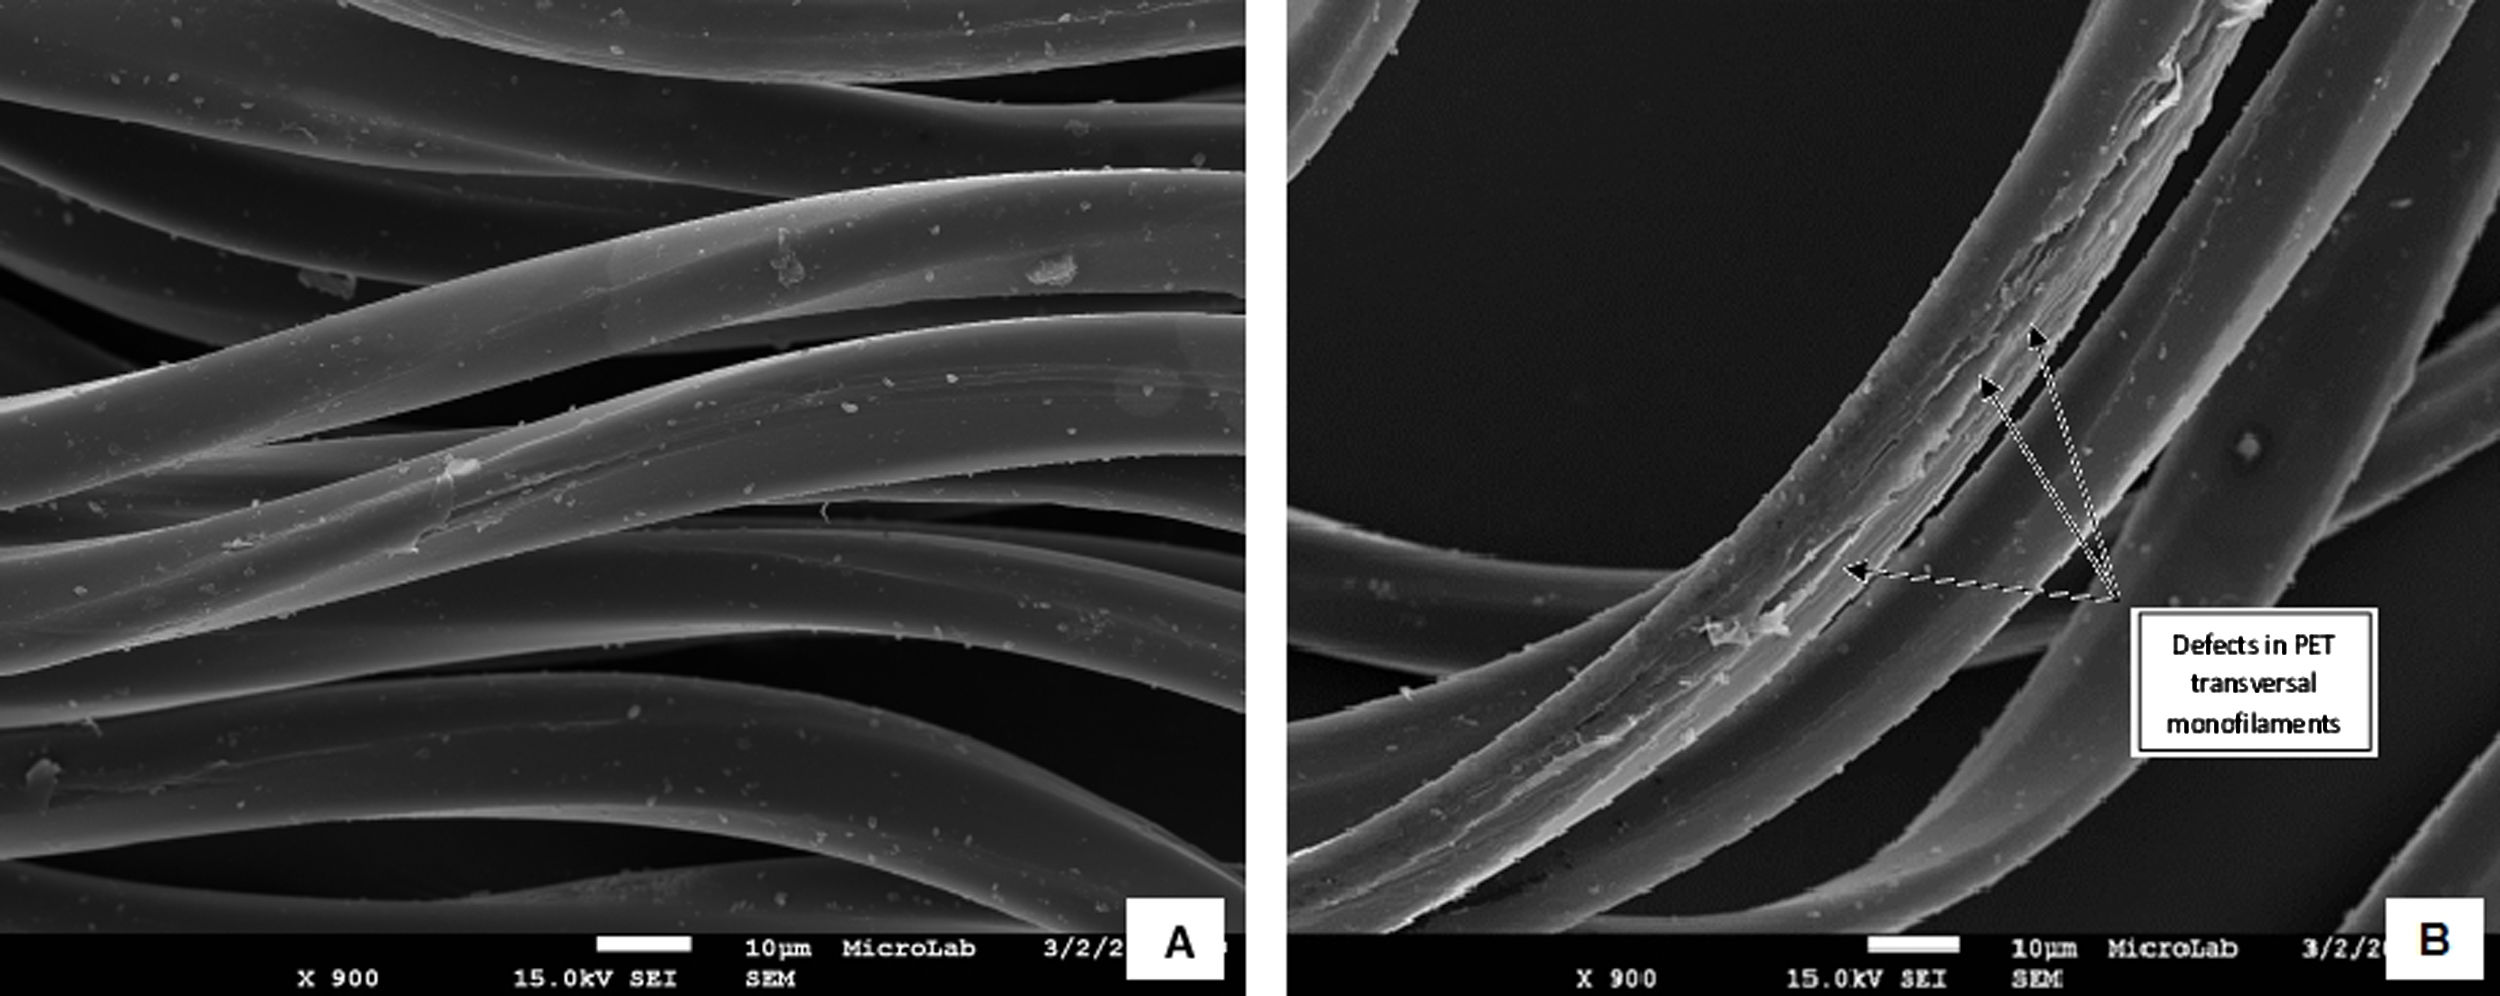
The differences between PET fibers in the two prosthesis directions, which can be observed in the graphic of Fig. 12, can be attributed to different factors, namely: the use of plasticizers usually on the weft direction; pre-tension on the warp direction; textile folds that create localized kinks on fibers giving rise to localized defects, reducing yarns strength. Regarding this last point, it was observed frequently that the rupture phenomenon occurred in steps indicating progressive break of the filaments, which resulted in a lower (nominal) rupture stress of the yarn. This phenomenon was much more evident on PET transversal fibers. In Fig. 13 it can be observed 2 SEM images of PET yarns (longitudinal and transversal), taken from zones where the prosthesis was folded. It can be observed larger surface defects in the transversal yarn (Fig. 13-B) which can contribute to the lower tensile strength and lower strain of PET transversal yarns.

 SEM of a PET longitudinal yarn; (B) SEM of PET transversal yarn showing surface defects on monofilaments, in folded areas.")
The difference on fiber properties observed, will contribute for the anisotropic behavior of the graft textiles used for endovascular applications.
Regarding the deformation development during the tests, it can be observed that in the beginning a small curve appears, with low stress applied, due to the fact that yarns were taken from woven textiles presenting a waved profile (Fig. 9-B). The curve observed correspond to the un-crimp of the fibers until they are completely straight.
After the yarns are full straight it can be observed a first linear zone corresponding to the elastic behavior of the polymer. According to the model presented in Section 2, fibers are composed by an isotropic amorphous phase between crystallites. During the initial deformation, the isotropic amorphous chains unfold, giving rise to an oriented amorphous phase. The increase in stress is also attributed to the internal friction phenomena between chains and their entanglements.
At the end of this linear zone appears a second linear zone with lower slop pointing that the material entered in the plastic zone (softening behavior). During this period the amorphous phase and the crystalline blocks continue to align without needing to increase the load significantly, until they are completely orientated (in the load direction). Also fine slip between crystallites may occur, as occurs with other polymers like polyethylene [28]. The deformation it's limited by the crystalline blocks that act as system nodes.
It can be observed that the second zone it is not much long and a third zone appears with meaningful increase slop, which can be attributed to the increase of crystallinity of the fibers due to strong alignment of the polymer chains and increase of attraction forces between molecular chains which leads to strain hardening of the polymer. In this period all aligned chains are affected. Studies done [29] show a crystallites densification and an increase of the crystalline perfection.
For PET-LP yarns a forth zone appears, with lower slop, probably due to slippage between macrofibrils until maximum strain of the chains is achieved and rupture occurs. Regarding PET fibers, after the third zone, a very short plane zone appears and breaking quickly occurs.
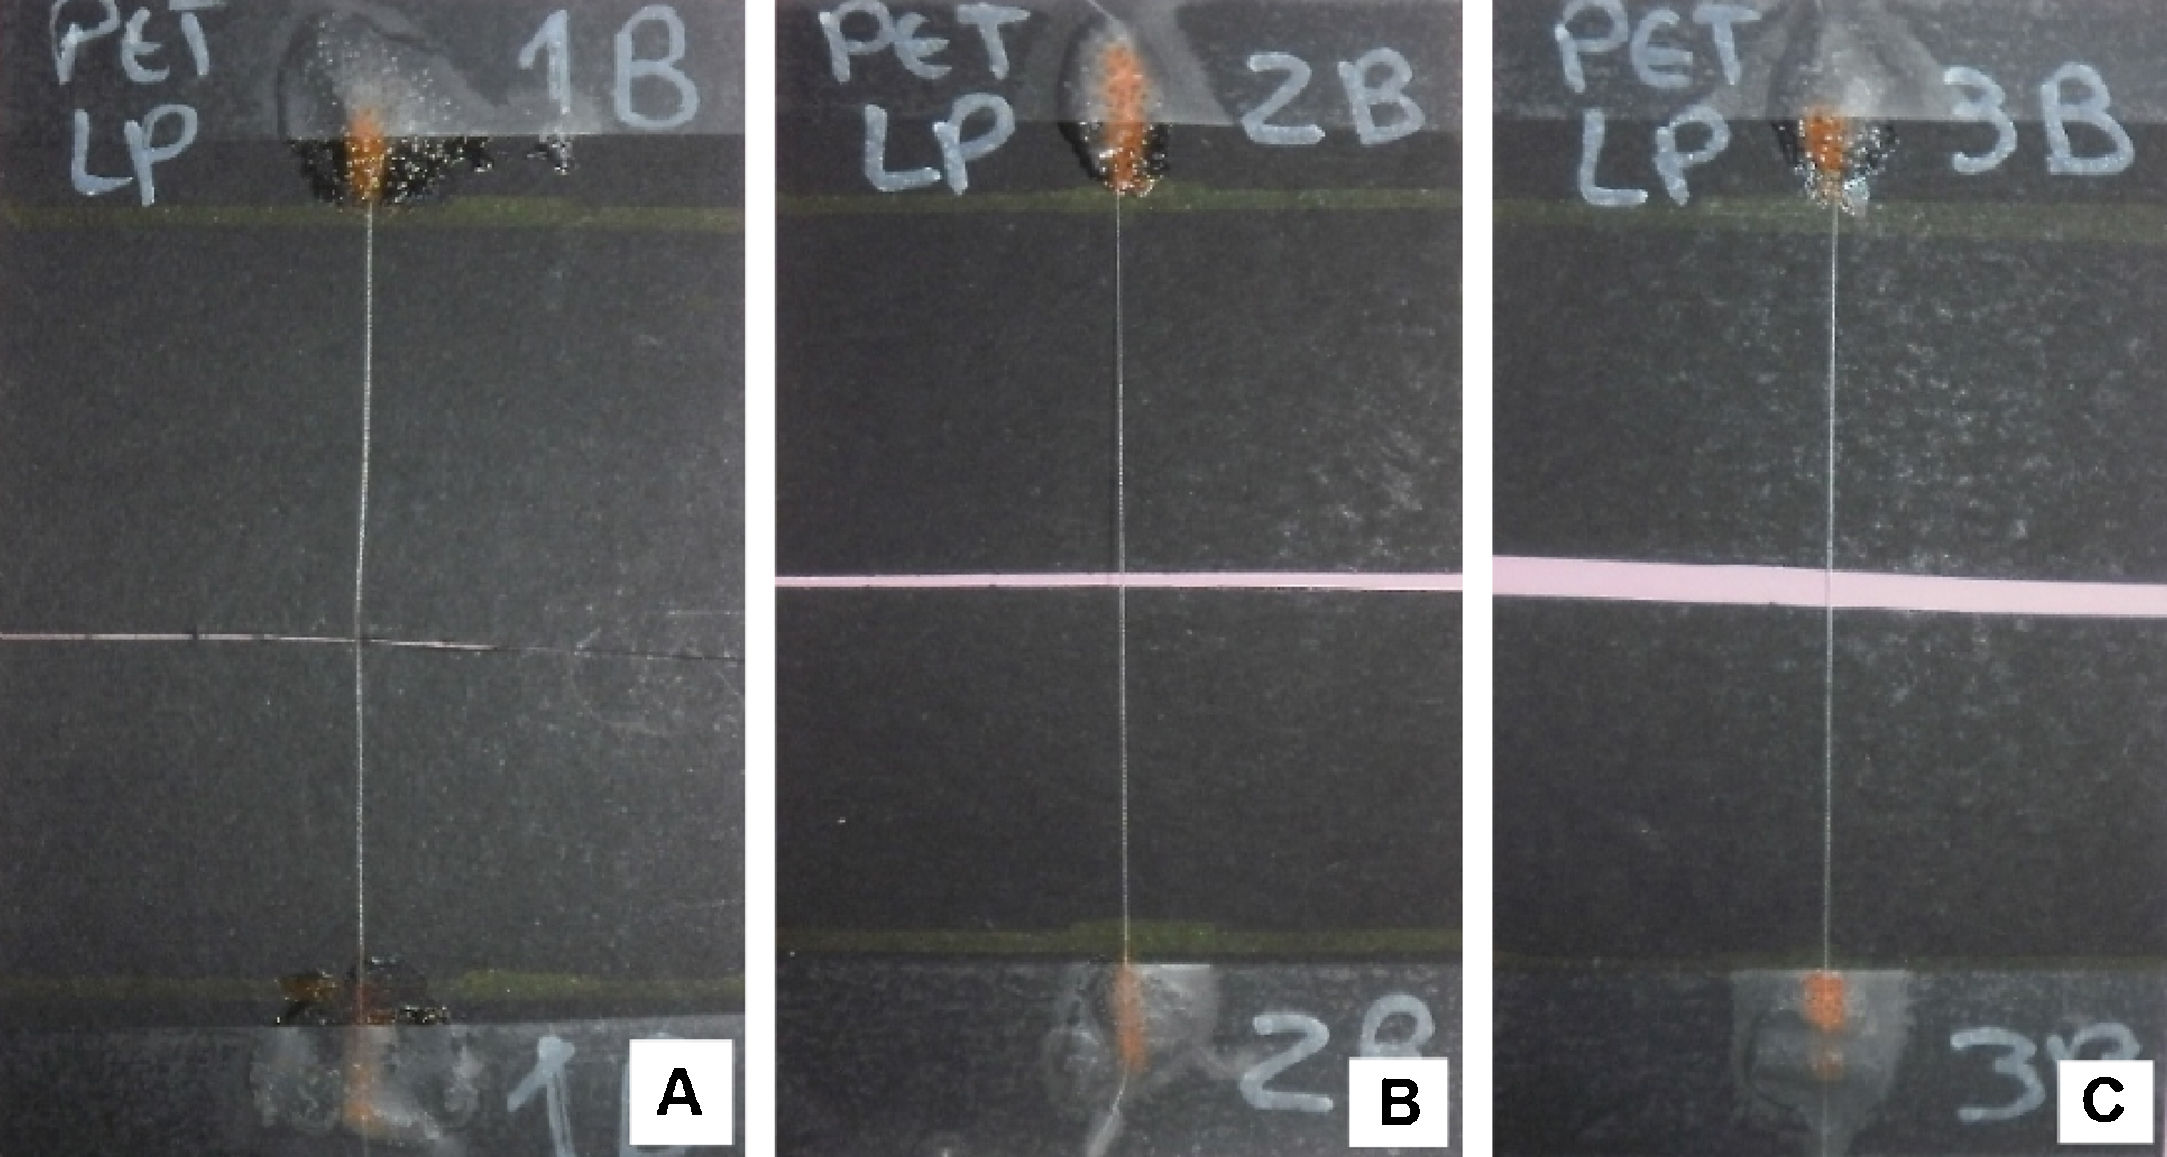
In literature, it is not consensual if zone 2 of the tensile curve corresponds yet to the elastic regime or is already in the plastic zone. To clarify this subject and as explained in Section 3.3, several samples of PET-LP yarns (taken form the longitudinal prosthesis direction) were loaded (and unloaded) until different stress levels, namely: 75MPa, 150MPa and 275MPa, which correspond to points in the zones 1, 2 and 3 of the graphic of Fig. 11-B. In Fig. 14 the samples after unloaded can be observed.

As can be observed in Fig. 14-A (σ=75MPa) no residual deformation is observed, confirming that in this level the fiber is in the elastic regime. In Fig. 14-B (σ=150MPa) and 14-C (σ=275MPa) it is observed that fibers exhibit a residual deformation, after unloading, confirming that the plastic regime was already achieved in zone 2. This observation confirms that the yield stress was well established as the intersection point between zones 1 and 2.
The same procedure was applied to PET yarns, both in the longitudinal and transversal prosthesis direction. After these tensile tests, all of these samples were evaluated by DSC to study the microstructure changes occurred due to the application of the tensile stresses.
4.2.2Tensile tests on textilesThe black dots marked in each specimen allowed the determination of the axial strains (ɛx) and transverse strains (ɛy). Since the Poisson coefficient is defined by ν=−ɛy/ɛx, from the strain measurements, obtained with the video extensometer (in the elastic zone), the Poisson coefficients were determined for the diverse textiles tested.
Samples taken with 45° to the prosthesis axis were also tested for determination of the transversal elastic modulus (G).
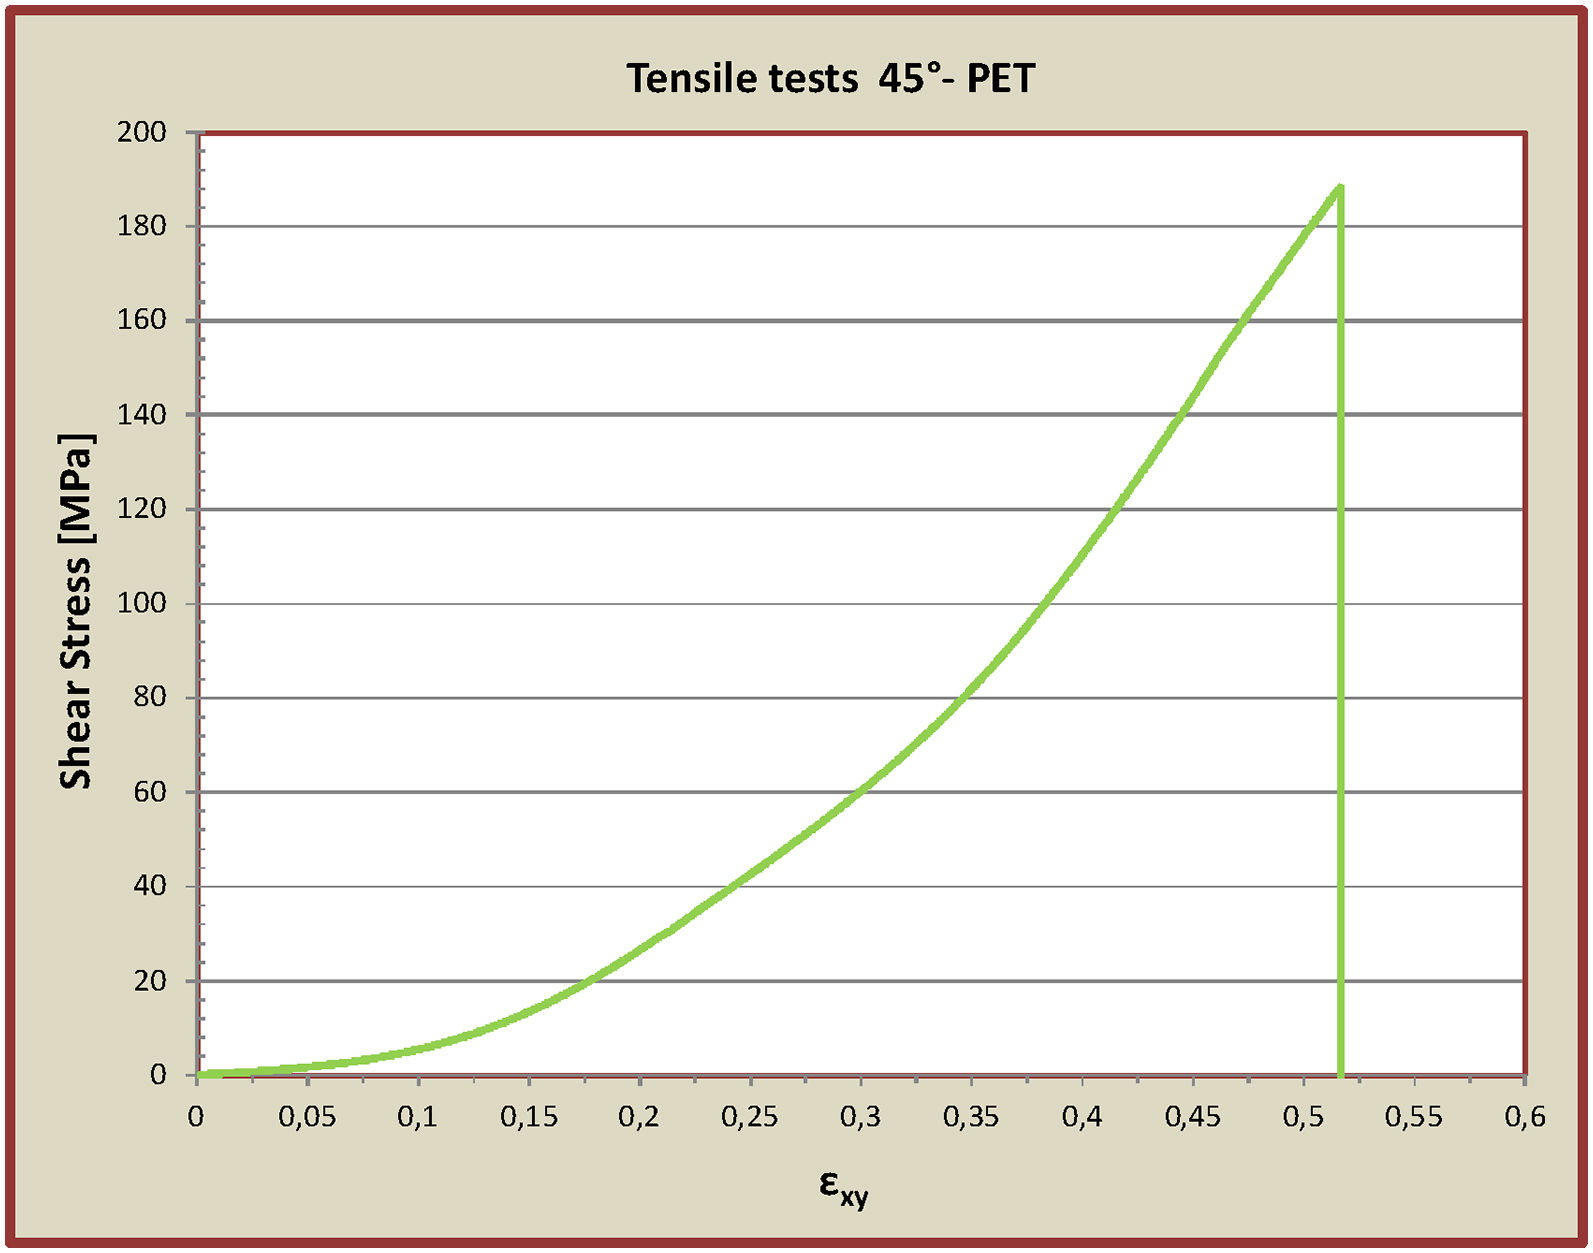
In Fig. 15 it can be seen two of the graphics obtained, with tensile stress plotted as function of the applied ɛx and ɛy, for PET and for PET-LP. In Fig. 16 it can be observed a graphic obtained for a specimen cut from the woven textile with 45° with the longitudinal axis. In this graphic the stress (τxy) is plotted against the applied strain (ɛxy). Since:

 plotted against shear strain (ɛxy) for a PET woven textile specimen taken with 45° with the longitudinal axis.")
Then, the graphic slope in the elastic zone is equal to 2G.
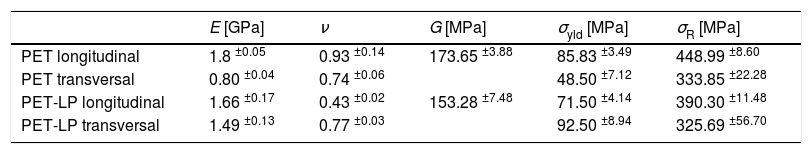
In Table 3 the average values obtained in all the experiments are presented.
Mechanical properties obtained in tensile tests for PET and PET-LP fabrics.
| E [GPa] | ν | G [MPa] | σyld [MPa] | σR [MPa] | |
|---|---|---|---|---|---|
| PET longitudinal | 1.8 ±0.05 | 0.93 ±0.14 | 173.65 ±3.88 | 85.83 ±3.49 | 448.99 ±8.60 |
| PET transversal | 0.80 ±0.04 | 0.74 ±0.06 | 48.50 ±7.12 | 333.85 ±22.28 | |
| PET-LP longitudinal | 1.66 ±0.17 | 0.43 ±0.02 | 153.28 ±7.48 | 71.50 ±4.14 | 390.30 ±11.48 |
| PET-LP transversal | 1.49 ±0.13 | 0.77 ±0.03 | 92.50 ±8.94 | 325.69 ±56.70 |
Analyzing Table 3 it can be seen that that PET textiles exhibited very distinct behavior in the 2 prosthesis directions, although yarns present similar geometry in both directions and the number of yarns per mm is similar (see Table 1). This anisotropic behavior was already observed when the fibers used for the textile production were tested. Also the entanglements number and friction at contact points will influence the properties in each direction.
On the other hand, PET-LP textiles present some anisotropy but in a lower degree. In this case the anisotropic behavior was already expected once the number of yarns in both directions is much different, although fibers present similar properties.
On woven fabrics the Poisson ratios depend of yarn properties and of the structural geometry of fabrics, being this parameter very important to determine for accurate prosthesis behavior modeling and for improve device design. The Poisson coefficient (ν) determined in the elastic domain, exhibit high values as expected for textiles, due to the rapid shrinkage of the samples in the transverse direction of loading. However PET textiles exhibited higher values then PET-LP textiles. PET-LP samples when loaded in the axial prosthesis direction showed a much lower Poisson ratio which is relevant for the current application and evidence the advantages of this kind of fabric.
The distinctive behavior of the textiles in the two prosthesis directions can also be attributed to other factors already mentioned in Section 4.2.1.
The folds observed in the transversal prosthesis direction create localized kinks on fibers giving rise to localized defects as mentioned earlier and observed in Fig. 13-B. It is observed that specimens in this direction present always a higher standard deviation in properties like yield strength and rupture strength, that could be attributed to these folds.
4.3DSC resultsThe specimens studied were subject to different stress levels and then unloaded as indicated in Section 4.2.1. The yarns tested were compared with yarns taken from the prosthesis without any external stress applied.
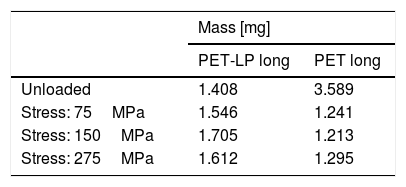
In order to have enough mass for analytical measurement, 8 longitudinal yarns of PET-LP were used for each DSC curve. Regarding PET yarns, 4 longitudinal were used. The yarns were cut in small pieces and placed at the bottom of the crucibles to increase the heat transfer. The mass of each material used during the tests is indicated in Table 4.
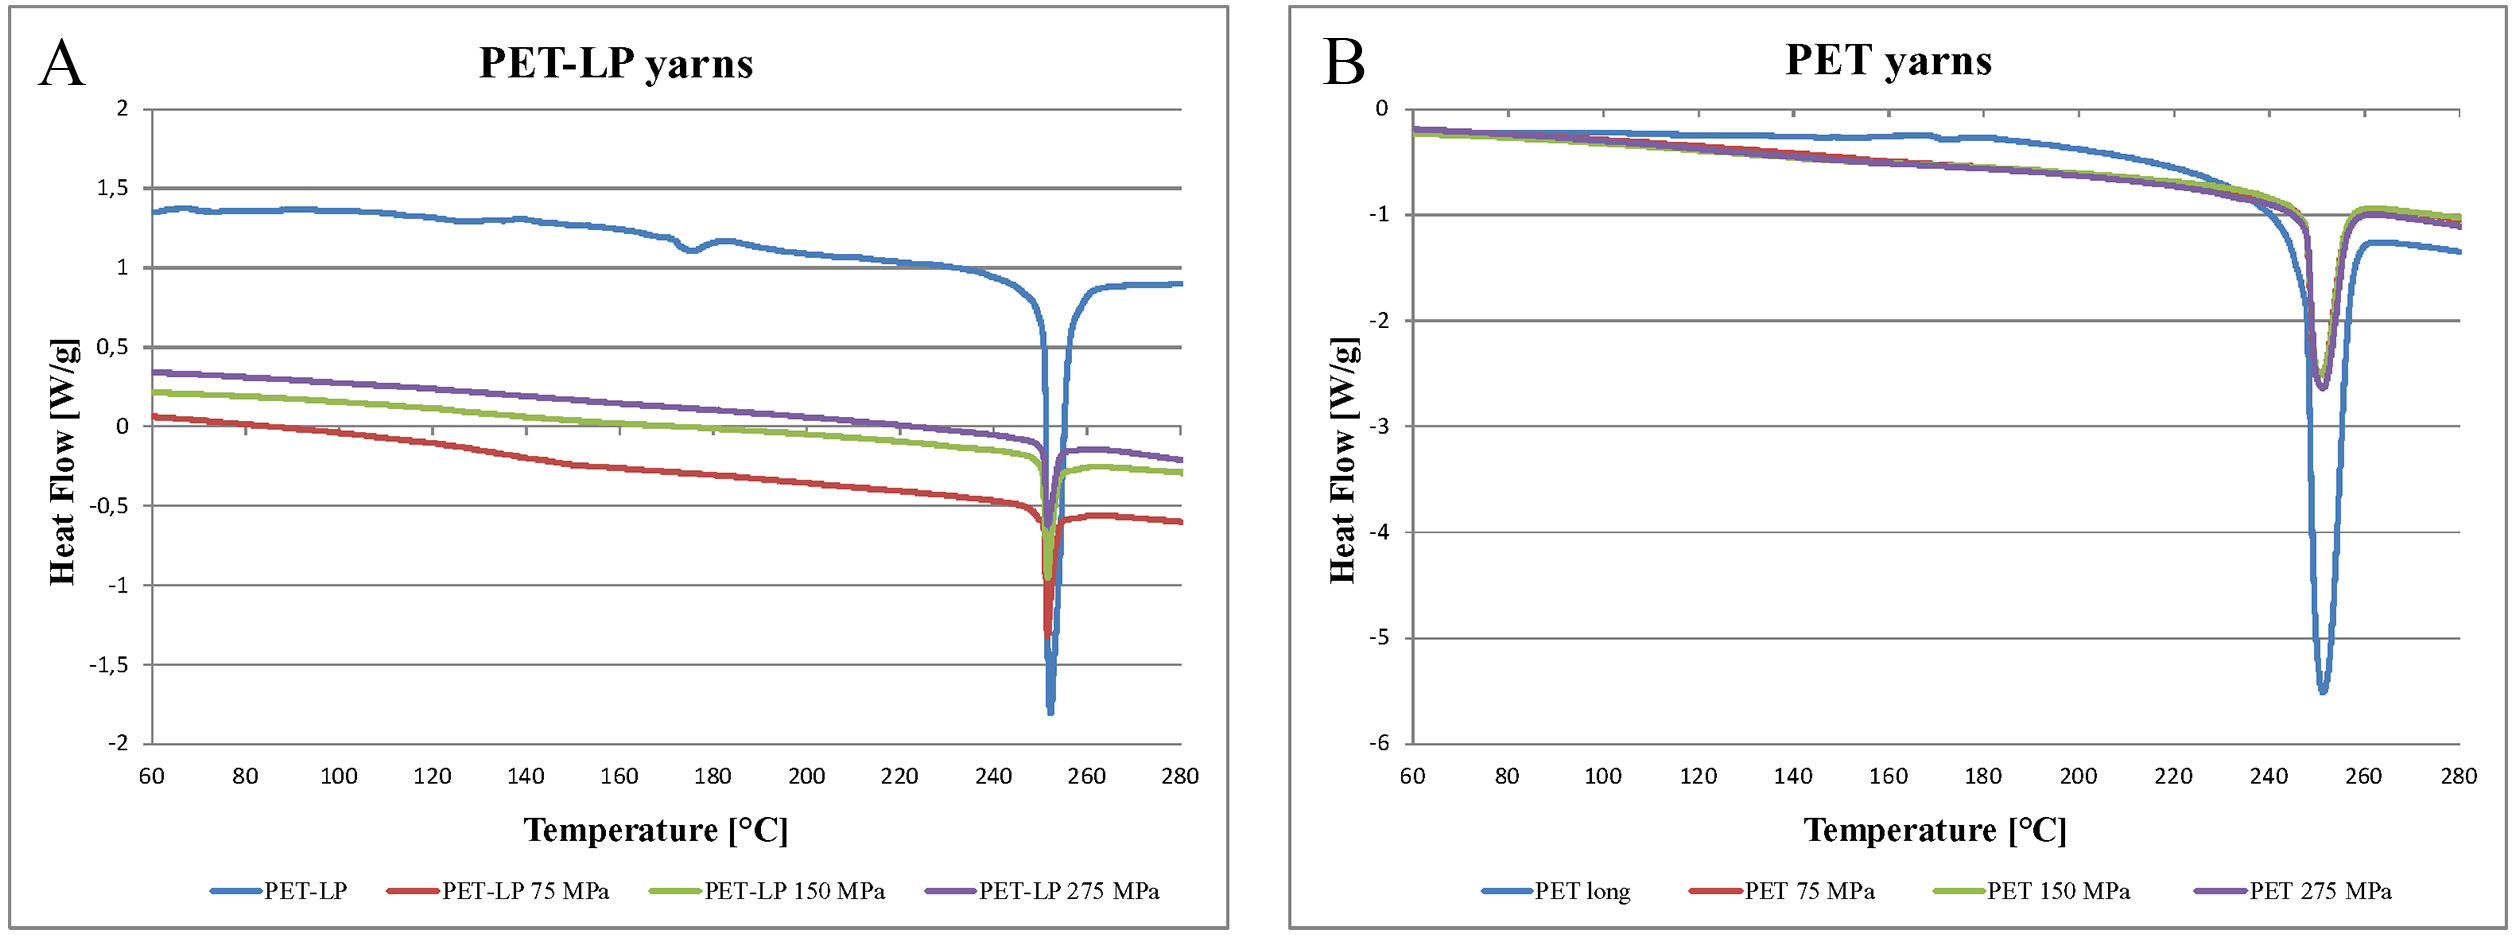
The DSC curves obtained, for PET and PET-LP longitudinal yarns, are presented in Fig. 17 A and B.
 of (A) PET-LP yarns and (B) PET yarns.")
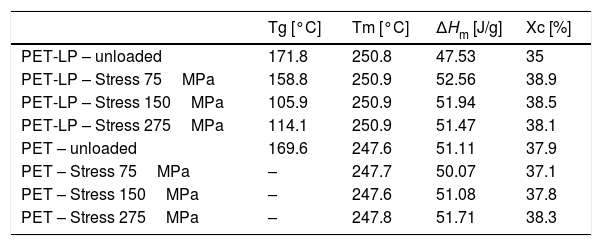
From the graphics of Fig. 17 it is possible to determine the glass transition temperature (Tg) and the melting temperature (Tm) for the several yarns tested. From the area of the melting peak, the melting enthalpy (ΔHm) is calculated and based on equation 1 the crystallinity ratio (Xc) is estimated (Table 5).
DSC results for PET and PET-LP yarns.
| Tg [°C] | Tm [°C] | ΔHm [J/g] | Xc [%] | |
|---|---|---|---|---|
| PET-LP – unloaded | 171.8 | 250.8 | 47.53 | 35 |
| PET-LP – Stress 75MPa | 158.8 | 250.9 | 52.56 | 38.9 |
| PET-LP – Stress 150MPa | 105.9 | 250.9 | 51.94 | 38.5 |
| PET-LP – Stress 275MPa | 114.1 | 250.9 | 51.47 | 38.1 |
| PET – unloaded | 169.6 | 247.6 | 51.11 | 37.9 |
| PET – Stress 75MPa | – | 247.7 | 50.07 | 37.1 |
| PET – Stress 150MPa | – | 247.6 | 51.08 | 37.8 |
| PET – Stress 275MPa | – | 247.8 | 51.71 | 38.3 |
If we compare the glass transition temperature measured (≅171°C) of unloaded fibers, with the one of the amorphous bulk material (Tg around 80°C, Tc around 137°C and Tm around 227°C [12]) we see that it increase substantially. This observation it is in accordance with the expected once the glass transition temperature should increase as the degree of crystallinity increases, due to stronger molecular bonds. Beside this, crystalline blocks (crystallites) rigidify the material, which is the case of thermoplastic fibers. On the other hand, some authors found that the fibers melting temperature also increases when fibers are subjected to tension. This raise it is attributed to the increase of orientation of the amorphous phase [30]. However in our experiments the melting temperature was nearly the same, although higher than the one found for amorphous PET in literature. Some studies [31] indicate that the melting temperature of a 100% crystalline PET is about 280°C which is higher than the one measured in our experiments (around 250°C). The fact of the PET fibers analyzed in this study are not completely crystalline is confirmed by the crystallinity ratio measured, which was between 35% and 38.9%. Despite that, the melting temperature of all samples was almost constant, the melting enthalpy increased slightly in some cases, which indicates a small increase of the crystallinity ratio (Xc) after the tensile load application. However the maximum strain attained during load application, was reduced for a polymer material (maximum 35%) which can explain the low degree of crystallinity increase. The melting temperature measured was between the values of amorphous PET and high crystalline PET which agrees with the fact that the fibers crystallinity was between 35% and 38%. Also, the fact that the degree of crystallinity did not increase much during tension tests (max 3.1%) explains why the melting temperature did not vary. Some authors measured different melting temperatures, however it must be taking in considerations that some additives and fabrication parameters change this property, which make difficult compare PET fibers from different sources [32].
According to some studies [33], when the amount of crystalline phase is small, two amorphous phases with differentiated conformational mobility and consequently two distinct glass transition processes can be observed. Some authors [34,35] reported that when the degree of crystallinity (Xc) was within a definite range, there were dual amorphous phases with quite different chain segmental mobility: free amorphous phase with higher mobility and constrained amorphous phase with lower mobility. The conformational mobility of the polymer chains in the amorphous phase of a semi-crystalline polymer is restricted in the proximity of crystalline blocks, as consequence Tg depends of the crystalline fractions and its microstructure. Alves et al. [36] found double peaks in DSC analysis of low crystallinity samples revealing two amorphous phases, in annealed samples, as a consequence of two different relaxation processes.
In the current study, contrarily to the expected, the glass transition temperature decreased or became undetectable when compared with the unload yarns. The PET-LP yarns with 75MPa stress (elastic regime) present a mild reduction on Tg, but the yarns loaded with higher stresses showed a pronounced reduction of Tg. Besides, the Tg event in those yarns is larger, indicating that two different events next to each other, can be present, corresponding to two distinct amorphous phases in the material, as reported in other studies [36].
The specimens were loaded, unloaded and let rest free before the DSC analyses. This gave time to molecular recovery and relaxation phenomenon's. These chain rearrangements are easier to occur in the amorphous phases, namely in the mesamorphous and in the amorphous oriented phase between crystalline blocks. This recovery it's not equal in both phases and can give rise to the appearance of two Tg events, next to each other, corresponding to each one of the phases mentioned.
In some samples Tg it was not detected. This result reveals that the isotropic amorphous zone is considerably restricted between the crystalline blocks and the amorphous orientated phase, making the glass transition phenomenon undetectable, at least by DSC.
5ConclusionsIn the current study two kind of polyethylene terephthalate fibers and two woven textiles, taken from stent-grafts used for endovascular surgery were analyzed. Tensile tests done using a non-contact video extensometer, in conjunction with yarn image analysis, allowed precise strain measurements and accurate properties determination.
Traditional tensile tests of fibers and textiles don’t yield reliable data regarding the mechanical strength and stiffness of those materials. The fibers are normally too thin to observe and very delicate to handle when placing them in grips, requiring special care and devices. Beside, usually due to small fiber dimensions traditional strain measurements devices can’t be used and stress can’t be calculated once the fiber diameter it isn’t well defined neither the number of yarns (per mm) in a fabric. Many studies present load/displacement curves, which limits the determination of some mechanical properties. Using SEM coupled with image analysis of the fibers cross sections, stress (during tests) can be calculated and using non-contact video extensometry, strain can be measured. These two techniques together allow determining stress/strain curves, both for fibers and textiles, allowing a much more accurate measurement of stiffness and strength for fibers and fabrics.
These measurements are important for future performance analyses by FEM and for defining improvements in materials selection and devices design, mainly in high performance devices for biomedical application.
Fibers were taken from the longitudinal and transversal directions of the stent-graft devices. PET yarns presented 3 different slopes during deformation and PET-LP specimens present four different slopes during deformation (both in longitudinal and transversal directions).
The fibers tested exhibited elastic modulus between 2.2 and 2.9GPa and strengths between 400 and 470MPa. The yarns which exhibited higher elastic modulus were PET transversal yarns, which also exhibited the lowest rupture strain. PET longitudinal yarns presented the higher strength. Several surface defects were observed in some fibers, mainly near folds areas, which contribute to lower tensile strength of some yarns and high dispersion of results.
Also, the tensile properties of the woven textiles were evaluated in the axial and transversal direction and with 45° with the longitudinal prosthesis axis. It was observed that the textiles of PET and PET-LP exhibit very distinct properties and PET textiles present a strong anisotropic behavior and high Poisson coefficients. The woven textiles tested exhibited elastic modulus between 0.8 and 1.8GPa and strengths between 325 and 450MPa. PET textiles presented higher tensile strengths compared with PET-LP, although during wear tests (done previously) PET-LP presented a much better behavior.
It was observed an anisotropic behavior on PET-LP textiles which was already expected once the number of yarns in both directions is different. PET textiles also exhibit a distinct behavior in the 2 prosthesis directions, although yarns present similar geometry in both directions and the number of yarns per mm is similar, however the entanglements number and friction at contact points will influence the properties in each direction.
These results evidence that the performance of these kind of textiles devices is not only controlled by the material properties but also by the yarn dimension, geometry and textile weave, thus Finite Elements Modeling should be developed at a lower scale analyzing yarn interactions before macroscopic analysis. Also, several models consider that textiles on stent grafts have an isotropic behavior which it is not real. The technique of non-contact video extensometry allied with image analysis can be used to obtain more accurate properties that can be used in future stent graft models.
Regarding DSC results, a glass transition temperature around 171°C was measured, which is higher than the one found in literature for the amorphous bulk material (around 80°C). This observation it is in accordance with the expected once fibers have some cristallinity and the glass transition temperature should increase as the degree of crystallinity increases, due to stronger molecular bonds.
The fibers crystallinity ratio (Xc) measured varied between 35% (for unloaded PET-LP samples) until 38.9%. This results show that the cristalinity increased for PET-LP fibers, due to loading. For PET samples the differences in crystallinity ratio, between un-loaded and loaded samples, were not meaningful.
This work was developed under a research Project found by FCT, ref: MIT-Pt/EDAM-EMD/0007/2008.
The authors would like to acknowledge the support and expert assistance of Dr. Duarte Medeiros from Egas Monis Hospital, to Cook Europe for the materials supply and to Henrique Alves for the illustrations.
