

The knowledge of the characteristics and behavior of the composite material is of great importance, bearing in mind of its wide application besides serving as a parameter for identification of possible problems caused by material degradation, avoiding that greater damages could irreversibly damage the composite. In this way, the present work makes an analysis of the mechanisms of failure of the polymeric composite PMMA (polymethylmethacrylate) reinforced with fiberglass. And, using experimental data obtained in the laboratory and simulating the behavior of the material in the software Abaqus through the implementation of the tool XFEM (Xtended Finite Elements Mode) in Loading Mode I, which analyzes fissures generated by fields of discontinuities without the need to constantly update the mesh, allowing to observe the critical stresses acting on the fiber/matrix interface.
Composite materials have existed since the beginnings of mankind, being continuously improved so as to provide an improved combination of the characteristics of its constituents. These materials have been widely used in a wide range of areas, including civil construction, being necessary an in-depth study of its characteristics.
A detailed understanding of the material fracture requires knowledge of damage mechanics, for being a resource used to study the degradation of the material through the analysis of microcracks that arise due to the action of external forces.
The present work makes an analysis of the composite failure process polymethylmethacrylate – PMMA reinforced with E-glass fiber, in the crack Loading Mode I, through numerical simulations using the Xtended Finite Elements Mode (XFEM), observing the behavior of the critical stresses acting on the fiber/matrix interface.
In this way, it was possible to carry out a more precise analysis, since the modeling of fractures in materials using XFEM is independent of the mesh geometry, and there is no need for its constant updating as the crack propagates.
For validation of the form model were used experimental data found in the literature, a research that evaluated the regime of damage of the composite that has as a matrix the polymethylmethacrylate – PMMA, being reinforced with fiberglass through a mathematical model for normal stress, considering the damage. The element damage process is critical for analysis, in view of which precedes the failure which will occur in the material when subjected to the utilization efforts [1].
As a way to simplify the analysis of composite behavior during fracture, was used the microstructure of the material, which understands its physical characteristics taking into account its form of organization (arrangement of fiber and matrix). In addition, it was considered that the force applied on the composite also divides between its microstructures, assuming that the deformation suffered by the matrix will always be equal to the deformation suffered by the fiber, ensuring a homogeneous behavior of the composite.
Thus, with the observation of a material element/microstructure it was possible to predict the composite behavior as a whole, since the analyzed element presents the same characteristics of the rest of the material.
1.1ObjectivesTo analyze the behavior during fracture of the polymeric composite – PMMA reinforced with E-glass fiber through the Extended Finite Elements Method (XFEM), using the software Abaqus and compare the results obtained computationally by Sales [2] with those obtained experimentally in traction tests by Marcelo Júnior [1].
1.2JustificationTo deepen the studies on the fracturing of composite materials involving computational simulations through the application of the Extended Finite Element Method.
2Materials and methodsIn the research conducted by Marcelo Júnior [1] was used as material a polymeric core of high tension insulators, formed by an epoxy matrix reinforced with fiberglass.
As a way to make a deep composite analysis during the fracture process was carried out a series of procedures, starting with the characterization of the material used for its composition and physical properties, as well as the preparation of polymer films. Then, were realized thermal and solubility analyzes of the films obtained, besides the analysis of spectroscopy in the infrared region, as a way to relate the composite solubility with the content of acrylic components found in the samples. Lastly, was made the thermogravimetric analysis – TGA, which studies the variations in the material mass due to its heating and differential scanning calorimeter – DSC, method used to quantify the energy involved in the reactions.
After the thermal and solubility analyzes, the material mechanical characterization was carried out through the tensile tests, with the purpose of evaluating the composite mechanical strength. Afterwards, was made a metallographic analysis, allowing the materials constitution study and their structural characteristics, making possible a relation with its physical and chemical properties.
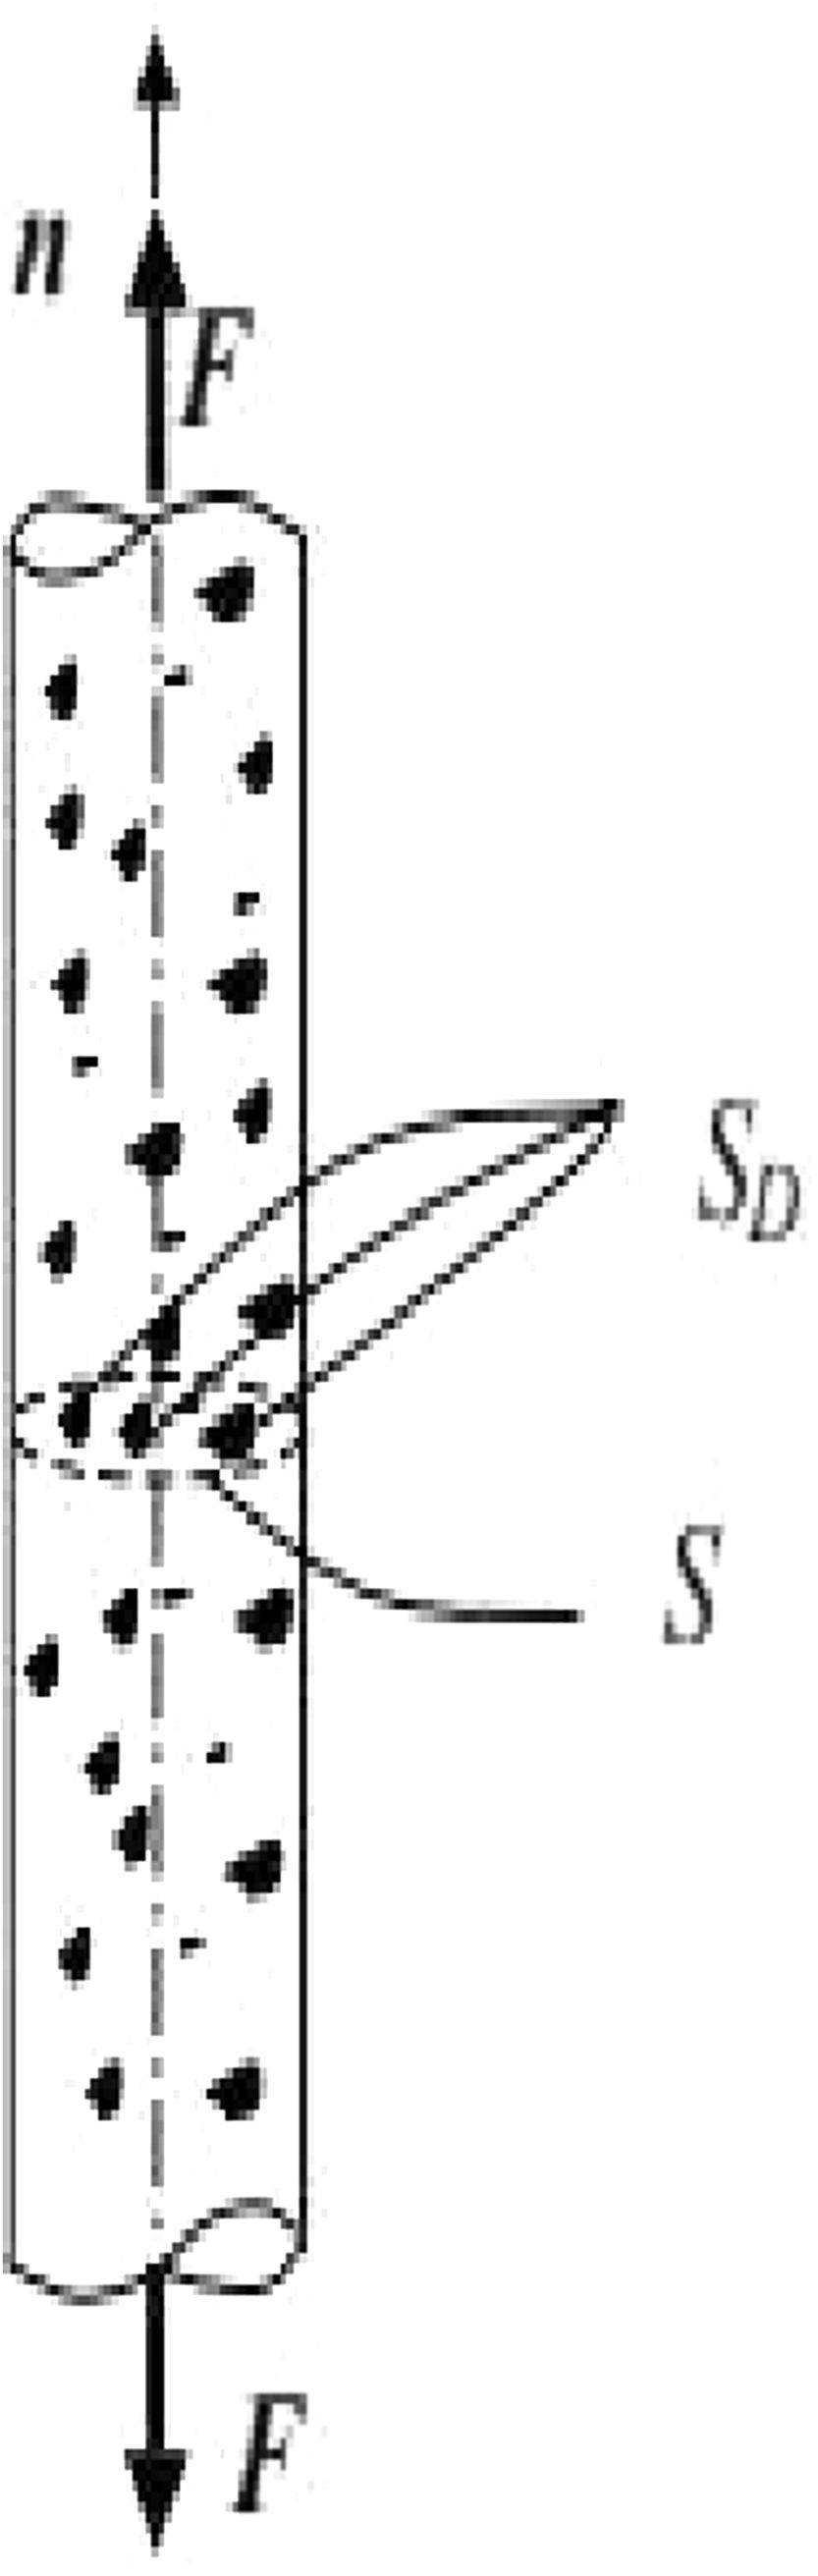
3Theoretical framework3.1Continuous damage mechanicsAccording [3], if the Fig. 1 volume is loaded with a force
the tension is typically defined as:

The above equation represents the tension acting on the surface [3,4].
Knowing that the element region (S) which is subjected to an external force, presents regions with microdefects (SD), surface endowed with the damage variable, only part of its surface will effectively withstand the applied load (S−SD), being the tension acting on the surface considered (σe), given by:
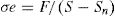
Adopting the damage variable, D=SD/S, in Eq. (2) we have:

When the damaging material is subjected to compression, the microdebts end up compressing themselves in such a way that they will behave like a material without any imperfection, even if the damage does not cease to exist, thus, the surface that resists the applied load becomes larger than the region that does not withstand effectively the loading.
According to Kachanov [4], if the damage is isotropic, that is, to present the same characteristics in all directions considered, the damage variable (D) will not depend on the normal, being a scalar variable:

The mechanics of continuous damage study the progressive degradation of the material, considering the forces acting on the element, as well as its modulus of elasticity, mechanical resistance and stiffness. In this way, the damage mechanics analyzes the reduction of the mechanical properties of the solid due to external actions and already existing microdefects, contributing to the appearance of microcracks, which in great quantity evolve to fissures, being able to propagate and originate cracks that occasionally lead to degradation partial or total of the material, based on [5,6].
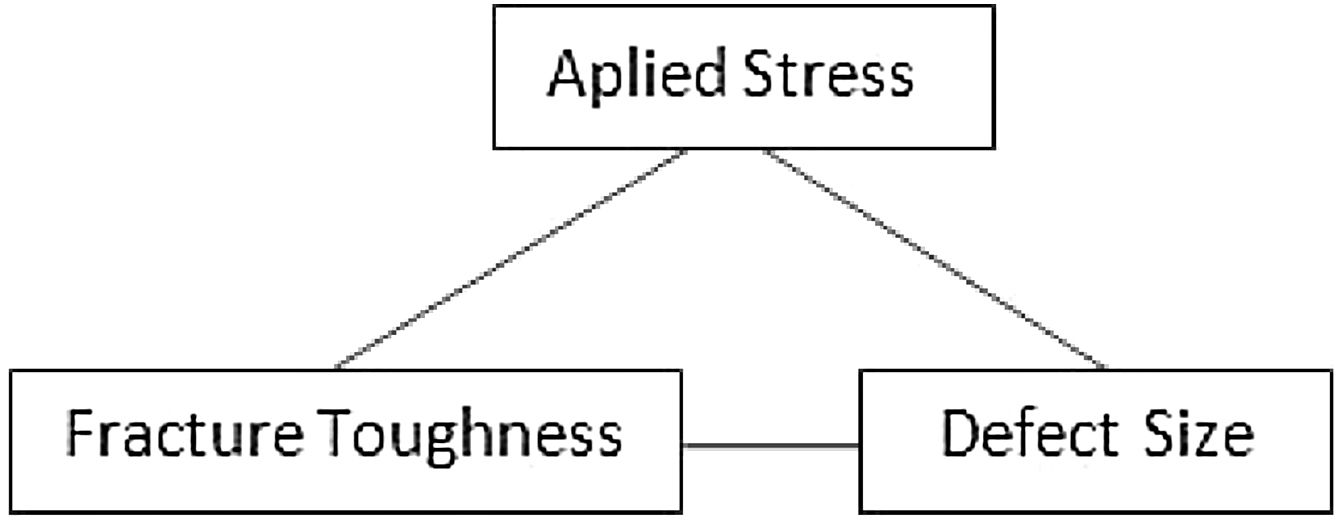
3.2Fracture mechanicsAll the materials are capable of presenting imperfections that lead to the appearance of cracks and evolve to the rupture of the material, therefore, it is extremely important to know the characteristics of the material as to its strength and rupture mode, so that great damages and even the occurrence of accidents are avoided. Fracture mechanics aims to study the behavior of cracked materials, seeking to understand the reason for the rupture of some materials even before they reach their characteristic resistance.
The fracture mechanics is based on three variables that are directly related as shown below.
The fracture mechanics allows a better understanding of the appearance and evolution of the fracture in materials, being able to be ductile or fragile and starting with the formation of a small crack that begins to propagate in the material. According [8], the materials can be classified and studied for their ductility, ability to withstand deformation until its rupture, being directly related to the modulus of elasticity (E) that is characteristic of each material. Therefore, the materials are divided into two classes according to their ductility: ductile and brittle.
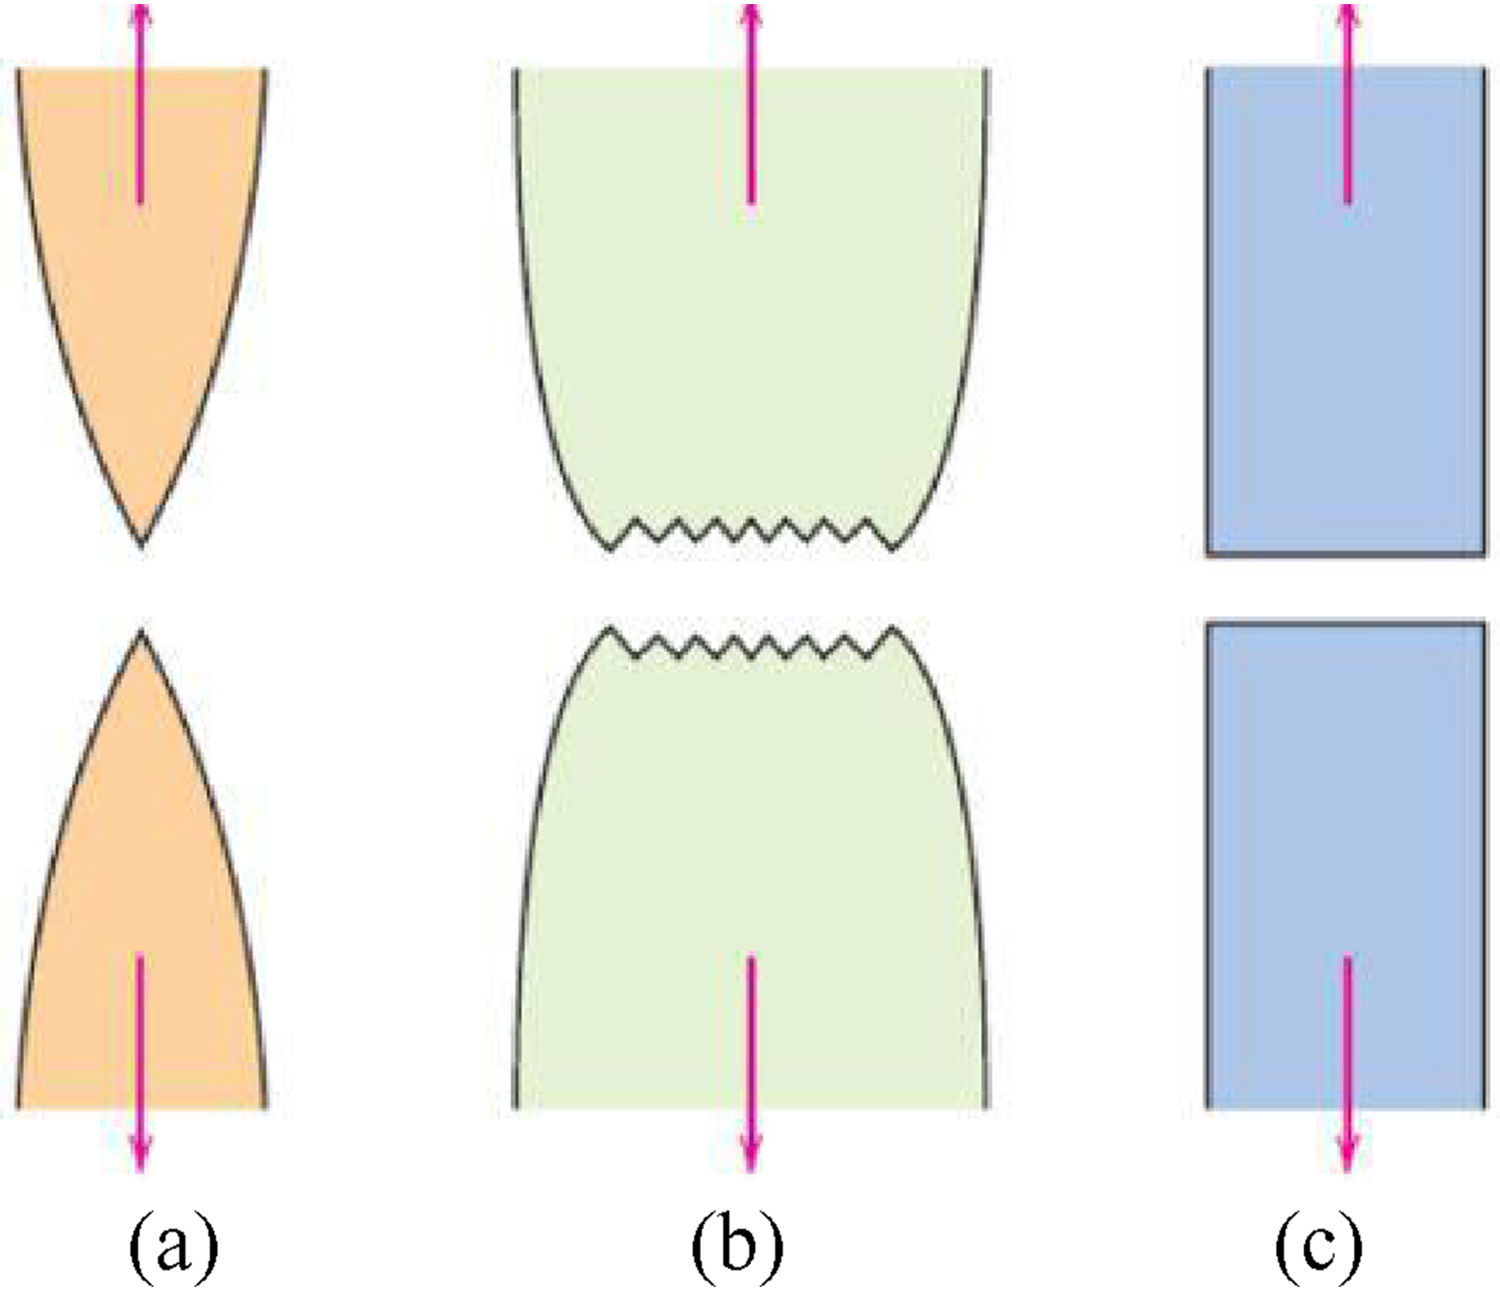
It is worth noting that brittle fractures tend to cause rapid crack propagation due to their small deformation capacity, while the ductile fractures have high plastic deformations around the crack causing their propagation to occur slowly since the material has high modulus of elasticity (E). The behavior of the brittle and ductile fractures described above is represented by the image below.
3.2.1Griffith's theoryGriffth's theory also called fragile fracture theory established a relationship between fracture stress and crack size, which became known as Griffith's energy balance. From the relationship established by the Griffth's theory originated the fracture mechanics, also showing that the fragile materials have submicroscopic defects, working as stress concentrators that act on the material areas that have microcracks, minimal defects present in the material structure.
Thus, the stress concentration in the defective regions of the material initiates fracture, since the increase in the value of the surface active charge is higher than the stress supported by the atomic bonds. This phenomenon can cause the propagation of cracks that can evolve into cracks and lead to the material rupture.
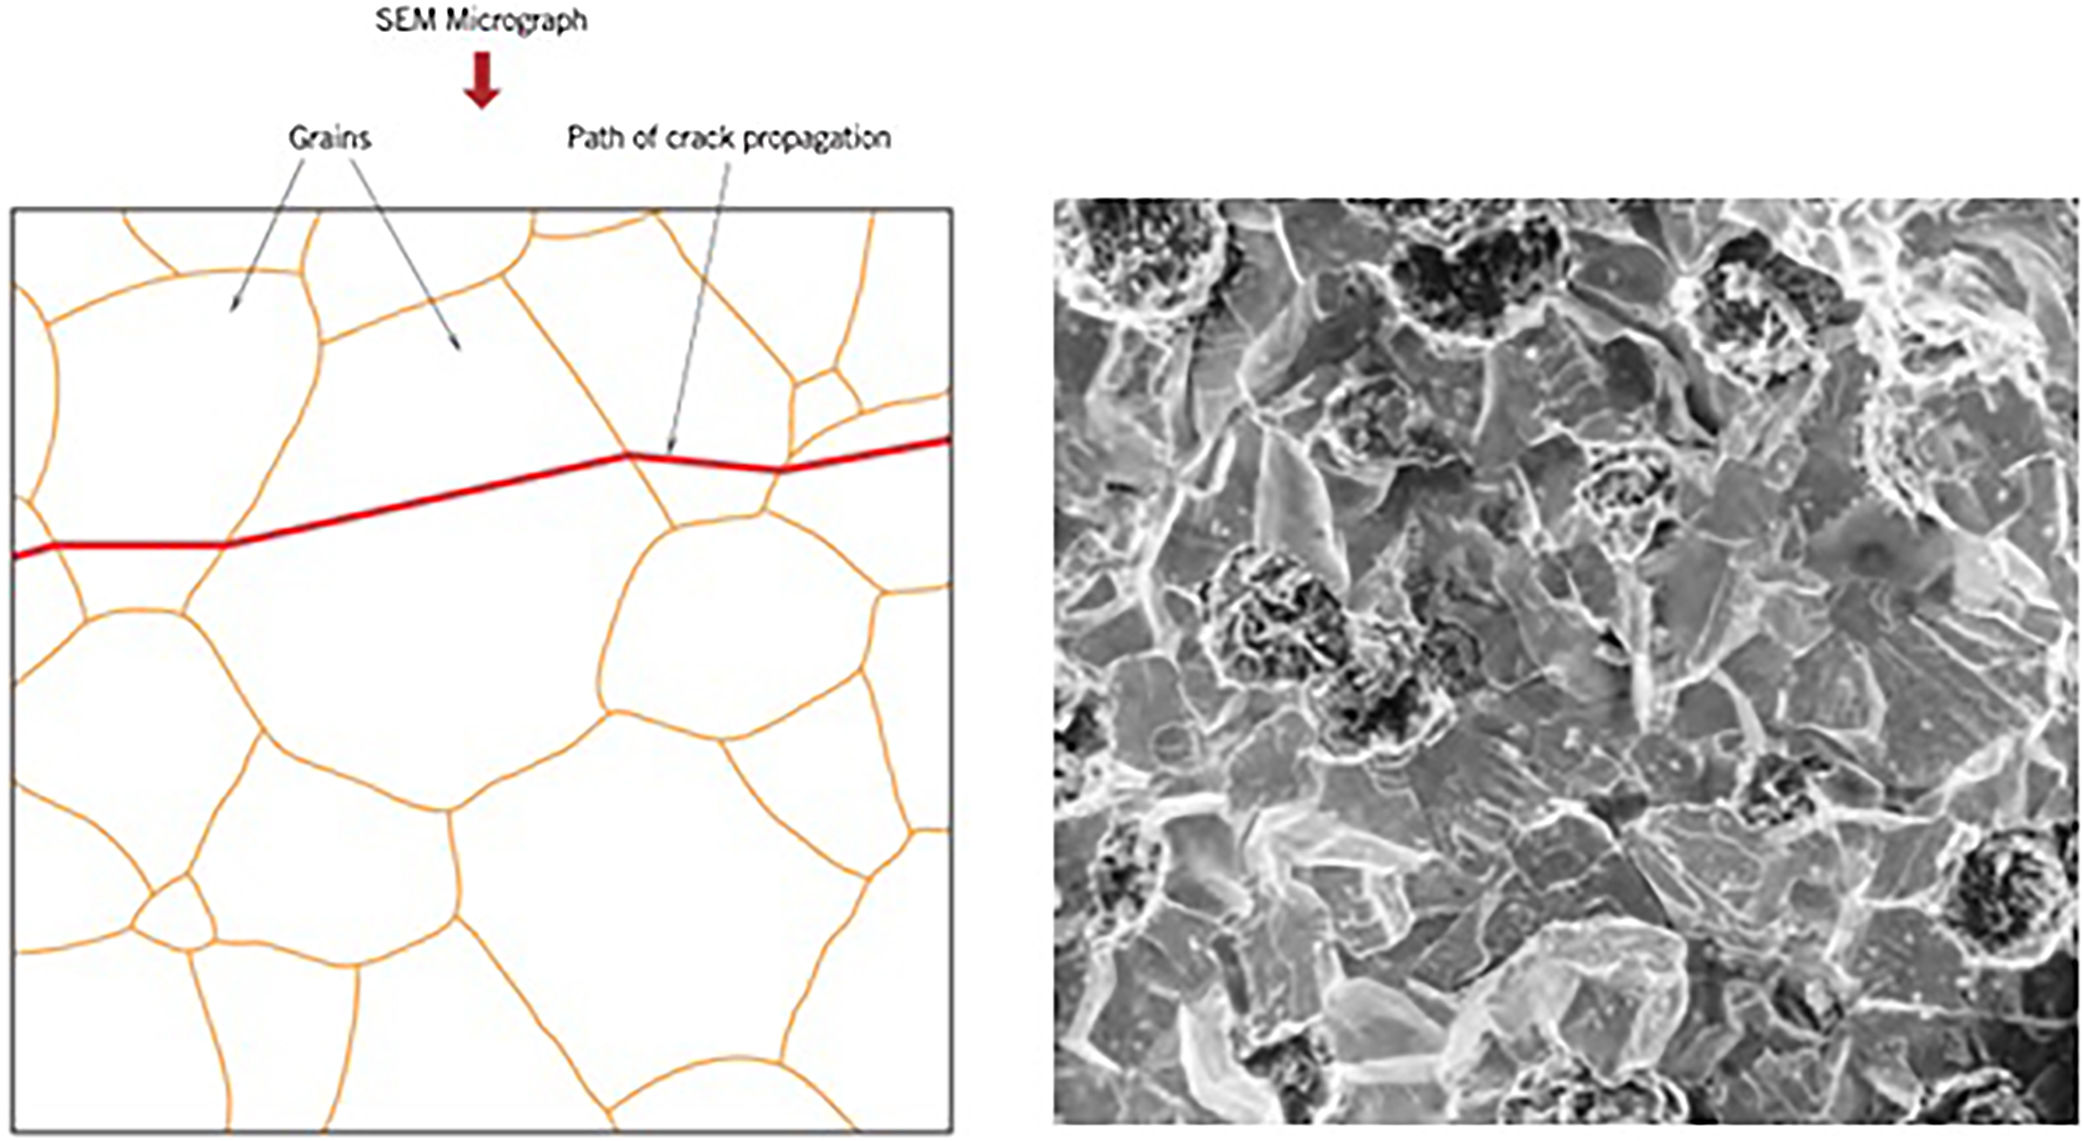
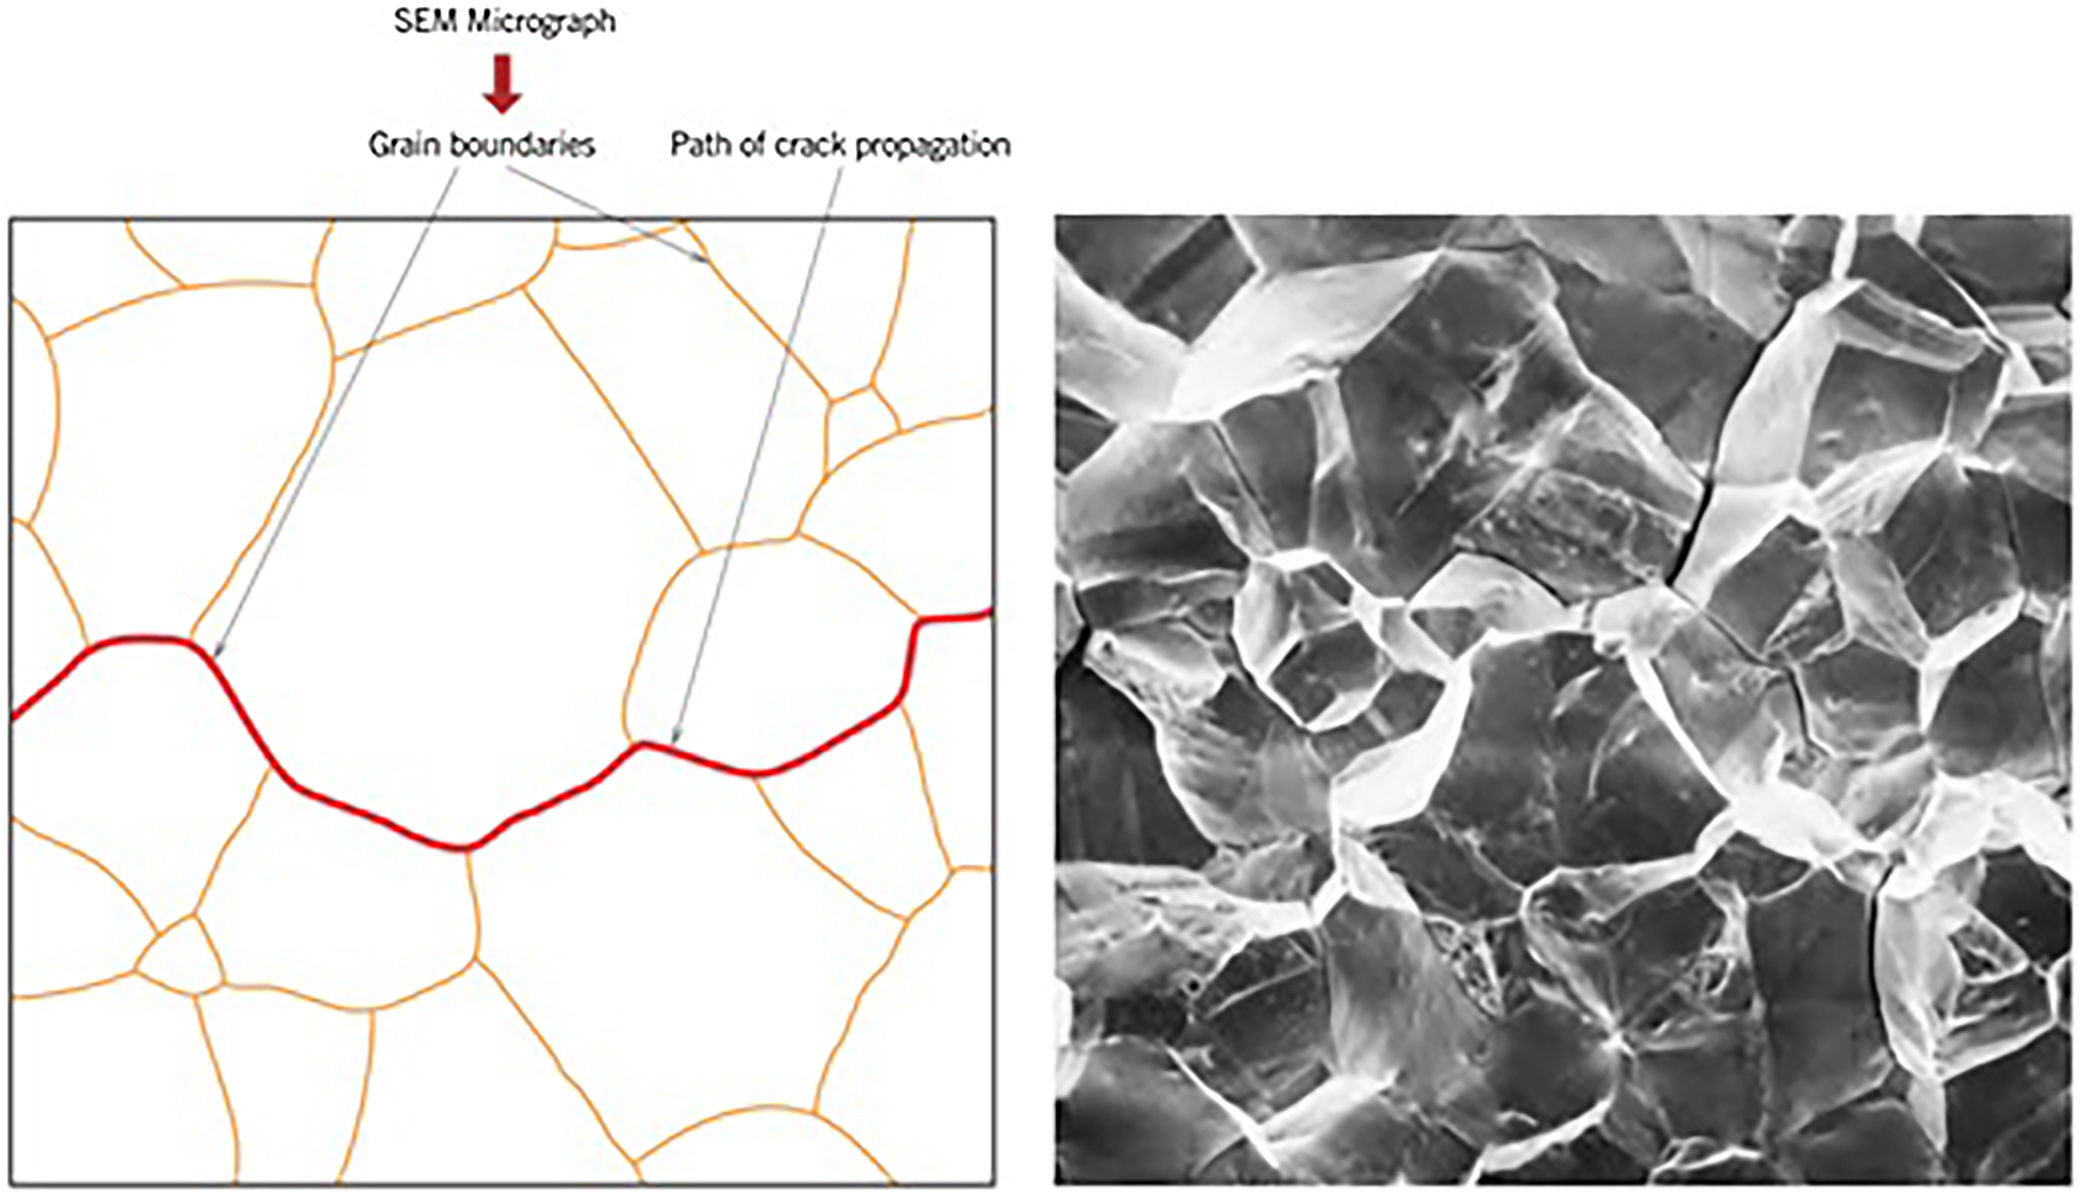
In accordance with the principles of fracture mechanics, the propagation of cracks in fragile materials is generally due to cleavage. It may be transgranular or intergranular as shown in the following figures (Figs. 2–19).

 Highly ductile fracture where the specimen is tightened to a single point. (b) Moderately ductile fracture after some strictness. (c) Fragile fracture without any plastic deformation.")
(a) Highly ductile fracture where the specimen is tightened to a single point. (b) Moderately ductile fracture after some strictness. (c) Fragile fracture without any plastic deformation.
 Schematic profile of a cross section showing the crack propagation through the interior of a transgranular fracture grains. (b) Scanning eletron fractography of a modular cast iron showing a transgranular fracture surface. Unknown magnification.")
(a) Schematic profile of a cross section showing the crack propagation through the interior of a transgranular fracture grains. (b) Scanning eletron fractography of a modular cast iron showing a transgranular fracture surface. Unknown magnification.
 Schematic profile of a cross section shown the crack propagation along the grain contours in an intergranular fracture. (b) Scanning eletron fractography showing an intergranular fracture surface. Unknown magnification.")
(a) Schematic profile of a cross section shown the crack propagation along the grain contours in an intergranular fracture. (b) Scanning eletron fractography showing an intergranular fracture surface. Unknown magnification.
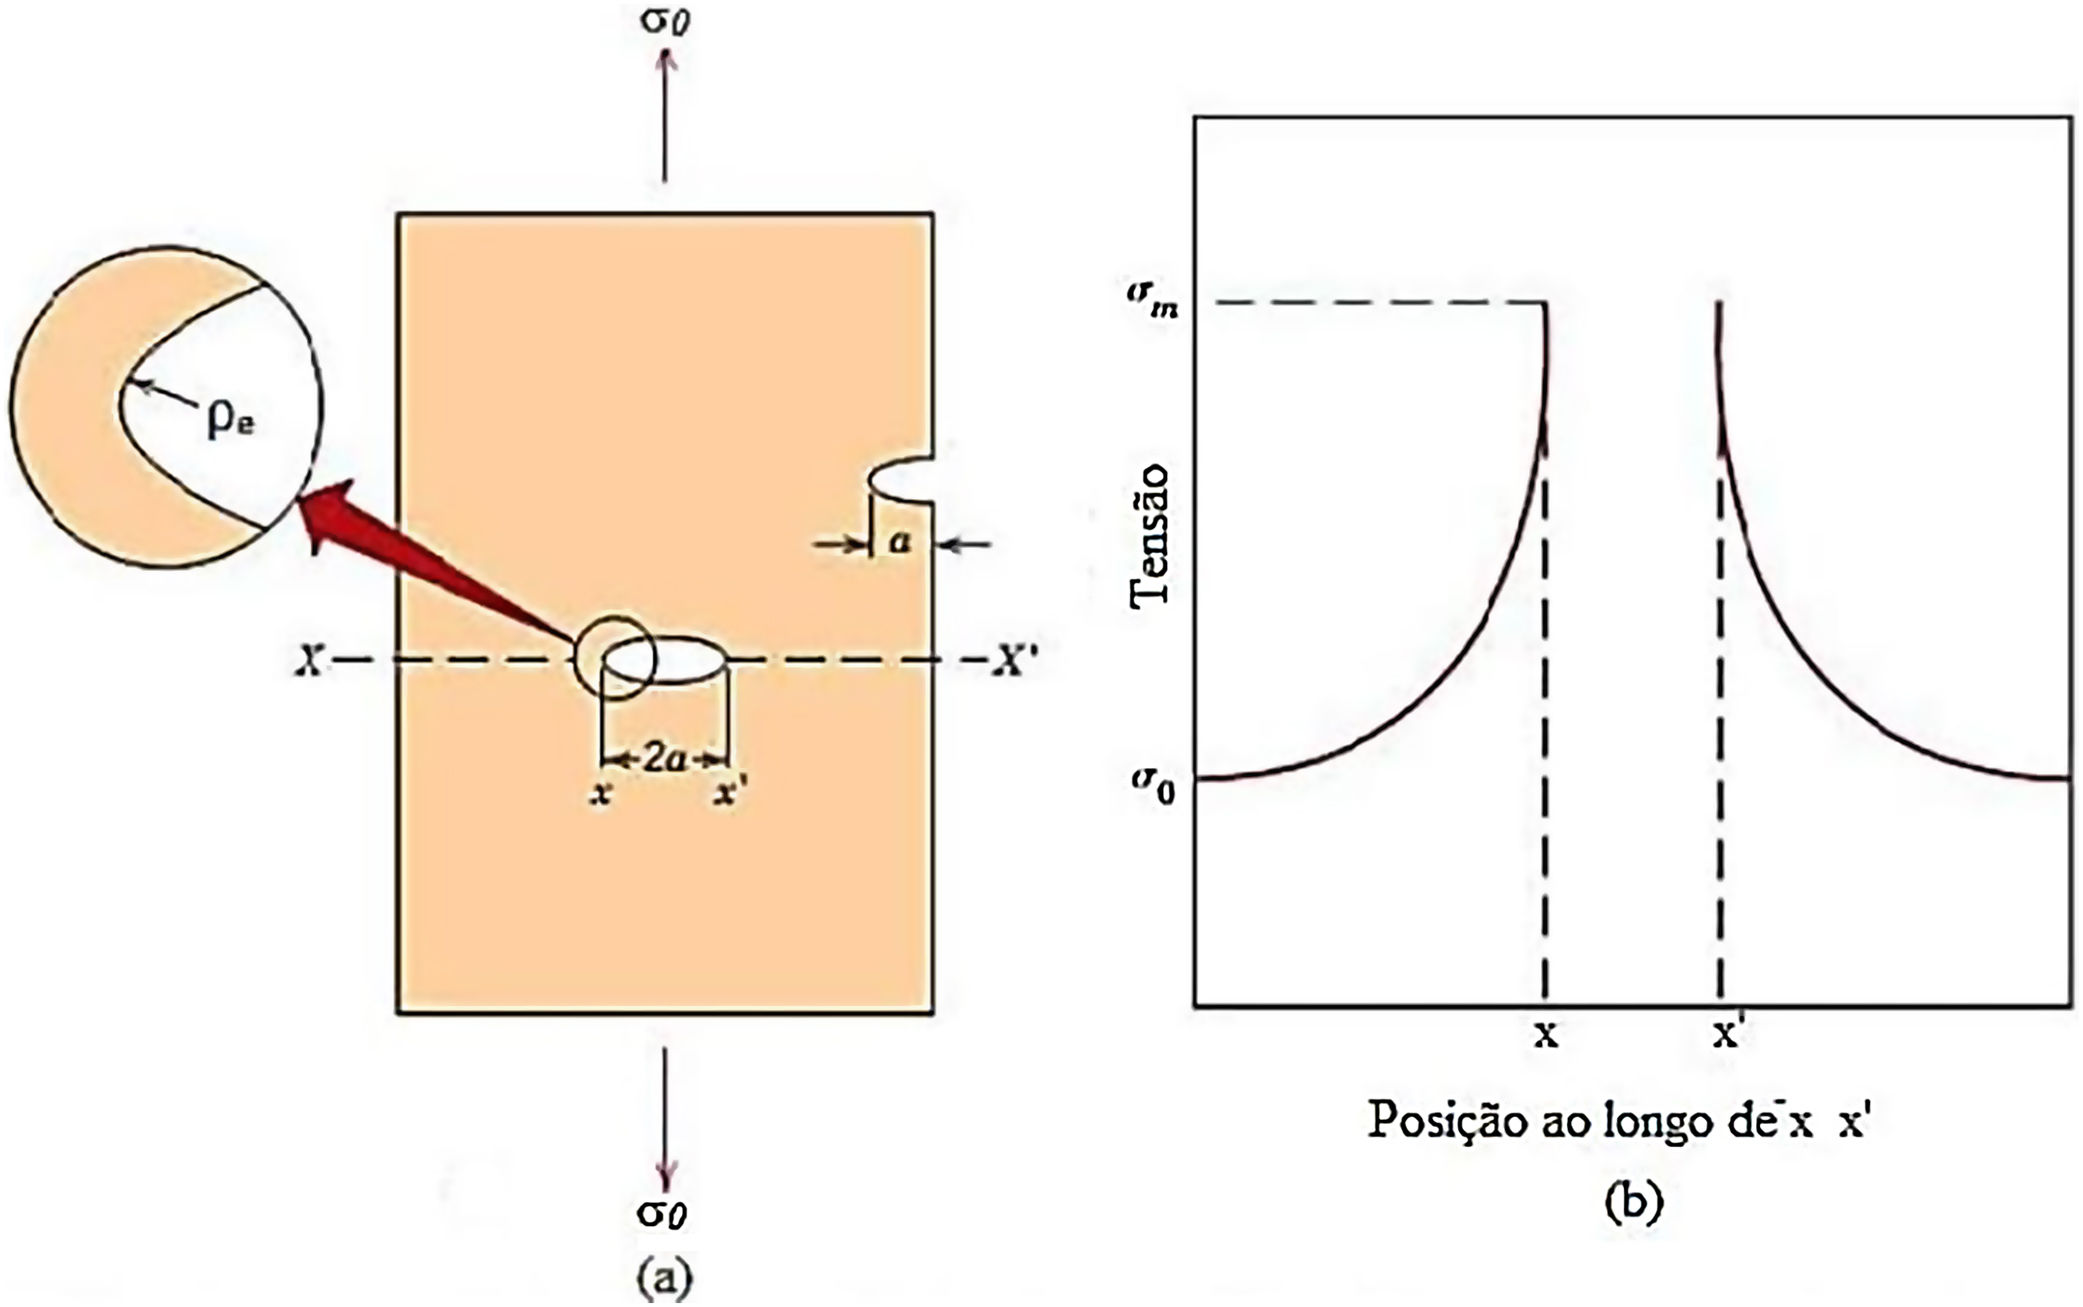
 The surface cracks and internal cracks geometry. (b) Schematic stress profile along the line X–X in (a), demonstrating the increase in tension at the crack ends.")
(a) The surface cracks and internal cracks geometry. (b) Schematic stress profile along the line X–X in (a), demonstrating the increase in tension at the crack ends.


Finite element mesh and its deformation by applying tension.
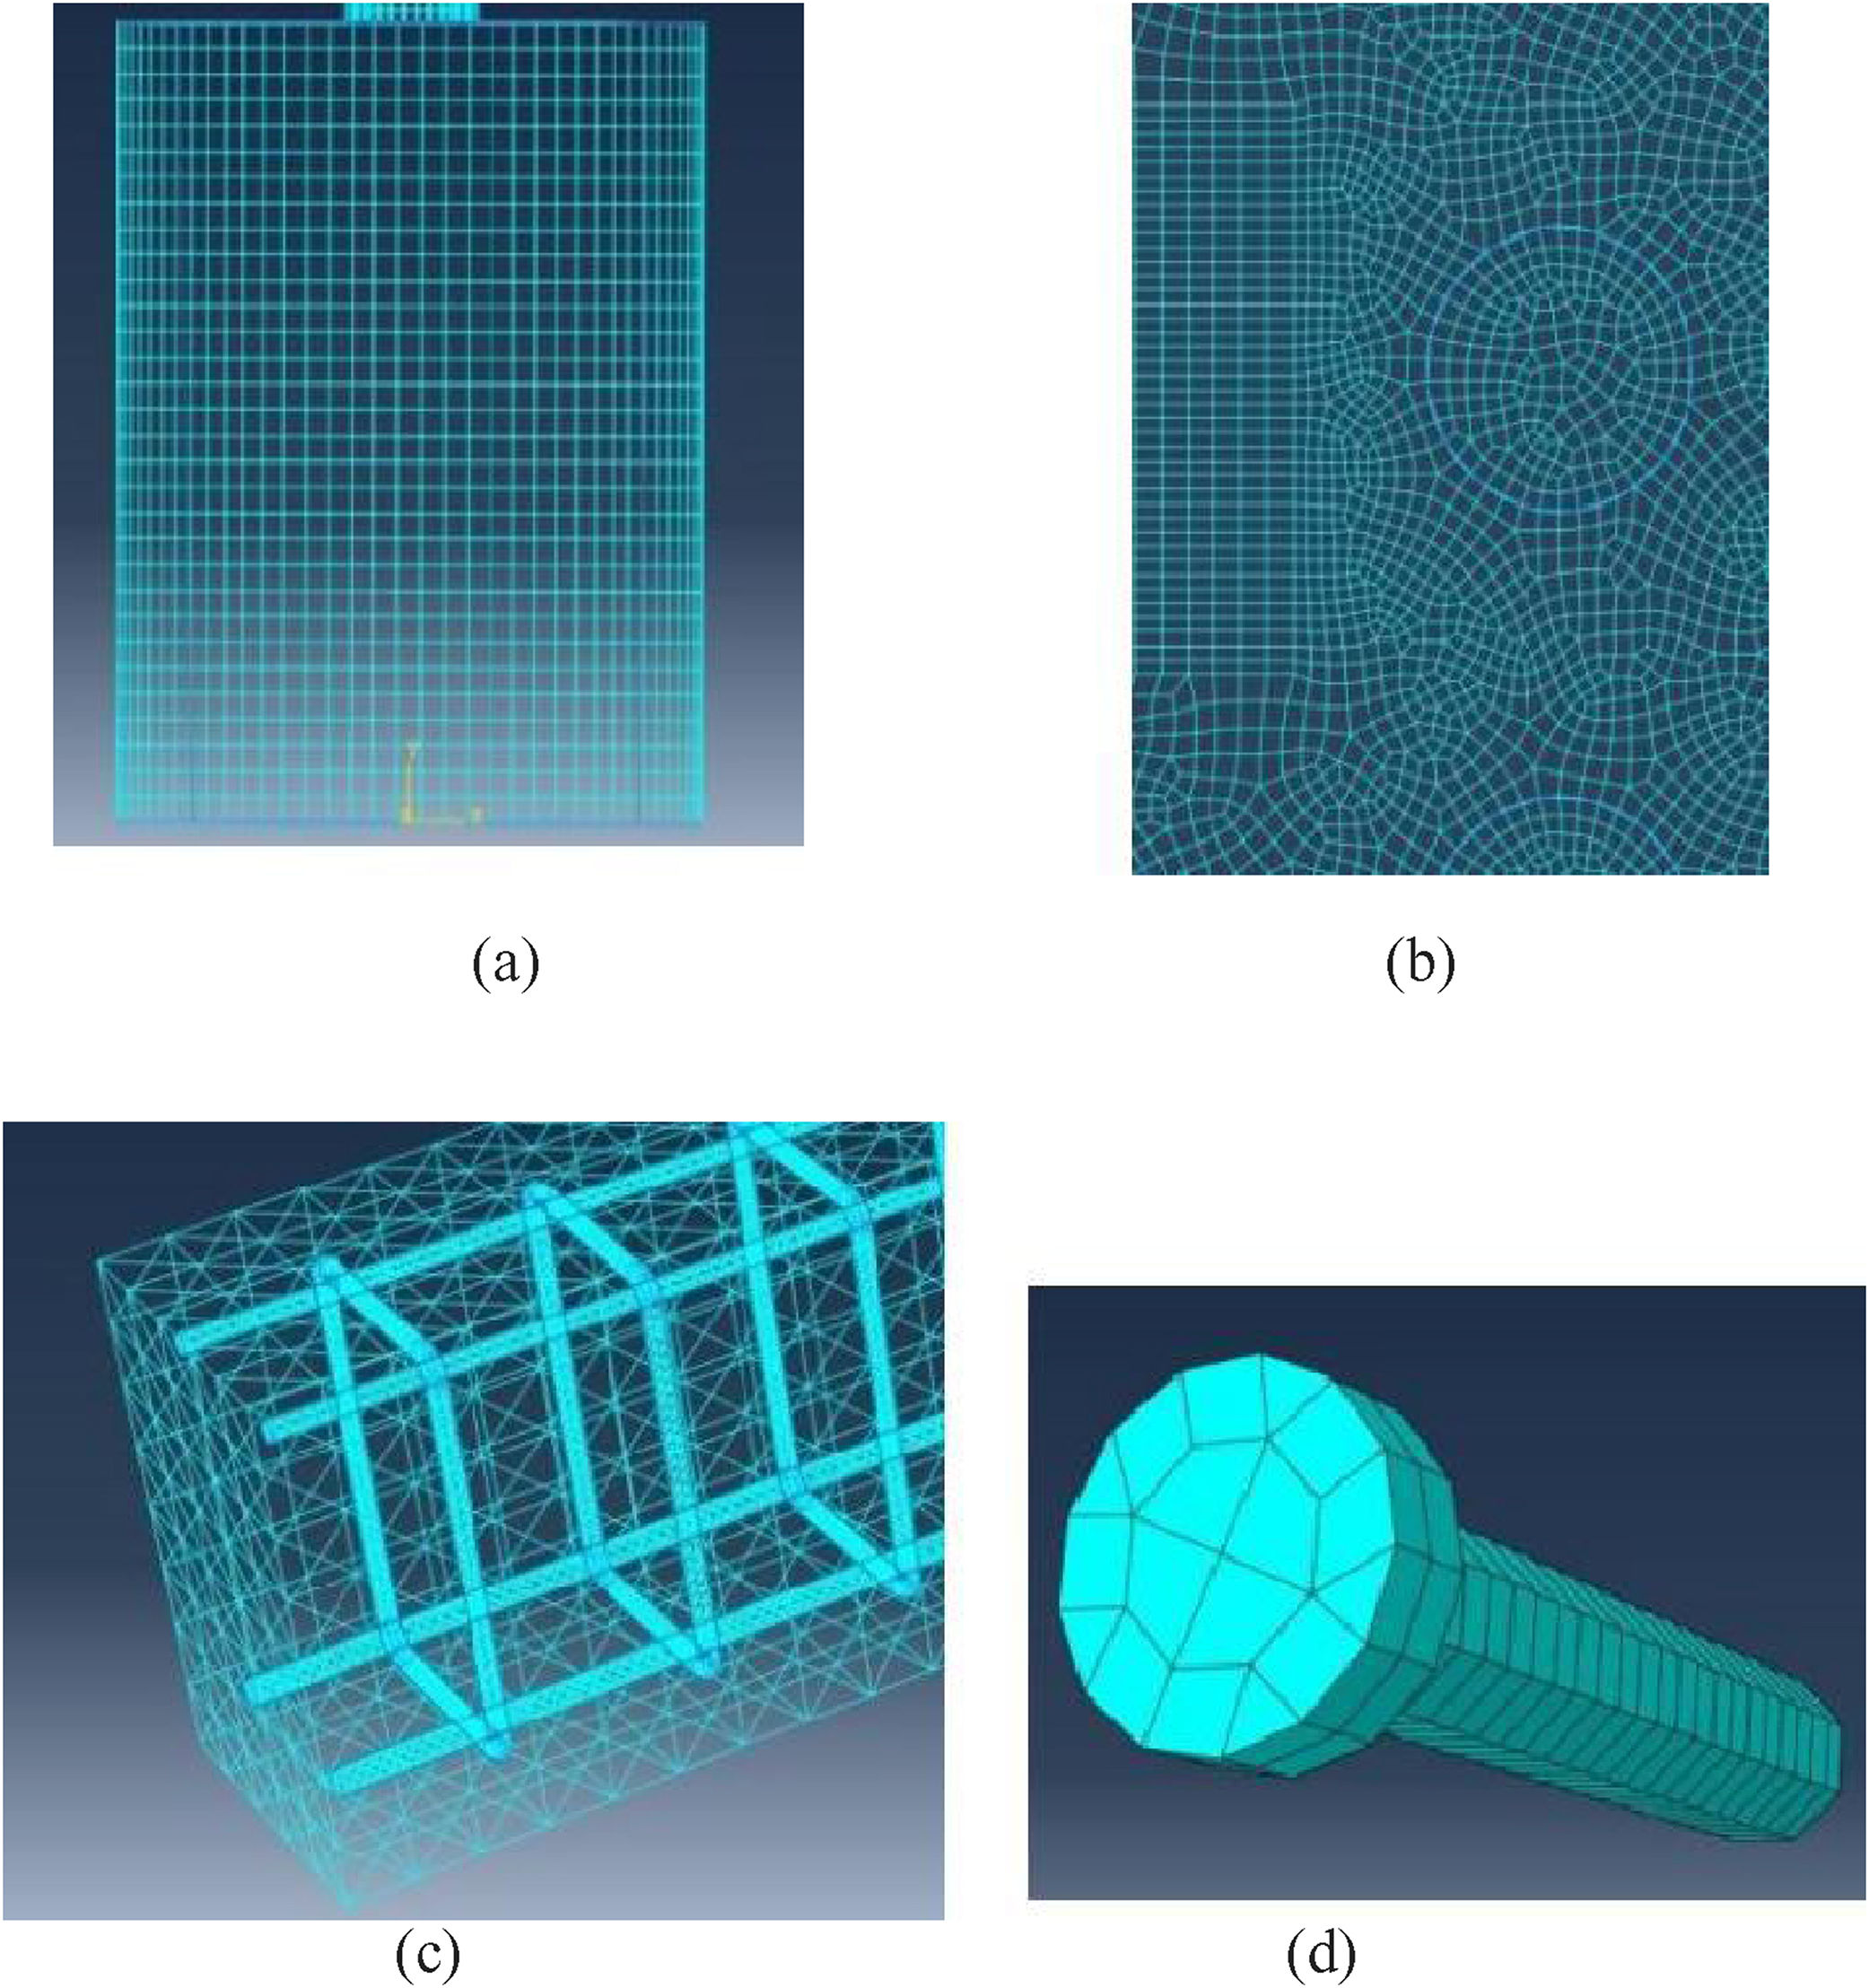
 Mesh constructed with quadrilateral elements (quad). (b) Mesh constructed predominantly with quadrilateral elements, allowing triangular elements in transition regions (quad-dominated). (c) Mesh constructed exclusively with triangular elements (tri). (b) Mesh predominantly constructed with hexahedral elements, allowing some triangular prisms (wedges) in transition regions (hex-dominated).")
(a) Mesh constructed with quadrilateral elements (quad). (b) Mesh constructed predominantly with quadrilateral elements, allowing triangular elements in transition regions (quad-dominated). (c) Mesh constructed exclusively with triangular elements (tri). (b) Mesh predominantly constructed with hexahedral elements, allowing some triangular prisms (wedges) in transition regions (hex-dominated).


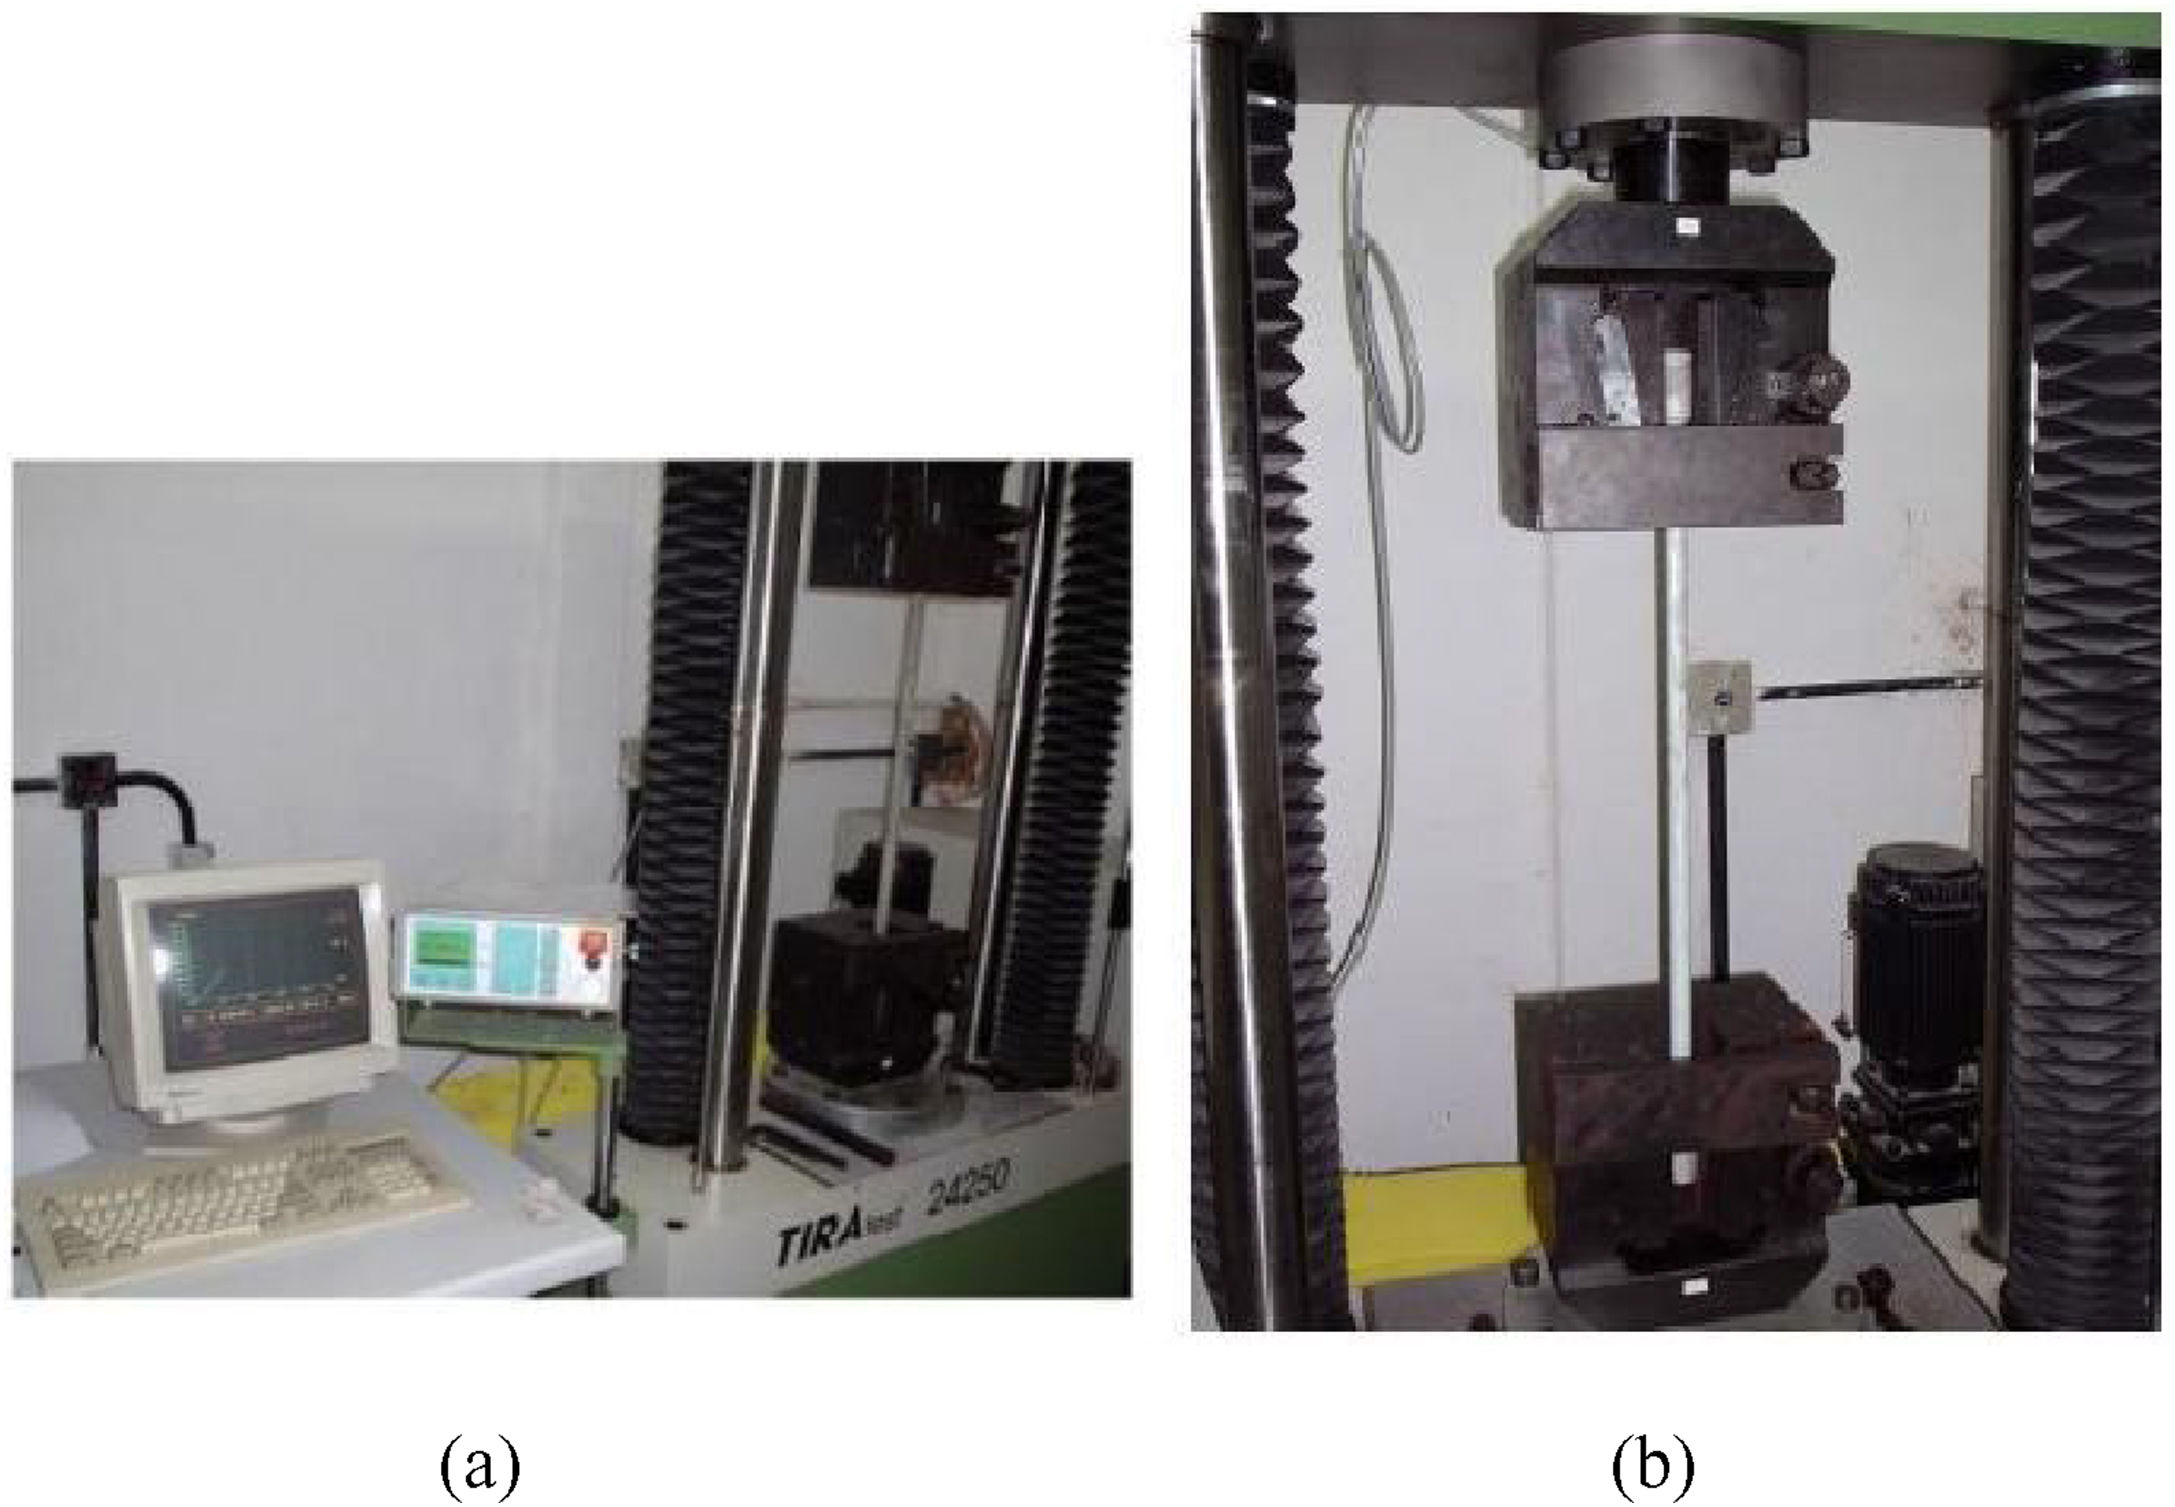
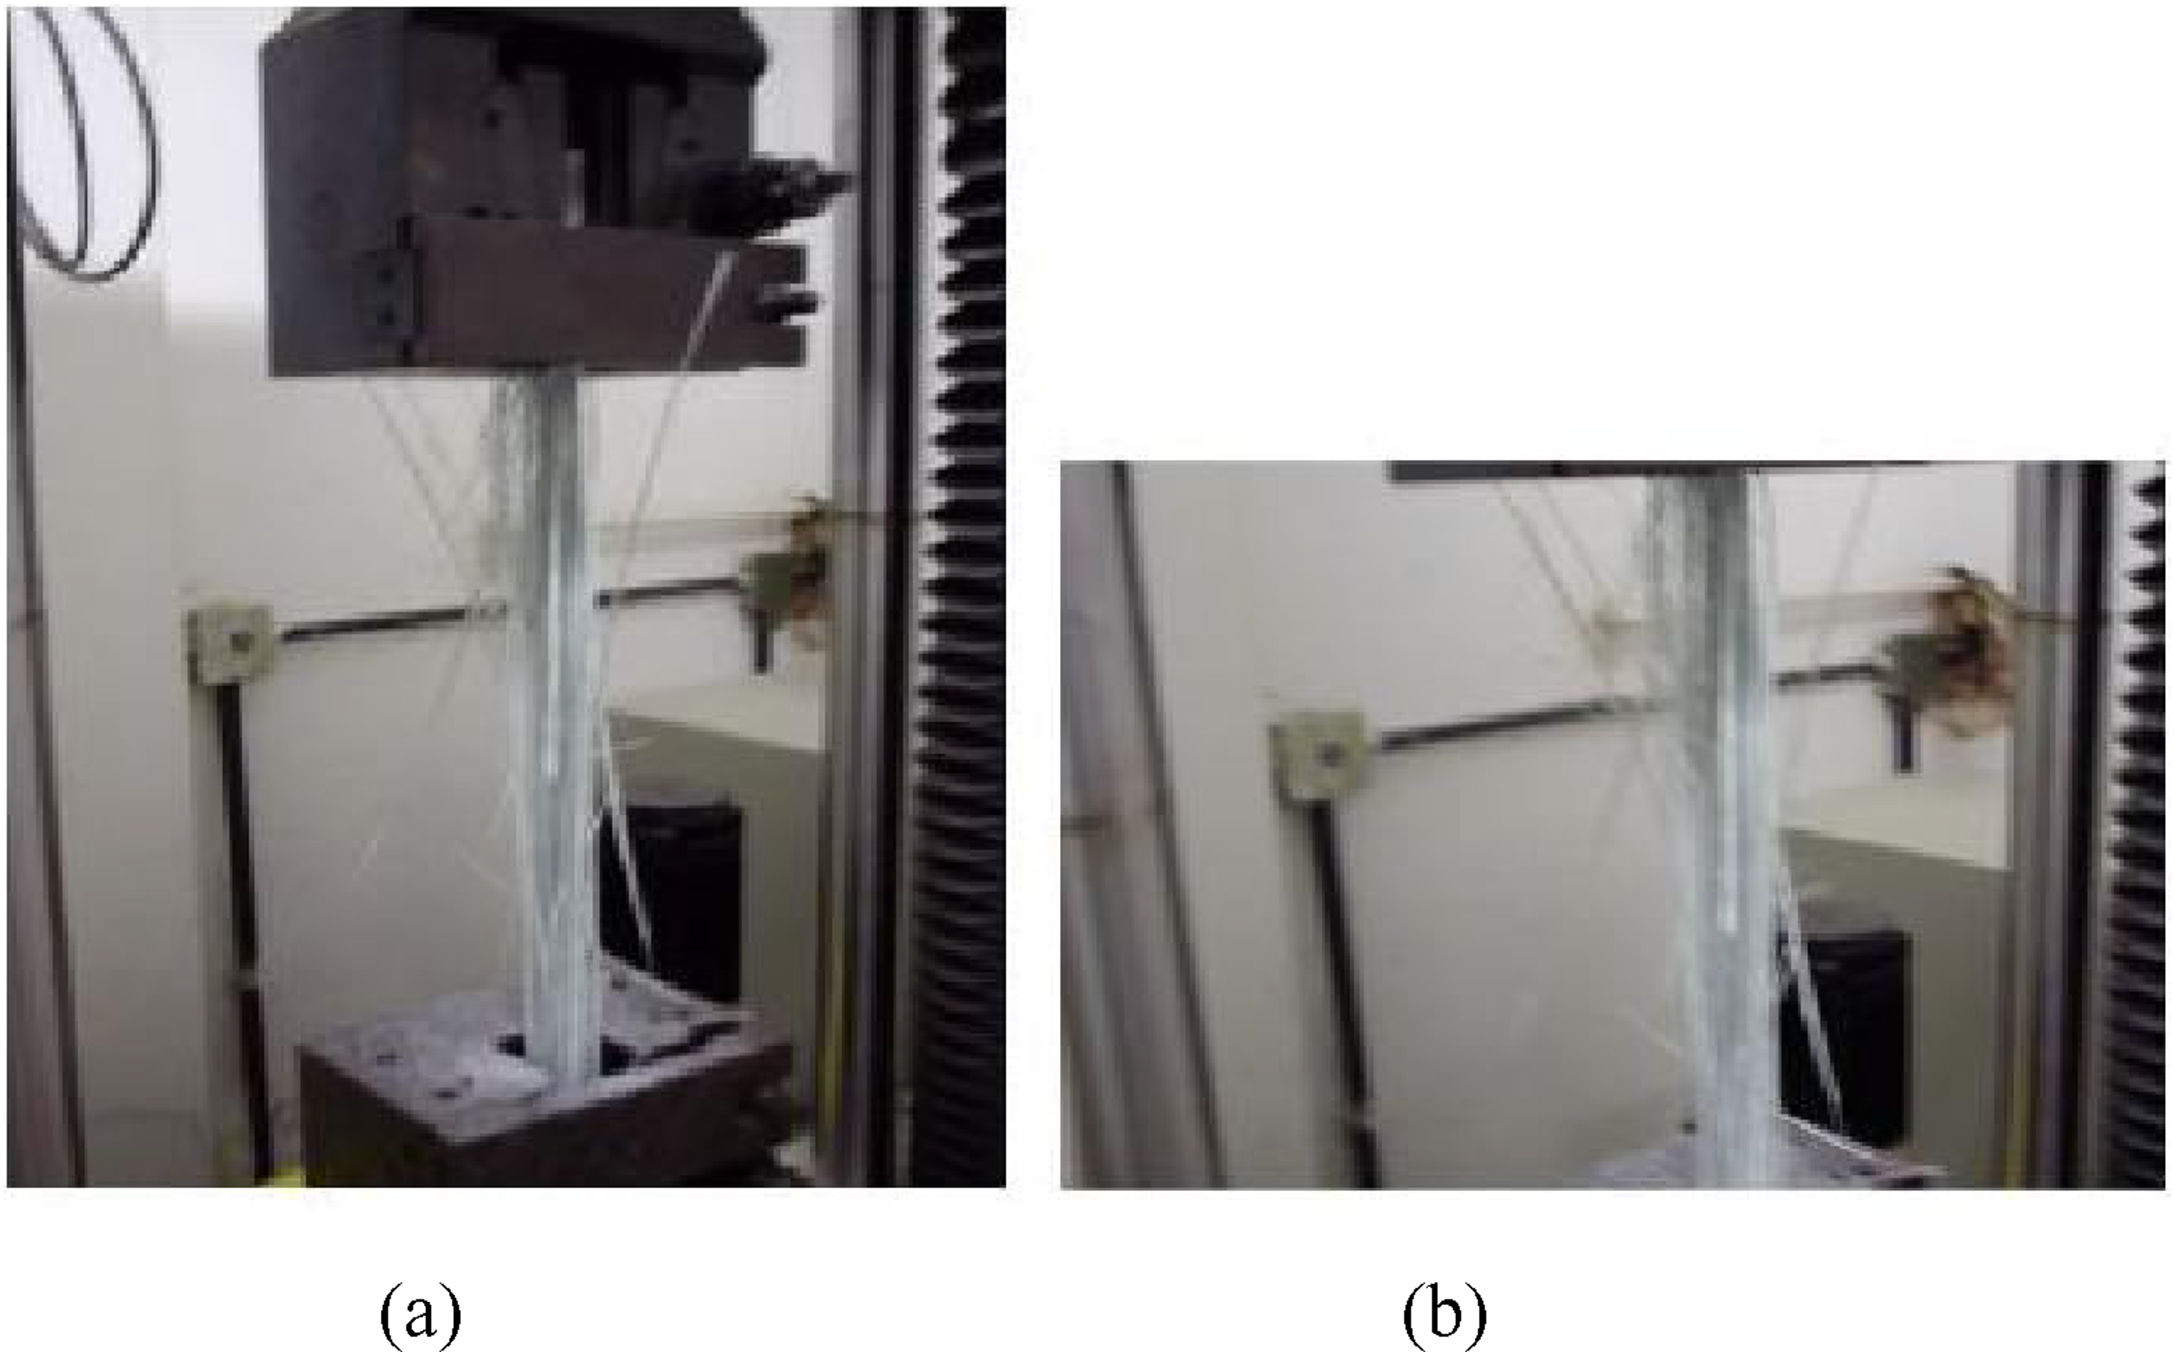
Machine used to perform tensile tests of test specimens.

.")
Tensile test on fiberglass test specimens (breakage detail).
 and CP-02.")


 Low refinement. (b) Medium refinement. (c) High refinement.")
(a) Low refinement. (b) Medium refinement. (c) High refinement.
As can be seen in Fig. 4, the transgranular fracture occurs when the crack propagates through the grains, that is, the crack travels a path through the interior of the material particles. While in the intergranular fracture as shown in Fig. 5, the fissure travels the path around the grains causing the constituent material particles to separate completely, there being no grain partition and therefore occurring more easily.
The stress concentration is due to the crack appearance in regions with small surface discontinuities, as can be observed in the figure above, those areas that present small imperfections that can be called initial material damage, since they will be responsible for the first faults that will contribute for cracking.
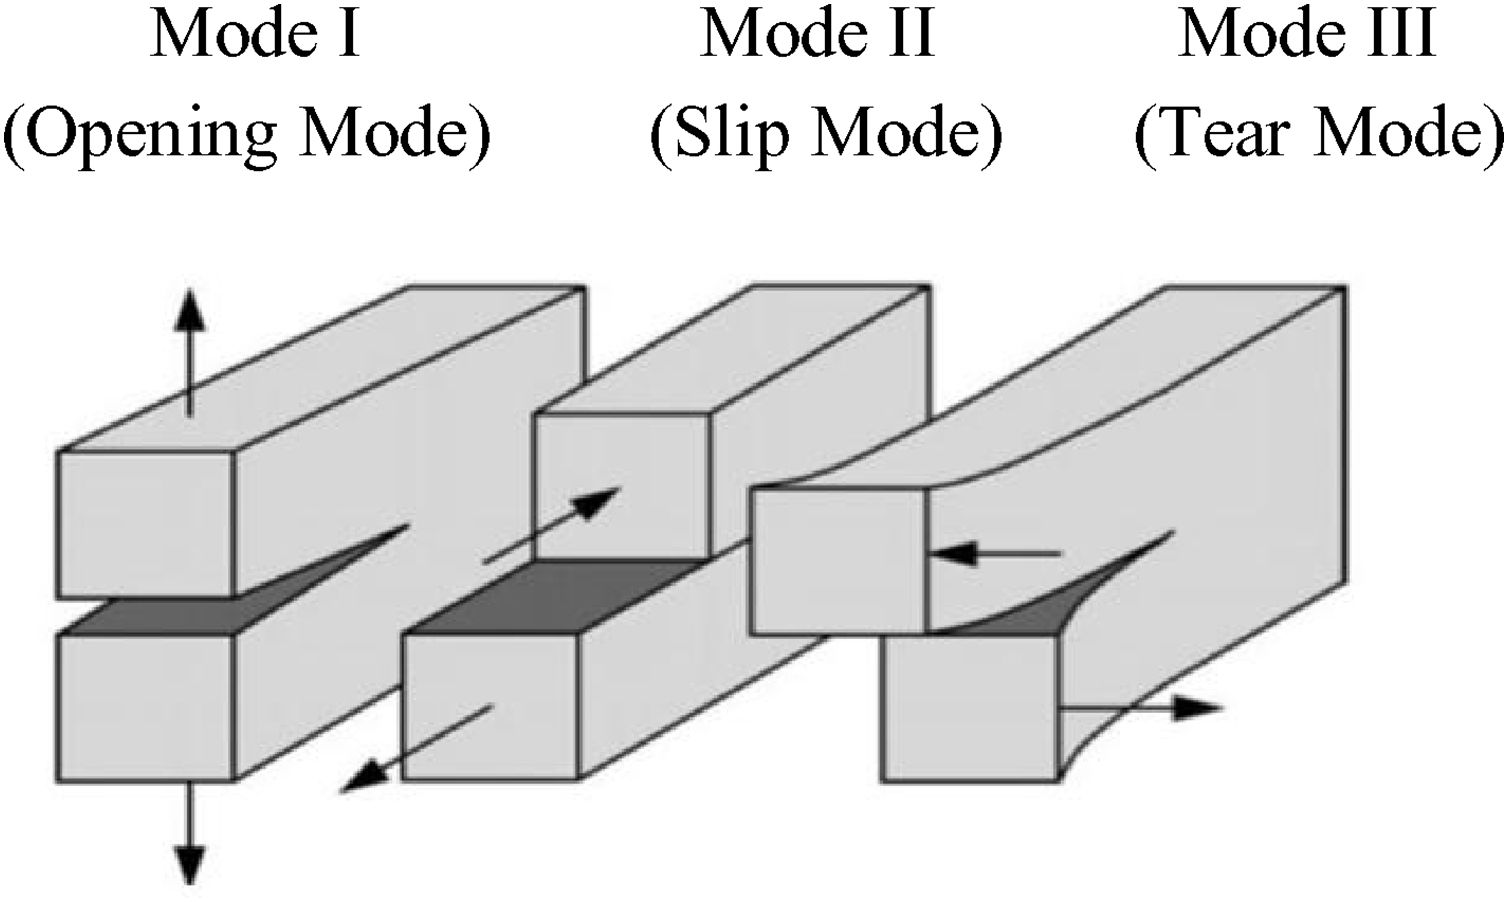
According [7], there are three load types that can act in a crack, the loading mode depends on how the main load is being applied to the analyzed element and is called Loading Mode I in the case where the main load is incident perpendicular to the crack plane, Loading Mode II when the load is acting on the cut plane and Loading Mode III, the applied load is outside the cut plane. Thus, the loading modes shown above show the normal force of the plane (Mode I – Opening mode), shear or shear force in the plane (Mode II – Slip mode) and twist (Mode III – Tear mode).
3.3Extended Finite Element Method (XFEM)The finite element method (FEM) [9] is widely applied in the solid-state discontinuities modeling such as the dynamic fracture propagation method application, as proposed by [10], using adaptive mesh in the fracture propagation; [11], but it has a huge disadvantage in the material modeling that exhibit discontinuities. Considering that the FEM application requires a greater mesh refinement in the fracture vicinity, as well as its constant updating, besides the necessity of a compatibilization between the adopted element geometry in the mesh modeling and the fissure present in the part analyzed.
For the mesh construction, the finite elements must be previously defined allowing the chosen element to best suit the region to be studied, providing an effective stress analysis as well as a prediction of possible cracks in the area under study.
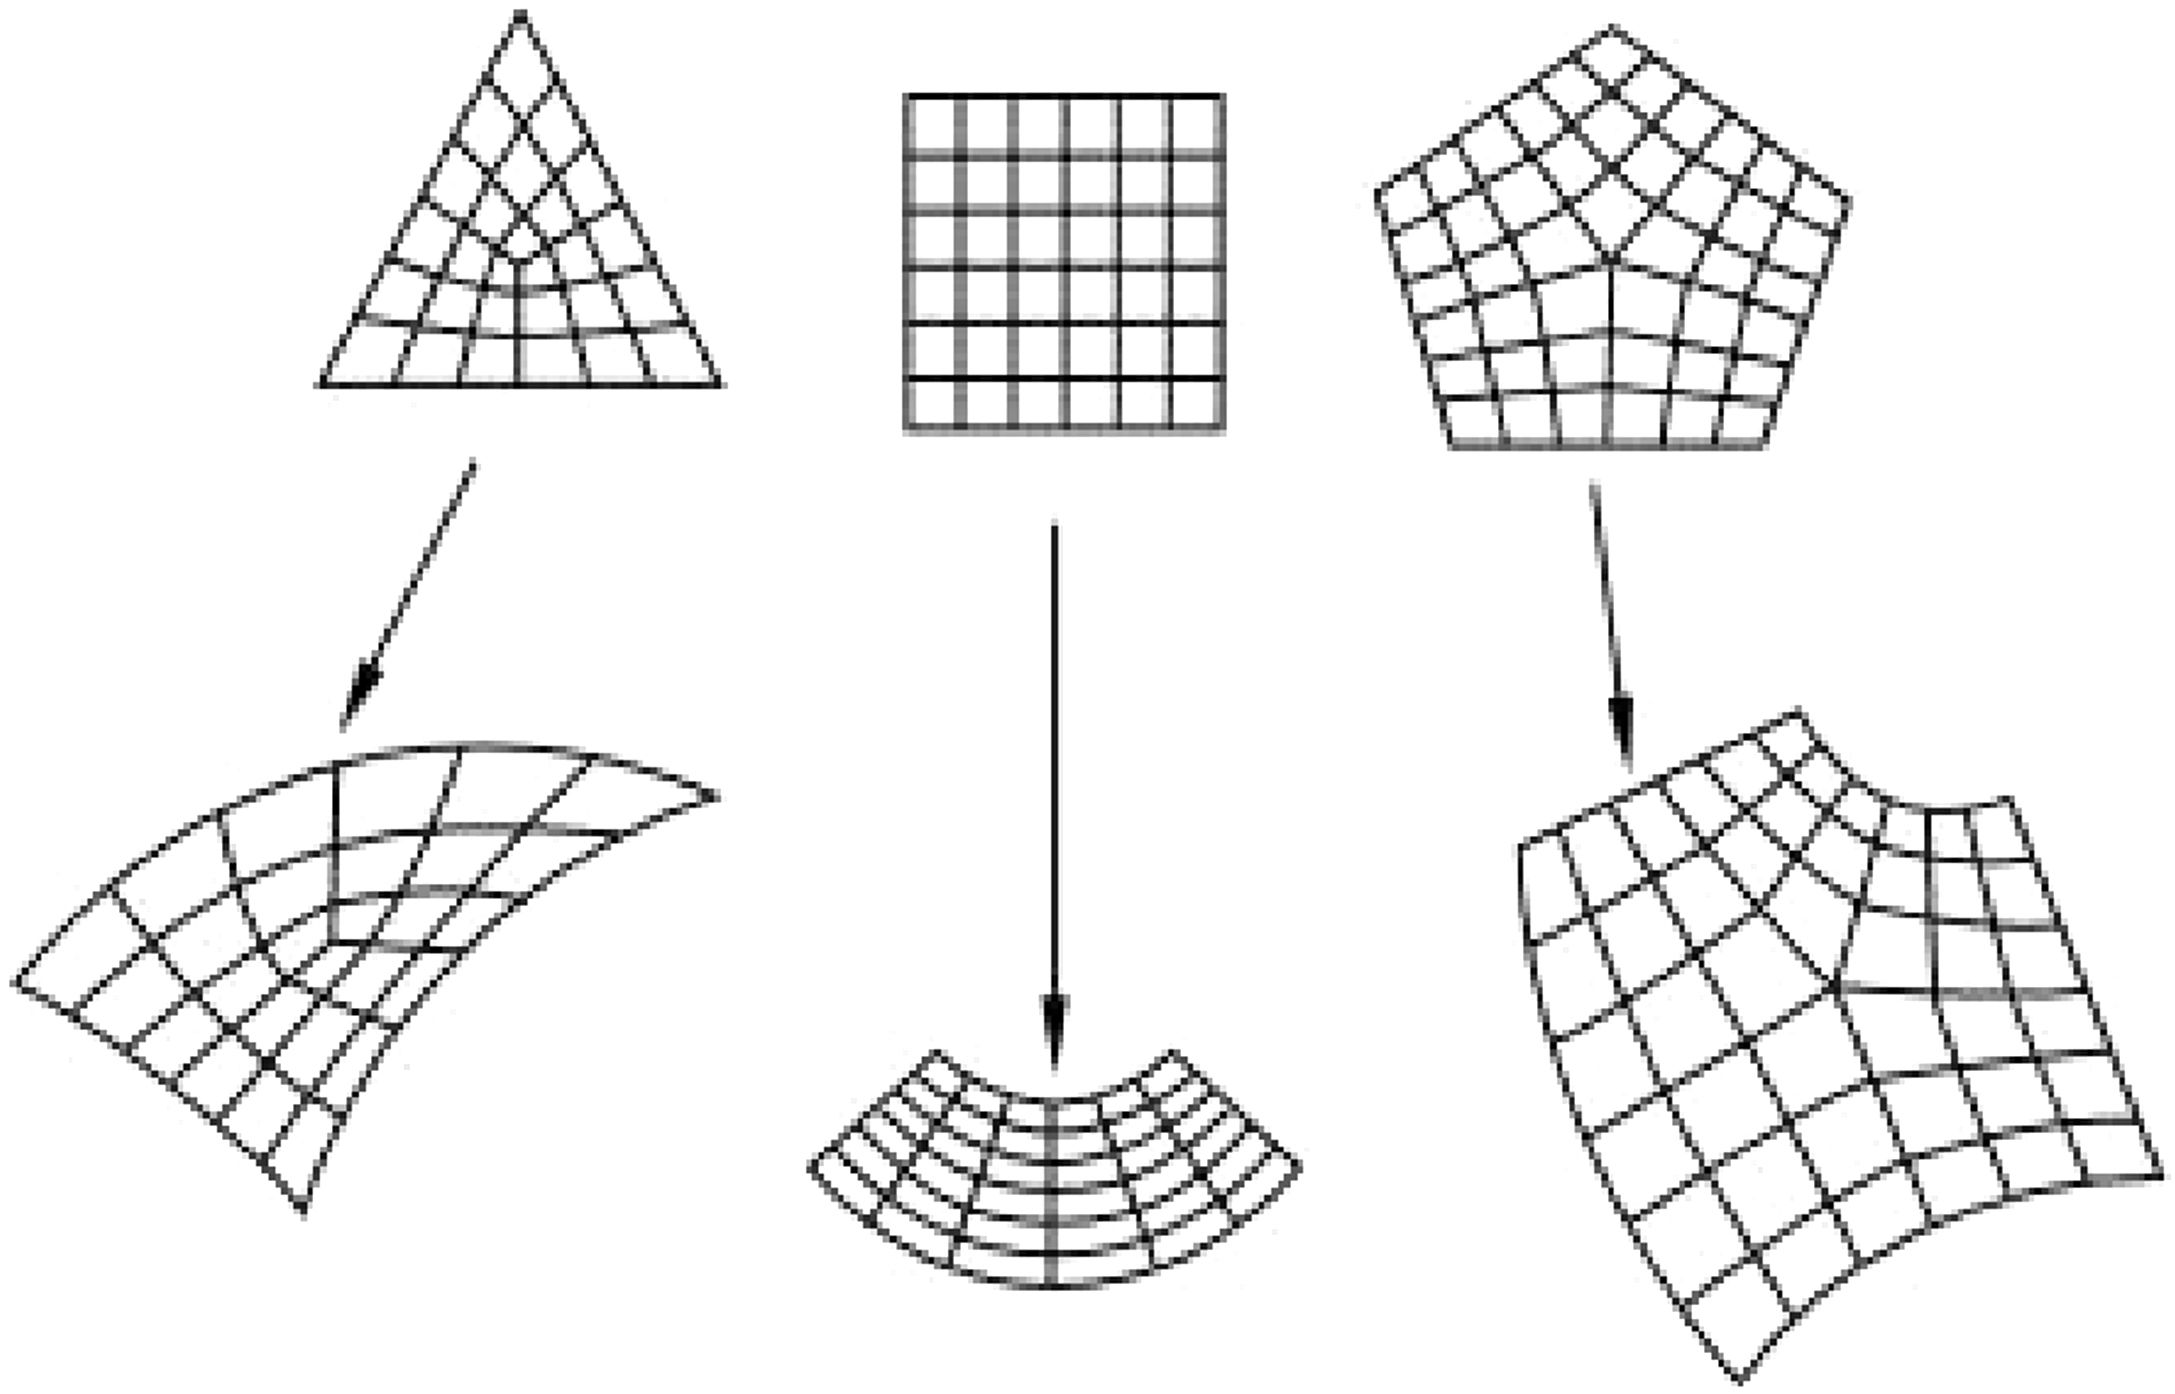
The finite element mesh can be generated through the structured mesh technique, which can be applied to two types of regions: two-dimensional (flat or curved region) and three-dimensional simple using Hex element. The said technique transforms the region mesh with a regular shape, such as a square or a cube, into the structured region geometry with which it is desired to make a connection, as shown in the image below.
The finite element mesh assembly in Abaqus software can be done in two-dimensional or three-dimensional regions, for each analyzed region type there are several element shapes. In the case of analysis in two-dimensional region the elements available for mounting the mesh can be quad, quad-dominated and tri. When the analysis is performed in a three-dimensional region, there are four forms of elements made available by Abaqus for finite element mesh assembly, which can be: Hex, Hex-dominated, Tet and Wedge. Below are represented meshes built with bidimensional and three-dimensional elements [12].
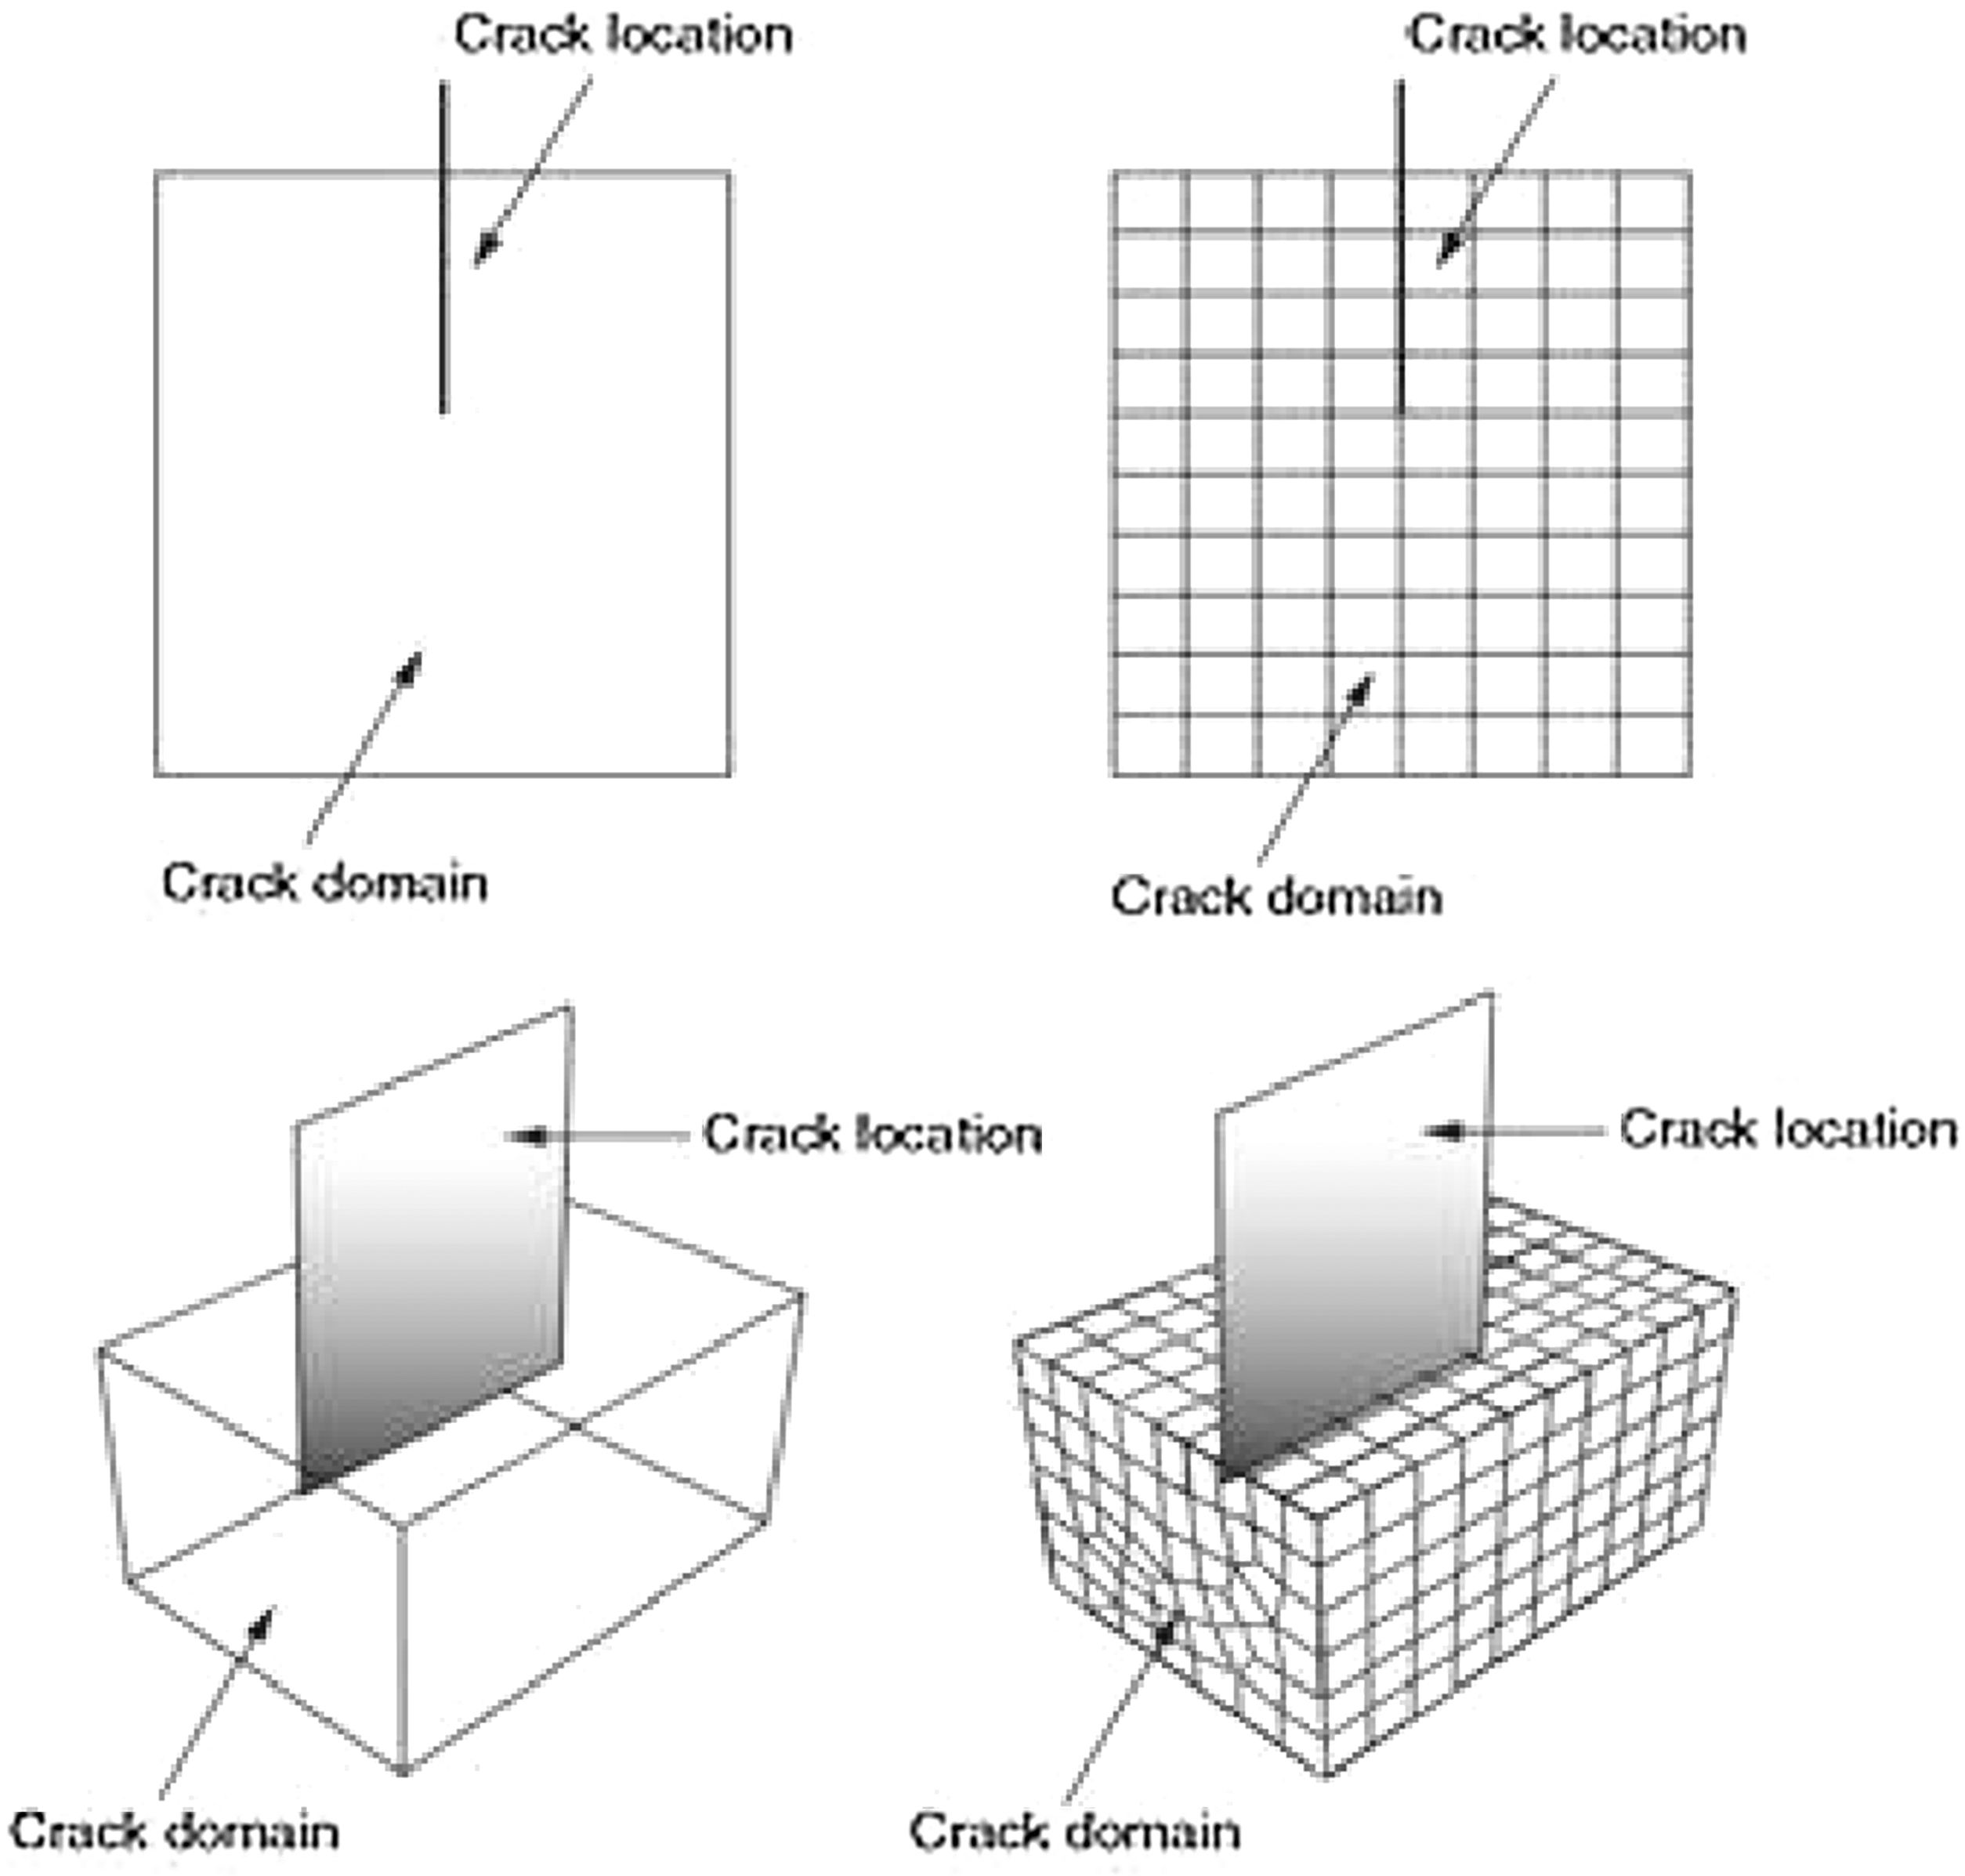
The analysis using the extended finite element method allows applying the fracture mechanics principles as a way of predicting the damages caused by the stresses acting on the material, as well as its rupture form. The software Abaqus allows to simulate the cracks appearance by allowing the creation of a seam slot, defined by a border or face that contains overlapping nodes that has the ability to separate during an analysis.
The XFEM studies the appearance of a fissure, considering its propagation by an arbitrary path, since there is no way to predict the form of propagation, without needing to update the model through the refinement of the mesh [13]. The method can be applied in two-dimensional, three-dimensional models and orphaned meshes using estimates with contour integrals. If the location where the fault is set will not be defined, the Abaqus will create the initial cracks leading to crack propagation by selecting regions that exhibit tensions greater than the maximum damage values that have been specified by the traction-separation laws [12].
4Experimental analysisIn order to perform the computational analysis, the extended finite element method – XFEM was used due to its feasibility to analyze cracks allowing the modeling of discontinuities and singularities without the used finite element mesh interference.
4.1Laboratory analysisThe tensile tests were carried out in the Civil Engineering Technological Division of the Ceará State Technology Nucleus laboratory, using the Universal Testing Machine of the MAN mark and model TIRA Test 24250.
In order to carry out the tensile tests, 10 test specimens were used, High Tension Insulators Polymeric Core made of fiberglass, which were donated by the Electricity Company of the State of Ceará – COELCE. The test specimen to be tested was fixed to the machine by means of existing claws, as the sample was drawn, a load–displacement graph was generated on the computer screen. The composite material samples have cylindrical shape and continuous fibers disposed in the longitudinal direction, being able to withstand a 120kN maximum load.
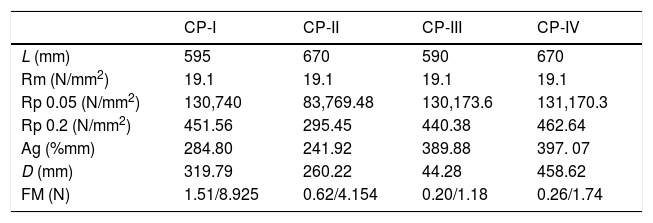
The following table shows the results obtained in the uniaxial tensile test of four specimens, with the following variables measured on the basis of data obtained from the tests (Tables 1–8).
Uniaxial traction test results.
| CP-I | CP-II | CP-III | CP-IV | |
|---|---|---|---|---|
| L (mm) | 595 | 670 | 590 | 670 |
| Rm (N/mm2) | 19.1 | 19.1 | 19.1 | 19.1 |
| Rp 0.05 (N/mm2) | 130,740 | 83,769.48 | 130,173.6 | 131,170.3 |
| Rp 0.2 (N/mm2) | 451.56 | 295.45 | 440.38 | 462.64 |
| Ag (%mm) | 284.80 | 241.92 | 389.88 | 397. 07 |
| D (mm) | 319.79 | 260.22 | 44.28 | 458.62 |
| FM (N) | 1.51/8.925 | 0.62/4.154 | 0.20/1.18 | 0.26/1.74 |
Length (L); diameter (D); maximum load (Fm); resistance to material traction (Rm); limit tension in the plastic region (Rp); percentage of deformation until fracture (Ag).
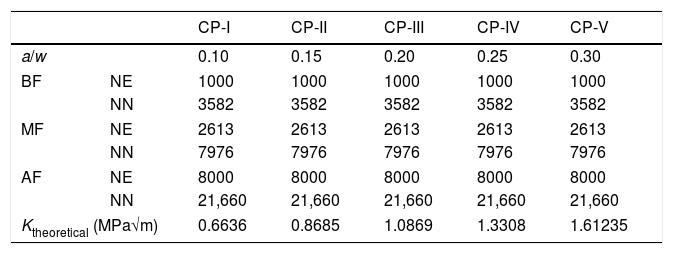
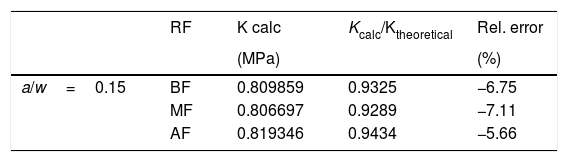
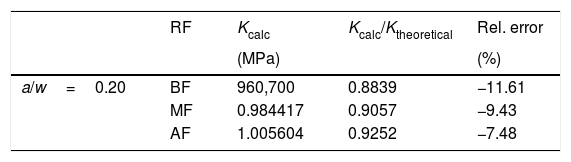
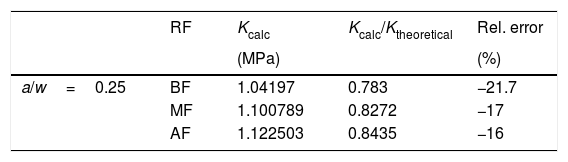
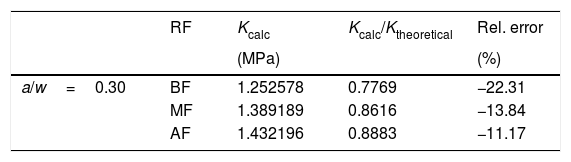
Characteristics of numerical models regarding the relation a/w.
| CP-I | CP-II | CP-III | CP-IV | CP-V | ||
|---|---|---|---|---|---|---|
| a/w | 0.10 | 0.15 | 0.20 | 0.25 | 0.30 | |
| BF | NE | 1000 | 1000 | 1000 | 1000 | 1000 |
| NN | 3582 | 3582 | 3582 | 3582 | 3582 | |
| MF | NE | 2613 | 2613 | 2613 | 2613 | 2613 |
| NN | 7976 | 7976 | 7976 | 7976 | 7976 | |
| AF | NE | 8000 | 8000 | 8000 | 8000 | 8000 |
| NN | 21,660 | 21,660 | 21,660 | 21,660 | 21,660 | |
| Ktheoretical (MPa√m) | 0.6636 | 0.8685 | 1.0869 | 1.3308 | 1.61235 | |
Low refinement (BF); medium refinement (MF); high refinement (AF); number of elements (NE); number of nodes (NN).
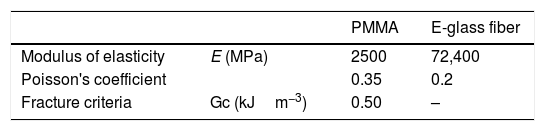
Composite materials mechanical properties and fracture criteria.
| PMMA | E-glass fiber | ||
|---|---|---|---|
| Modulus of elasticity | E (MPa) | 2500 | 72,400 |
| Poisson's coefficient | 0.35 | 0.2 | |
| Fracture criteria | Gc (kJm−3) | 0.50 | – |
Modulus of elasticity/Young's modulus (E); Poisson's coefficient (ν); critical energy release rate (Gc).
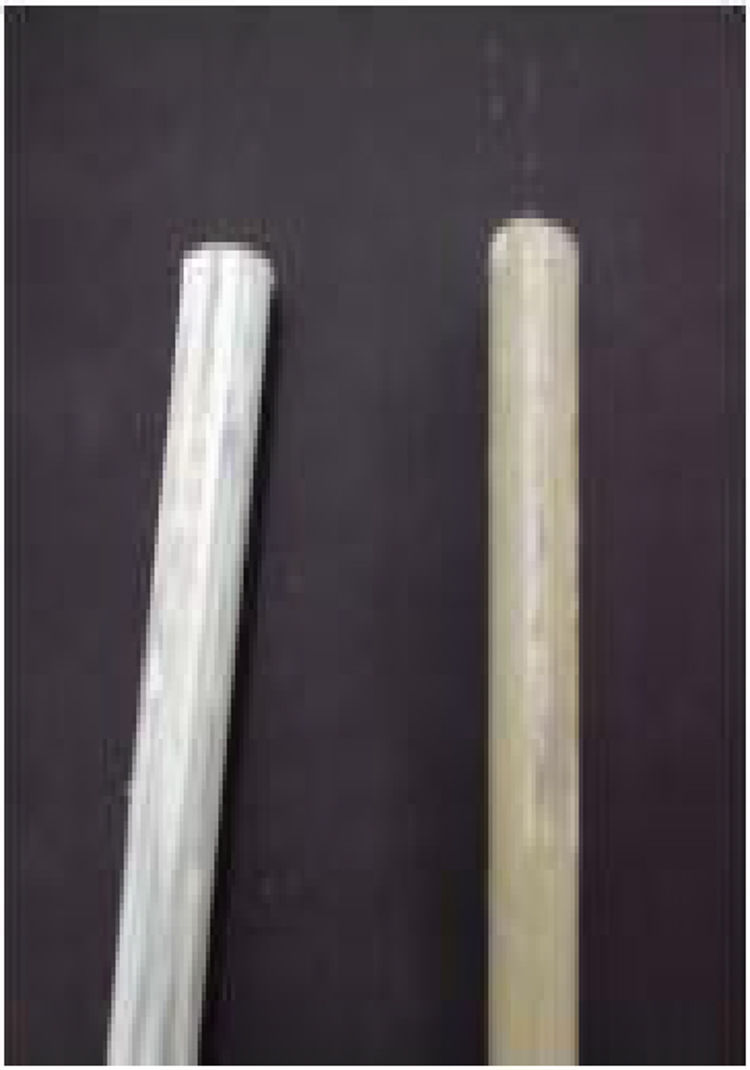
From the tensile test results and the characteristics presented by the samples, it was noticed that the samples were divided into two distinct groups, considering the manufacturing period, in this way, the analyzes were performed in two stages, CP-01 and CP-02.
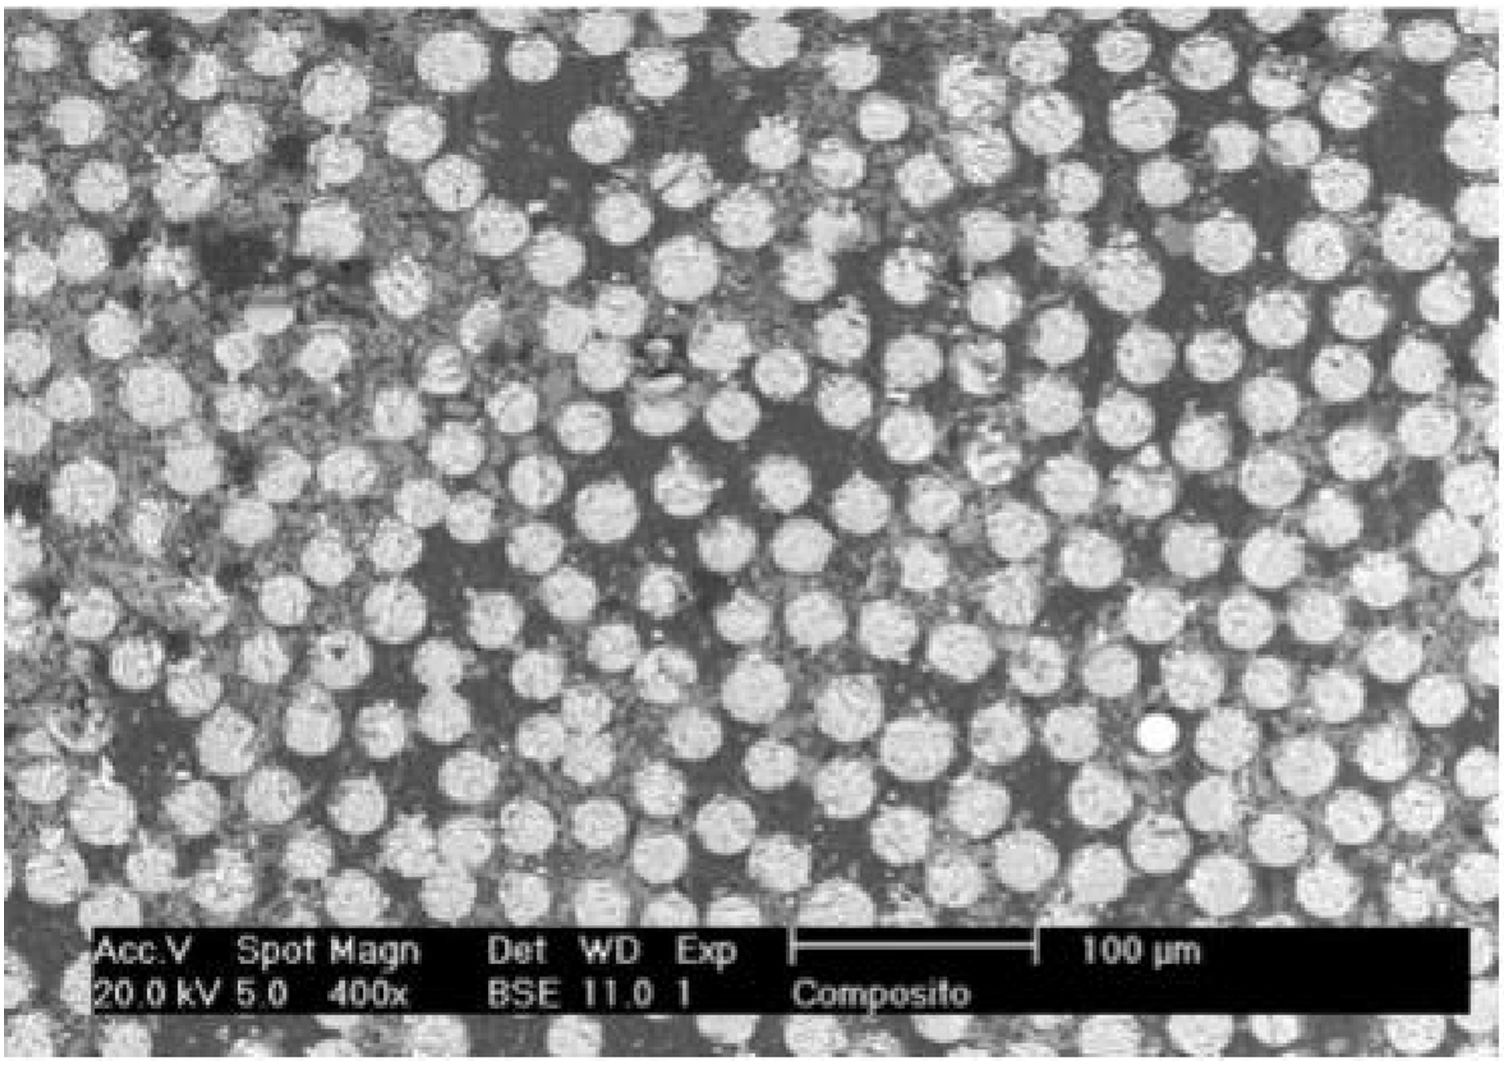
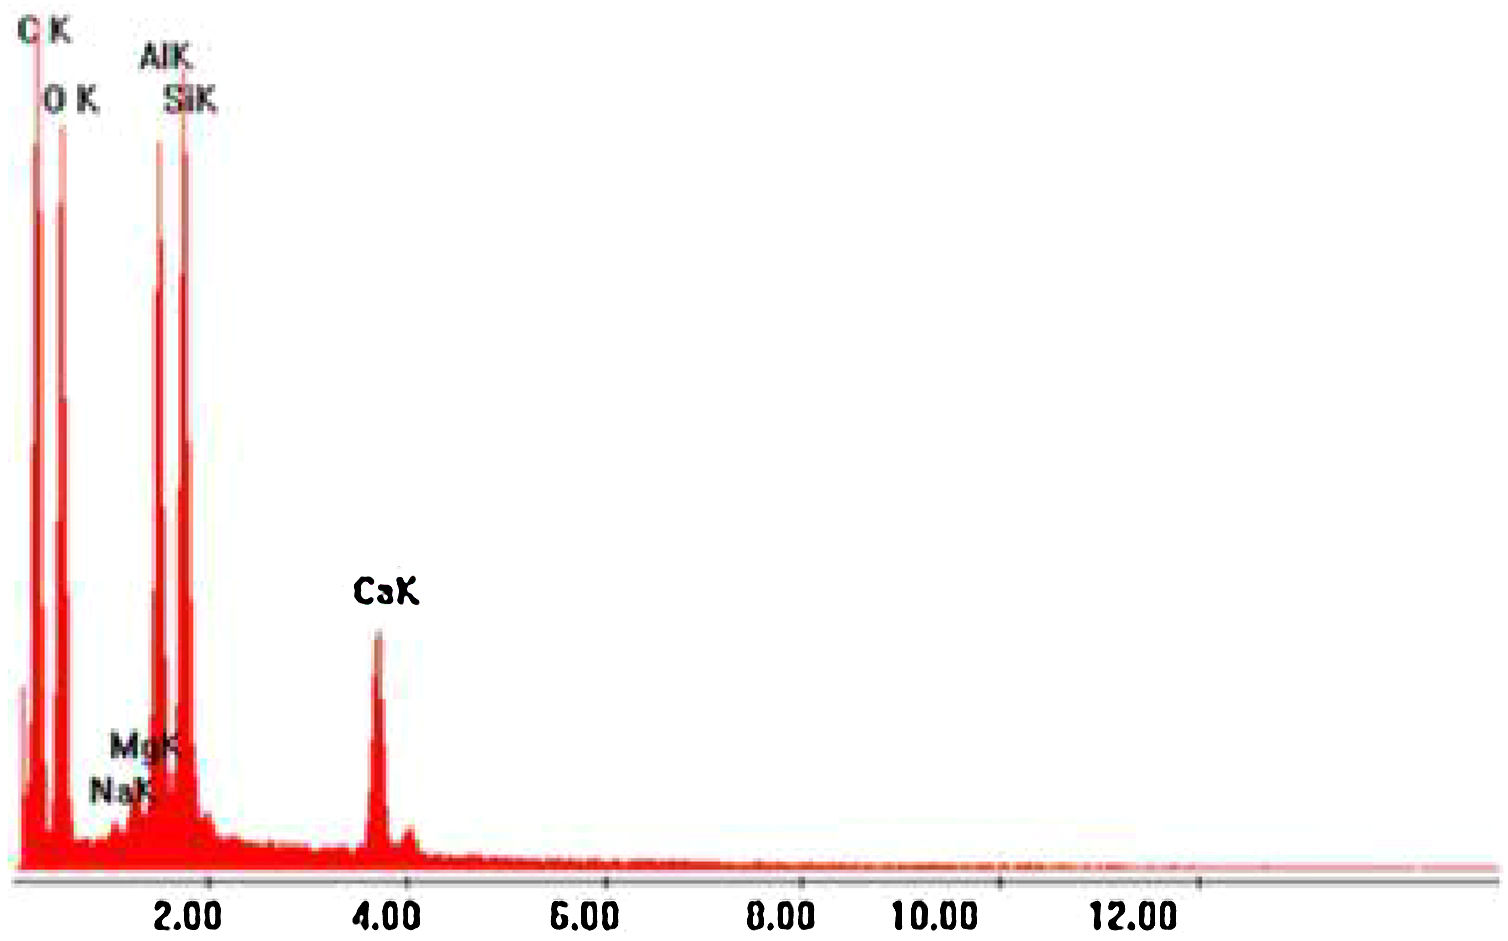
At the end of the tensile tests and analysis of its results, we proceeded to the metallographic analysis of the material, which consisted of immersing the composite samples in hot bakelite, a type of synthetic resin with great resistance to heat, after which a polishing with paper of silicon carbide, and finally a polishing with diamond paste. Shortly thereafter, a cut was made in the composite samples and taken for analysis on the Philps XL-30 scanning electron microscope, which was coupled to a Link Analytical QX-2000 X-ray Dispersive Energy (EDX) analysis system as way to know the entire chemical composition of the composite under study.
As can be seen in the figure below it is noted that the fibers do not have a well-defined organization, having regions in which they are very close to each other but also well spaced in other regions.
4.2Computational analysisFor computational analysis, Abaqus software was used for numerical simulations, which is based on finite elements with implementation of the XFEM tool, allowing to analyze the behavior of PMMA reinforced with E-glass fiber during crack propagation and fracture.
Three analyzes were carried out, starting with the theoretical-experimental analysis, through the SENT (Single Edge Notch Tension) test specimen, after which two other analyzes were performed, which observed the behavior during the crack propagation through the XFEM method, assuming the composite modeling as an isotropic solid, while the other analyzes at the interface fiber/matrix tensions and fracturing, in fracture mode1, using a representative volume element – RVE.
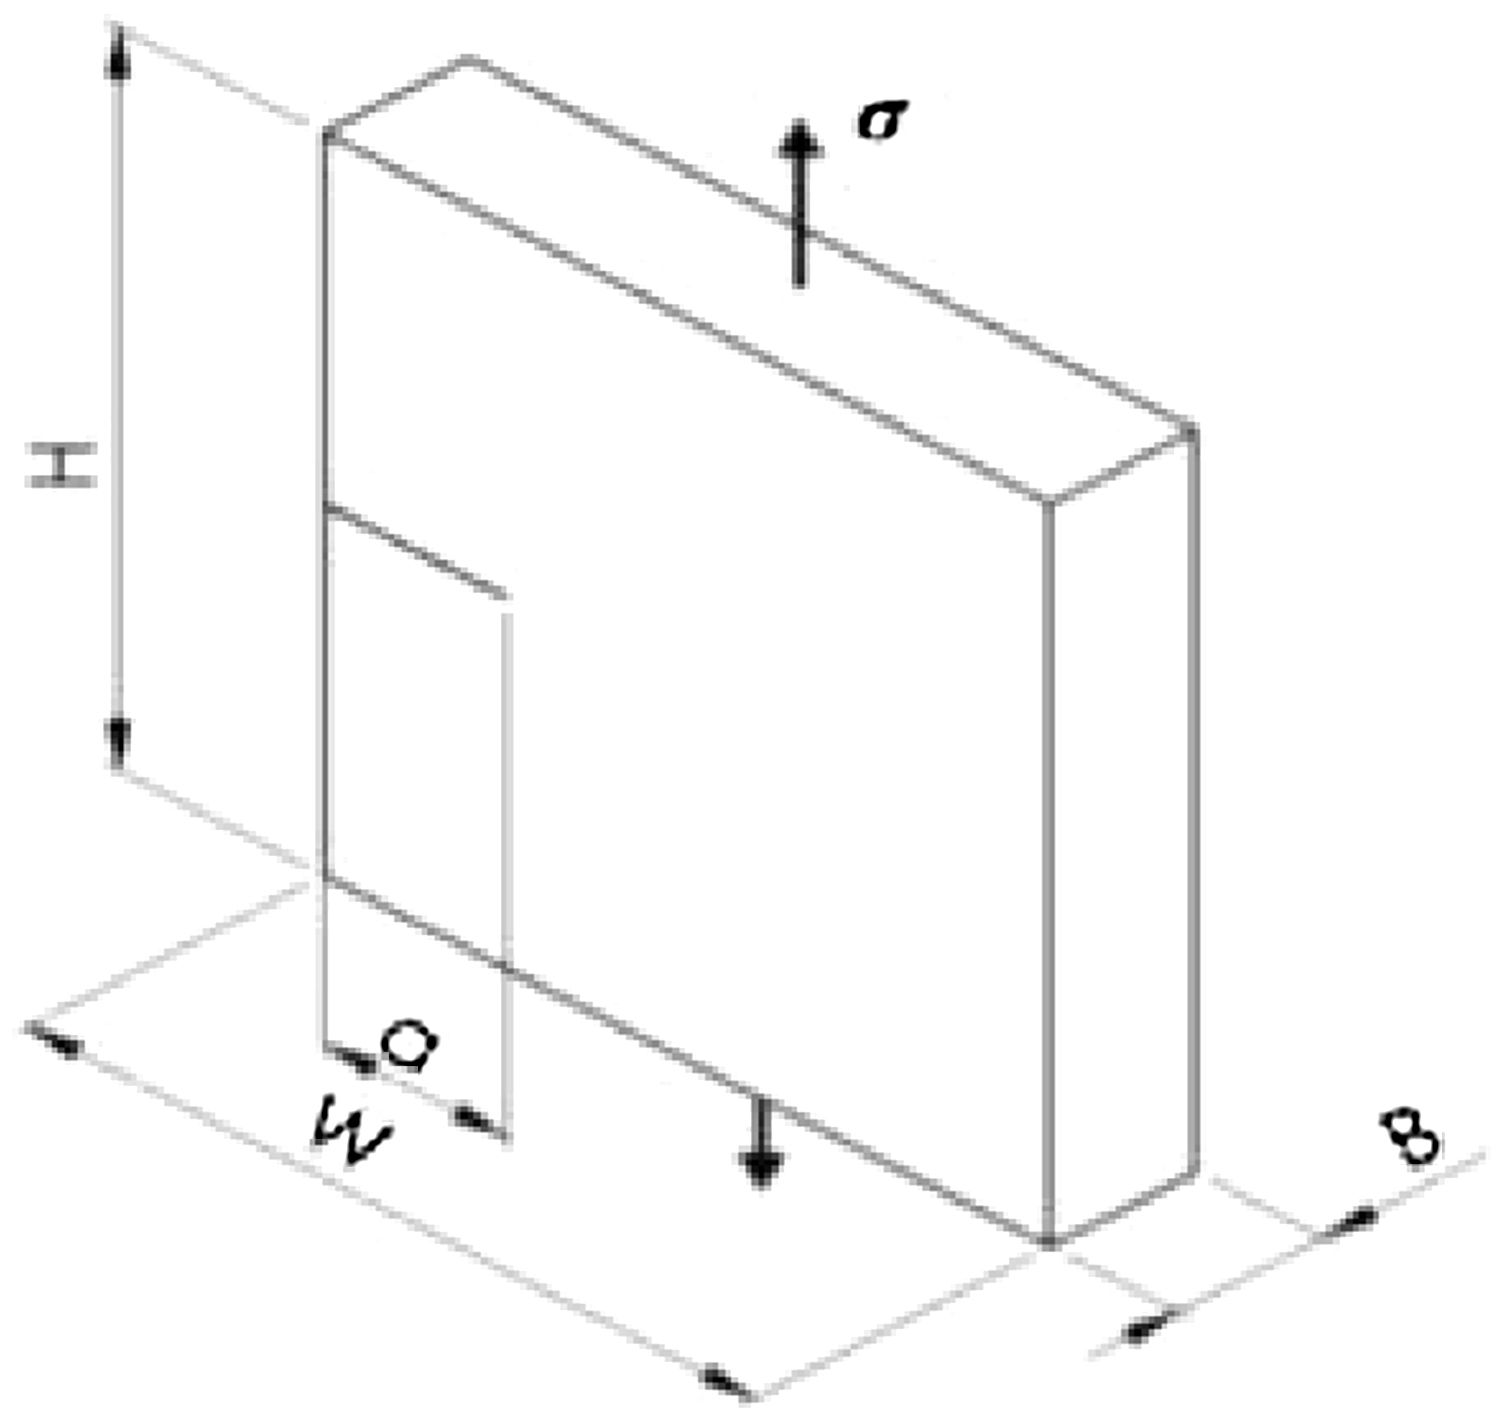
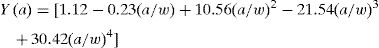
The first analysis seeks to demonstrate the software efficiency, which is based on finite elements, for the fracture mechanics parameter calculation, relating the data obtained computationally with those obtained by the theoretical calculation. In this analysis the SENT test specimen geometry was used with the following parameters for the numerical models: =50, =10, =2 with ranging from [1.0; 1.5; 2.0; 2.5; 3.0] and mesh refinement in three states, low refinement (BF), medium refinement (MF) and high refinement (AF). Knowing that is the height, is the width, is the width of the crack in the end and is the thickness, having as theoretical solution to calculate the intensity factor –, the following relationship proposed by Mohammadi [14]:
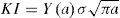
Being Y(a) given by:
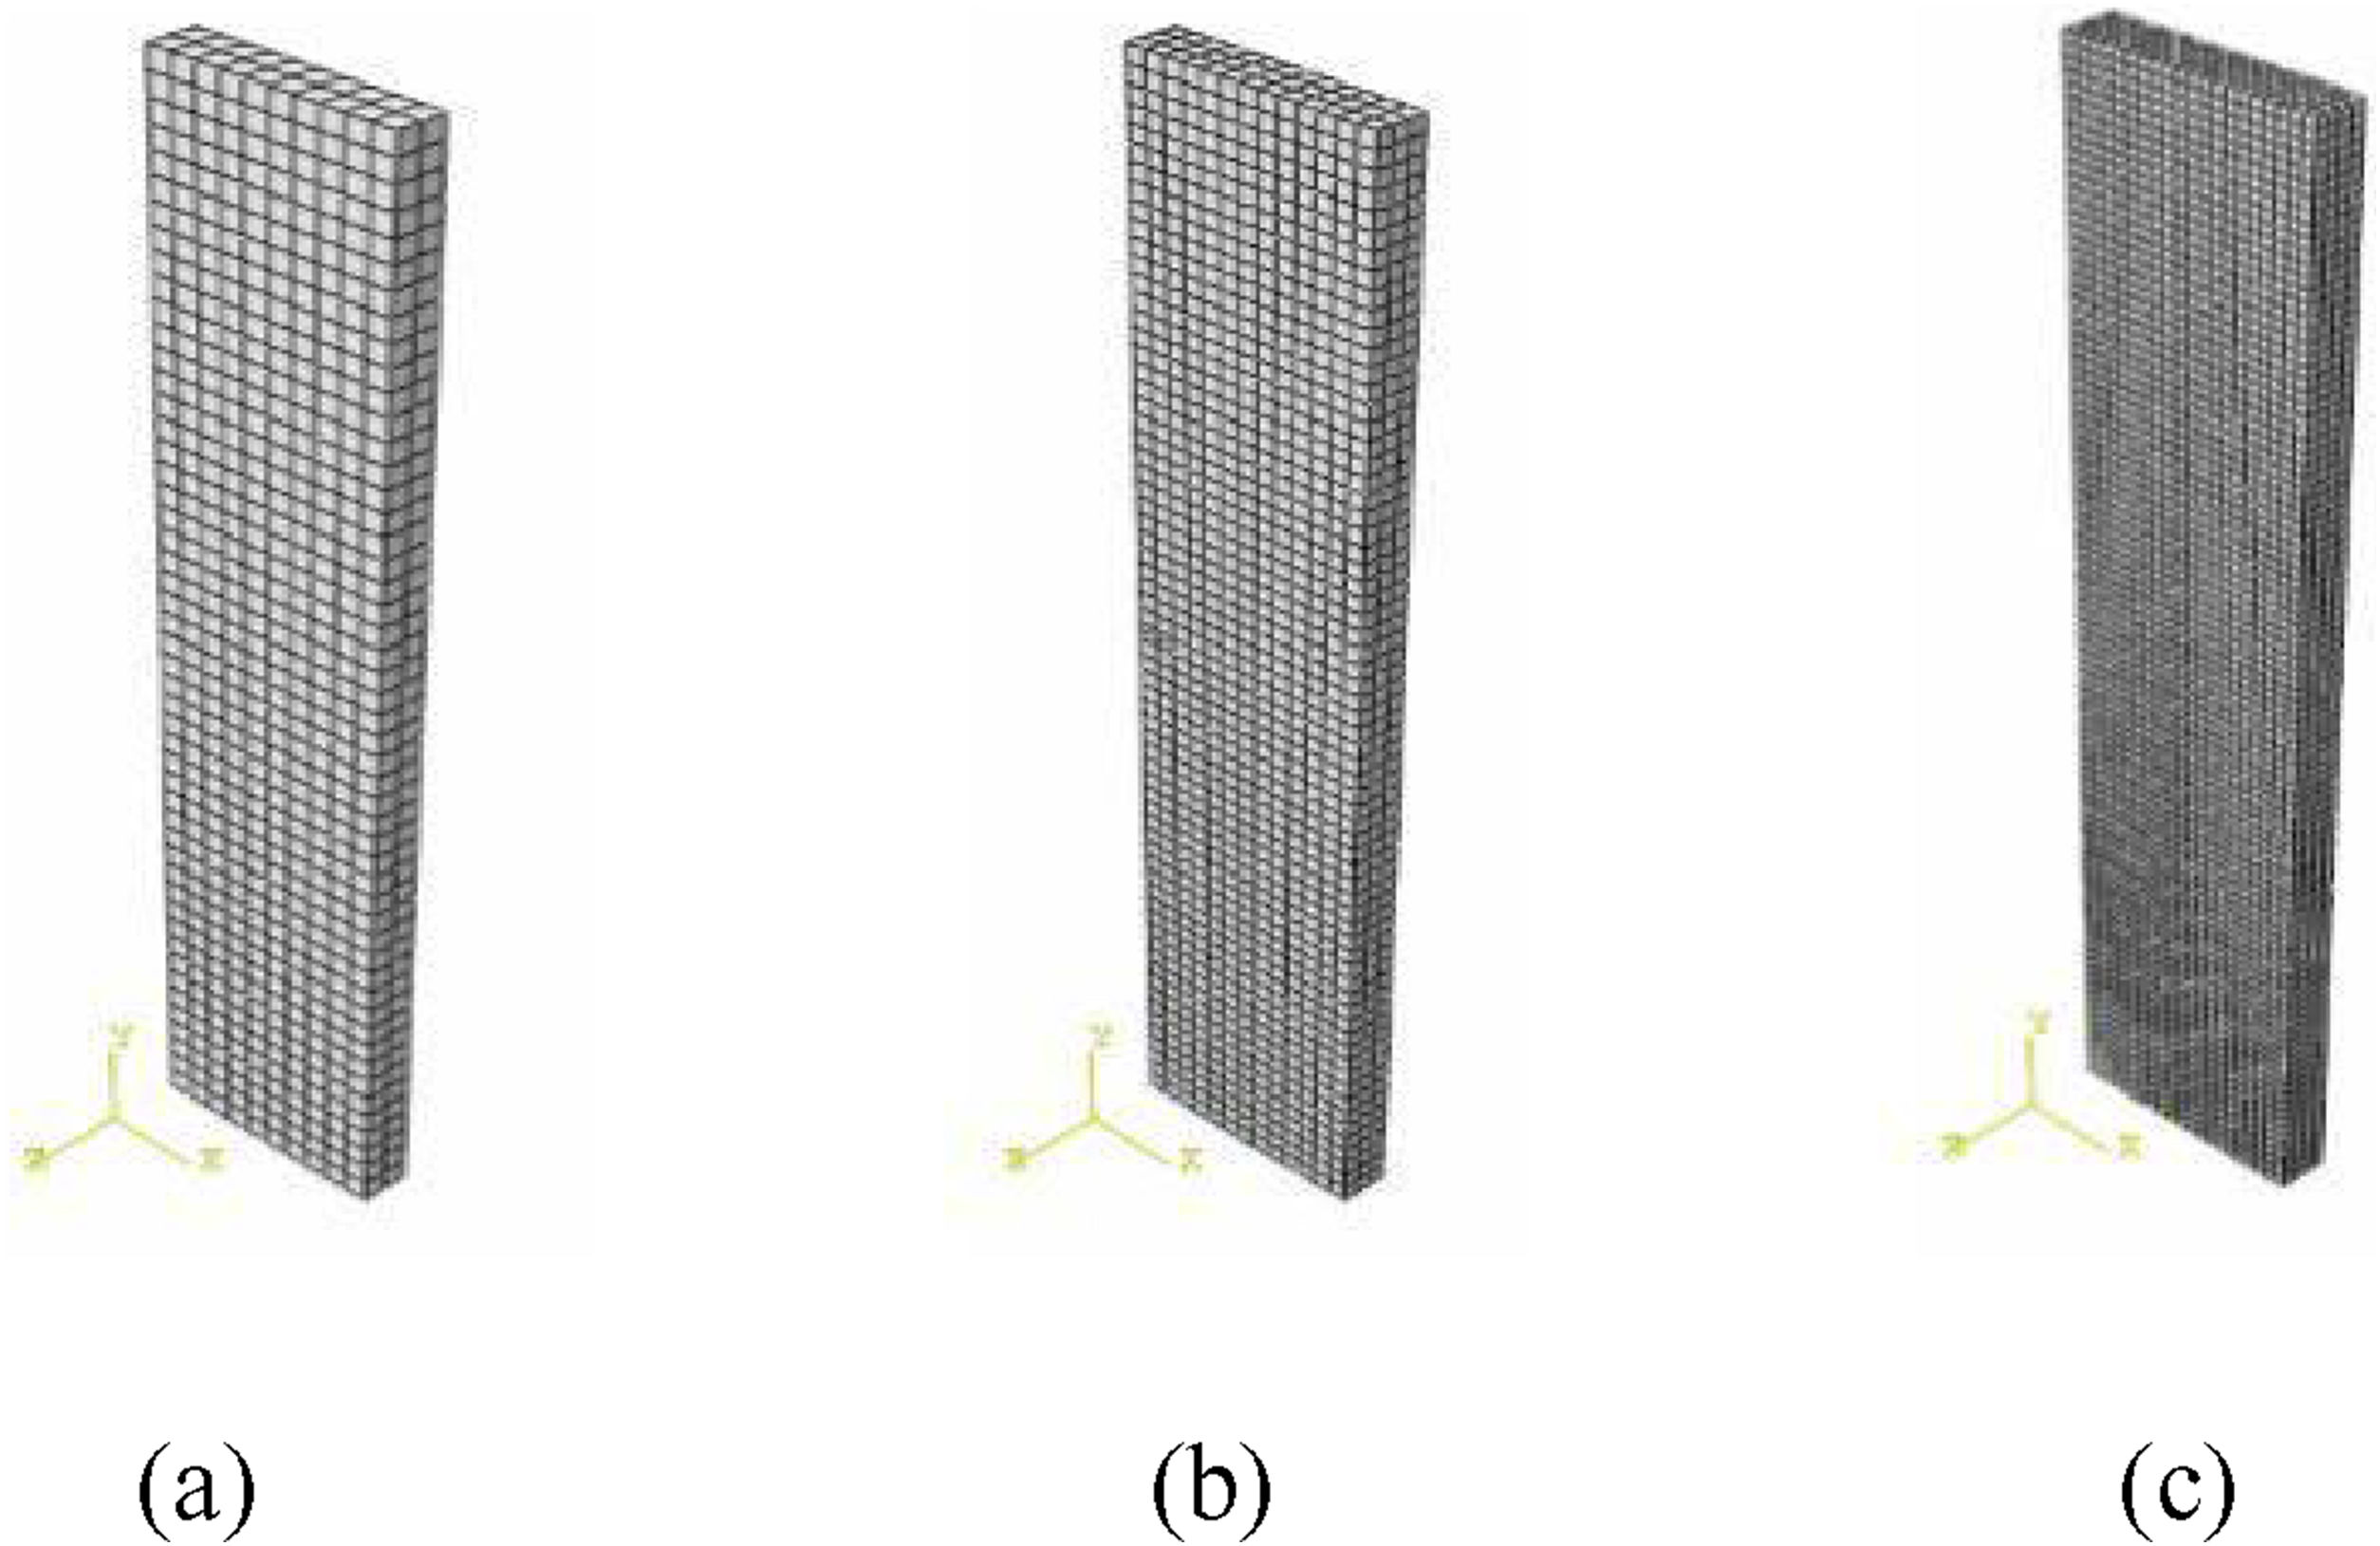
To create the models, the contour conditions took into account only the tensile stress, the following figure has the model with=1.5, representing the refinements adopted in the modeling with the SENT test specimen.
In the computer modeling, the element C3D8 was used, a hexadecimal element with eight nodes, available in the software library, applying a tensile stress of σ=10MPa, being calculated by Eq. (7), making a relation between the calculated stress intensity factor in the program (Kcalc) and the theoretical stress factor (Ktheoretical) by the following equation:

The following table shows the modeling mesh characterization in relation to the refinement, in relation to the W and the Ktheoretical calculated by Eq. (6).
The second analysis dealt with the fracture and propagation of a pre-nucleated crack under pure fracture Mode I, the reinforced PMMA composite hypothesis was adopted as an isotropic solid, using the XFEM tool for the SENT type test body in the software Abaqus.
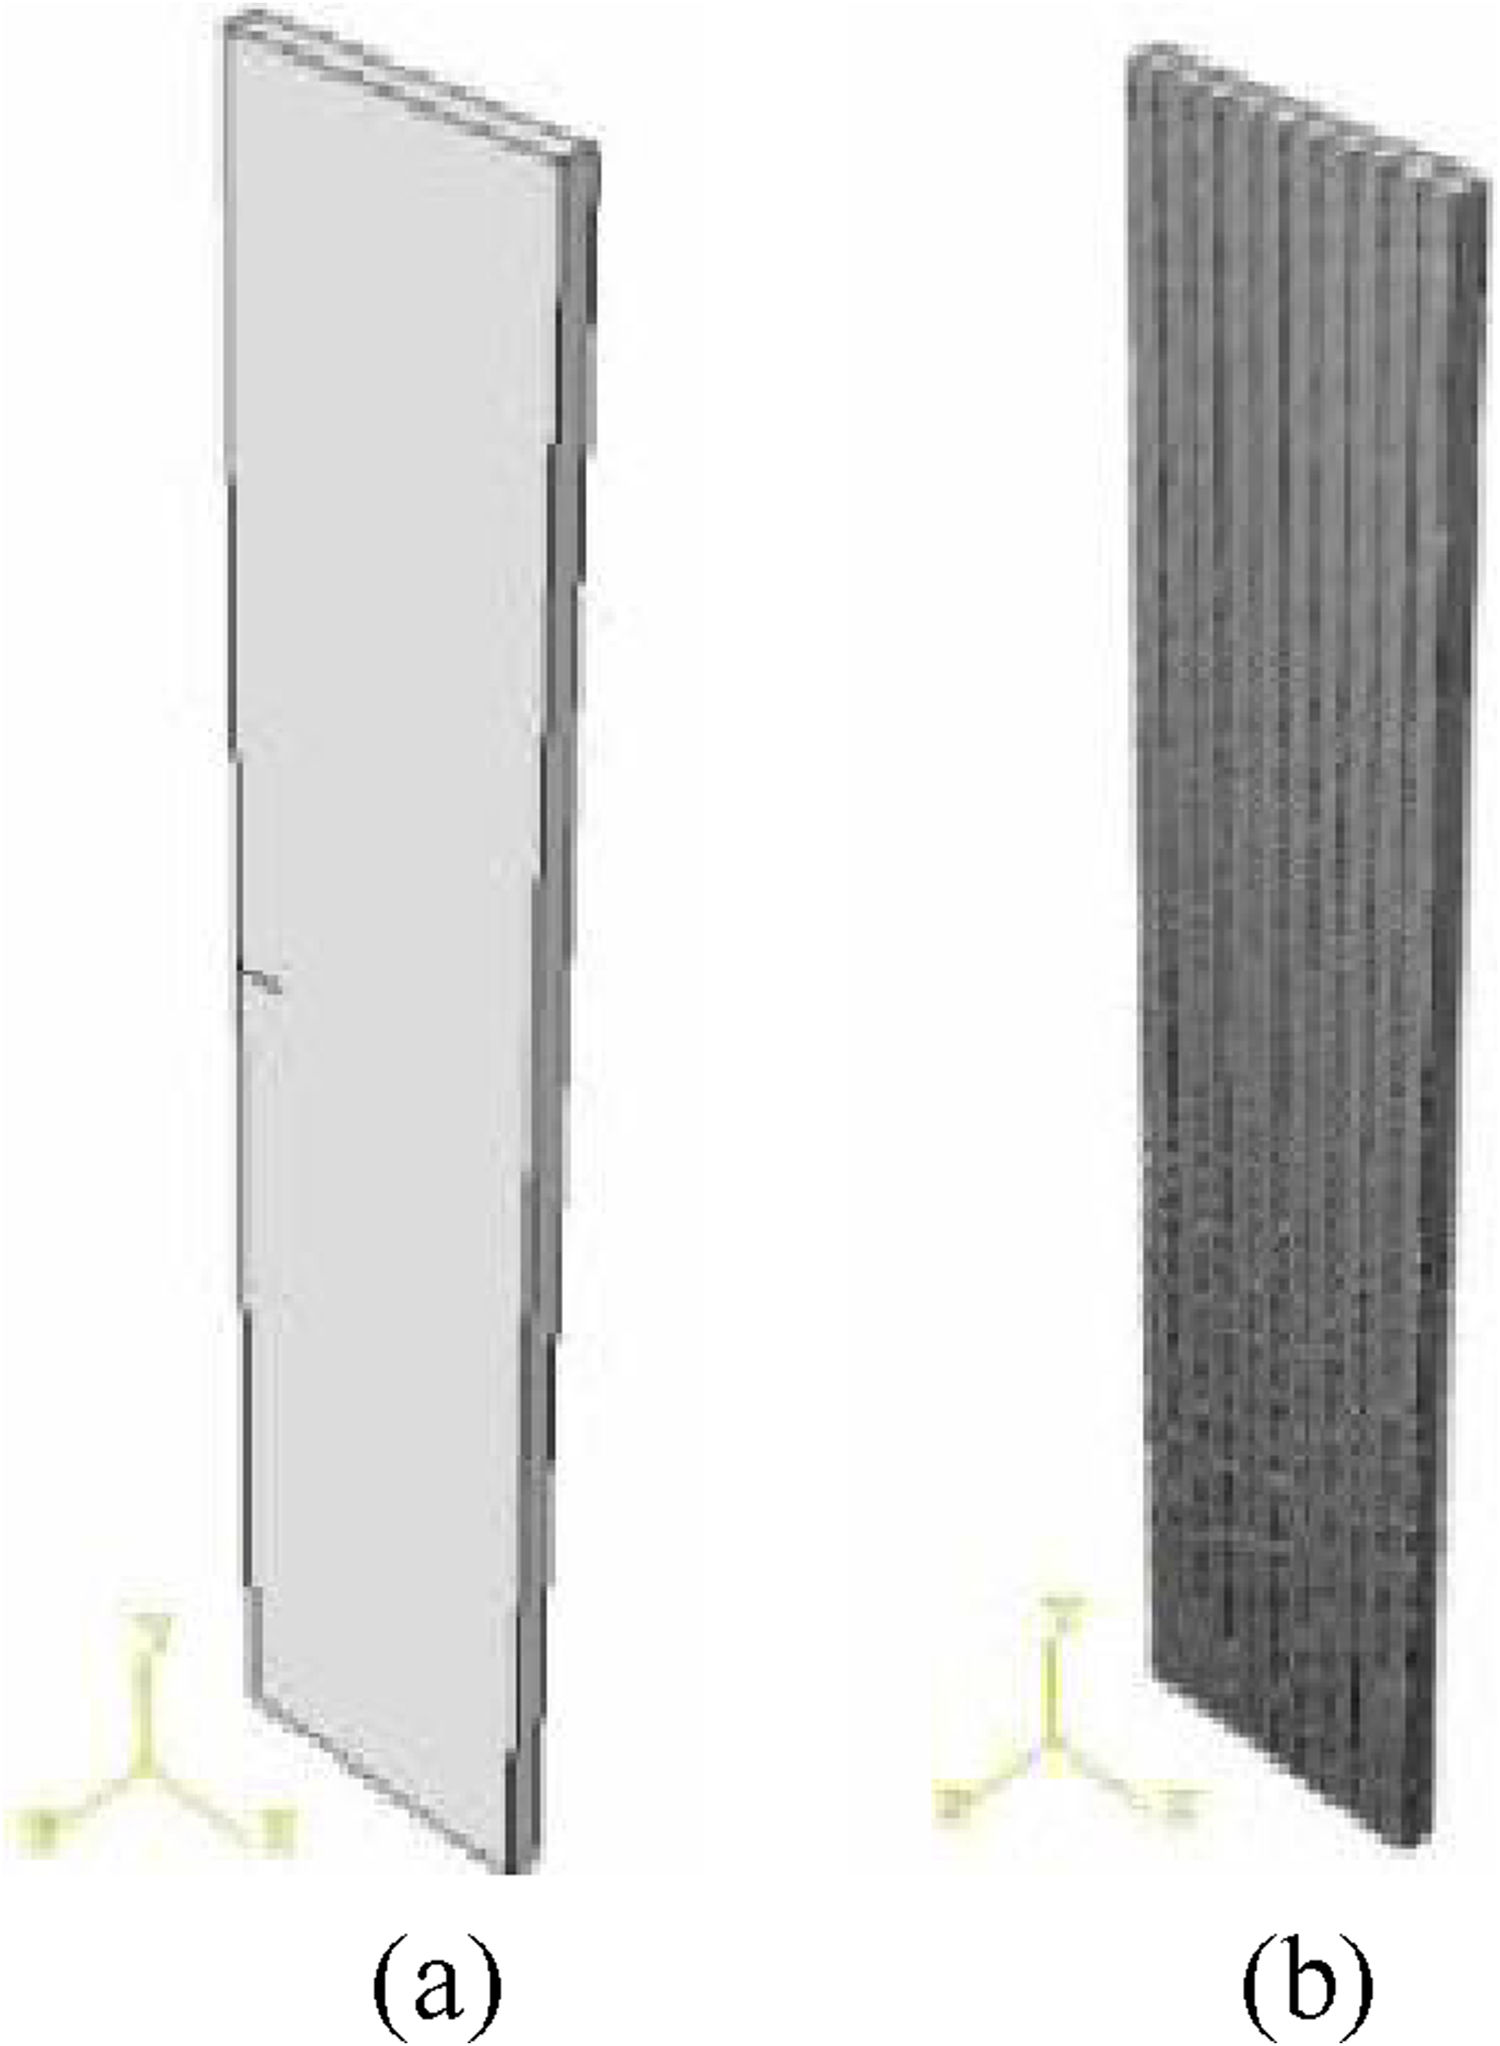
The geometry adopted in the model, as presented in Fig. 20a was: =50, =10, =2 and =1.5 (Fig. 18). The model mechanical properties and the conditions of onset definitions and damage evolution in the model were attributed according to data from the MIT (Massachussetts Institute Technology) and the Marcelo Júnior [1].
 Isotropic solid geometry of the fracture analysis. (b) Highly refined C3D8 element mesh in the fracture model.")
(a) Isotropic solid geometry of the fracture analysis. (b) Highly refined C3D8 element mesh in the fracture model.
The parameters adopted for computational analysis were modulus of elasticity – E=52.8GPa and Poisson coefficient – ν=0.20. As a way of establishing the damage initiation conditions in the enriched region of XFEM, the maximum main stress adopted was σ=65.5MPa.
In the damage evolution definition, its typology was considered as energy and the critical energy release rate=0.5kJm−2 was assigned as the fracture energy parameter. The boundary conditions were established so that the model suffered only uniaxial traction, a loading of σ=80MPa was applied and for discretization of the high refinement mesh, the finite element C3D8 was used, as shown in the figures below (Figs. 21 and 22).


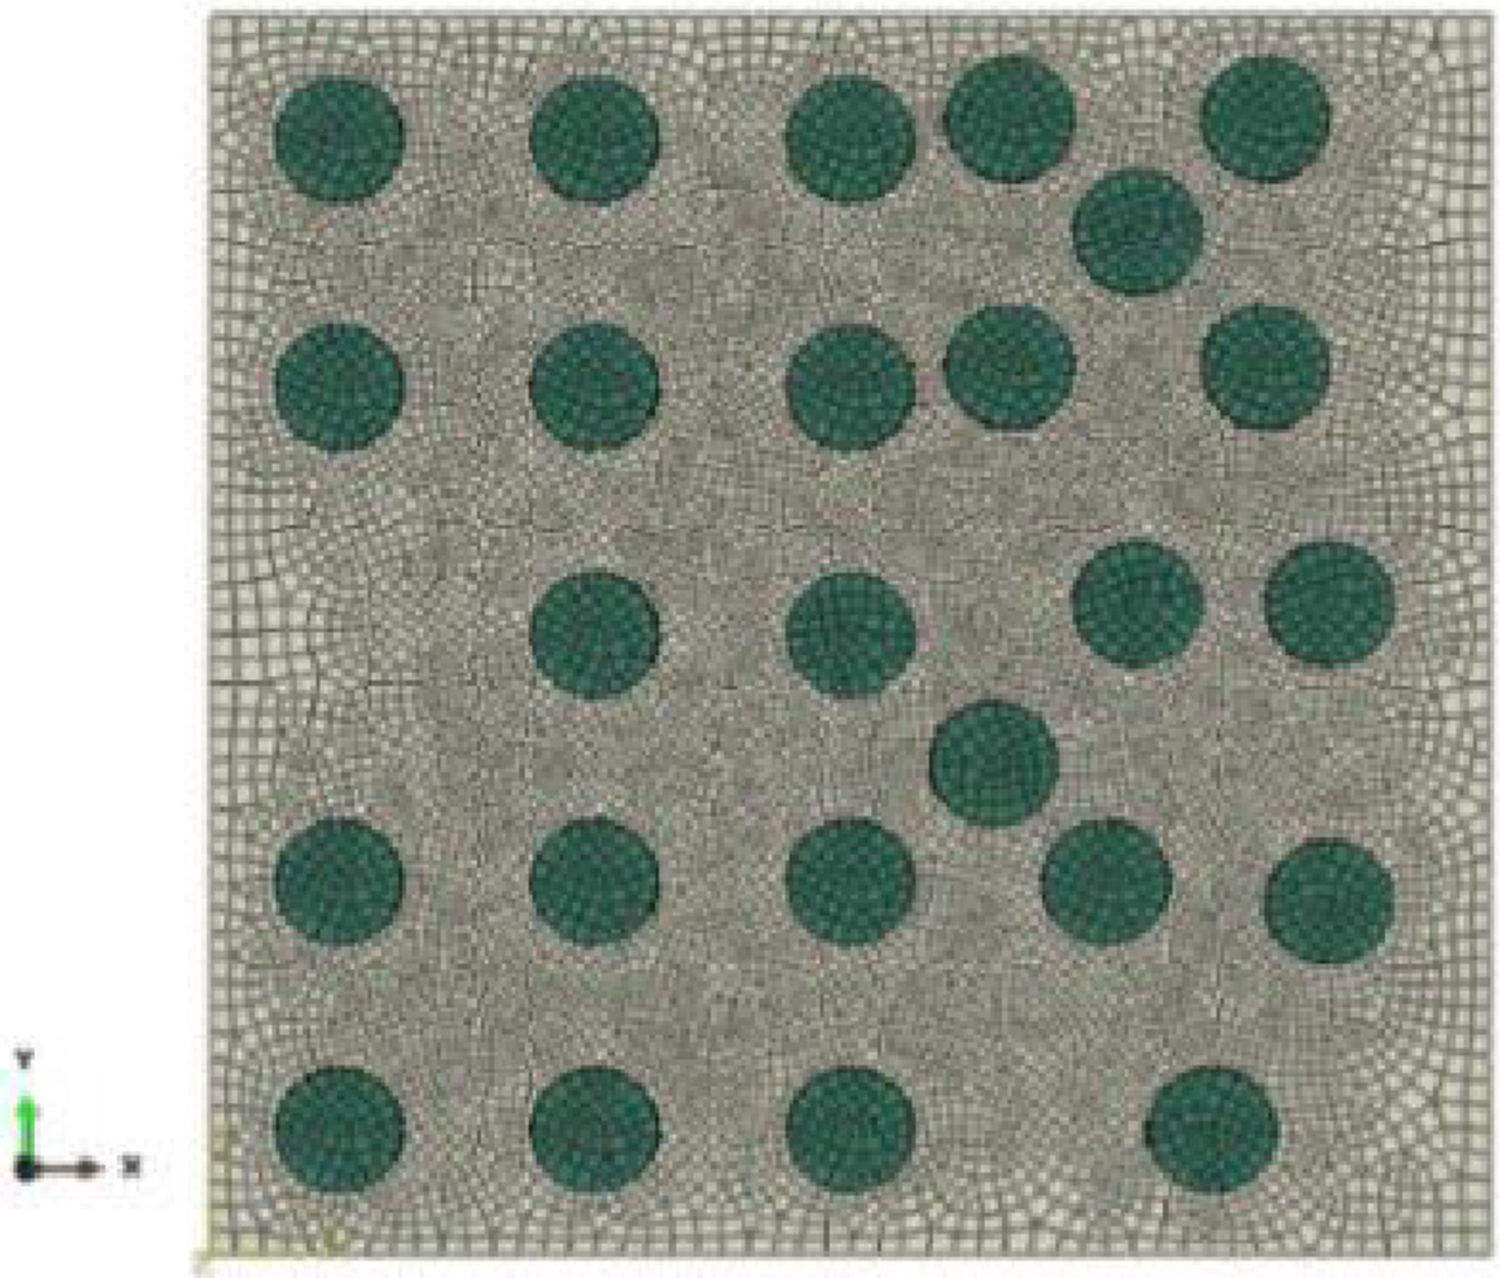
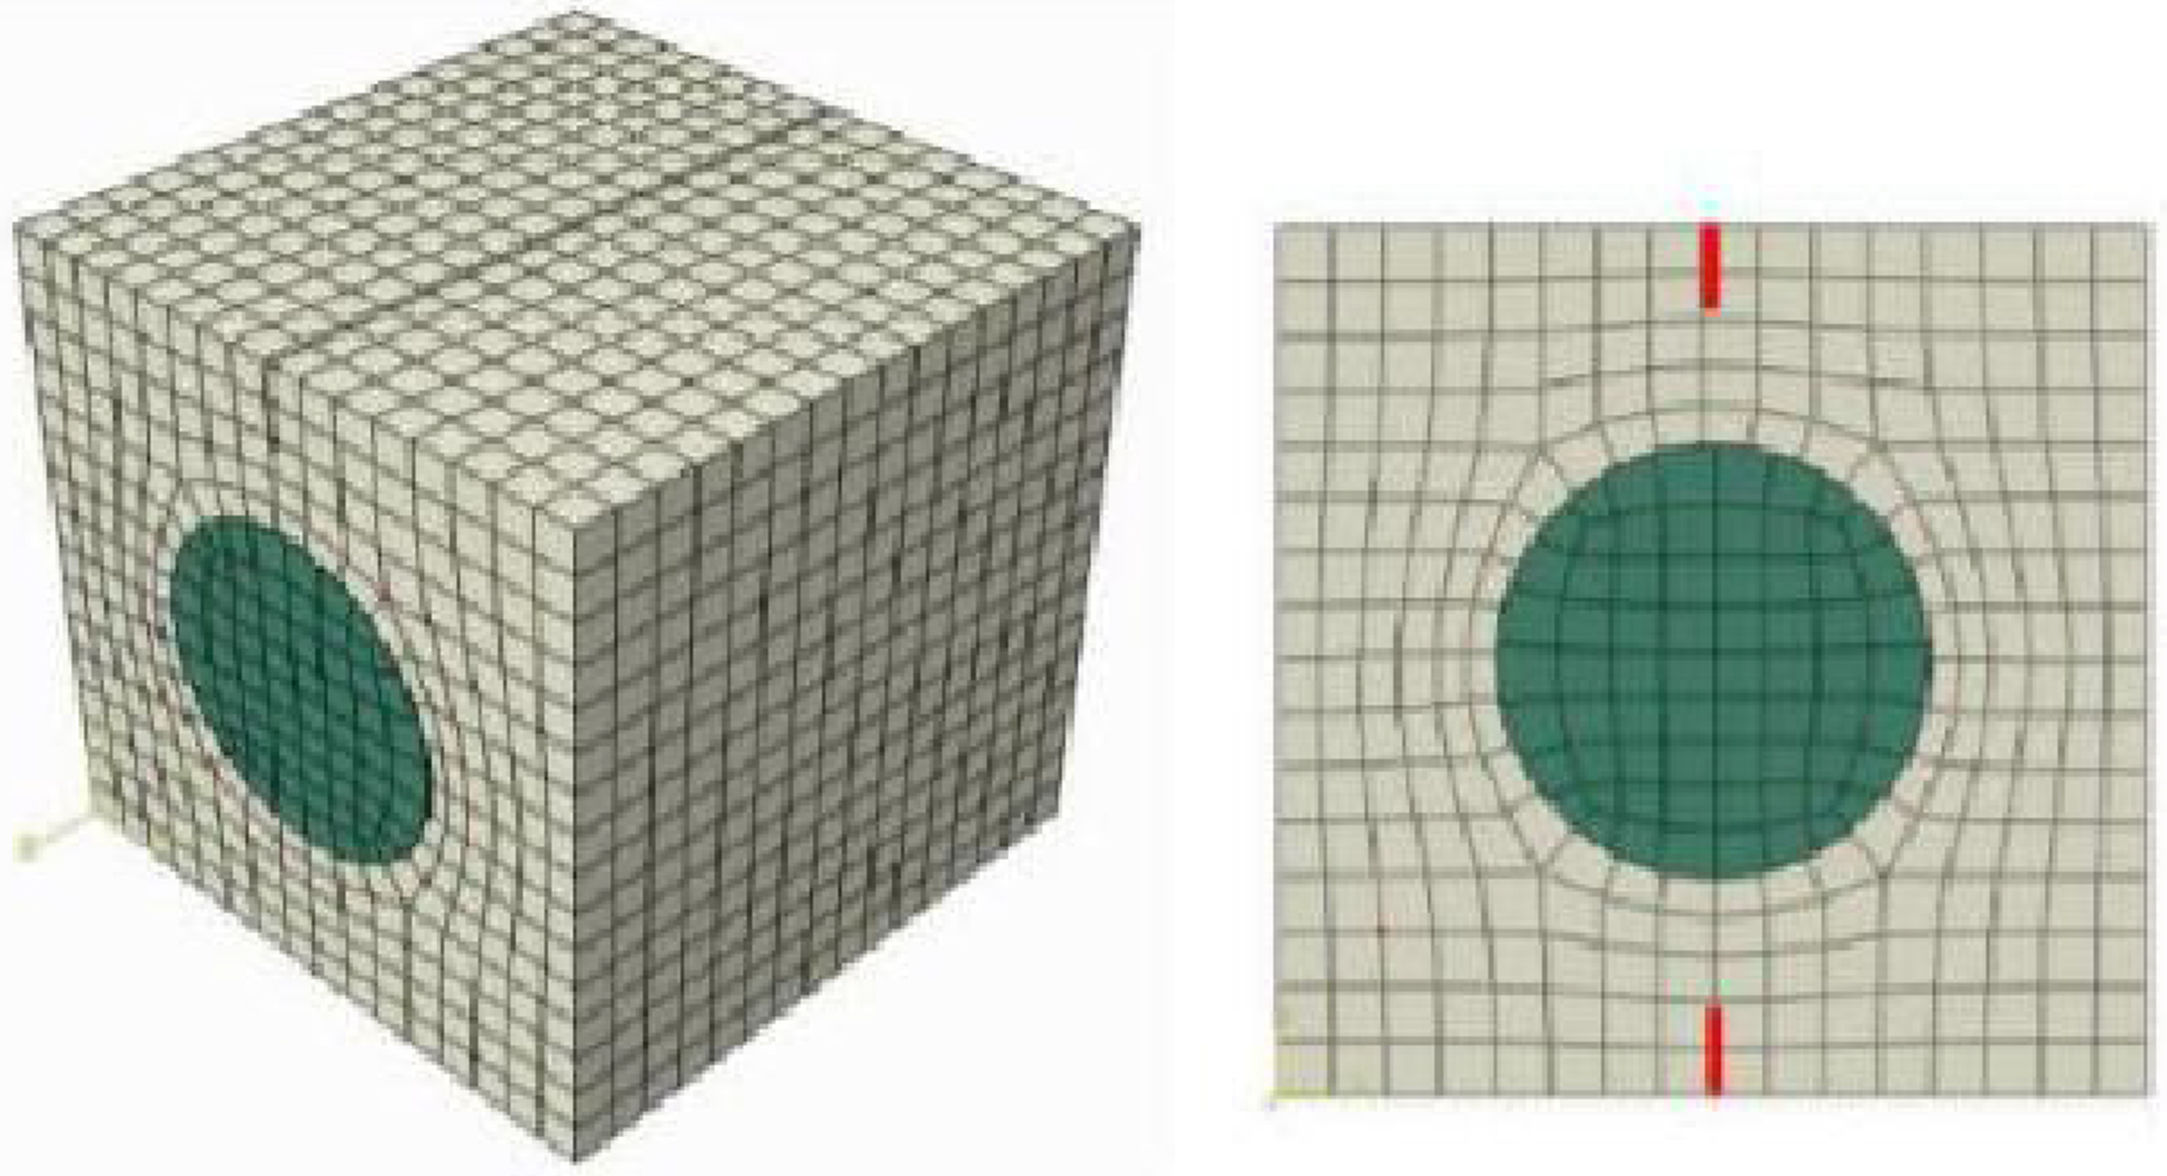
Representative element volume with E-glass fiber modeling incorporated into PMMA polymer matrix with pre-nucleated cracks – lines in red.
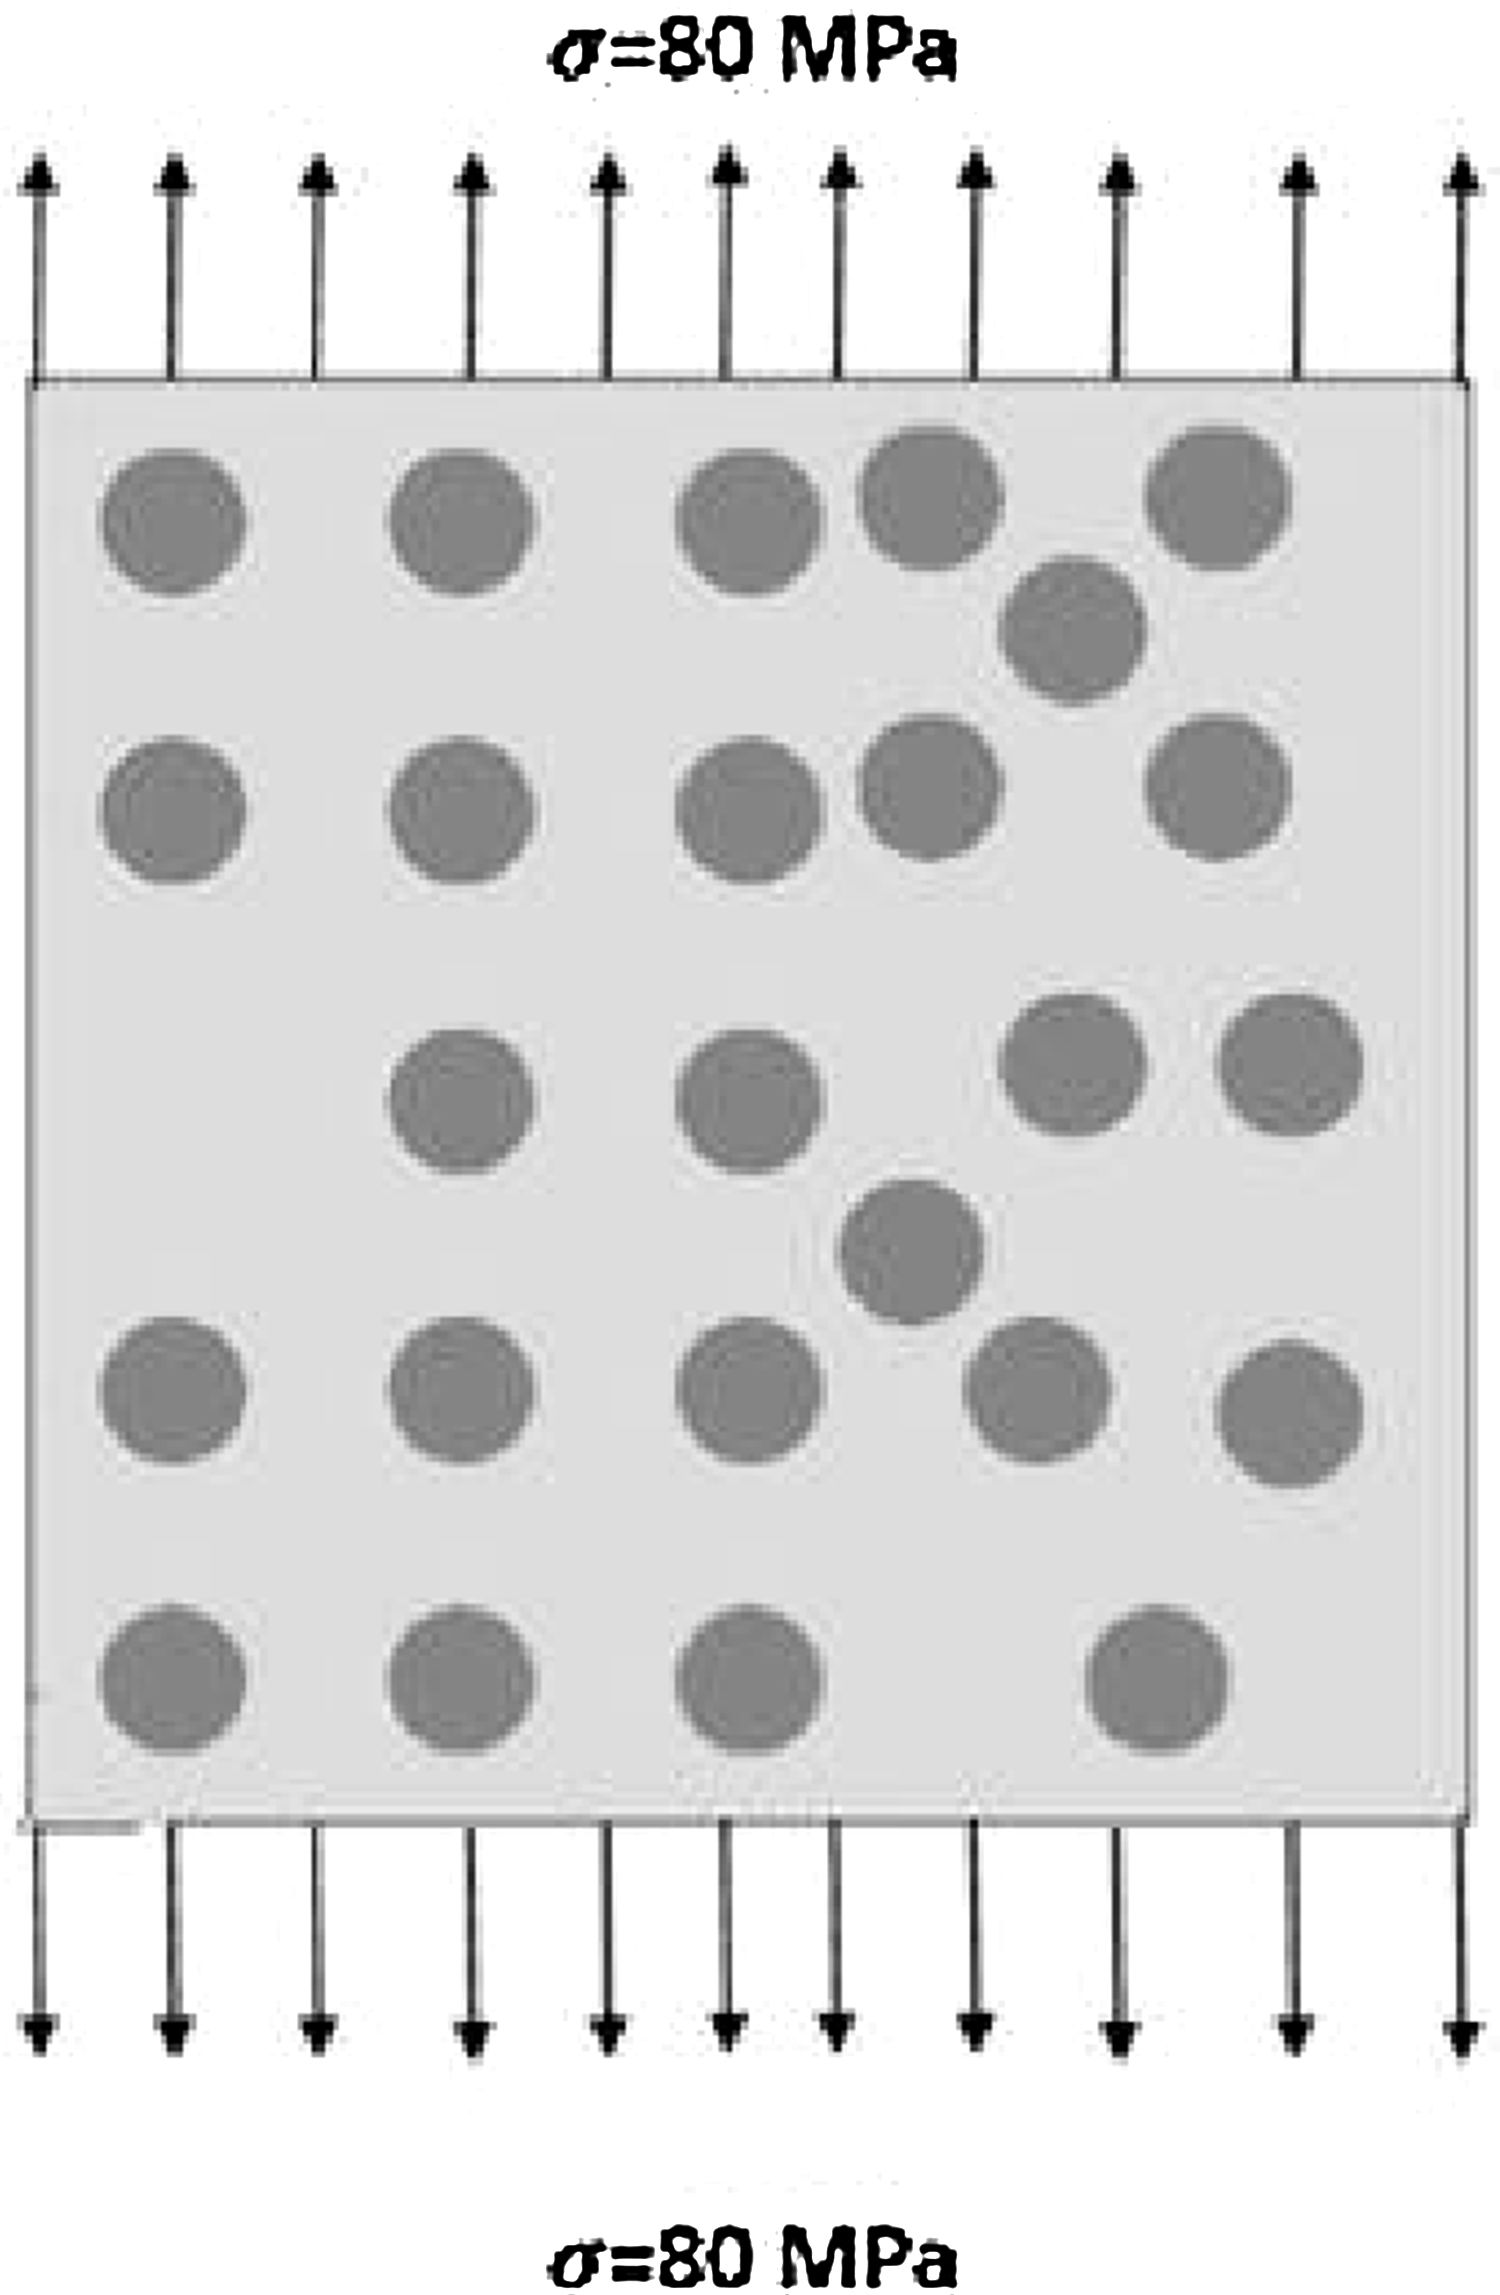
In the last analysis, the following numerical models were designed: multiple fiber model, randomly distributed and incorporated into the polymer matrix under tensile stress; representative volume element (RVE) modeling of the fiber incorporated in the matrix also under fracture Mode I. In addition, the stresses, the E-glass fiber integrity and PMMA polymer matrix, as well as the materials interface were analyzed, allowing the behavior observation in the same ones fracture.
According [2], the table below shows the materials mechanical properties in the modeling and the fracture criterion of the three models.
The two numerical models geometry, as well as their meshes discretization in C3D8 elements, are presented shown below.
The tensions applied in the models were the same as in the second analysis, of σ=80MPa. As considered in the previous computational analysis, the boundary conditions were considered only the normal tensile stress in the simulations, according to Fig. 21.
In the contact region between the fiber and matrix surfaces, Abaqus software reported surface-to-surface contact, restricting the matrix nodes movement between the fiber nodes. For the contact interaction properties, we defined – tangential behavior without friction (frictionless), representing the fiber incorporated in the matrix; and normal behavior with hard contact between materials, preventing them from separating after contact.
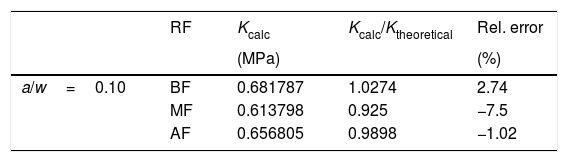
5Results and discussionsIn the first analysis, fifteen numerical simulations were performed, the tension intensity factor being calculated through Abaqus software and related to the theoretical intensity factor by Eq. (6). The obtained results took into account the crack length, the width and the relation/, being organized in the following tables.
Analyzing the tables, it is observed that the values obtained are very close to those obtained by the literature theoretical methods. In addition, it is noted that the relative error between the Kcalc and the Ktheoretical is smaller as the used element mesh refinement in the modeling is increased. In this way, it is verified what was already predicted, the greater the mesh discretization, the more accurate the results obtained in the numerical simulations.
However, it is necessary to clarify that the computational effort increase is proportional to the mesh of elements discretization, always having to maintain a balance of the same ones to obtain accurate results and to guarantee the data processing agility.
As can be seen in table (a/w→0.10), the percentage relative error in module is only 1.02%, for model high refinement with relation/=0.10, demonstrating the efficiency software for fracture analysis. The largest difference between the results with mesh high refinement can be seen in the table (a/w→0.25), showing a relative percentage error in module of 16%, however it presents a reasonable proximity to the theoretical value.
During the second analysis, fracture behavior was investigated in a model of polymethyl methacrylate polymer composite – E-glass fiber reinforced PMMA, considering the solid to be isotropic, where a pre-nucleated crack of=1.5 model was modeled, implementing the Abaqus software XFEM tool to simulate the crack propagation.
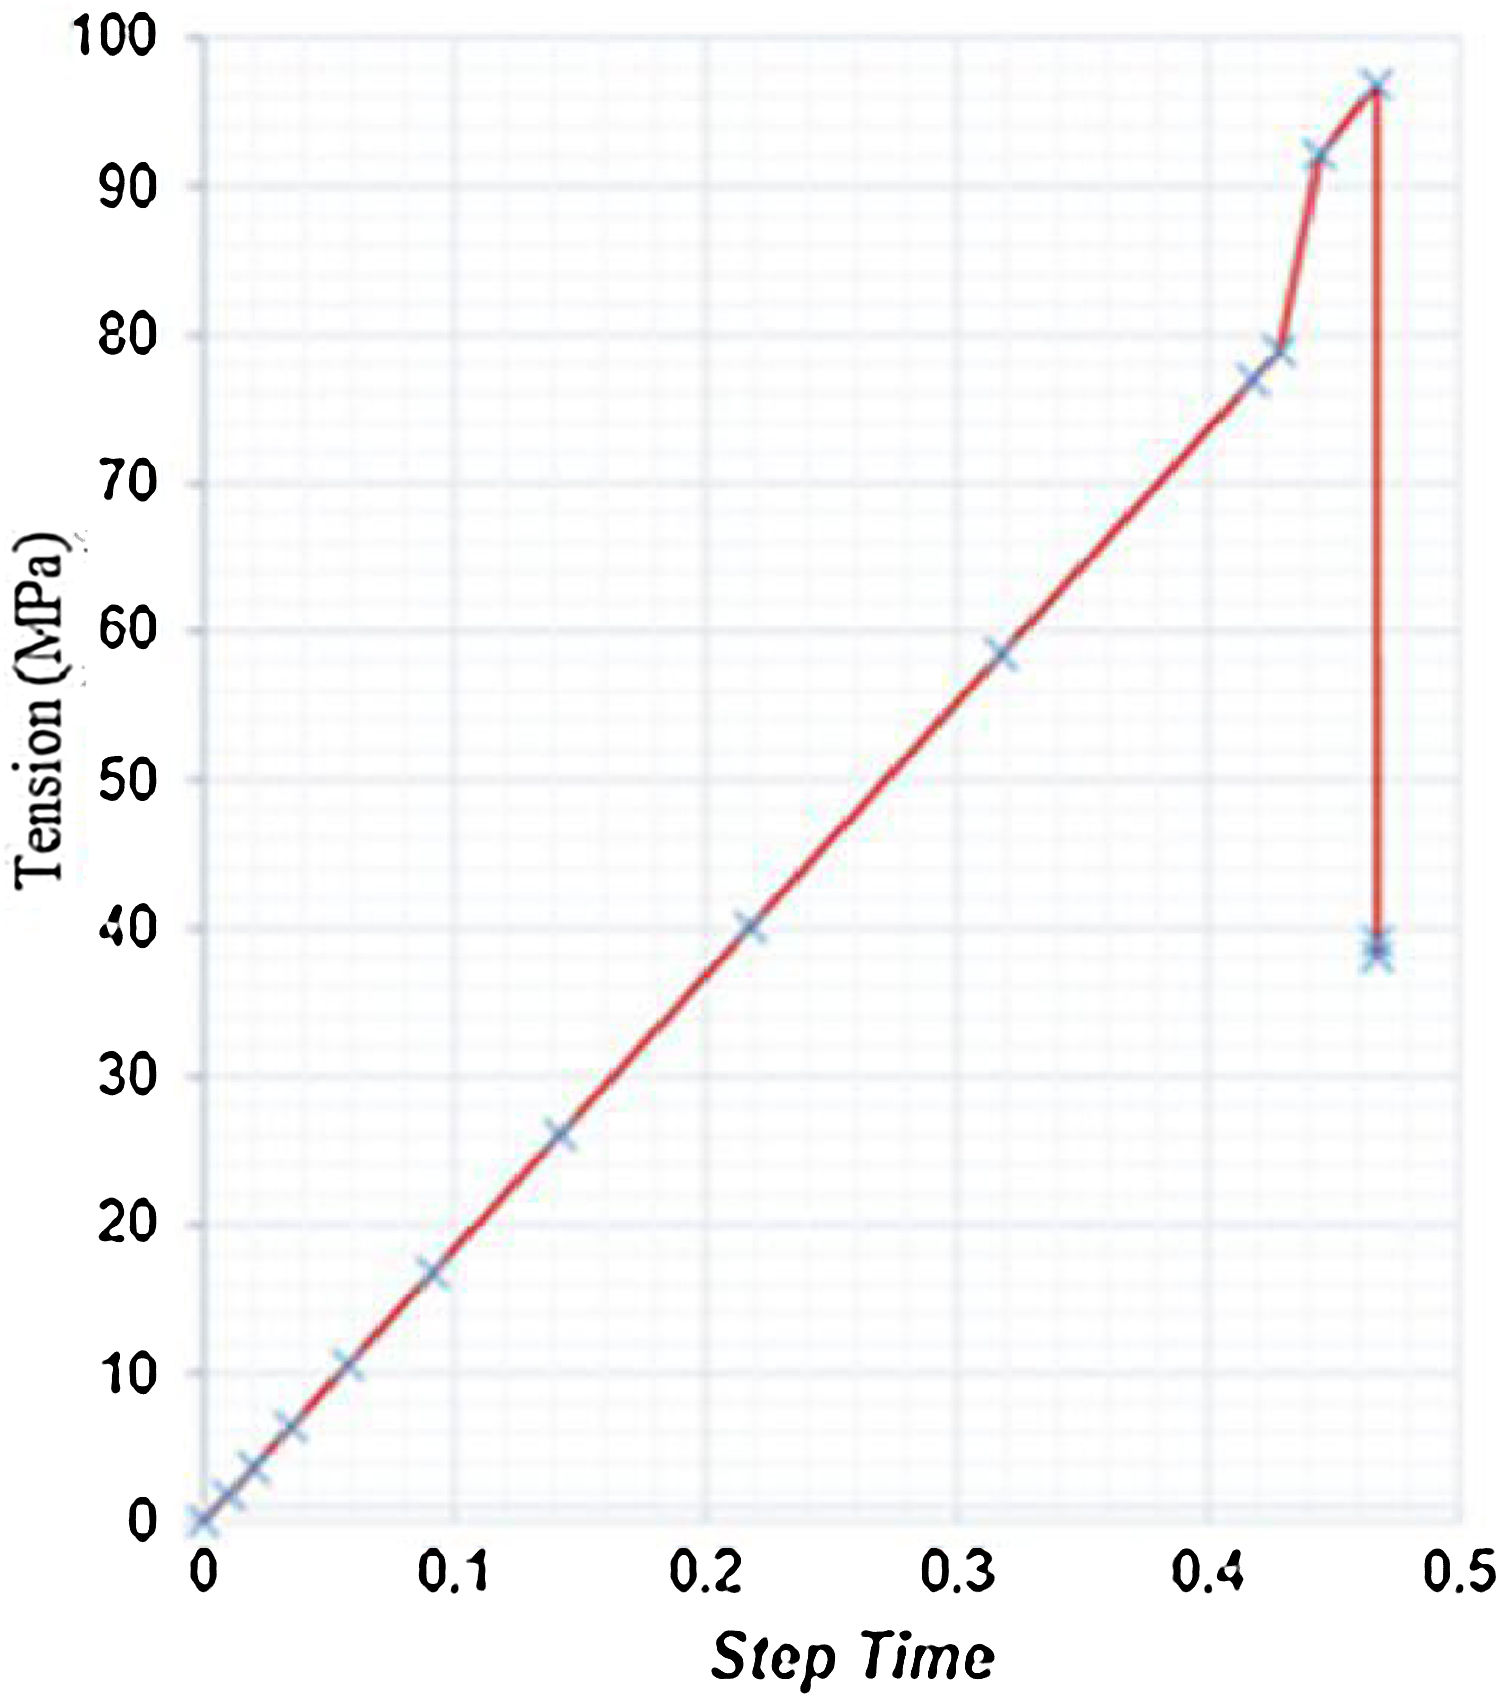
According to the simulations results, can be seen in Fig. 23a a tension peak of σ=71.66MPa at the pre-nucleated crack tip can be observed at the simulation beginning, which characterizes the voltage related to the polymer matrix rupture predates your fracturing. By analyzing the node at the crack tip, before its fracture, it is noticed that after reaching the polymer matrix rupture tension, a sudden tension drop occurs, associated to the atomic bonds breaking at this node, that is a loss of its mechanical resistance and release of energy to form new crack surfaces, characterizing its propagation, as can be seen in the following graph (Figs. 24–30).

Tension scheme applied in the third analysis. Crack propagation in the second analysis model.


Graph tension×step time at the tip of the pre-nucleated crack in the second analysis.

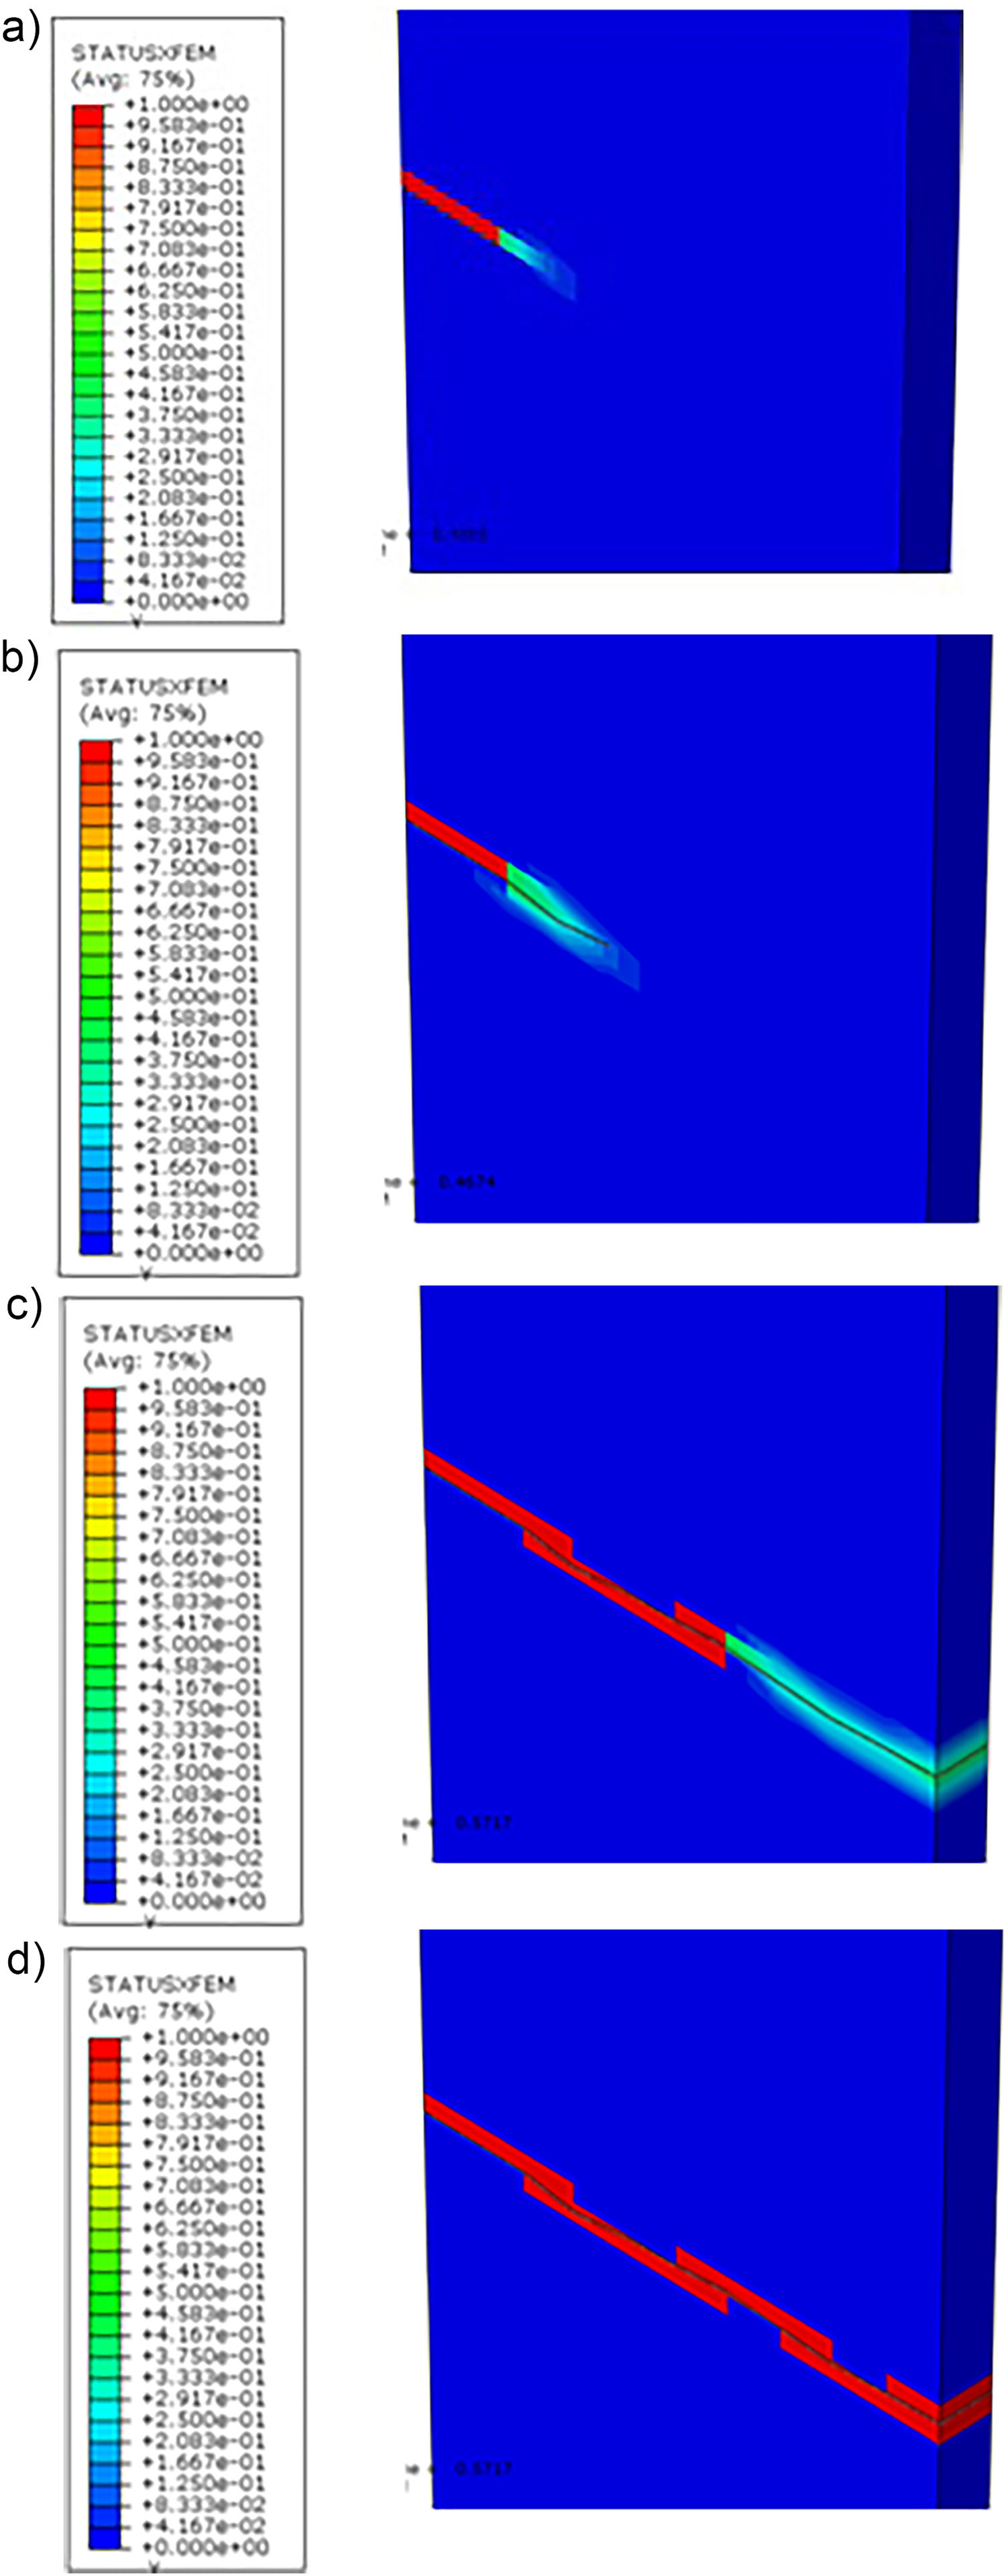
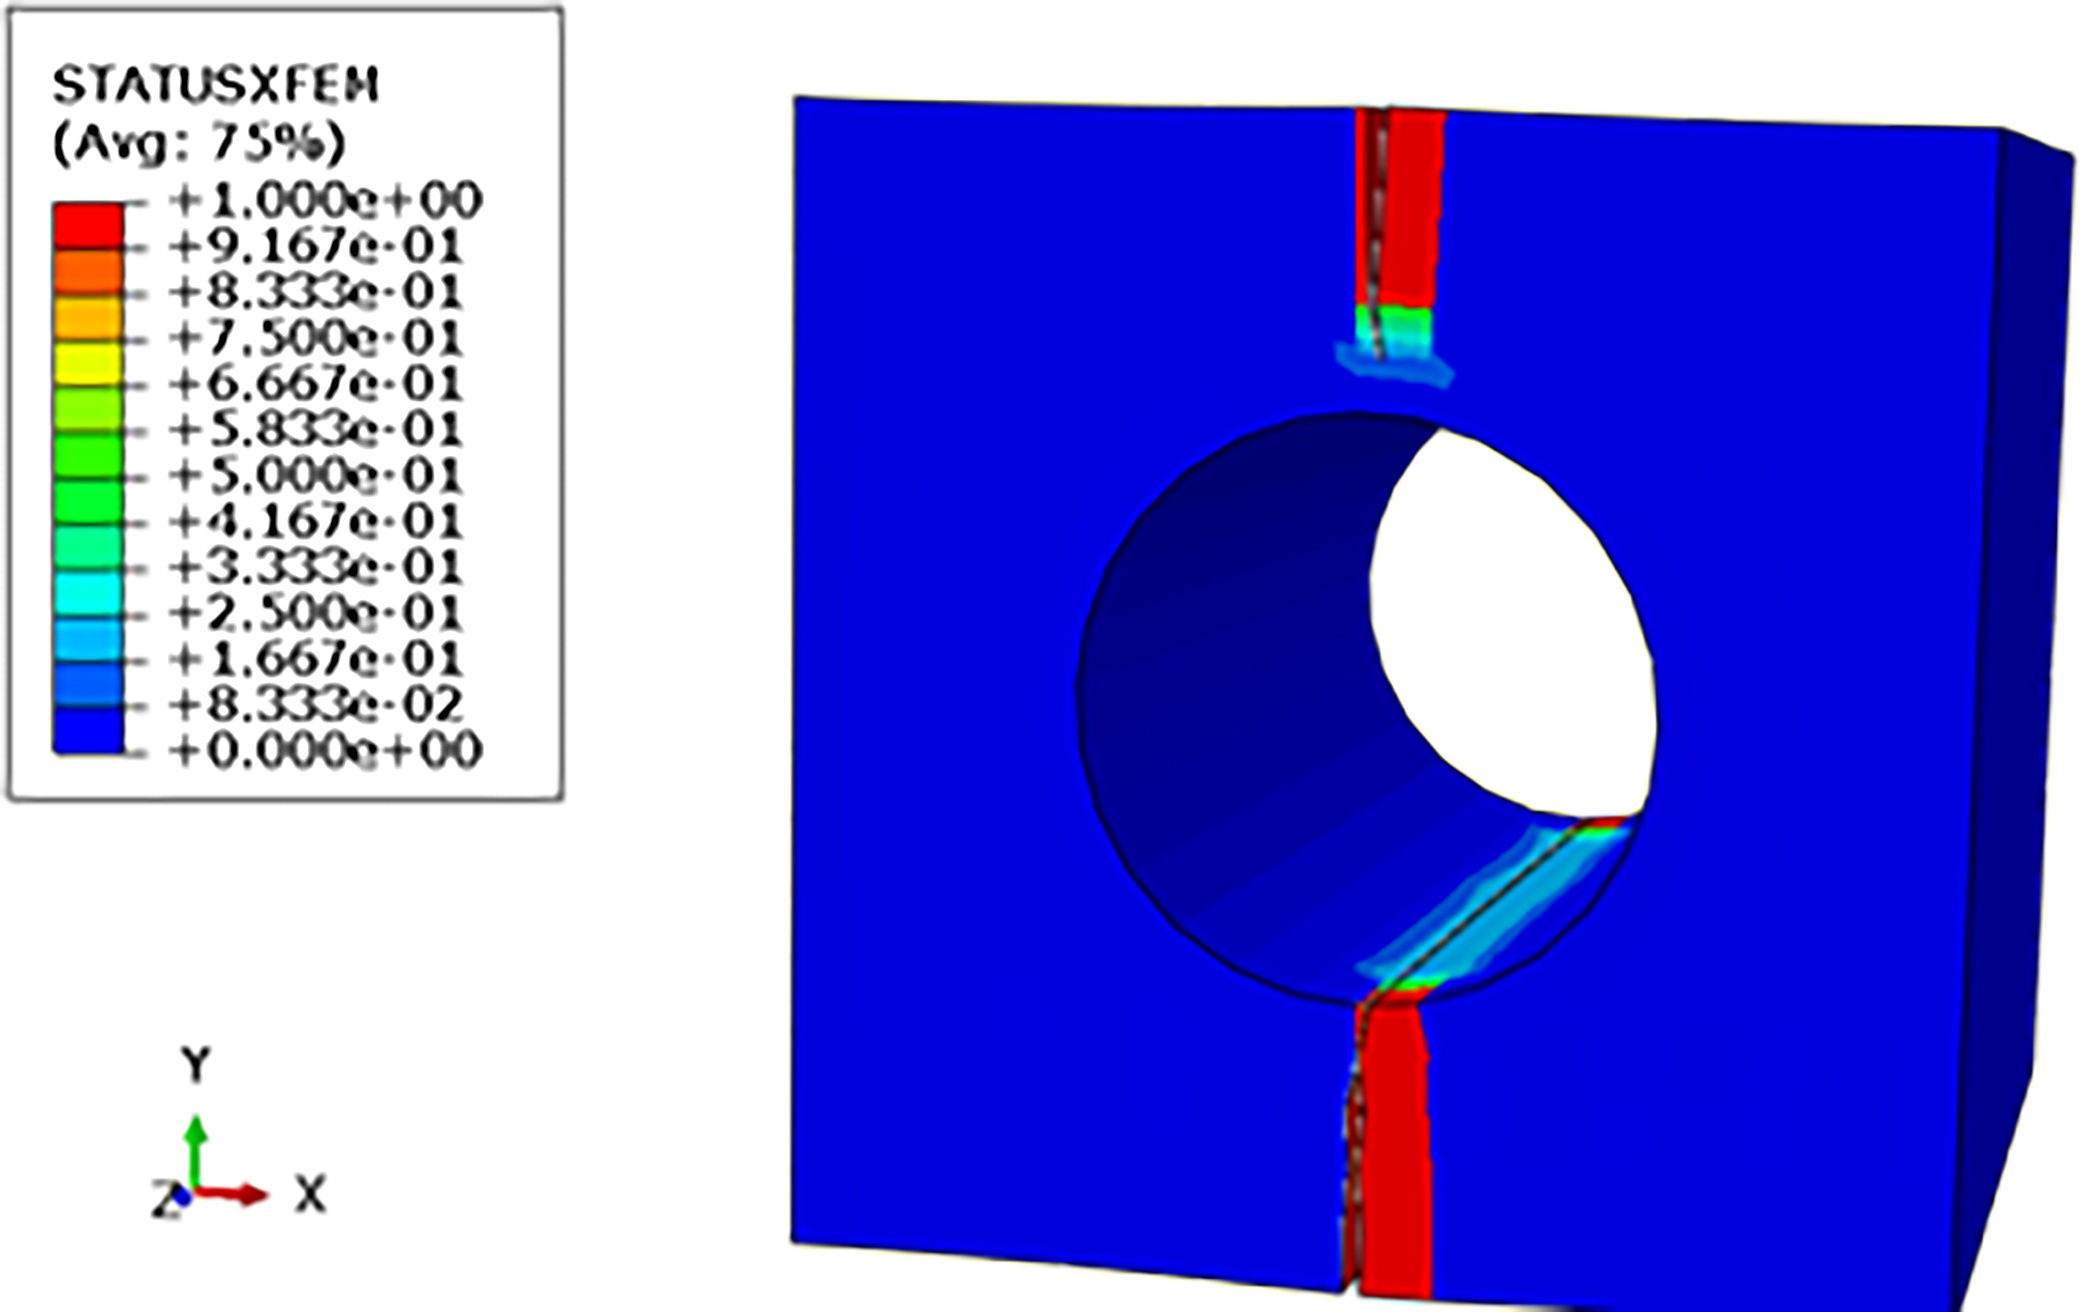
STATUSXFEM view mode in the Abaqus software in the second analysis.


We can also observe the tensions migration and a new concentration of them around the new crack after a first propagation (Fig. 24b). In Fig. 24c, it can be verified the solid under analysis total rupture, with model total rupture stresses of σ=465.20MPa, a value close to that found experimentally by Marcelo Júnior [1], presenting a percentage relative error of 3.02% with reference to the experimental data.
In order to observe the damage in the model, we analyzed the STATUS X FEM visualization mode in the software used results. In this mode, 0 means the material in its integral state, and 1 represents the fully degraded material, according to Fig. 25 along the crack propagation in the simulation. Immediately it is verified that in the crack propagation there is no total material degradation and loss of its mechanical resistance (Fig. 25b and c). Relating these results to the fact that there is no atomic bonds total rupture, it becomes evident that material degradation occurs gradually.
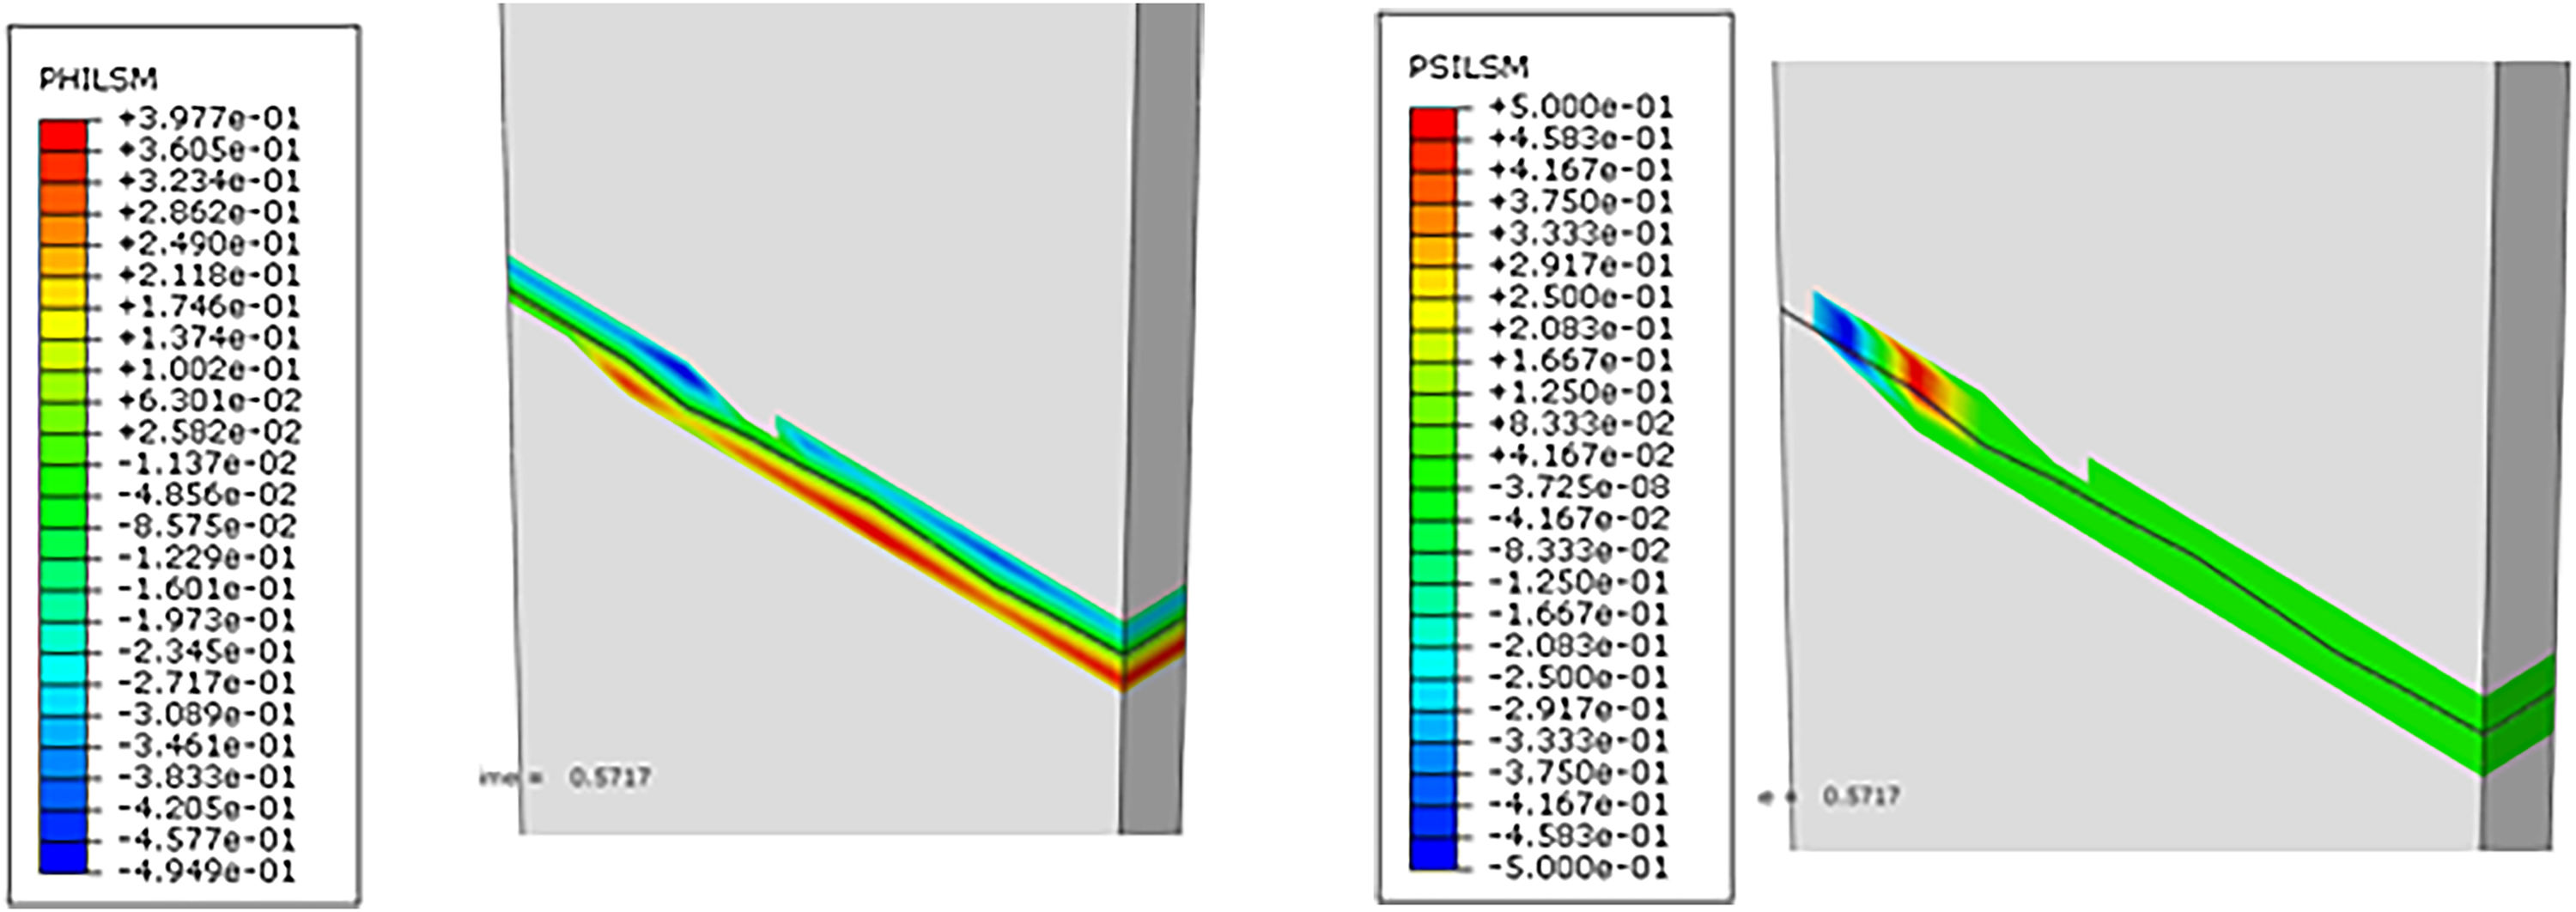
In the figures below, we find the enriched nodes domain in the XFEM and the crack location through the normal and tangential set-level functions by the PHILSM (φ – level set method) and PSILSM (ψ – level set method), respectively. It is observed that the enriched nodes, even all material being subjected to the fracturing, restrict their domain only around the crack, demonstrating the XFEM tool algorithm efficiency in delimiting the problem solution and facilitating the data processing.
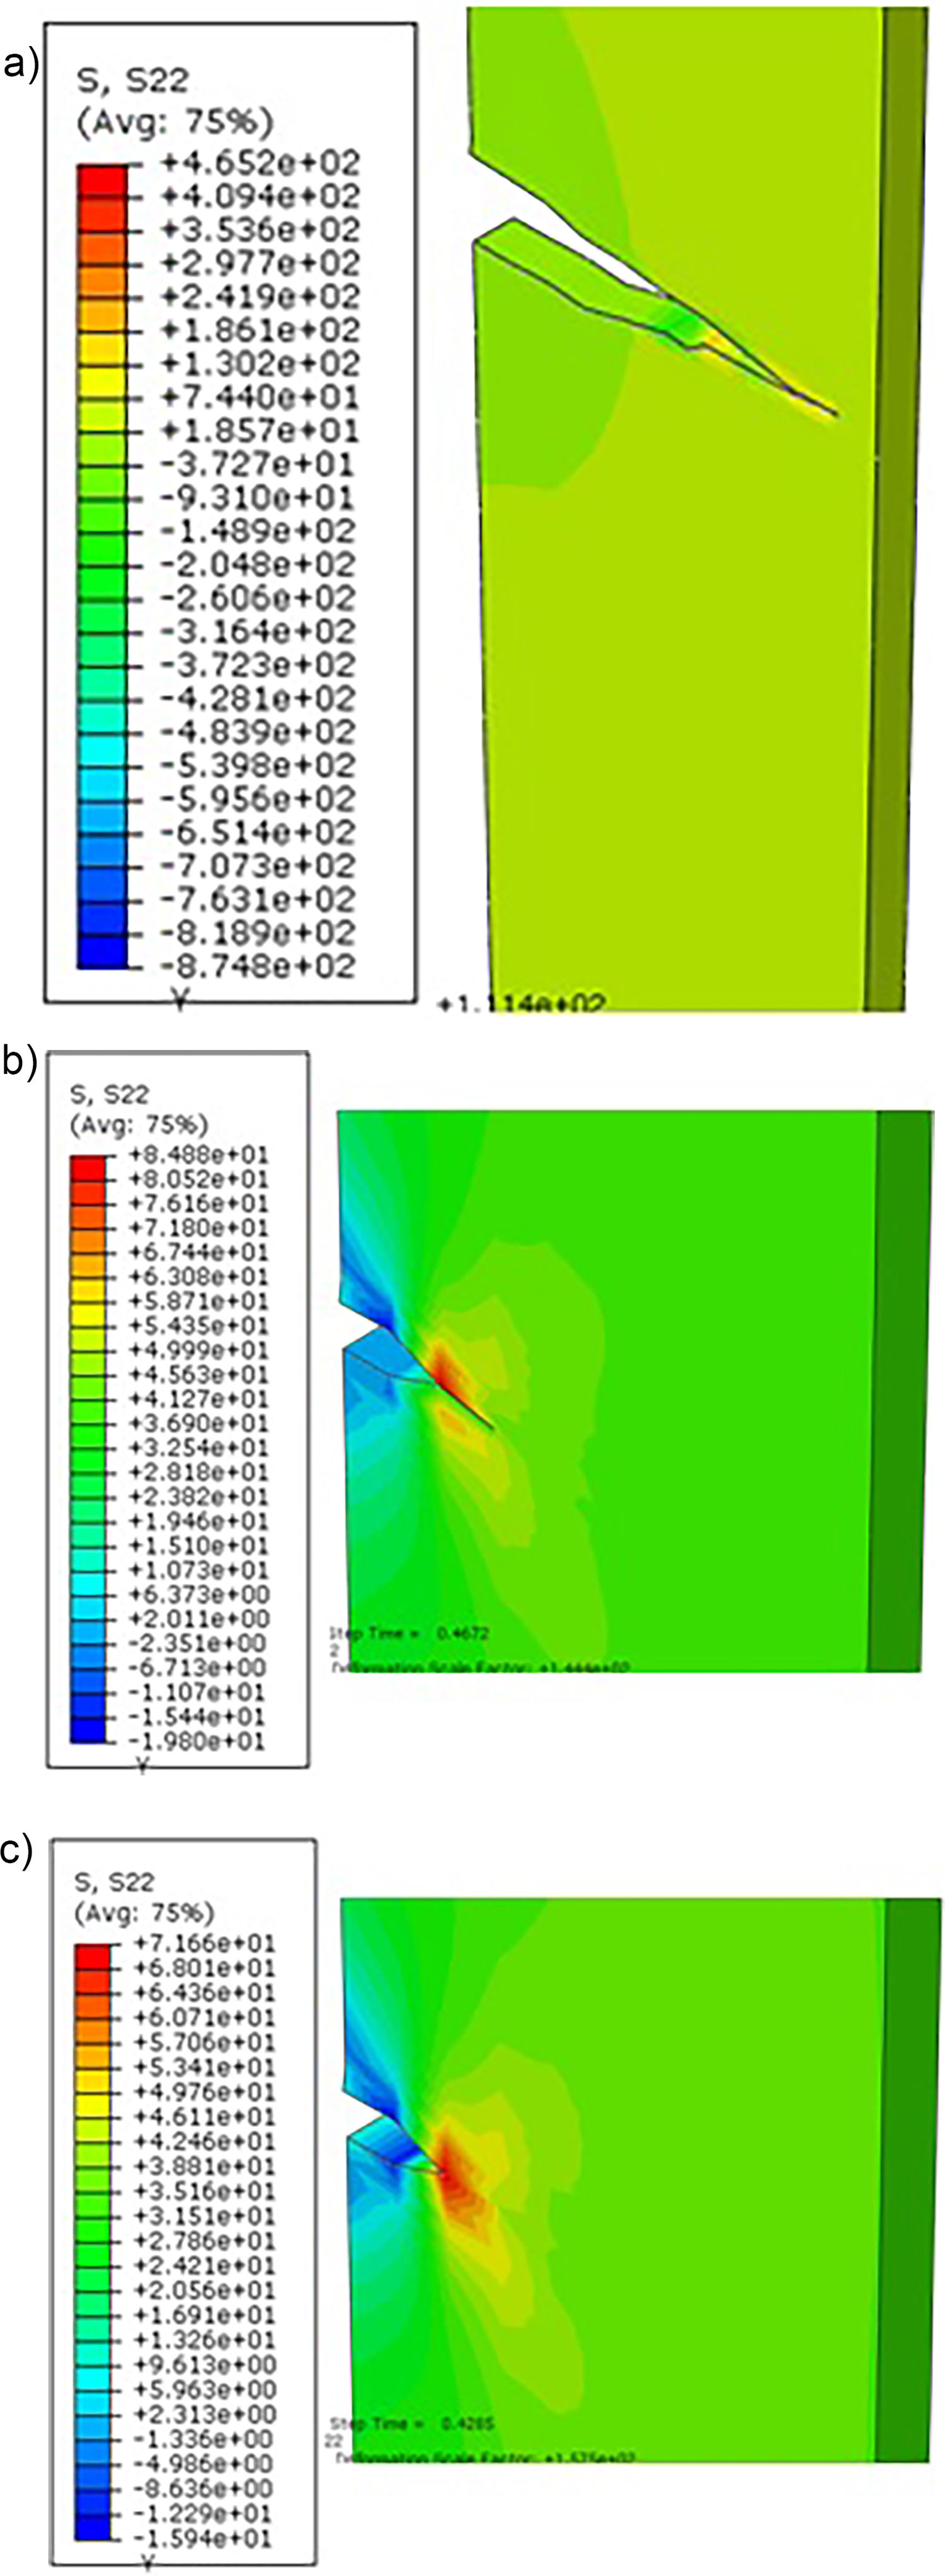
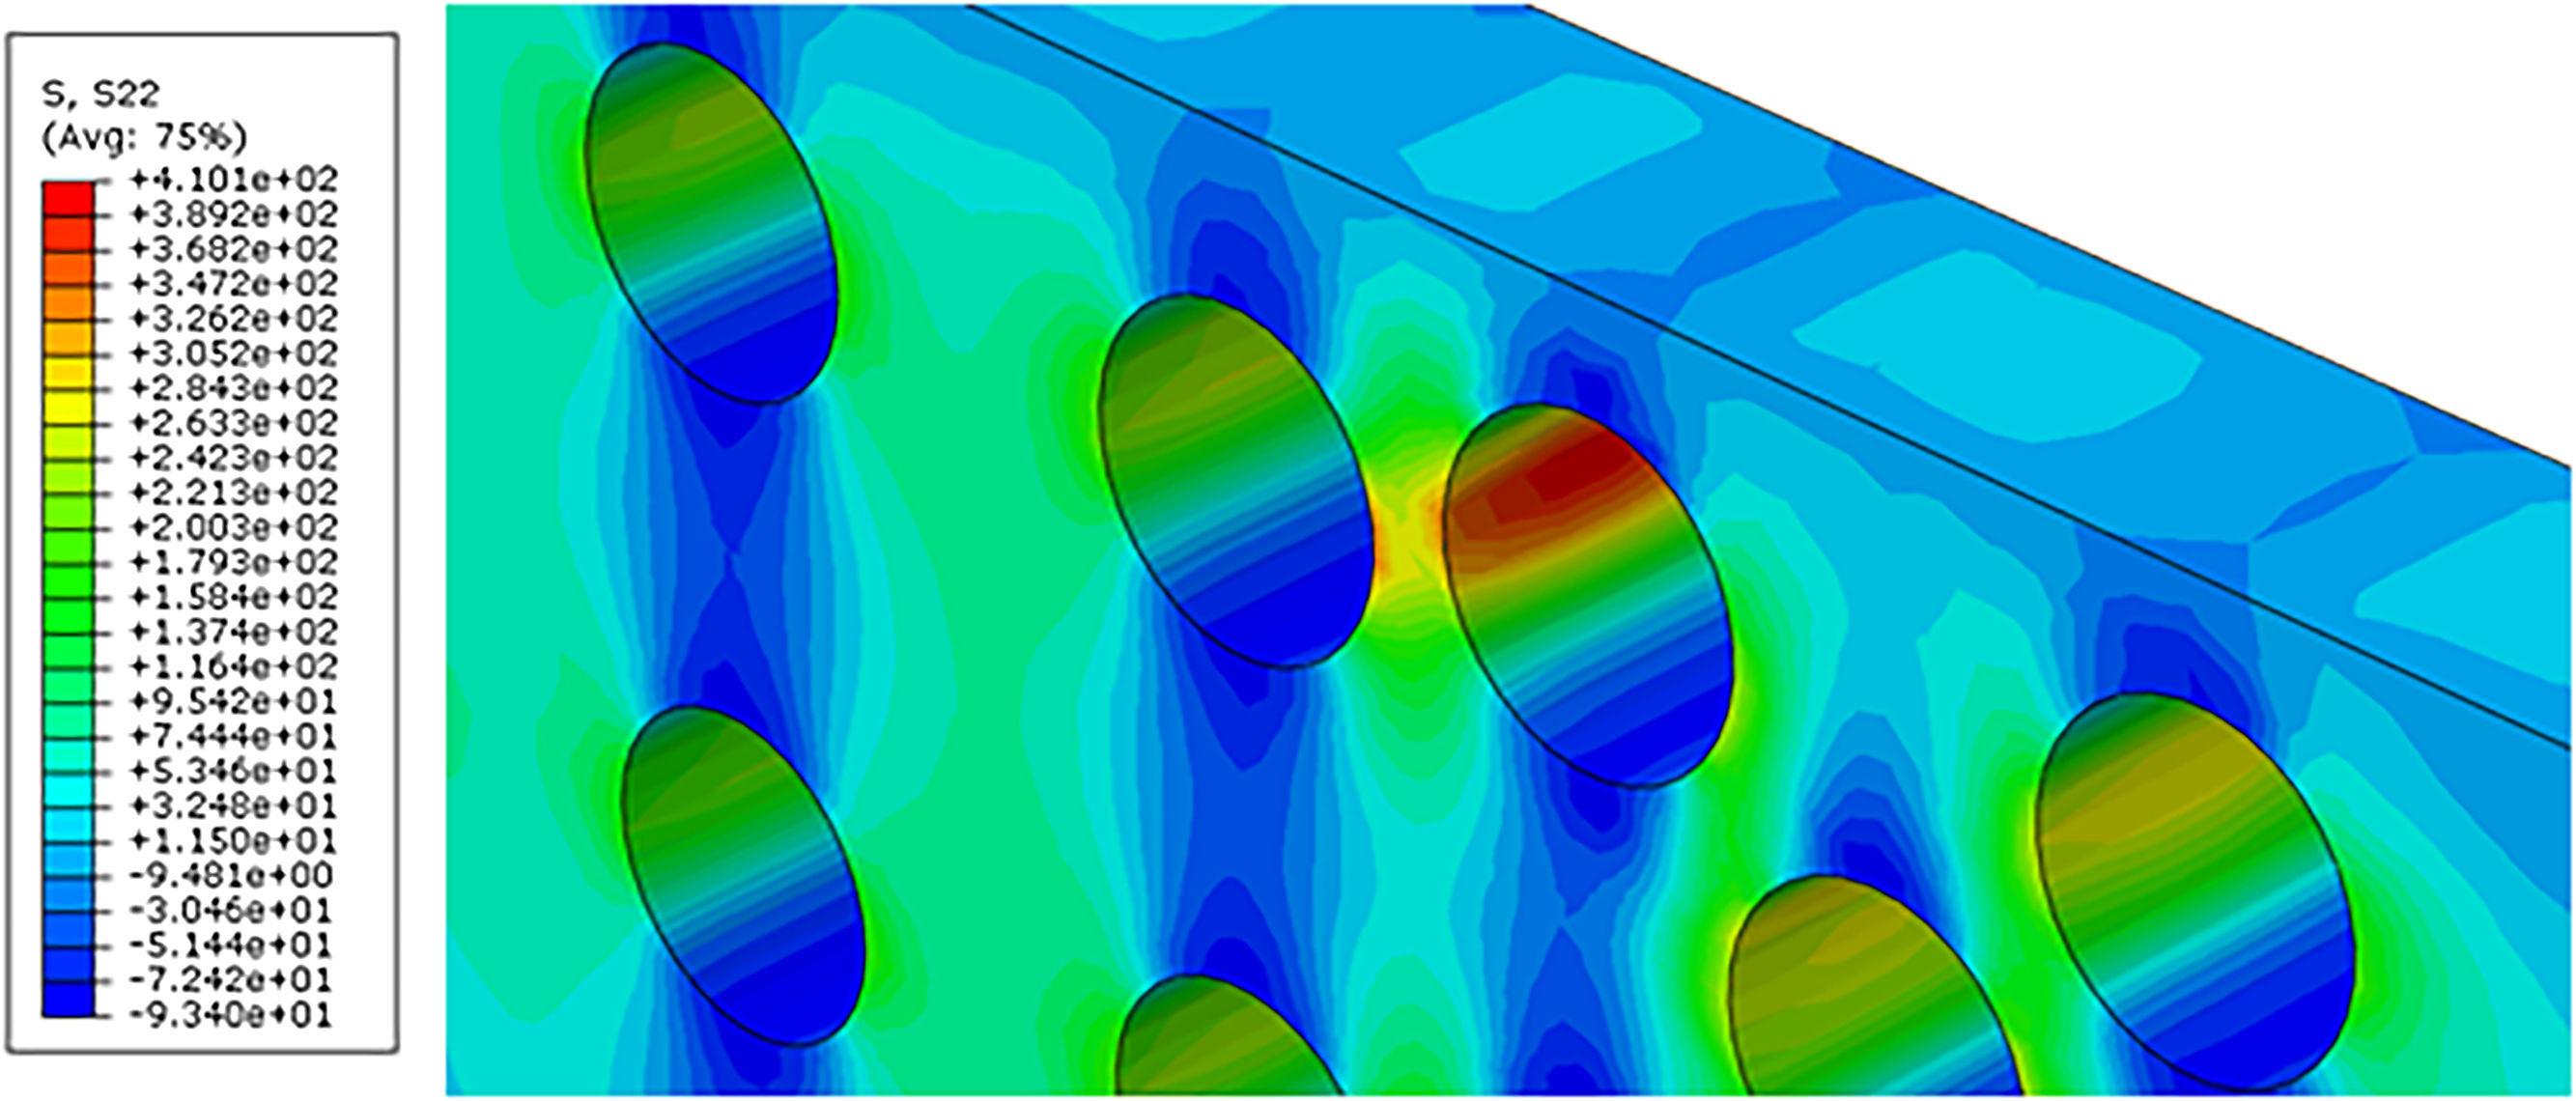
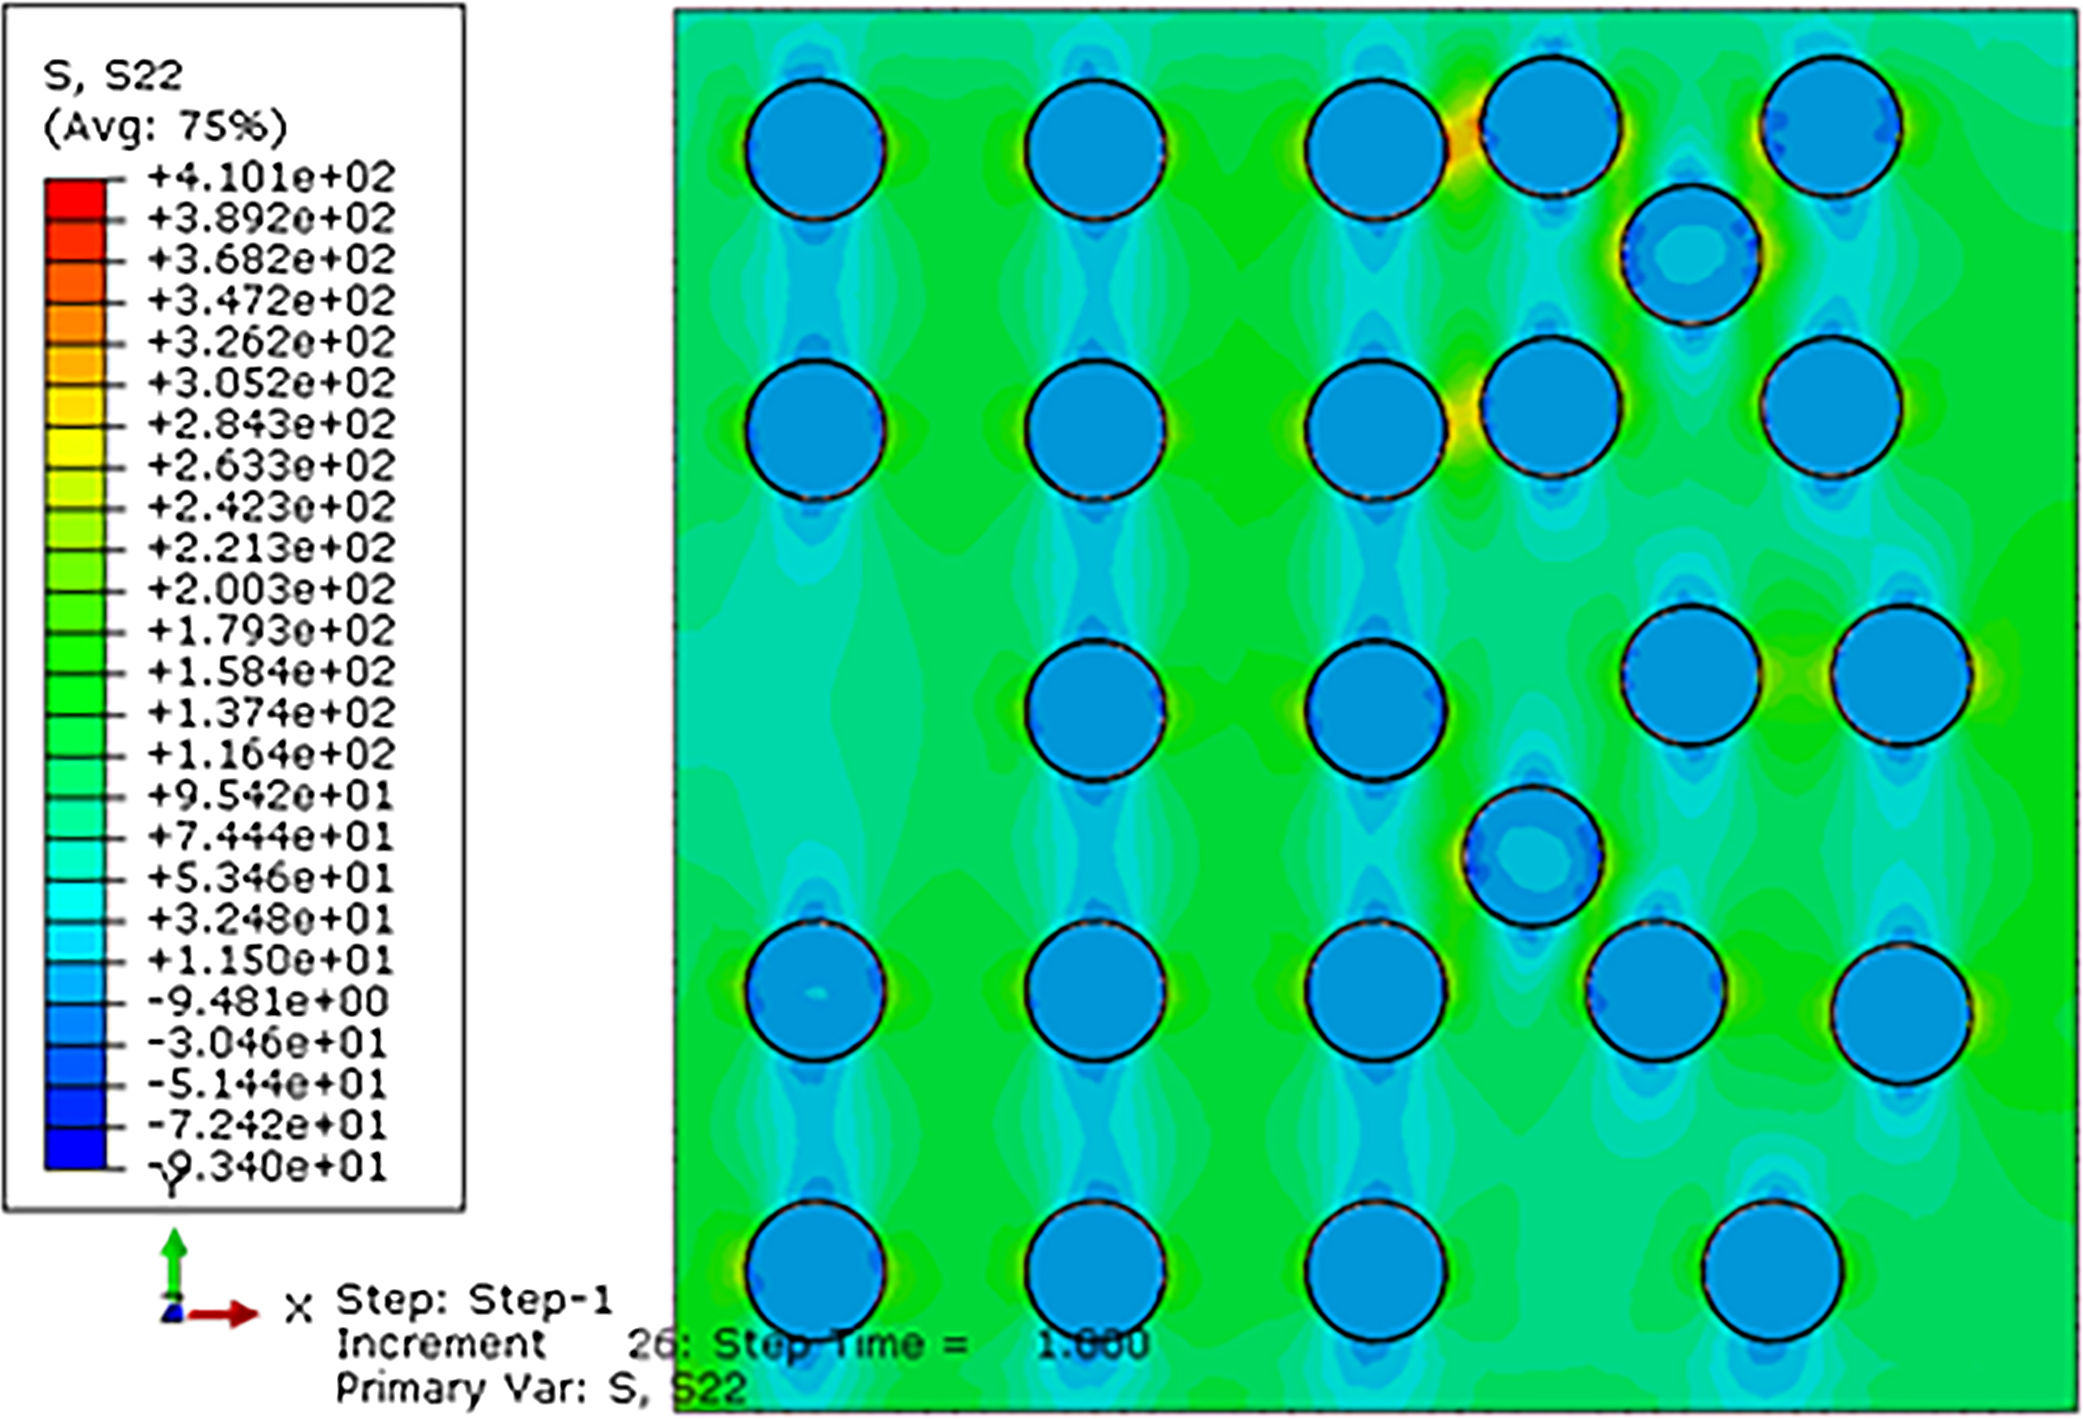
The third analysis presents the two simulations results: model with multiple fibers randomly distributed and incorporated in the polymer matrix under tensile stress; and fiber incorporated in the matrix representative volume element (RVE) modeling under fracture Mode I.
Analyzing the model with multiple fibers under tensile stress (Fig. 21), we can see the tension of σ=410.10MPa near the interface between fiber/matrix, tension very close to the rupture stress of E-glass fiber reinforced PMMA, found by Marcelo Júnior [1], in his laboratory tests, with divergence of about 9.18% of the experimental data.
Examining the interface fiber/matrix of this model as shown in the following image, we observe rupture stress at the interface surface, characterizing the decohesion between the polymer matrix and the glass fiber in the numerical simulation.
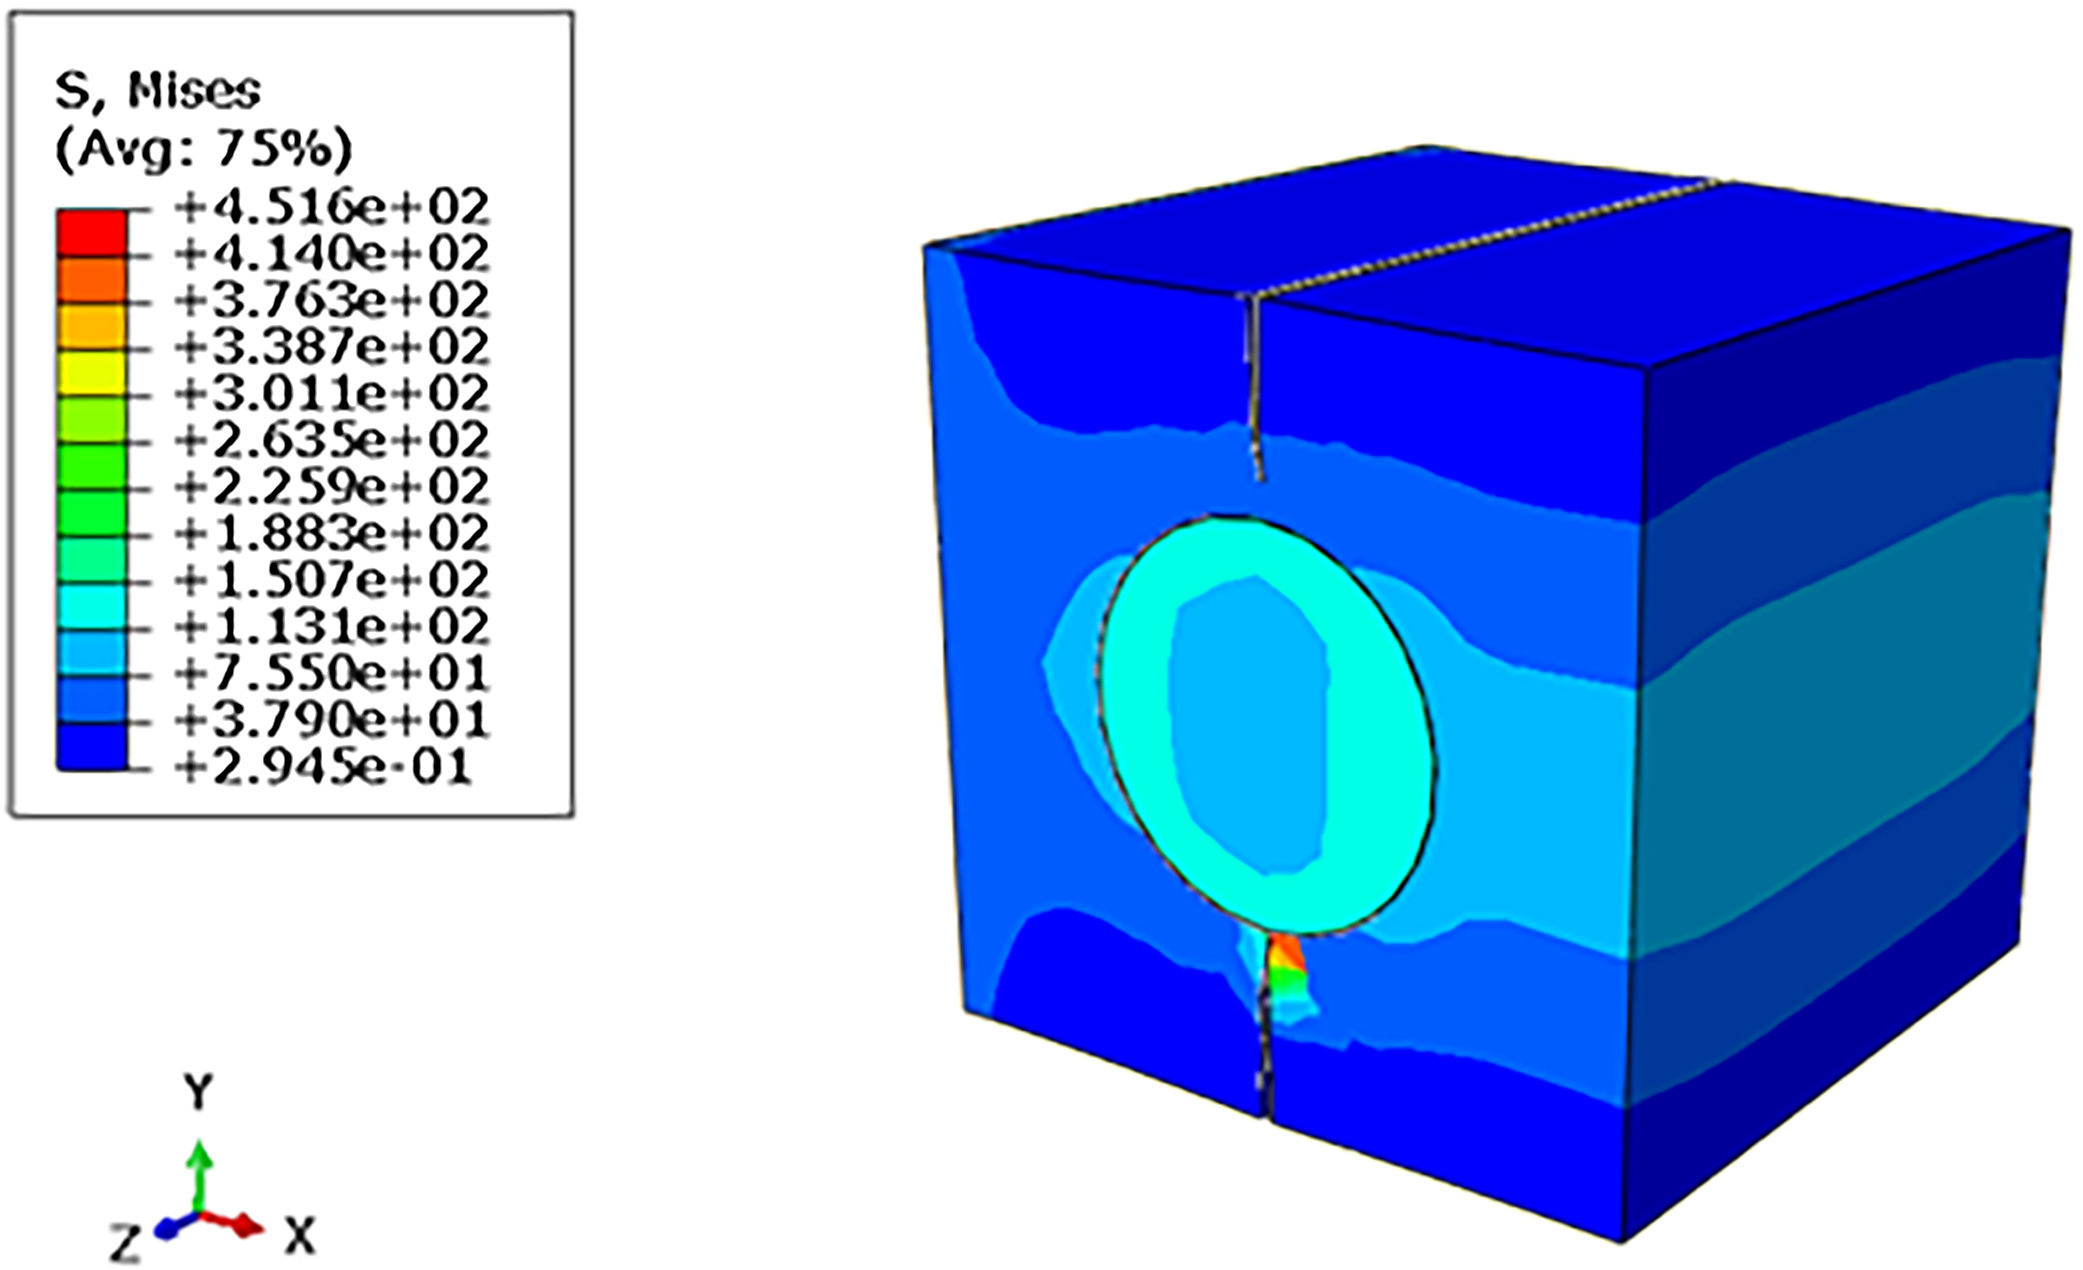
In the representative volume element (RVE) model according to the figure below, the Von Mises tensions in the composite material model under tension. A stress of σ=451.60MPa was found at the threshold between the crack tip and the fiber/matrix interface, when it propagates. Therefore, the result obtained was very satisfactory and also close to the rupture stress σ=451.56MPa experimental.
In the STATUSXFEM visualization mode in the RVE model as shown in Fig. 31, it is possible to verify the polymer matrix due to the crack propagation. Note also the decohesion between the composite components when analyzing the fiber/matrix interface degradation level, characterizing the loss of its mechanical resistance and its total rupture.

STATUSXFEM visualization mode in fiber/matrix interface RVE model.
In this research, it was verified that the values obtained in the computational analyzes were very close to the values obtained in the literature, as well as the results from the laboratory tests, evidencing that the software Abaqus is an effective tool to simulate the composites behavior in the fracture and consequently the crack propagation. It is worth noting that the computational results were only obtained due to the Extended Finite Elements Method (XFEM), making it possible to analyze the crack formation and evolution from an initial crack, using enrichment equations that were applied at the crack end without need for a highly refined mesh.
However, for the computational results to be coherent with the actual situation of deformation and rupture presented by the composite, a prior mechanical knowledge, physical and chemical material characteristics is necessary since these data will serve as a basis for the correct simulation in the software, establishing a correlation with laboratory analysis data.
Therefore, the composites behavior in relation to the crack appearance, cracks and their total degradation is an area that requires great efforts and research to be better understood. This research served as a consolidation of results already tested in the laboratory, showing that computational analysis is a tool that should be used to help and help better understand the causes and especially how a composite material will rupture, allowing the avoidance of occurrence of unforeseen events.
