

Improving intensive care unit (ICU) performance is a primary goal in quality of care management; for this purpose, measuring with tools that enable us to make comparisons with proposed standards is necessary.
ObjectiveTo describe the clinical performance and resource utilisation of a respiratory ICU (RICU) over a 5-year period.
Material and methodsA cross-sectional, retrospective, comparative study was conducted in the RICU of a teaching hospital. Using the revised Rapoport–Teres method, the standardised clinical performance index (SCPI) and the standardised resource utilisation index (SRUI) were calculated annually and for the entire study period. The results were compared with those obtained by the ICUs participating in Project IMPACT (in standard deviations) in a four-quadrant coordinate graph designed for this purpose. SCPI and SRUI values greater than zero indicate better survival and a lower resource utilisation than expected. Values below zero indicate a mortality and resource utilisation higher than expected.
ResultsIn the study period, 1177 patients were admitted to the RICU. Readmissions (n=34) and patients <18 years old (n=7) were excluded from the analysis. In 1136 patients, the observed survival rate was 55% and the survival rate predicted by SAPS-3 (simplified acute physiology score) was 74%. The fraction of unscheduled surgery patients, those receiving invasive mechanical ventilation, and those discharged to another hospital were included in the SRUI calculation. The SCPI and the SRUI for the entire study period were −4.0 and 0.94 respectively.
ConclusionAlthough the resource utilisation index in the RICU is within an acceptable parameter, a clinical performance below the standard is observed. Copying the care model of ICUs with good performance could be beneficial for the RICU to improve its performance.
Mejorar el rendimiento de la unidad de cuidados intensivos (UCI) es un objetivo primordial en la gestión de calidad, para esto, es necesario medir con herramientas que nos permitan hacer comparaciones con estándares propuestos.
ObjetivoDescribir el rendimiento clínico y uso de recursos de una UCI respiratoria (UCIR) en 5 años.
Material y MétodosEstudio transversal retrospectivo comparativo en la UCIR de un hospital público escuela. Utilizando el método revisado de Rapoport–Teres se hizo el cálculo del índice de rendimiento clínico estandarizado (IRCE) y del índice de uso de recursos estandarizado (IURE) de manera global y por periodos de un año comparando los resultados con los obtenidos por las UCIs participantes del proyecto IMPACT (en desviaciones estándar) en un gráfico de coordenadas de cuatro cuadrantes diseñado para este propósito. Valores de IRCE e IURE mayores a cero indican mejor sobrevida y menor uso de recursos que los esperados. Valores menores a cero indican una mortalidad y uso de recursos mayores a los esperados.
ResultadosEn el periodo de estudio ingresaron a la UCIR 1177 pacientes, fueron excluidos para el análisis los re-ingresos (n=34) y los <18 años (n=7). En 1136 pacientes la sobrevida actual fue de 55%, la sobrevida predicha por SAPS-3 (simplified acute physiology score) fue de 74%. Para el cálculo del IURE fueron incluidos en la formula la fracción de pacientes ingresados por cirugía no programada, pacientes en ventilación mecánica invasiva y los egresados a otro hospital. El IRCE para todo el periodo de estudio fue de −4.0 y el IURE de 0.94.
ConclusiónAunque el índice de uso de recursos de la UCIR está en un parámetro aceptable, se observa un rendimiento clínico por debajo del estándar. Copiar el modelo de unidades con buen rendimiento podría resultar de beneficio para mejorar el desempeño de la UCIR.
Improving intensive care unit performance is a primary goal in quality of care management. To achieve this improvement, measuring with tools that enable us to make comparisons with proposed standards is necessary. One tool currently used by intensive care units in North America, more specifically in the United States and in some Mexican units is the Rapoport–Teres method.1 This method, which plots clinical performance and costs on two axes using relatively easy to obtain information and is not very complex to interpret visually, was initially described in 1994.2 Since then it has been used by intensive care units in Project IMPACT, a multi-centre database in the U.S.3 In 2007, the method was recalibrated to adjust it to more contemporary clinical results and resource utilisation without sacrificing too much of its simplicity.4 The expected benefit of performing this type of analysis includes, among others, comparing the performance results of one unit with other intensive care units considered to be “standard”, so that, should sub-standard performance results be obtained, the care model of high-performance units can be copied (care, protocols, supplies, etc.), or, should a satisfactory result be obtained, the current strategies and care model can continue to be used. The analysis also enables clinical performance and resource utilisation to be compared for the same unit in different periods, to be able to describe the changes and possible phenomena related to those changes. The objective of this study is to describe and analyse the clinical performance and resource utilisation of the respiratory intensive care unit (RICU) of a public hospital over a 5-year period (March 2010–March 2015).
MethodsType of studyCross-sectional, comparative, retrospective study.
Patients and siteAll patients admitted to the RICU belonging to the Department of Pulmonology and Thoracic Surgery at the “Dr. Eduardo Liceaga” General Hospital of Mexico, a public teaching hospital with 901 beds, during the period from 1 March 2010 to 1 March 2015 were included. Readmissions and patients under 18 years old were excluded from the analysis. The RICU is one of eight intensive care units within the General Hospital of Mexico and it has seven beds. The RICU has a multidisciplinary team that includes a certified critical care physician and pulmonologist during the morning shift, as well as pulmonology residents, rotating internal medicine residents in the morning, afternoon, and night shifts supported by a certified pulmonologist in charge of the Department. The nurse–patient ratio is from 1:1 to 1:3 while the ratio of nurse specialising in critical care medicine to patients is from 1:3 to 1:7. The RICU also has respiratory therapists during the morning shifts and on weekends.
Source of dataAll data for the analysis were taken from the DeDUCIR (Deposito de Datos de la UCIR [RICU Data Deposit]) database. This Excel database was implemented in 2010 and was based on the local BASUTI database5 and the multi-centre intensive care unit BDM-TI database.6 It includes data on demographics, severity and prognosis, time on mechanical ventilation, stay in the hospital and ICU, mortality, procedures, and complications, among others.
Revised Rapoport–Teres methodRapoport proposed a two-dimensional method that plots clinical performance (standardised clinical performance index=SCPI) and cost-effectiveness (standardised resource utilisation index=SRUI) onto two axes, which are calculated according to the adjusted 2007 model4 as follows:
SCPI (x-axis): to obtain the standardised clinical performance index, first the difference in survival (ΔSurvival) of the study population is obtained by subtracting expected survival from observed survival as follows:
To adjust this difference, the mean difference in survival (0.110) was extracted and divided by the standard deviation of the difference in survival (4.668) obtained from the group of patients from the adjusted Rapoport model. The result is the x-axis value or SCPI.
SRUI (y-axis): to obtain the standardised resource utilisation index a value was assigned to the days of stay in the ICU and to the post-ICU days for each patient. The highest value is given to the first day in the ICU (4 points), a value of 2.5 points for each subsequent day in the ICU, and one point to the post-ICU days. A mean value of the points obtained from all the patients is called “weighted hospital days” (WHD). Based on a linear regression analysis in the revised Rapoport model, a need was seen to submit the WHD value to a logarithmic equation (base 10) to obtained the “expected weighted hospital days” (WHDe), which in addition to including the mortality of the study population, includes independent variables that were identified as predictive of ICU outcome as detailed below:
Afterwards, the difference in hospital days was obtained by subtracting the expected weighted hospital days from the actual weighted hospital days:The mean ΔWHD (−0.232) was subtracted from this difference and was divided by the ΔWHD standard deviation (3.786) obtained from the group of patients from the adjusted Rapoport model. The result is the y-axis value, or SRUI.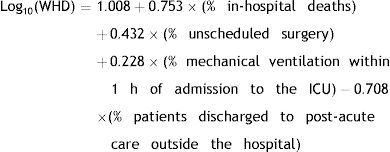

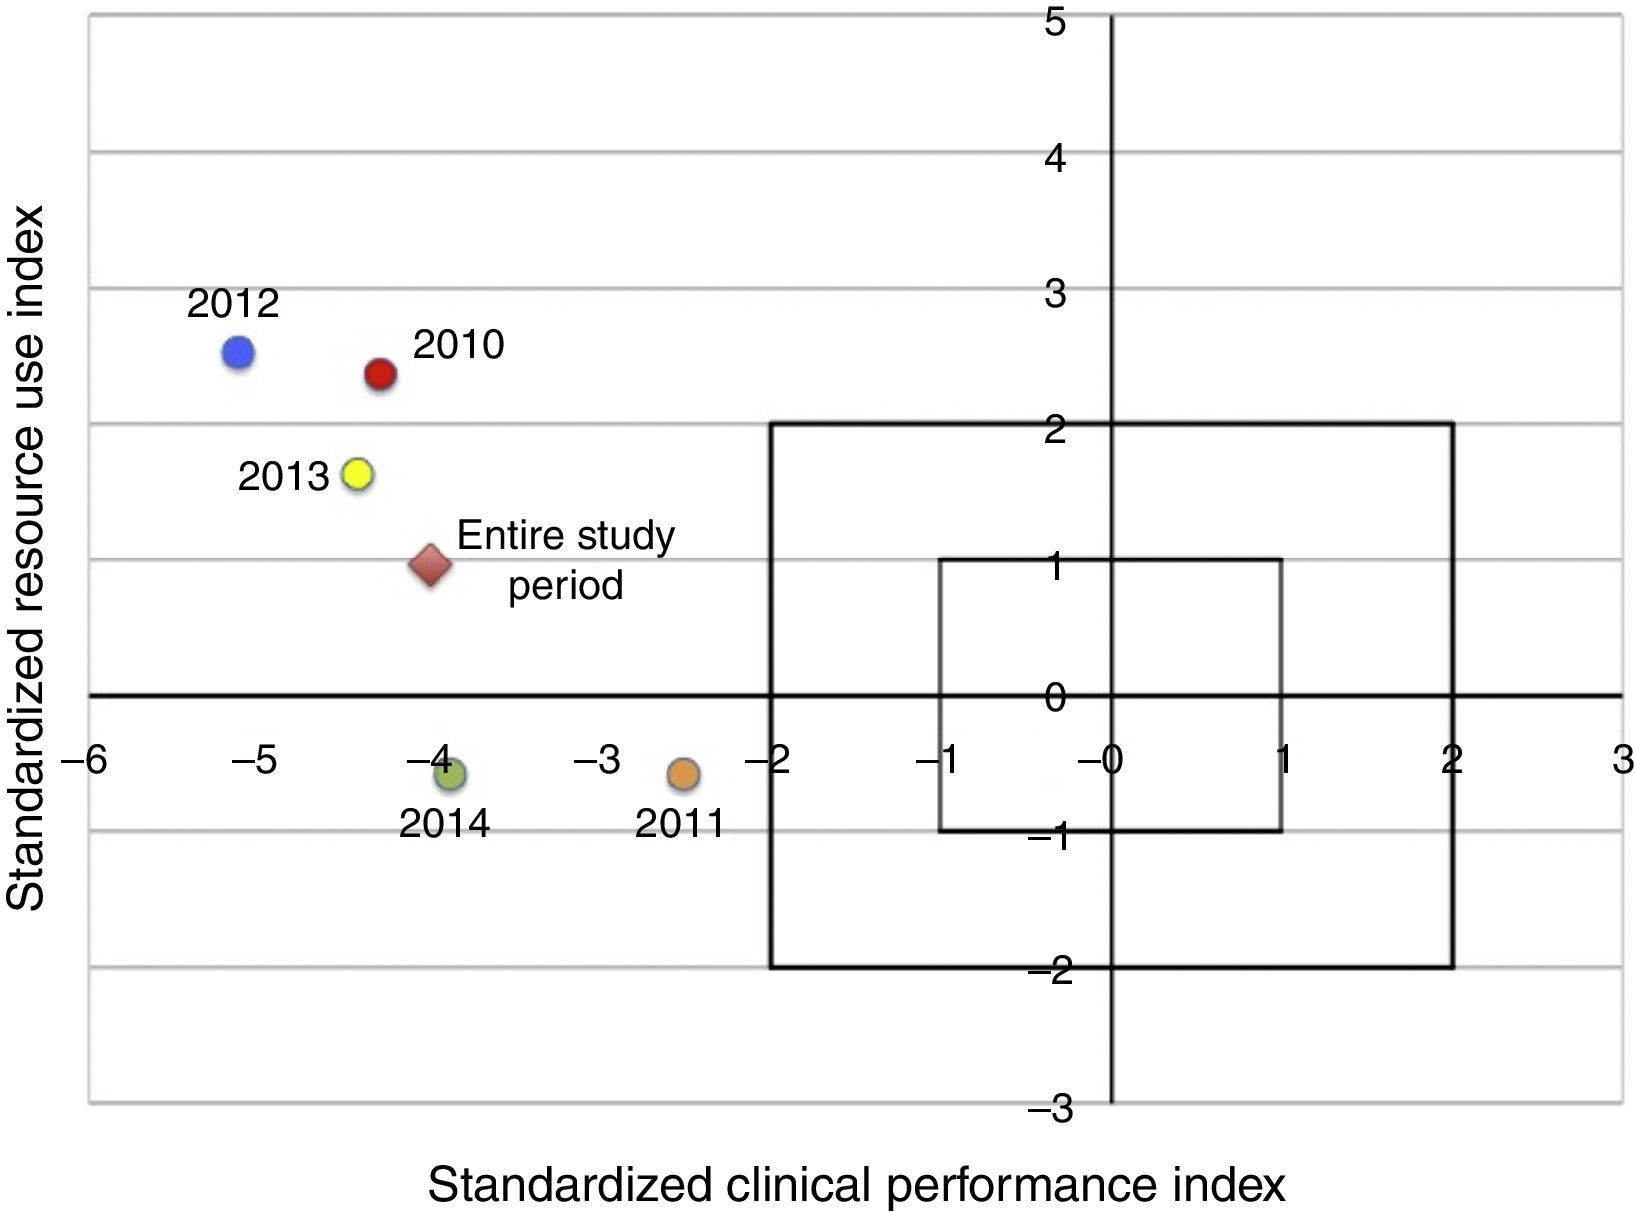
For visual interpretation purposes, the SCPI and SRUI values are plotted on a four-quadrant coordinate graph designed for this purpose that enables the results to be compared with those obtained by other units participating in Project IMPACT in the U.S. (in standard deviations, SD). Coordinates in upper right quadrant, that is where SCPI and SRUI values are greater than zero, indicate better survival and lower resource utilisation that expected, while negative values for these indices indicate that mortality and resource utilisation are higher than expected.
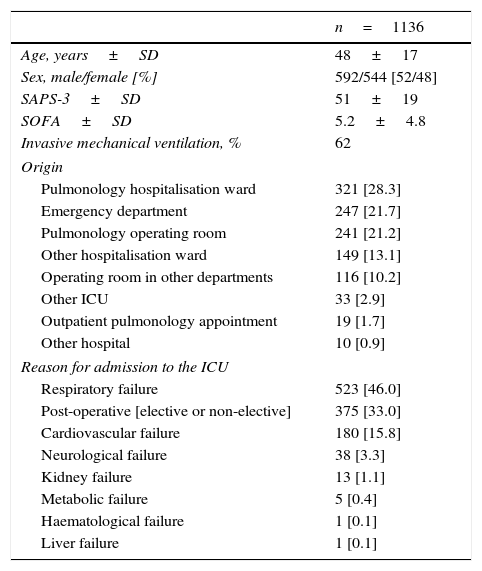
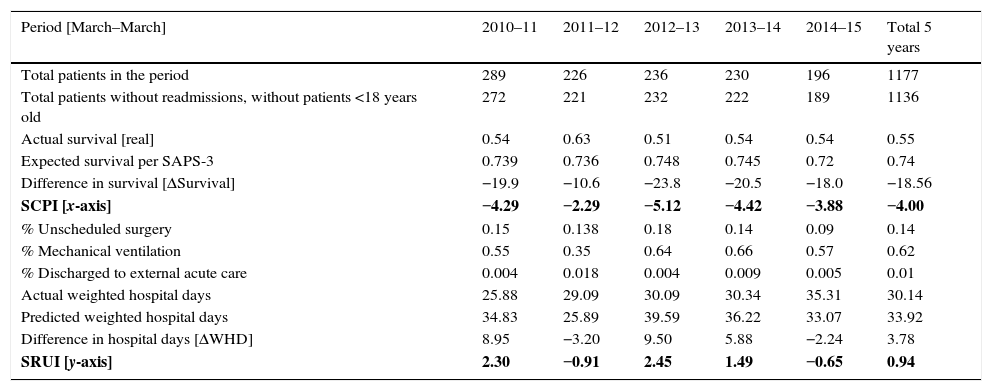
ResultsIn a 5-year study period, 1177 patients were admitted to the RICU. Readmissions (n=34) and patients <18 years old (n=7) were excluded from the analysis. In 1136 patients, the actual survival rate was 55% and the survival rate predicted by SAPS-3 (simplified acute physiology score) was 74%. Characteristics of the included patients are shown in Table 1. Of the patients who did not survive, 18% died within the first 48h of their stay in the RICU and 8.4% died within the first 24h of their stay. The variables for calculating the SCPI and SRUI and the outcomes by period are shown in Table 2. The fraction of patients admitted for non-scheduled surgery, patients on invasive mechanical ventilation, and discharged to another hospital were included in the formula to calculate the SRUI. Being discharged to another hospital was the only criterion (from a series using the revised Rapoport method) that applied for the study population according to the criteria considered to be a discharge to a post-acute care unit. The SCPI for all patients was −4.0 (x-axis) and the SRUI was 0.94 (y-axis). This places the overall performance in the upper left quadrant (Fig. 1).
Characteristics of the patients included.
| n=1136 | |
|---|---|
| Age, years±SD | 48±17 |
| Sex, male/female [%] | 592/544 [52/48] |
| SAPS-3±SD | 51±19 |
| SOFA±SD | 5.2±4.8 |
| Invasive mechanical ventilation, % | 62 |
| Origin | |
| Pulmonology hospitalisation ward | 321 [28.3] |
| Emergency department | 247 [21.7] |
| Pulmonology operating room | 241 [21.2] |
| Other hospitalisation ward | 149 [13.1] |
| Operating room in other departments | 116 [10.2] |
| Other ICU | 33 [2.9] |
| Outpatient pulmonology appointment | 19 [1.7] |
| Other hospital | 10 [0.9] |
| Reason for admission to the ICU | |
| Respiratory failure | 523 [46.0] |
| Post-operative [elective or non-elective] | 375 [33.0] |
| Cardiovascular failure | 180 [15.8] |
| Neurological failure | 38 [3.3] |
| Kidney failure | 13 [1.1] |
| Metabolic failure | 5 [0.4] |
| Haematological failure | 1 [0.1] |
| Liver failure | 1 [0.1] |
SD, standard deviation; SAPS-3, simplified acute physiology score 3; SOFA, sequential organ failure assessment; ICU, intensive care unit.
Variables for calculating the SCPI and SRUI and outcomes by period.
| Period [March–March] | 2010–11 | 2011–12 | 2012–13 | 2013–14 | 2014–15 | Total 5 years |
|---|---|---|---|---|---|---|
| Total patients in the period | 289 | 226 | 236 | 230 | 196 | 1177 |
| Total patients without readmissions, without patients <18 years old | 272 | 221 | 232 | 222 | 189 | 1136 |
| Actual survival [real] | 0.54 | 0.63 | 0.51 | 0.54 | 0.54 | 0.55 |
| Expected survival per SAPS-3 | 0.739 | 0.736 | 0.748 | 0.745 | 0.72 | 0.74 |
| Difference in survival [ΔSurvival] | −19.9 | −10.6 | −23.8 | −20.5 | −18.0 | −18.56 |
| SCPI [x-axis] | −4.29 | −2.29 | −5.12 | −4.42 | −3.88 | −4.00 |
| % Unscheduled surgery | 0.15 | 0.138 | 0.18 | 0.14 | 0.09 | 0.14 |
| % Mechanical ventilation | 0.55 | 0.35 | 0.64 | 0.66 | 0.57 | 0.62 |
| % Discharged to external acute care | 0.004 | 0.018 | 0.004 | 0.009 | 0.005 | 0.01 |
| Actual weighted hospital days | 25.88 | 29.09 | 30.09 | 30.34 | 35.31 | 30.14 |
| Predicted weighted hospital days | 34.83 | 25.89 | 39.59 | 36.22 | 33.07 | 33.92 |
| Difference in hospital days [ΔWHD] | 8.95 | −3.20 | 9.50 | 5.88 | −2.24 | 3.78 |
| SRUI [y-axis] | 2.30 | −0.91 | 2.45 | 1.49 | −0.65 | 0.94 |
SCPI, standardised clinical performance index; SRUI, standardised resource utilisation index; SAPS-3, simplified acute physiology score; WHD, weighted hospital days.
![Revised Rapoport–Teres method graph for intensive care units graduated in standard deviations [SD]. Coordinates within ±2 SD indicate that the performance of an ICU is consistent with that of its peers, units in Project IMPACT considered “standard” against which it is compared.](https://static.elsevier.es/multimedia/01851063/0000007900000003/v1_201608260031/S018510631630049X/v1_201608260031/en/main.assets/gr1.jpeg?xkr=ue/ImdikoIMrsJoerZ+w997EogCnBdOOD93cPFbanNcLh0A++iRI+X5zMTBgoGALfWcRIAwHdtvbi9cSd0bcRHwS9jJvmInWgVW8+jWc44AsUOAnGXVF+JC/EB5CkleLQ4kq/5i6Dkvsyjm8tnLxZft3nMuR1hZfeMWJphTkPcNptJgKlwSoRNKaqPrUee4NiTeZUK2j+qAgyNHUX7fZmdGLG5eQWihhNlGrRgPNN5ZFnCGptdhFSfD2hvcBJ7yxHHZaGVeLeRHZ9YPekHyAkQSg/qtfP79mpgHoZHaBJu0= "Revised Rapoport–Teres method graph for intensive care units graduated in standard deviations [SD]. Coordinates within ±2 SD indicate that the performance of an ICU is consistent with that of its peers, units in Project IMPACT considered “standard” against which it is compared.")
The expenses an ICU generates can account for up to one third of the expenses generated by a hospital.7 The most ill patients, moreover, will be more likely to die in intensive care units in comparison with other areas during their hospital stay. Both aspects make ICU spaces complex to administer, either in managing resources or strategies that seek to improve their clinical outcomes.
As for other areas of a hospital, there are many ways for the ICU to evaluate the cost of healthcare interventions and its impact on the outcomes obtained.1,8–10 Given the diversity of methods and the complexity of defining the cost derived from the change in the health of an individual or group of individuals with different conditions, or even more, defining the monetary value of a life, often times the rationale for making these measurements is to self-assess the performance of an ICU over time. One example of a practical tool that has been successful due to its simplicity for measuring the performance of an ICU is the Rapoport method which combines clinical assessment (SCPI) with financial measurements (SRUI), enabling where improvements are required to be identified and graphically comparing performance with other ICUs.
Although the resource utilisation index in the RICU (SRUI) is within an acceptable parameter (±2 SD, which is consistent with the average performance of its peers, i.e. 135 ICUs participating in Project IMPACT), its clinical performance is below standard. The costs alone give us an incomplete view of the overall performance of an ICU since units with sub-standard care can have lower resource utilisation and an inappropriately high mortality.4 Furthermore, resources in an ICU may be scarce or absent, which results in a deficient clinical performance. Resources should not be understood simply as supplies, since an ICU encompasses a structure, with a physical area, equipment (which includes supplies), and staff (human team), and the ways in which the staff carry out their actions (processes).
Yet the analysis conducted when adjusting the Rapoport method in 2007 did not find a significant correlation between costs and mortality (which means that an excessive use of resources is not necessary associated with exceptional clinical performance or vice versa), in the particular case of the RICU a trend has been observed that clinical performance improves when more resources are used, which could suggest that identifying areas of opportunity to inject resources may result in benefits.
Unlike the care models of units with good performance from Project IMPACT and Mexican units that have reported their results using the Rapoport method,6,11,12 the RICU does not have critical care physicians available for care 24/7. In addition, the ratio of nursing staff and respiratory therapists who are part of the RICU multi-disciplinary team is deficient. Making sure healthcare staff resources coincide with patient needs is a key factor for quality of care in the ICU. Patient safety is put at risk when the patient:healthcare staff ratio exceeds certain limits and when the workload is excessive.13
Strategic planning, on the other hand, is essential for care in the intensive care unit to prosper, providing good patient care and enabling an efficient use of resources.14 The RICU has implemented its own quality of care management systems which have merited recognition in the international scientific media,15,16 a mid-term work plan (2014–2017), and a long-term vision. This suggests to us that the on-going efforts to improve care are present with strategies that are applied in high-performing units in Mexico and the United States. The RICU is currently implementing the strategies from the Bacteremia Zero17 and Pneumonia Zero18 projects, which have demonstrated excellent results in Europe and the U.S.,19 in addition to implementing a hand hygiene adherence program that promotes a culture of quality. The opportunities for improvement by implementing strategies that do not require large investments or complex technology are innumerable and the RICU is not ignorant of these efforts, which also include collaborations with similar units in Mexico.20 Moreover, in 2017 the RICU and the Department of Pulmonology are expected to move into a new physical area, a building to care for patients with cardiopulmonary conditions which is planned to have facilities with a design and equipment that are adapted to the current standards.
There are some limitations to the presented analysis which deserve mention. First, to calculate the SCPI and SRUI the expected survival according to the SAPS-3 prediction model was used, and not that according to the MPM0-III model as in the revised Rapoport method. It must be taken into account that the tool was only validated for the latter model. Even if the study population were eligible for the MPM model, the RICU has a unique population of patients with predominantly respiratory conditions (medical and surgical), in which the model calibrated for WHD could be inadequate. Second, nearly one fifth of the patients who died in the RICU did so within the first 48h of their stay, which makes us think that patients who are too critically ill are admitted and that SAPS-3 may overestimate the expected survival (like other models). In that case, it would require a local validation of the prediction model to adjust it to the patient population cared for. Third, due to not knowing the proportion of patients who required mechanical ventilation in the first hour of admission to the RICU, the total proportion of patients on mechanical ventilation was used to calculate the SRUI. However, this aspect makes it so that SRUI is underestimated. Fourth, when the Rapoport method was adjusted in 2007, some speculations were proposed to explain why better survival was observed in the ICUs at that time compared with the original method 13 years earlier in 1994,4 for example, the greater role of 24-h critical care physicians, the intervention of multidisciplinary teams in medical rounds, the implementation of a series of measures to improve the quality of care, and the pharmaceutical and technological advances, among others. These speculations may play a role 8 years after the last calibration of the Rapoport method. That is, a new calibration may now be necessary. Lastly, the results of the RICU performance cannot be compared with those obtained by other Mexican ICUs since the units that reported their analysis with the method did so before it had been calibrated [before 2007].
ConclusionsAlthough the resource utilisation index in the RICU is within an acceptable parameter, a clinical performance below the standard is observed. Copying the care model of ICUs with good performance could be beneficial for the RICU to improve its performance. As the RICU has improvement programs in its protocols and processes, it mainly needs to copy aspects of the care model of other ICUs with good performance. Hiring specialised, multi-disciplinary staff for shifts, improving its physical structure and equipment, and reinforcing its processes, among others, are areas of opportunity.
Ethical disclosureProtection of human and animal subjectsThe authors declare that no experiments were performed on humans or animals for this investigation.
Confidentiality of dataThe authors declare that no patient data appear in this article.
Right to privacy and informed consentThe authors declare that no patient data appear in this article.
FundingNone.
Conflict of interestThe authors declare they have no conflicts of interest related to the preparation of this manuscript.
Thank you to the nurses, residents, pulmonologists, and respiratory therapists who provide their valuable service in the Respiratory Intensive Care Unit at the General Hospital of Mexico.