


The overall perceived health (OPH) is part of the composite tools used to determine the activity of Rheumatoid Arthritis (RA). It is usually measured using a Visual Analogue Scale (VAS). Difficulties in applying the VAS have been observed in our clinical practice and in the literature. This study was conducted after considering the need to define the performance of the different scales used to assess OPH, determining their convenience and to suggest the development of a new scale.
MethodsThis is a study based on the outcome of patients diagnosed with RA, to whom 4 types of scales were administered to assess OPH: Scale 1 (VAS), Scale 2 (faces scale), and a proposal for a visual scale in two versions: Scale 3 (composite visual scale with a horizontal orientation), and Scale 4, similar to 3 with a vertical orientation. The correlation and level of understanding by patients was analyzed.
ResultsA total of 198 patients were included, 169 (85.3%) females and 29 (14.6%) males. The mean age was 54.2 years, and 59.6% of the patients failed to understand Scale 1, while most patients understood Scales 2, 3, and 4. Approximately 80% of the patients preferred Scales 2 (43.4%) and 3 (36.3%) (P < 0.00), but no clinical variable predicted the selection of the scale. Scales 2, 3, and 4 showed a good correlation and an acceptable reproducibility.
ConclusionsAlthough most patients did not understand the VAS, the vast majority of our patients understood and preferred the proposed scales that could be useful in the clinical practice of RA patients.
la percepción global de la salud (PGA) es una parte de los instrumentos compuestos utilizados para determinar la actividad de la artritis reumatoide (AR). Por lo general, y se mide por medio de la escala visual análoga (EVA). En nuestra práctica clínica y en la literatura se han observado dificultades en la aplicación de la EVA. Este estudio se llevó a cabo luego de considerar la necesidad de definir el desempeño de las diferentes escalas usadas para evaluar la PGA, determinar la facilidad de su uso y proponer una nueva escala.
Métodosse trata de un estudio basado en desenlace de pacientes con diagnóstico de AR a los que se aplicaron cuatro tipos de escalas para evaluar la PGA: escala 1 (EVA), escala 2 (escala de rostros), una propuesta de escala visual en dos versiones: escala 3 (escala visual compuesta en orientación horizontal) y escala 4 (similar a la 3 en orientación vertical). Se analizó su correlación y la frecuencia con la que los pacientes las entendieron.
Resultadosse incluyeron 198 pacientes, 169 mujeres (85,3%), 29 hombres (14,6%), y la edad media fue de 54,2 años. El 59,6% de los pacientes no entendió la escala 1. La mayoría de los pacientes entendió las escalas 2, 3 y 4. Aproximadamente el 80% de los pacientes prefirió las escalas 2 (43,4%) y 3 (36,3%) (p < 0,00). Ninguna variable clínica predijo la selección de la escala. Se observó una buena correlación y una aceptable reproducibilidad de las escalas 2, 3 y 4.
Conclusionesla mayoría de los pacientes no entendió la EVA; la mayoría de nuestros pacientes entendió y prefirió las escalas propuestas que podrían ser útiles en la práctica clínica de los pacientes con AR.
Rheumatoid arthritis (RA) is a chronic inflammatory disease of the joints, characterized by synovitis, stiffness, edema, pain and systemic inflammation1–3 that may involve extraarticular complications.4–6 The clinical assessment of the patient with RA – and an essential component of the control process of the disease – should include an estimate of disease activity.7,8 Patient reported outcomes (PRO) directly explore pain, functionality and overall perceived health (OPH).9 OPH is part of the composite tools used to establish the disease activity or clinimetrics. Clinemetrics has shown to be beneficial in the treat to target10,11 strategy. The composite and validated measurement tools for clinimetrics in RA are: DAS or Disease Activity Score12; DAS28 or Disease Activity Score, assessing 28 joints13; SDAI or Simplified Disease Activity Index,14 and CDAI or Clinical Disease Activity Index.15,16 All of these tools include the OPH, regardless of whether it is the visual analogue scale (VAS), the numeric, the verbal or the faces. OMERACT recommends measuring using the horizontal 10 cm VAS or a Likert type scale.17–19
In the daily clinical practice, doctors realized that most patients failed to understand the VAS, in contrast to the faces scale which performed better. For this reason, this study is intended to assess the performance of the various scales used in assessing OPH, in addition to suggesting a composite scale (CS) in two similar versions with different orientation: horizontal and vertical.
The overall objective of the study was to determine the overall disease perception in patients with rheumatoid arthritis, using different scales. The specific objectives were: identifying the scale which is better understood by patients, establishing the preferences of patients for the different scales, and establishing the correlation among the various scales to assess the patient’s overall disease perception.
Materials and methodsAn observational, cross-sectional study was conducted to assess the scales for determining patient-reported outcomes. The target population was adults from the subsidized healthcare system, living in urban areas, and who came to the rheumatology clinic of Hospital Simón Bolívar, Bogotá, Colombia, from June 2015 until November 2016. Adult patients with RA who met the 198720 ACR criteria or the 2010 ACR/EULAR criteria,21 who were willing to complete the scales as part of their assessment in the doctor’s office. Illiterate patients, or individuals with neurological or visual disabilities who were unable to read the cards were excluded. The sampling was a convenience consecutive sample.
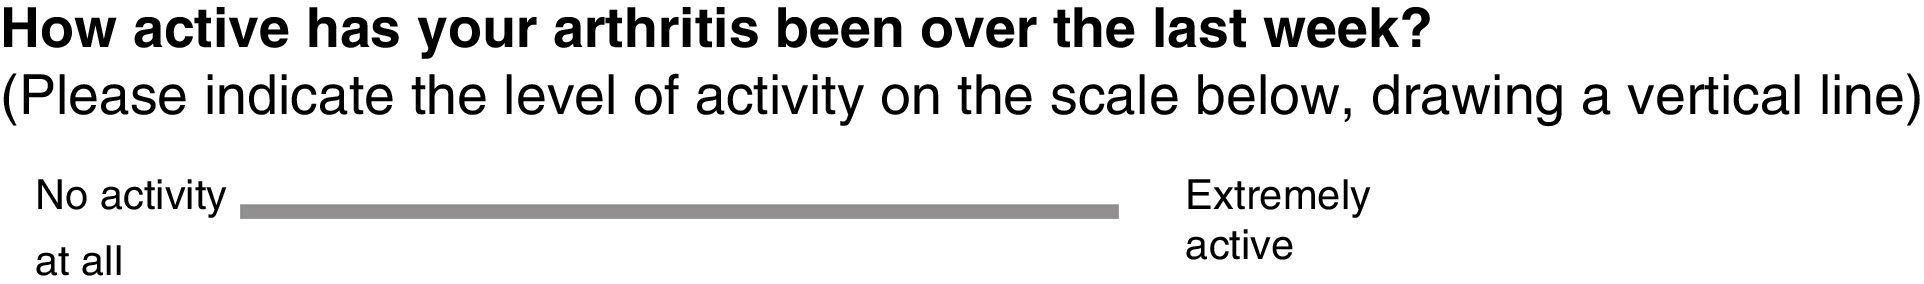
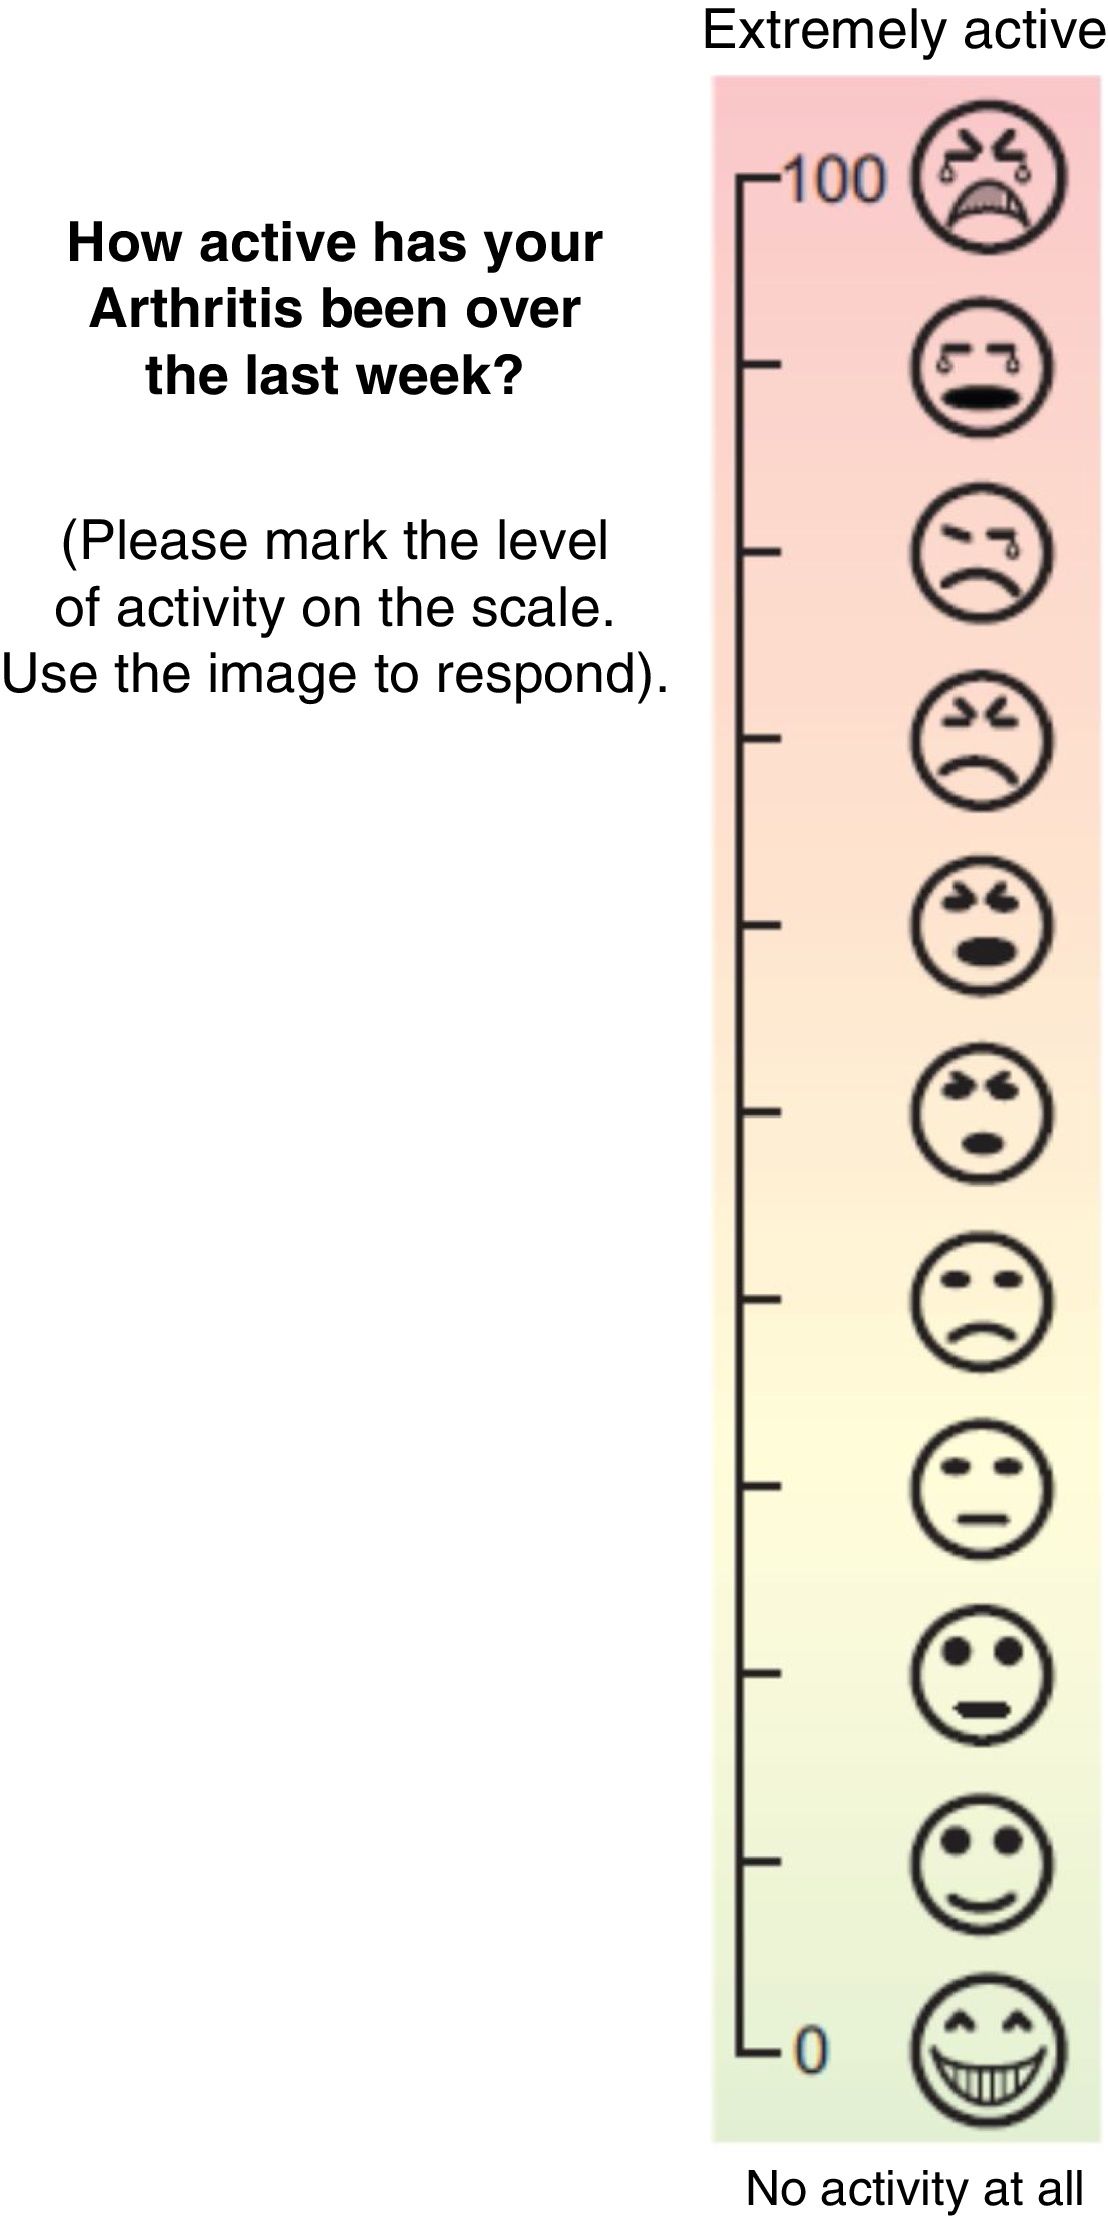
The scales were printed in 8 × 21 cm cards each. All of the scales follow the recommendations for composite instruments, such as those used in clinical trials (horizontal line, left corner no activity, right corner maximum activity),18,19 except for card 4 which was changed into a vertical layout, where the bottom end was no activity and the top end was maximum activity. Card 1 (Fig. 1) represents the VAS used and recommended to complete DAS,2,22 while Card 2 (Fig. 2) represents the pain scale with faces of the International Association for the Study of Pain (IASP).23,24 The suggested scale, called composite scale, has two versions: Card 3 (Fig. 3), which is visual scale with numbers in the corners and 11 icons of faces, distributed properly and proportionately spaced so that the patient was able to point his/her finger the level he/she were at, and with a clear background, with color progression from green to red; and Card 4 (Fig. 4), depicting the same figure as Card 3, but in a vertical arrangement. In Cards 3 and 4, the icons and colors used were developed by the authors, using Corel Draw® software. The number on the cards was exclusively for identification purposes.


Face scale of the International Society for the Study of Pain. These faces illustrate the level of pain you may have experienced. The face to the left is no pain, and as you move forward to the right, pain increases.
Please mark the face showing how active has your arthritis been over the past week.


The purpose of the study was to administer the scales to the patients in order to establish their comprehension and obtain a useful score for the clinical assessment. Furthermore, if possible, to determine the preference for one of the scales and to study the correlation among the various scales.
A patient was considered unable to understand the scale when the patient expressed his/her impossibility, or when the inability to obtain a valuable result for the clinic in assessing the patient’s condition was evident.
The protocol was submitted to the ethics committee of the School of Medicine of Universidad Nacional de Colombia and the committee approved its implementation.
Pilot testA pilot test was conducted in 20 patients, using the four cards and scales herein described. The scales were self-administered and randomly distributed; the patients followed the instructions printed on the cards.
Statistical analysisThe data were compiled using STATA® 13.0 and the quantitative variables were analyzed with central tendency and dispersion measurements, according to their statistical distribution. Additionally, the qualitative variables were expressed as proportions, absolute numbers and percentages.
In order to assess the correlation between the various scales, Pearson’s correlation coefficient was used. Time-related reproducibility was analyzed assessing a group of 30 patients with RA who completed the four scales in two observations made 48 -hs apart. (test re-test), which was determined with the intraclass correlation coefficient. A univariate and multivariate analysis was conducted with a multinomial logistic regression associative model to determine the influence of the variables with regards to the preference of the scales. The dependent variable was the preference for a type of scale, while the independent variable was age, and the covariables included were gender, level of education and RA duration. A bivariate analysis was conducted to find statistical significance, to proceed then with the step by step multivariate analysis. Any variable with a p < 0.05 was considered to be statistically significant. The sample size was estimated assuming a 10% difference between those who prefer one scale over another, with alfa of 5% and 80% power, resulting in a sample size of 158 patients.
ResultsA total of 198 adult patients were included, with a mean age of 54.2 years (standard deviation – SD = 12.1), 169 females (85.3%) and 29 males (14.5%). The median duration of the disease was six years (interquartile range, IQR = 10). The level of education was distributed as follows: 105 patients completed elementary (53%), 77 incomplete secondary school (38.8%), 7 undergraduate university (3,5%), 5 no schooling (2.5%), 2 complete secondary school (1%) and 2 post-graduate education (p < 0.00). The median of swollen joints was 7.0 per patient (IQR = 8) and the median for tender joints was 6.0 per patient (IQR = 10). The DAS 28 median for patients was 3.26 (IQR = 5), distributed as follows: 63 patients in remission (31.8%), 17 with mild activity (8.5%), 73 with moderate activity (36.8%) and 45 with high activity (22.7%). The acute phase reactants measured, such as C reactive protein (CRP mg/L) and erythrocyte sedimentation rate (ESR mm/h), reported medians of 12.0 (IQR = 22) and 16.0 (IQR = 28), respectively. The level of education based on the years of evolution of RA did not show statistically significant differences (p < 0.43, Fisher’s test). Table 1 lists other characteristics.
Other characteristics of the population with rheumatoid arthritis.
| Duration of the disease: n (%) | |||
|---|---|---|---|
| ≤3 years | 69 (34.9%) | ||
| 3−10 years | 73 (36.9%) | ||
| >10 years | 54 (28.2%) | ||
| Level of education/sex: n | Female | Male | |
| None | 4 | 1 | |
| Elementary | 89 | 16 | |
| Incomplete secondary school | 67 | 10 | |
| Complete secondary school | 10 | 2 | |
| University undergraduate | 5 | 2 | |
| University post-graduate | 2 | 0 p < 0.73* | |
| Level of education/age groups: n | ≤30 years | 31−65 years | ≥66 years |
| None | 0 | 2 | 3 |
| Elementary | 0 | 81 | 24 |
| Incomplete secondary school | 2 | 69 | 6 |
| Complete secondary school | 0 | 2 | 0 |
| University undergraduate | 3 | 4 | 0 |
| University post-graduate | 1 | 1 |
|
The pilot test was satisfactorily completed; no subsequent adjustments were made upon completion of the test.
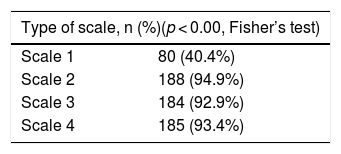
With regards to measuring OPH, the comprehension of the different scales was analyzed, and the following results were obtained: 80 patients understood Scale 1 (40.4%); 188 patients understood Scale 2 (94.9%); 184 patients understood Scale 3 (92.9%); and 186 patients understood Scale 4 (93.9%) (Table 2).
The preferred analysis of the different scales in shown in Fig. 5. According to the bivariate analysis with level of education, gender, years of RA, age groups, duration of the disease based on years of evolution; none of these variables influenced the preference for the scales, neither they influenced the multivariate analysis of the multinomial logistic regression (Table 3).

Bivariate logistic multinomial regression analysis. Dependent variable: scale preference (using category 2 as the baseline for comparison), n = 198.
| Predictor | Beta | Beta standard error | Wald X2 | p | Level of freedom |
|---|---|---|---|---|---|
| Years of education | |||||
| 0.02 | 0.05 | 0.47 | 0.6 | 1 | |
| −0.01 | 0.03 | −0.51 | 0.60 | 1 | |
| 0.02 | 0.041 | 0.71 | 0.47 | 1 | |
| Sex | |||||
| −0.98 | 0.66 | −1.47 | 0.14 | 1 | |
| 0.74 | 0.55 | 1.33 | 0.18 | 1 | |
| −0.17 | 0.57 | 0.30 | 0.76 | 1 | |
| Years of diagnosis of rheumatoid arthritis | |||||
| −0.01 | 0.02 | −0.54 | 0.58 | 1 | |
| −0.00 | 0.01 | −0.32 | 0.74 | 1 | |
| 0.01 | 0.01 | 1.12 | 0.26 | 1 | |
| Age | |||||
| 0.02 | 0.02 | 1.11 | 0.26 | 1 | |
| −0.00 | 0.01 | −0.07 | 0.94 | 1 | |
| 0.00 | 0.01 | 0.42 | 0.67 | 1 | |
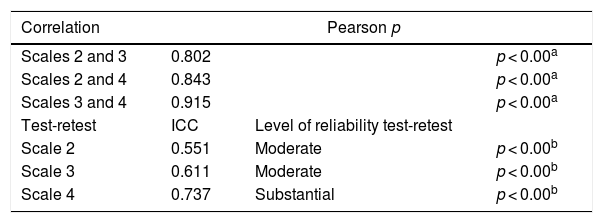
There was a good correlation among Scales 2, 3 and 4, which also showed acceptable reproducibility (ICC: >0.5). Scale 1 could not be analyzed because most patients failed to understand it (Table 4).
Correlation and reproducibility of the scales. ICC: intraclass correlation coefficient: Pearson.
OPH exhibits some drawbacks for its assessment; some of the scales are difficult to understand and apply. In our study, we found that most patients understood the faces scale and the composite scale (CS) in its two versions (>90%), in contrast to the results with VAS. Practically everyone prefers the faces scale and the CS in its two versions, while only 5% prefers VAS. Clark et al.25 assessed the preferences between VAS and the verbal scale (VS) in 113 patients, 85% with RA, and found that the VS was the preferred scale by the vast majority. The primary reason was because it was easy to understand and express their pain using words instead of numbers. The study also said that patients with lower levels of education preferred the verbal scale over VAS (65.1% vs. 15.7%, respectively). Joyce et al.26 compared VAS and a four fixed interval numeric scale (FIN) in 74 patients with chronic pain and most of them preferred the latter because it was easier to understand, more accurate and better described their pain. Van Tubergen et al.27 worked with a group of 536 patients with anchylosing spondylitis and found that most of them (87%) preferred the numeric or Likert type scale, versus VAS, to answer clinimetrics questionnaires.
In our study, the most common levels of education were elementary and incomplete secondary school; however, the univariate and multivariate analyses of the variables (age groups, years with RA, gender, level of education) were not associated with the selection of the different scales, which contrasts with the results from Clark et al.25
Our study has several advantages: a relevant sample as compared to previous studies with a similar objective; it focused exclusively on RA patients; four types of scales were assessed; there were no differences in the distribution of the number of years of evolution of the disease; and it focuses on the assessment of OPH, in contrast with the rest of the studies with similar outcomes, where pain was the target variable assessed.25–30
Our study confirmed the correlation and reproducibility of the faces scale, and the Composite Scale in its vertical and horizontal versions to assess OPH in patients with RA; this finding has been replicated in previous research efforts.25,30–32 This is a confirmation of the fact that these techniques are helpful in clinical practice and are better than VAS for our patients, which is recommended by the developers of DAS.19
In conclusion, we believe that the faces scale and the suggested scales proved to be valid and reproducible; most of our patients did not understand VAS, but they did understand and preferred the faces scale and the scales suggested; none of the variables predicted their selection and could be helpful in clinical practice for RA patients.
LimitationsOur study did not analyze the validity and reproducibility of the visual analogue scale due to its poor comprehension by the subjects assessed. The availability of C-reactive protein and erythrocyte sedimentation rate values was not generalized, but this did not affect the achievement of the objectives set forth.
FinancingThis project was funded by the Colombian Association of Rheumatology.
Conflict of interestThe authors have no conflict of interests to disclose.
Please cite this article as: Díaz E, Cajas J, Casallas A, Abella J, Morales R, Rondón F, et al. Medición de la percepción global de salud mediante diferentes escalas en pacientes con artritis reumatoide: propuesta de una escala combinada. Rev Colomb Reumatol. 2020;27:262–268.
