


The current definition of osteoporosis is based on the dual energy X-ray absorptiometry (DXA), which represents the main technique for the quantification of bone mineral density (BMD) and the evaluation of fracture risk. The objective of this study was to determine the bone mineral density in the lumbar spine and femoral neck of healthy adults from a bone metabolism point of view in a population of Bogotá-Colombia.
MethodAn observational, analytical, cross-sectional study was conducted based on a questionnaire completed by the study population. The densitometric measurements were carried out using a high-performance compact equipment of the General Electric, iDXA model, by the same technologist at the skeletal sites of interest, lumbar spine L1, L2, L3, L4 and L1-4 in anteroposterior projection (AP), and in femoral neck. The sample size calculation was performed taking into account stratification by gender and 2 age groups: 20–29 years, and 30–39 years. A total of 805 individuals were surveyed, and 432 bone densitometries were performed.
ResultsThe values found in the lumbar spine for each of the groups in our population were: 1.150 g/cm2 (SD: 0.11), 1.180 g/cm2 (SD: 0.10), for women and men aged 20–29 years, and 1.169 g/cm2 (SD: 0.10), 1.209 g/cm2 (SD: 0.10) for women and men aged 30–39, respectively. At the level of the femoral neck, 0.991 g/cm2 (SD: 0.10), 1.119 g/cm2 (SD: 0.13), for women and men aged 20–29 years, respectively, and 0.970 g/cm2 (SD: 0.11), 1.079 g/cm2 (SD: 0.13) for women and men aged 30–39, respectively.
ConclusionThis study was able to demonstrate the behavior of bone mineral density in our population, which is lower than that detected in other latitudes and those used as reference values in our equipment. Additionally, the maximum bone mass value was determined in each of the locations of interest for the age ranges of the population in our study.
La actual definición de osteoporosis se basa en la absorciometría de energía dual de Rx (DXA, por sus siglas en inglés), lo cual representa la principal técnica para la cuantificación de la densidad mineral ósea (DMO) y la evaluación del riesgo de fractura. El objetivo de este estudio fue determinar la densidad mineral ósea en columna lumbar y cuello femoral de adultos sanos desde el punto de vista metabólico óseo en una población de Bogotá-Colombia.
MétodosSe realizó un estudio observacional, analítico, de corte transversal, basado en un cuestionario aplicado a la población de estudio. Las medidas densitométricas se realizaron con un equipo compacto de alto rendimiento de la General Electric, modelo iDXA, por el mismo tecnólogo en los sitios esqueléticos de interés, columna lumbar L1, L2, L3, L4 y L1-4 en proyección anteroposterior (AP) y en cuello femoral. El cálculo del tamaño de muestra se llevó a cabo teniendo en cuenta la estratificación por sexo y 2 grupos de edad: 20 a 29 años y 30 a 39 años. Se encuestaron 805 individuos y 432 se realizaron la densitometría ósea.
ResultadosLos valores encontrados en columna lumbar para cada uno de los grupos de nuestra población, fueron: 1,150 g/cm2 (DE: 0,11), 1,180 g/cm2 (DE: 0,10), para mujeres y hombres de 20 a 29 años, y 1,169 g/cm2 (DE: 0,10), 1,209 g/cm2 (DE: 0,10) para mujeres y hombres de 30 a 39 años, respectivamente. A nivel del cuello femoral, 0,991 g/cm2 (DE: 0,10), 1,119 g/cm2 (DE: 0,13), para mujeres y hombres de 20 a 29 años, y 0,970 g/cm2 (DE: 0,11), 1,079 g/cm2 (DE: 0,13) para mujeres y hombres de 30 a 39 años, respectivamente.
ConclusiónEste estudio pudo demostrar el comportamiento de la densidad mineral ósea en nuestra población, la cual es inferior a la detectada en otras latitudes y a las utilizadas como valores de referencia en nuestros equipos. Adicionalmente, se determinó el valor máximo de masa ósea en cada una de las regiones de interés para los rangos de edad de la población de nuestro estudio.
The current definition of osteoporosis is based on dual energy X-ray absorptiometry (DXA), the gold standard to measure bone mineral density (BMD) and to assess the risk of fracture.1–3 In clinical practice, the individual BMD values are compared against reference values. For diagnostic purposes, a panel defined by the World Health Organization (WHO) suggested to define osteoporosis based on the T score (the difference between the measured BMD and the average value of young adults, expressed as standard deviations).1,2 In fact, notwithstanding its limitations,4–6 this definition is used worldwide.
The normal values provided by the equipment manufacturers to measure BMD, do not represent the values of the specific populations. In Colombia, crossbreeding of the population suggests a different BMD behavior. BMD depends on age, disease, genetics, mechanical factors, nutrition and hormonal influences.7–9 The reference values may vary among the different populations.10–16 Furthermore, the accuracy of the normal values depends on the size of the sample and on the selection criteria used in the particular study. If the reference values are inaccurate, there may be an overestimation or underestimation of the diagnostic classification of patients.
The studies conducted in Colombia17–19 have been important to establish the reference values for the country, and to prove that they are not the same in the different populations. However, studies with a very strict methodology are required to make valid estimates. Moreover, the techniques used to establish these reference values were for peripheral anatomic sites (heel bone and forearm), whilst the study by doctor Villegas, was intended to determine the estimated values of the lumbar spine and the femoral neck, but the technology currently used is different. The purpose of this study was to determine the BMD of the lumbar spine and the femoral neck of healthy young adults, from the perspective of bone metabolism, in a population in Bogotá, Colombia.
Materials and methodsThis was an observational, analytical, cross-sectional study, based on a questionnaire administered to the study population, to identify the individuals that met the normal definition, had no exclusion criteria, and who were compliant with the inclusion criteria. The sample was taken from workers or students of the health sector of the “Servicio Nacional de Aprendizaje” (National training center) in Bogotá, Riesgo de Fractura S.A-CAYRE Bogotá, School of Medicine Universidad Colegio Mayor de Nuestra Señora del Rosario, professional soldiers of the X Infantry Battalion, Colombian National Navy, in Bogotá.
The inclusion criteria were the following: 1) male and female adults between 20 and 39 years old; 2) Colombian, and 3) individuals who accepted to participate in the trial and signed the informed consent. The exclusion criteria were: 1) having cancer or a history of cancer, except non-melanoma skin cancer; 2) patients undergoing hemodialysis or peritoneal dialysis; 3) patients who had received radioactive iodine; 4) having received or currently receiving any of the following drugs, for three or more continuous months: oral, inhaled or parenteral corticoids, phenytoin, carbamazepine, phenobarbital, heparin, thyroid hormone, calcium supplements or vitamin D, estrogens or hormone replacement therapy, osteoporosis medications or DMARDs; 5) presence or history of low body weight or obesity; 6) presence or history or menstrual disorders: late menarche or early menopause; amenorrhea for 12 consecutive months or longer—for reasons other than pregnancy, menopause or hysterectomy; 7) presence or history of alcohol abuse or smoking, in accordance with our operational definitions; 8) presence or history of physical inactivity or practicing high performance sports; 9) family history of osteoporosis or vertebral or femoral neck fractures; 10) history of surgeries such as hysterectomy, gastrectomy, intestinal resection or breast, abdomen or buttock implants; 11) individuals with known physical spinal deformities or previous lumbar spine surgery, or bilateral hip replacement; 12) pregnant women; 13) individuals with a history of prematurity; 14) afro-Colombian individuals; 15) individuals that due to their physical condition were unable to undergo a bone scan; 16) individuals who refused to go to the site where the bone scan was performed;; 17) impossibility to read and interpret the bone scan (this criterion was assessed before entering the information into the database for analysis); 18) individuals with a height of less than 145 cm or over 195 cm. The physicians who administered the questionnaire were GPs, previously trained on the operational definitions for each criteria.
The bone scan measurements were conducted by the same technical operator at the skeletal sites of interest: lumbar spine L1, L2, L3, L4 and L1-L4 in the AP view and the femoral neck. The BMD value is expressed in g/cm2 of bone surface explored. These measurements were taken using the DXA technique, in a compact, high performance GE machine, model iDXA, with a precision of 0.3% for the lumbar spine measurements, and of 1.0% in the proximal femur measurements, at low doses of radiation at 5 micro-Sievert. The techniques used were International Society Clinical Densitometry certified, as well as the readers, and were previously reviewed by the expert reader. If the exam technique was defective, the exam was repeated until an adequate technique was ensured. The machine was calibrated every day with the Phantom, before use.
The protocol was approved by an ethics committee and all patients undergoing the bone scan signed the informed consent.
The sample size calculation was done based on gender classification and age groups: 20–29 years and 30–39 years, considering the mean BMD for the population of the United States and Europe (females: 1.180 g/cm2; males: 1.220 g/cm2), with a standard deviation of 0.12 g/cm2, which is preset in the database of the machine used to measure the BMD. The region of interest was L1-L4 and the femoral neck. The type I error considered was 0.05, with 80% power. The calculation was two-tailed. A convenience sampling was conducted and the results of the questionnaire were analyzed in a descriptive manner, using the average as summary measurement and the standard deviation as a measurement of variability. The data obtained on the densitometry estimates were stratified according to age group and gender, and were also descriptively analyzed. The Shapiro-Wilk test was used to assess whether the BMD data resulted from a normal distribution. The median for each region of interest (lumbar spine and femoral neck) in the gender-based groups was determined to establish the maximum BMD value.
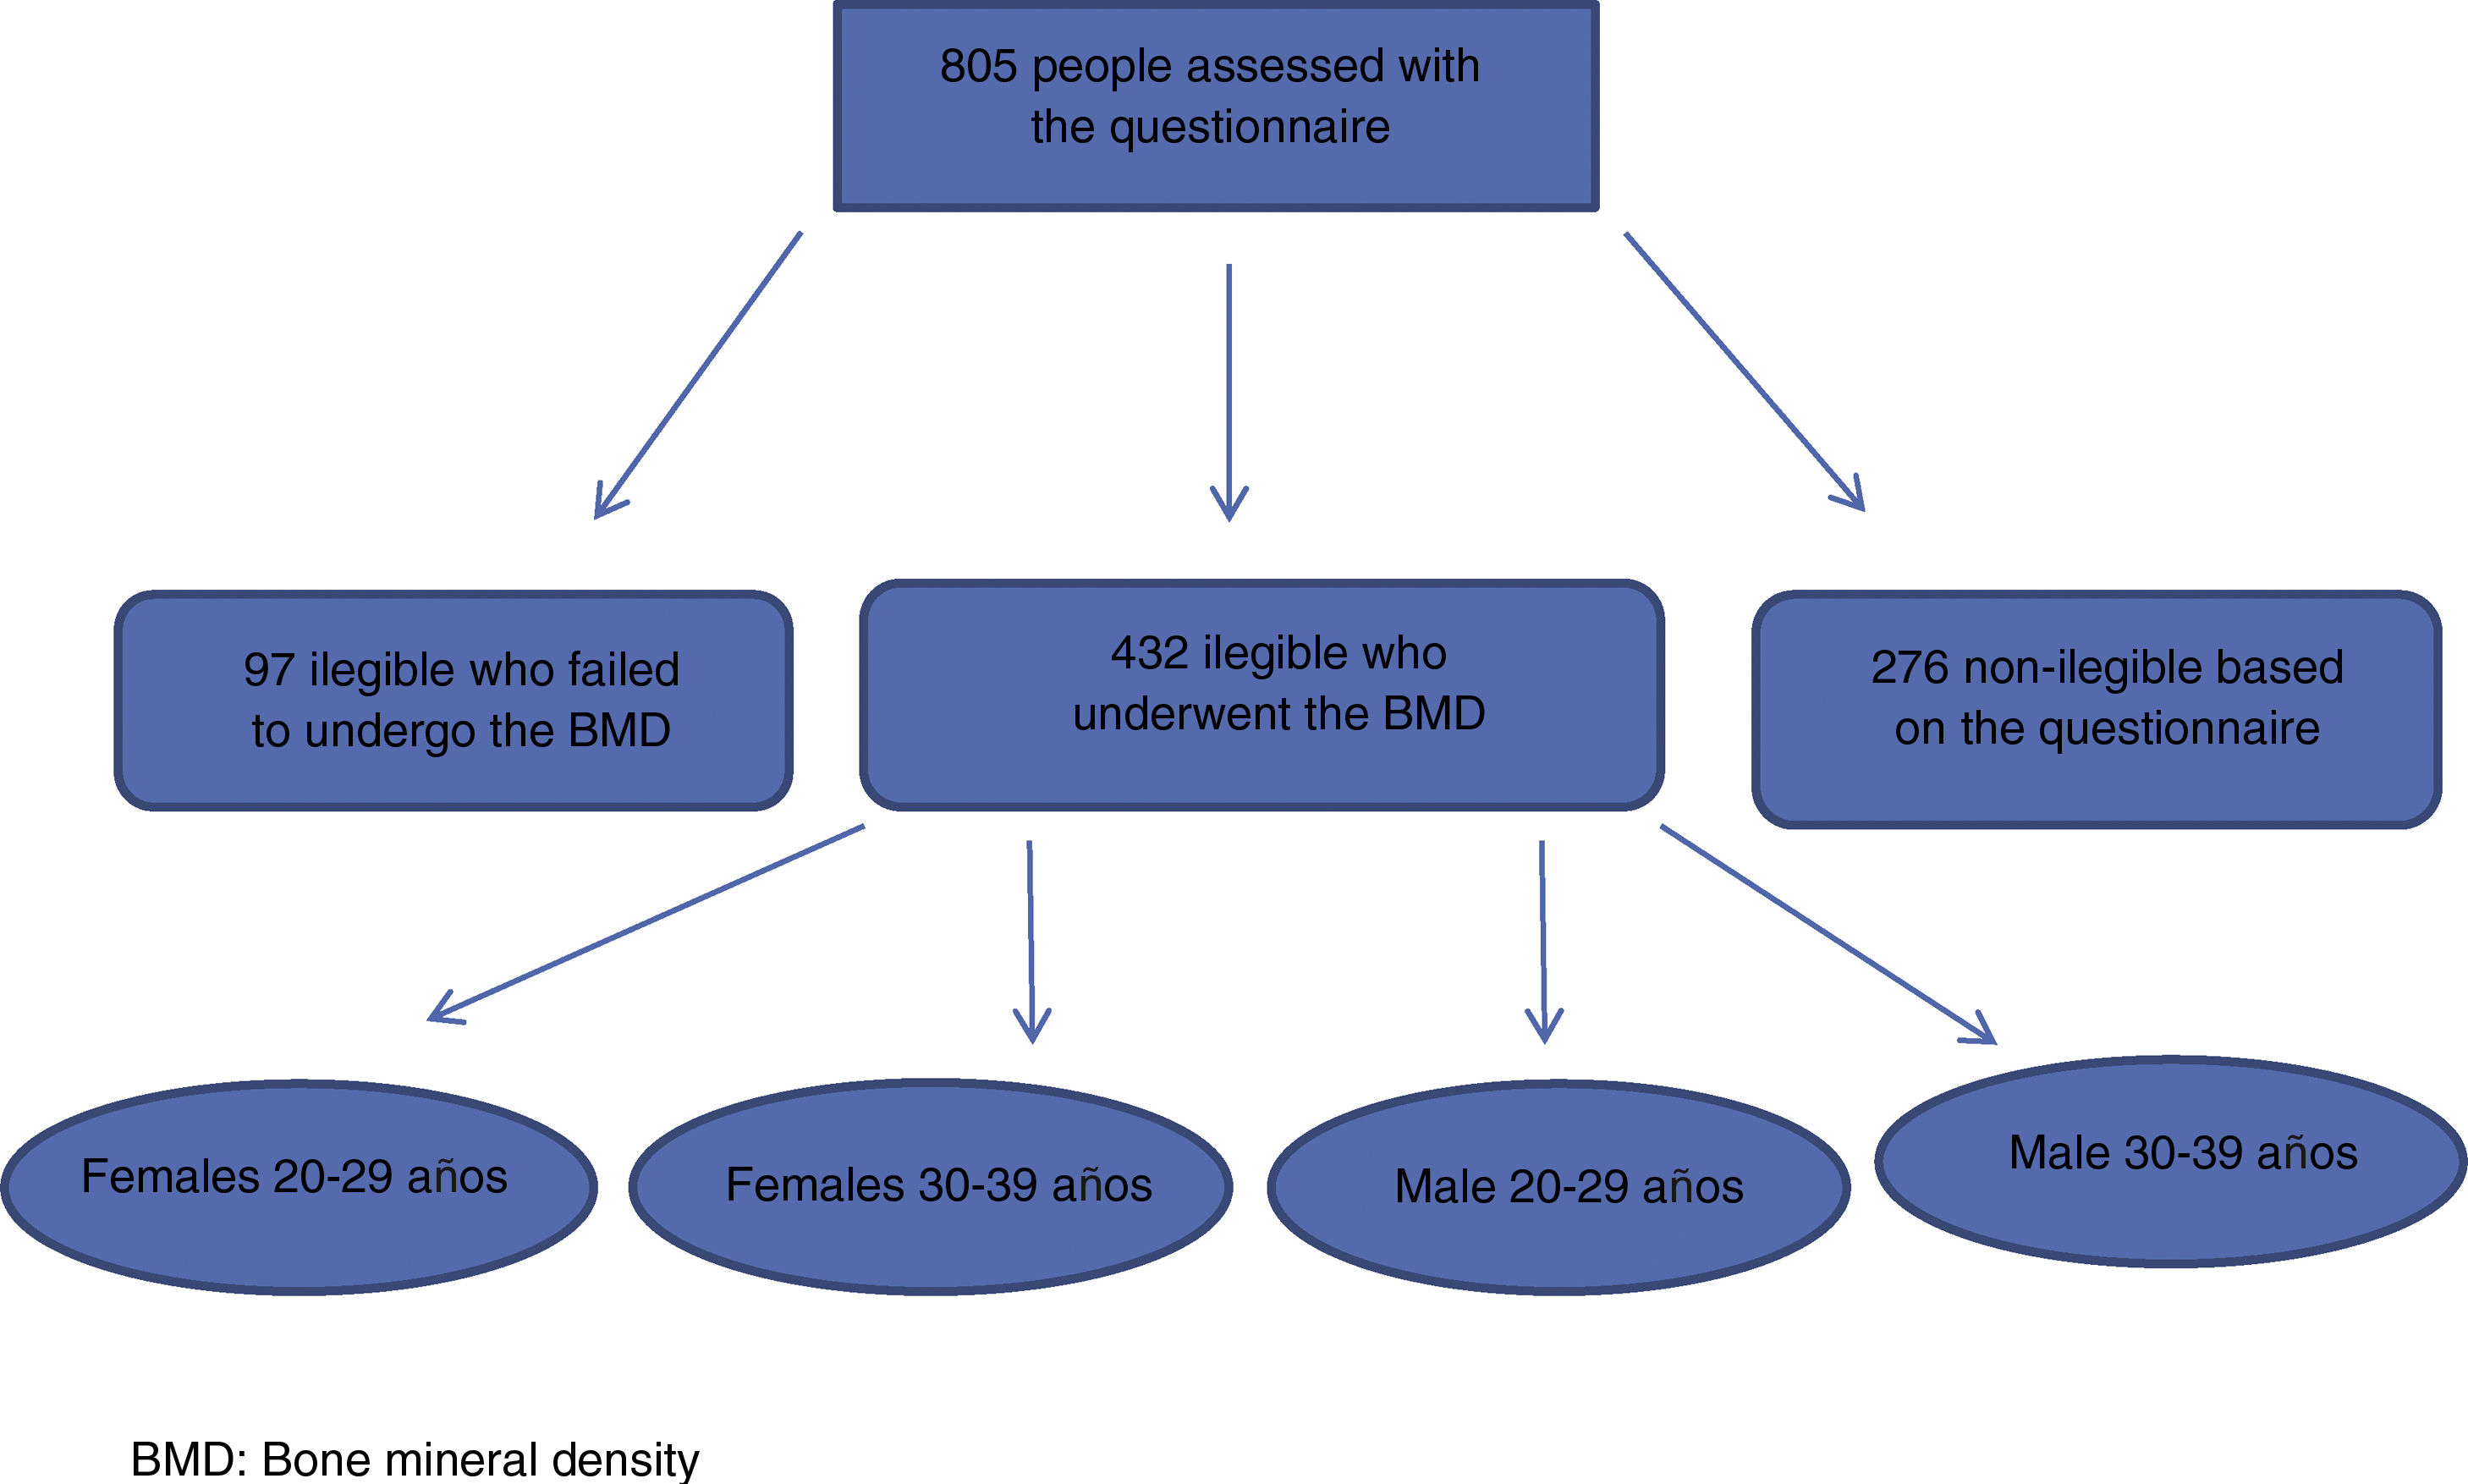
ResultsA total of 805 individuals who accepted to answer the questions of the questionnaire were surveyed (Fig. 1), of which 529 were eligible, but only 432 showed up for the scan; the remaining 276 were not eligible.

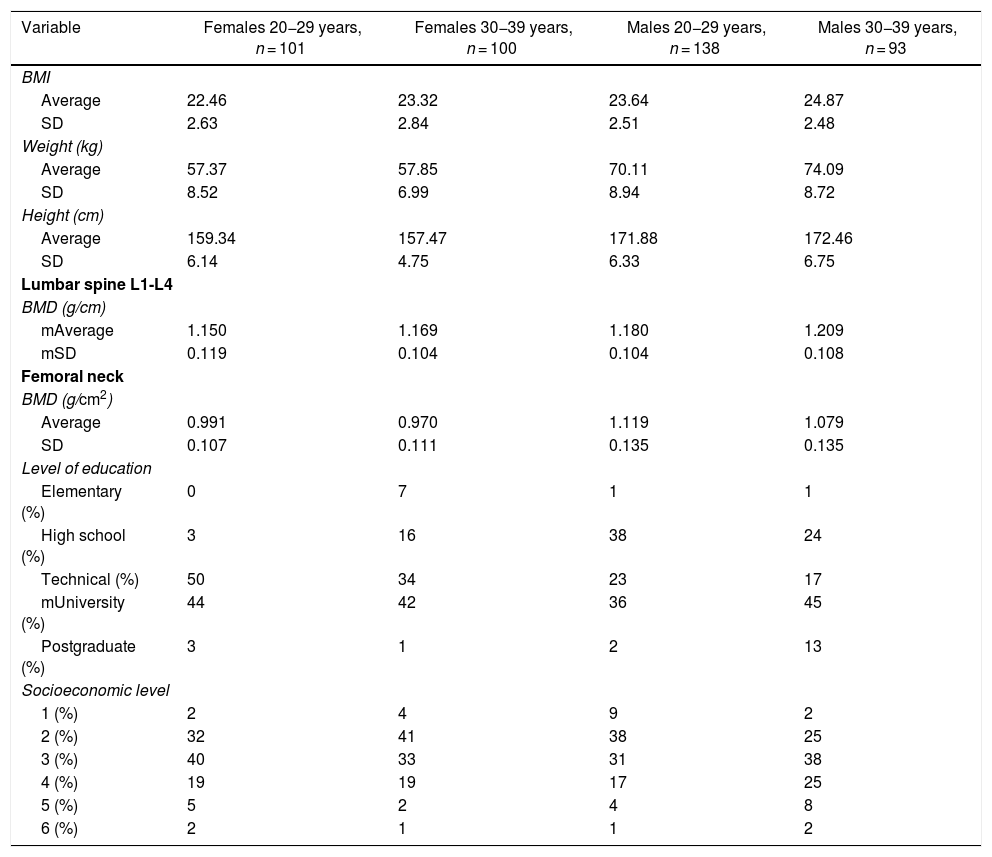
Most of the population was from social level 2, 3 and 4 in Bogotá, Colombia, and the majority completed elementary school and university. The values reported for the lumbar spine for each group were as follows: 1.150 g/cm2 (SD = 0.11) and 1.180 g/cm2 (SD = 0.10) for females and males between 20–29 years, and 1.169 g/cm2 (SD = 0.10) and 1.209 g/cm2 (SD = 0.10) for females and males between 30–39 years, respectively. In terms of the femoral neck, 0.991 g/cm2 (SD = 0.10) and 1.119 g/cm2 (SD = 0.13) for females and males 20–29 years, and 0.970 g/cm2 (SD = 0.11) and 1.079 g/cm2 (SD = 0.13) for females and males 30–39 years, respectively (Table 1).
Data of the healthy population and reference values.
| Variable | Females 20−29 years, n = 101 | Females 30−39 years, n = 100 | Males 20−29 years, n = 138 | Males 30−39 years, n = 93 |
|---|---|---|---|---|
| BMI | ||||
| Average | 22.46 | 23.32 | 23.64 | 24.87 |
| SD | 2.63 | 2.84 | 2.51 | 2.48 |
| Weight (kg) | ||||
| Average | 57.37 | 57.85 | 70.11 | 74.09 |
| SD | 8.52 | 6.99 | 8.94 | 8.72 |
| Height (cm) | ||||
| Average | 159.34 | 157.47 | 171.88 | 172.46 |
| SD | 6.14 | 4.75 | 6.33 | 6.75 |
| Lumbar spine L1-L4 | ||||
| BMD (g/cm) | ||||
| mAverage | 1.150 | 1.169 | 1.180 | 1.209 |
| mSD | 0.119 | 0.104 | 0.104 | 0.108 |
| Femoral neck | ||||
| BMD (g/cm2) | ||||
| Average | 0.991 | 0.970 | 1.119 | 1.079 |
| SD | 0.107 | 0.111 | 0.135 | 0.135 |
| Level of education | ||||
| Elementary (%) | 0 | 7 | 1 | 1 |
| High school (%) | 3 | 16 | 38 | 24 |
| Technical (%) | 50 | 34 | 23 | 17 |
| mUniversity (%) | 44 | 42 | 36 | 45 |
| Postgraduate (%) | 3 | 1 | 2 | 13 |
| Socioeconomic level | ||||
| 1 (%) | 2 | 4 | 9 | 2 |
| 2 (%) | 32 | 41 | 38 | 25 |
| 3 (%) | 40 | 33 | 31 | 38 |
| 4 (%) | 19 | 19 | 17 | 25 |
| 5 (%) | 5 | 2 | 4 | 8 |
| 6 (%) | 2 | 1 | 1 | 2 |
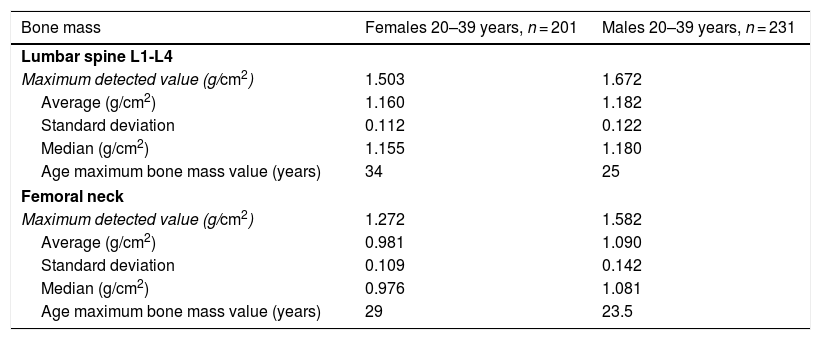
The assessment of BMD distribution was made using a Shapiro-Wilk test; the results indicated a normal distribution both for the lumbar spine and for the femoral neck in females of the various age groups. In the case of males, only the group between 30–39 years showed a normal distribution in the 2 regions of interest (lumbar spine and femoral neck), but this was not the case for the age group from 20–29 years (P = .00243 and .00418, respectively). The maximum bone mass value in our study population corresponded to females in the lumbar spine at 34 years and in the femoral neck at 29 years. In the case of males, the maximum bone mass value in the lumbar spine was found at 25 years, and in the femoral neck at 23.5 years (Table 2).
Maximum bone mass value in males and females.
| Bone mass | Females 20–39 years, n = 201 | Males 20–39 years, n = 231 |
|---|---|---|
| Lumbar spine L1-L4 | ||
| Maximum detected value (g/cm2) | 1.503 | 1.672 |
| Average (g/cm2) | 1.160 | 1.182 |
| Standard deviation | 0.112 | 0.122 |
| Median (g/cm2) | 1.155 | 1.180 |
| Age maximum bone mass value (years) | 34 | 25 |
| Femoral neck | ||
| Maximum detected value (g/cm2) | 1.272 | 1.582 |
| Average (g/cm2) | 0.981 | 1.090 |
| Standard deviation | 0.109 | 0.142 |
| Median (g/cm2) | 0.976 | 1.081 |
| Age maximum bone mass value (years) | 29 | 23.5 |
This is the first study conducted in Colombia to establish the reference values for BMD. The healthy population was methodologically defined from the bone metabolism perspective, with very strict inclusion and exclusion criteria. The resulting findings ratify the hypothesis that healthy individuals have lower BMD values, both in the lumbar spine and in the femoral neck, as compared to the reference values of the machine software programs currently used to do the bone scans in the country. This is consistent with the findings of similar trials conducted in Latin American populations, including Brazil.20–23
Our study took all the precautions to avoid potential selection biases, a poor classification, and confounding variables. Hence, a questionnaire was developed with very strict variables to rule out any individuals with factors that could impact the BMD or bone metabolism. Furthermore, the machine used for the bone scans was Phantom calibrated on a daily basis, the staff administering the questions to the participants was consistently trained, as well as the technical staff and the physicians that conducted and interpreted the tests, which were conducted in a state-of-the-art equipment, with high precision, and generating minimal radiation.
One of the limitations of the trial was that the sample population came from the urban area, had a good level of education, and afro-descendants were excluded. Hence, the results cannot be generalized to the entire population in the country. Moreover, the study population was very homogeneous, and very stringent inclusion and exclusion criteria were implemented, which prevented any potential biases and confounding variables; however, this may not necessarily reflect the bone mass behavior of the Colombian population.
These findings highlight the need to conduct new trials involving a population with a broader age range, including individuals from various socioeconomic levels, different ethnic groups and areas of origin, to validate the results herein discussed. Likewise, there is a need to validate the questionnaire developed in order to be able to identify the population with healthy bones, and determine the prevalence of osteopenia and osteoporosis Colombian.
Additionally, the study is an invitation to reflect about the approach to classify patients as normal, with osteopenia or osteoporosis, in the daily clinical practice, exclusively based on the software ratings of the equipment manufacturers. This values are different from the BMD values identified in our population, as will be demonstrated in a new trial. This is why it is important to create awareness among the medical professionals about this limitation, and try to establish parameters for classifying the bone health of our patients with a different approach, rather than simply based on the results of the bone scan.
In conclusion, this study proves that the levels of BMD in our population are lower than those identified in populations in other geographies, as well as ratings used as reference values in our machines. Moreover, our study determined the maximum bone mass value for each of the regions of interest, for the age ranges of the population in our study.
FundingThis research was funded by Riesgo de Fractura S.A. Colombia, plus a 10 million pesos prize awarded for being the winner of a contest of the Colombian Association of Rheumatology.
Conflict of interestsThe authors have no conflicts of interest to disclose.
Please cite this article as: Jáuregui E, Galvis M, Moncaleano V, González K, Muñoz Y. Valores de referencia de la densidad mineral ósea por densitometría tipo DXA en una población adulta sana de Bogotá. Rev Colomb Reumatol. 2021;28:46–51.
