


The aim of this study was to determine the behaviour of ultrasound biomarkers of fascicle density and muscle strength in patients with amyotrophic lateral sclerosis (ALS).
MethodsWe conducted an observational, cross-sectional pilot study of 14 patients with ALS (28.6% women) and 14 controls. Bilateral cross-sectional ultrasound scans were performed in the abductor pollicis brevis (APB) and tibialis anterior (TA) muscles, with recording of muscle thickness (MT) at rest and in contraction, and the difference in thickness. In the median, sciatic, and common peroneal nerves, we analysed the cross-sectional area (CSA), number of fascicles (NF) and fascicle density (FD). Analyses were nested by laterality.
ResultsIntra- and interrater agreement regarding NF was very good, with a minimum detectable error of < 0.7%. In patients with ALS, MT was lower in the APB both at rest (P = .003; g-Hedges = 1.03) and in contraction (P = .017; g-Hedges = 0.78) and in TA at rest (P = .002; g-Hedges = 0.15) and in contraction (P = .001; g-Hedges = 0.46), with lower thickening capacity. In the nerves, patients displayed lower CSA, with lower NF and higher FD. Significant correlations were found between MT of the ABP and Medical Research Council (MRC) scores for muscle strength (r = 0.34; r2 = 12%; P = .011) and with revised ALS Functional Rating Scale scores (r = 0.44; r2 = 19%; P < .001). The difference in TA thickening correlated with MRC scores (r = 0.30; r2 = 15%; P = .003) and with revised ALS Functional Rating Scale scores (r = 0.26; r2 = 7%; P = .049). NF in the sciatic nerve showed a significant correlation with MRC scores (r = 0.35; r2 = 12%; P = .008).
ConclusionMT measurements derived from dynamic testing together with NF and FD may be useful biomarkers for monitoring patients with ALS and establishing a prognosis.
El objetivo del trabajo fue conocer el comportamiento de los biomarcadores ecográficos de densidad fascicular y fuerza muscular en pacientes con ELA.
MétodosEstudio piloto, observacional y transversal sobre 14 pacientes con ELA (mujeres; 28,6%) y 14 controles. Se tomaron ecografías bilaterales transversales en el abductor corto del pulgar (ACP) y tibial anterior (TA) con registro del grosor muscular (GM) en reposo, en contracción y diferencia de engrosamiento. En los nervios mediano, ciático y peroneo común se analizaron el área de sección transversal (AST), el número de fascículos (NF) y la densidad fascicular (DF). Los análisis se realizaron anidados por lateralidad.
ResultadosEl acuerdo intra-interobservador en los recuentos de fascículos fue muy bueno con un error mínimo detectable <0,7%. El GM del ACP fue menor en los pacientes con ELA tanto en reposo (p = 0,003; g = 1,03) como en contracción (p = 0,017; g = 0,78) y en el TA en reposo (p = 0,002; g = 0,15) y contracción (p = 0,001; g = 0,46), con una menor capacidad de engrosamiento. En los nervios se detectó una menor AST, con menor NF y una mayor DF. Se encontraron correlaciones significativas entre el GM del ACP y la MRC (r = 0,34; r2 = 12%; p = 0,011) y con la ALSFRS-r (r = 0,44; r2 = 19%; p < 0,001). La diferencia de engrosamiento del TA se correlacionó con la MRC (r = 0,30; r2 = 15%; p = 0,003) y con la ALSFRS-r (r = 0,26; r2 = 7%; p=0,049). El NF del nervio ciático mostró una correlación significativa con la MRC r = 0,35; r2 = 12%; p = 0,008).
ConclusiónLas mediciones del GM derivadas de las pruebas dinámicas junto con el NF y DF podrían ser biomarcadores de utilidad para monitorizar pacientes con ELA y su evaluación pronóstica.
Amyotrophic lateral sclerosis (ALS) is a fatal, progressive neurodegenerative disease that most frequently affects adults aged 65–74 years.1,2 It is characterised by upper and lower motor neuron degeneration, which causes fine motor dysfunction, gait alterations, speech disorders, swallowing dysfunction, and respiratory muscle weakness.3 Diaphragmatic dysfunction, which ultimately leads to respiratory failure, is the most frequent cause of death, occurring 3–5 years after symptom onset.4
Diagnosis of ALS is currently based on the presence of characteristic clinical signs and symptoms and the results of clinical and radiological tests, which may present low sensitivity at early stages.5
No specific diagnostic biomarkers for ALS are currently available, which results in a diagnostic delay of 8–15 months. This is partly due to the highly variable and progressive nature of symptoms,6 which may lead to misdiagnosis (radiculopathy, autoimmune neuropathy, etc), as well as to the different courses of the disease (bulbar or spinal, associated with dementia or Parkinson’s disease, presenting with primary diaphragmatic dysfunction, etc) and the low sensitivity and specificity of diagnostic techniques at early stages.
This underscores the need to identify new markers for the diagnosis, phenotyping, progression, and prognosis of ALS.7
Some authors have contributed significant advances, using quantitative muscle ultrasonography to diagnose ALS and concluding that, although its use in ALS diagnosis is not standardised, the technique is a painless, rapid, and easy-to-perform method for detecting meaningful muscle changes in patients with ALS. Several studies with ultrasound have demonstrated that disease progression causes decreased muscle thickness (MT)8 as a consequence of atrophy, increased echointensity7 with substantial changes in texture parameters9 due to irregular intramuscular formation of noncontractile, fibrotic, and adipose tissue infiltration,10 and an increase in fasciculations as a result of denervation.11
Other authors have recently suggested that nerve changes may precede muscle changes, and have been able to detect peripheral nerve atrophy in patients with ALS by ultrasound measurement of nerve diameter and cross-sectional area (CSA).12–16 Cartwright et al.17 and Ridolfi et al.18 used an ultra-high-frequency ultrasound device to analyse the internal structure of the median nerve in healthy individuals, measuring fascicle number (FN) and density (FD), and underscoring the potential usefulness of this high-definition technique in ALS.
The main purpose of our study is to analyse the behaviour of these new and little-studied biomarkers FN and FD in the median (MN), sciatic (SN), and common peroneal (CPN) nerves in a group of patients with ALS and a control group of healthy participants. As a secondary objective, we analysed the possible association between these variables and muscle strength and level of disability.
Material and methodsStudy designWe conducted a cross-sectional observational study following the Strengthening the Reporting of Observational Studies in Epidemiology (STROBE) statement.19
Context and participantsBetween December 2019 and February 2020, we recruited 14 consecutive patients with possible, probable, or definite ALS according to the El Escorial criteria.20 All patients were diagnosed, recruited, and examined by the same professional (EMFC), an experienced neurologist working at the ALS unit of Hospital General Universitario Santa Lucía, in Cartagena (Spain).
We also recruited 14 age- and sex-matched healthy individuals with no neurological disease.
Our study was approved by the ethics committees of our hospital and the University of Murcia. All participants were informed about the purpose of the study and gave written informed consent.
Clinical and sociodemographic variablesAll patients were examined on the same day that the ultrasound studies were performed. We recorded sex, age, weight, height, and body mass index (BMI), as well as the following clinical variables: progression time since diagnosis, form of onset of the disease, presence of fasciculations, level of disability as measured with the Amyotrophic Lateral Sclerosis Functional Rating Scale (ALSFRS-R, scored 0–48),21 and muscle strength (global, bilateral, and of the abductor pollicis brevis [APB] and tibialis anterior [TA] muscles) with the Medical Research Council scale (grades 0–5, with plus and minus subdivisions).22
Ultrasound examinationUltrasound examinations were performed by an ultrasound expert (JJMP) blind to clinical data using a Logiq E R8 ultrasound device (General Electric Company; 2019 software) equipped with a 12L-RS linear transducer (7−13 MHz). Such image optimisation parameters as gain, greyscale map, depth, and frequency remained constant for all the structures analysed during the study. The focal zone was set on the internal structure of the nerve to ensure the best possible reflection. The angle of the probe was adjusted until the best muscle echointensity was obtained in every image.7
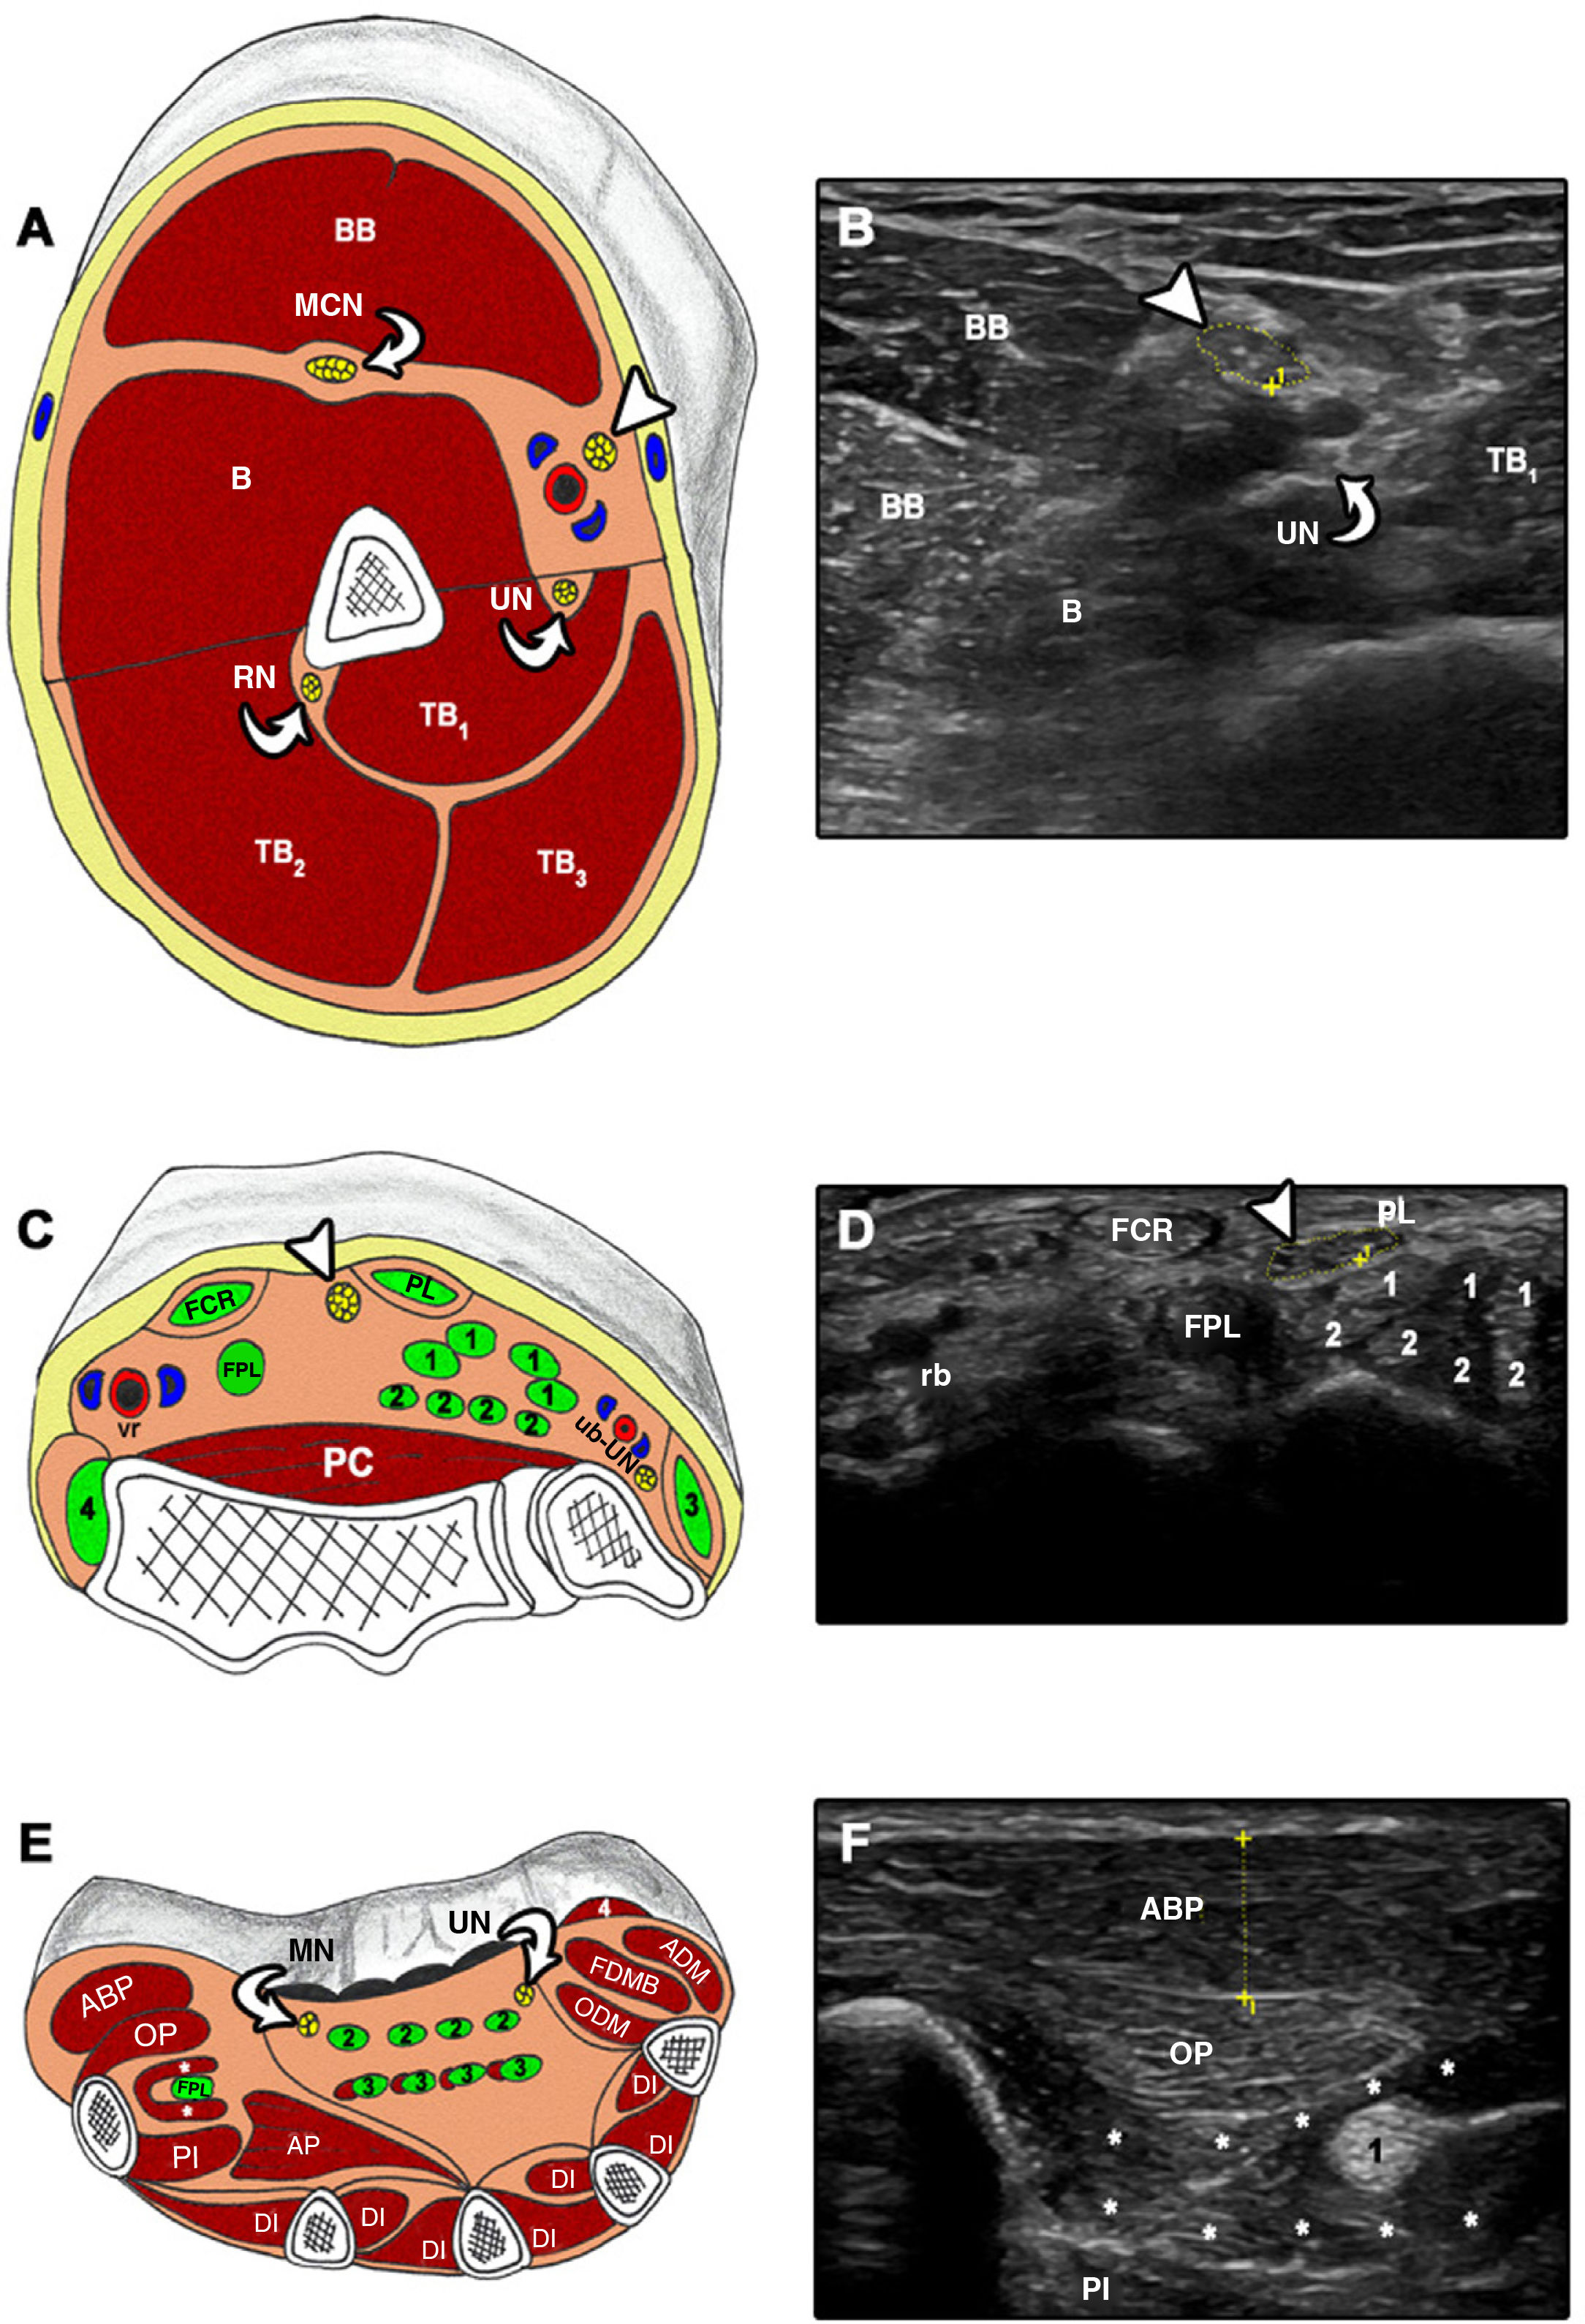
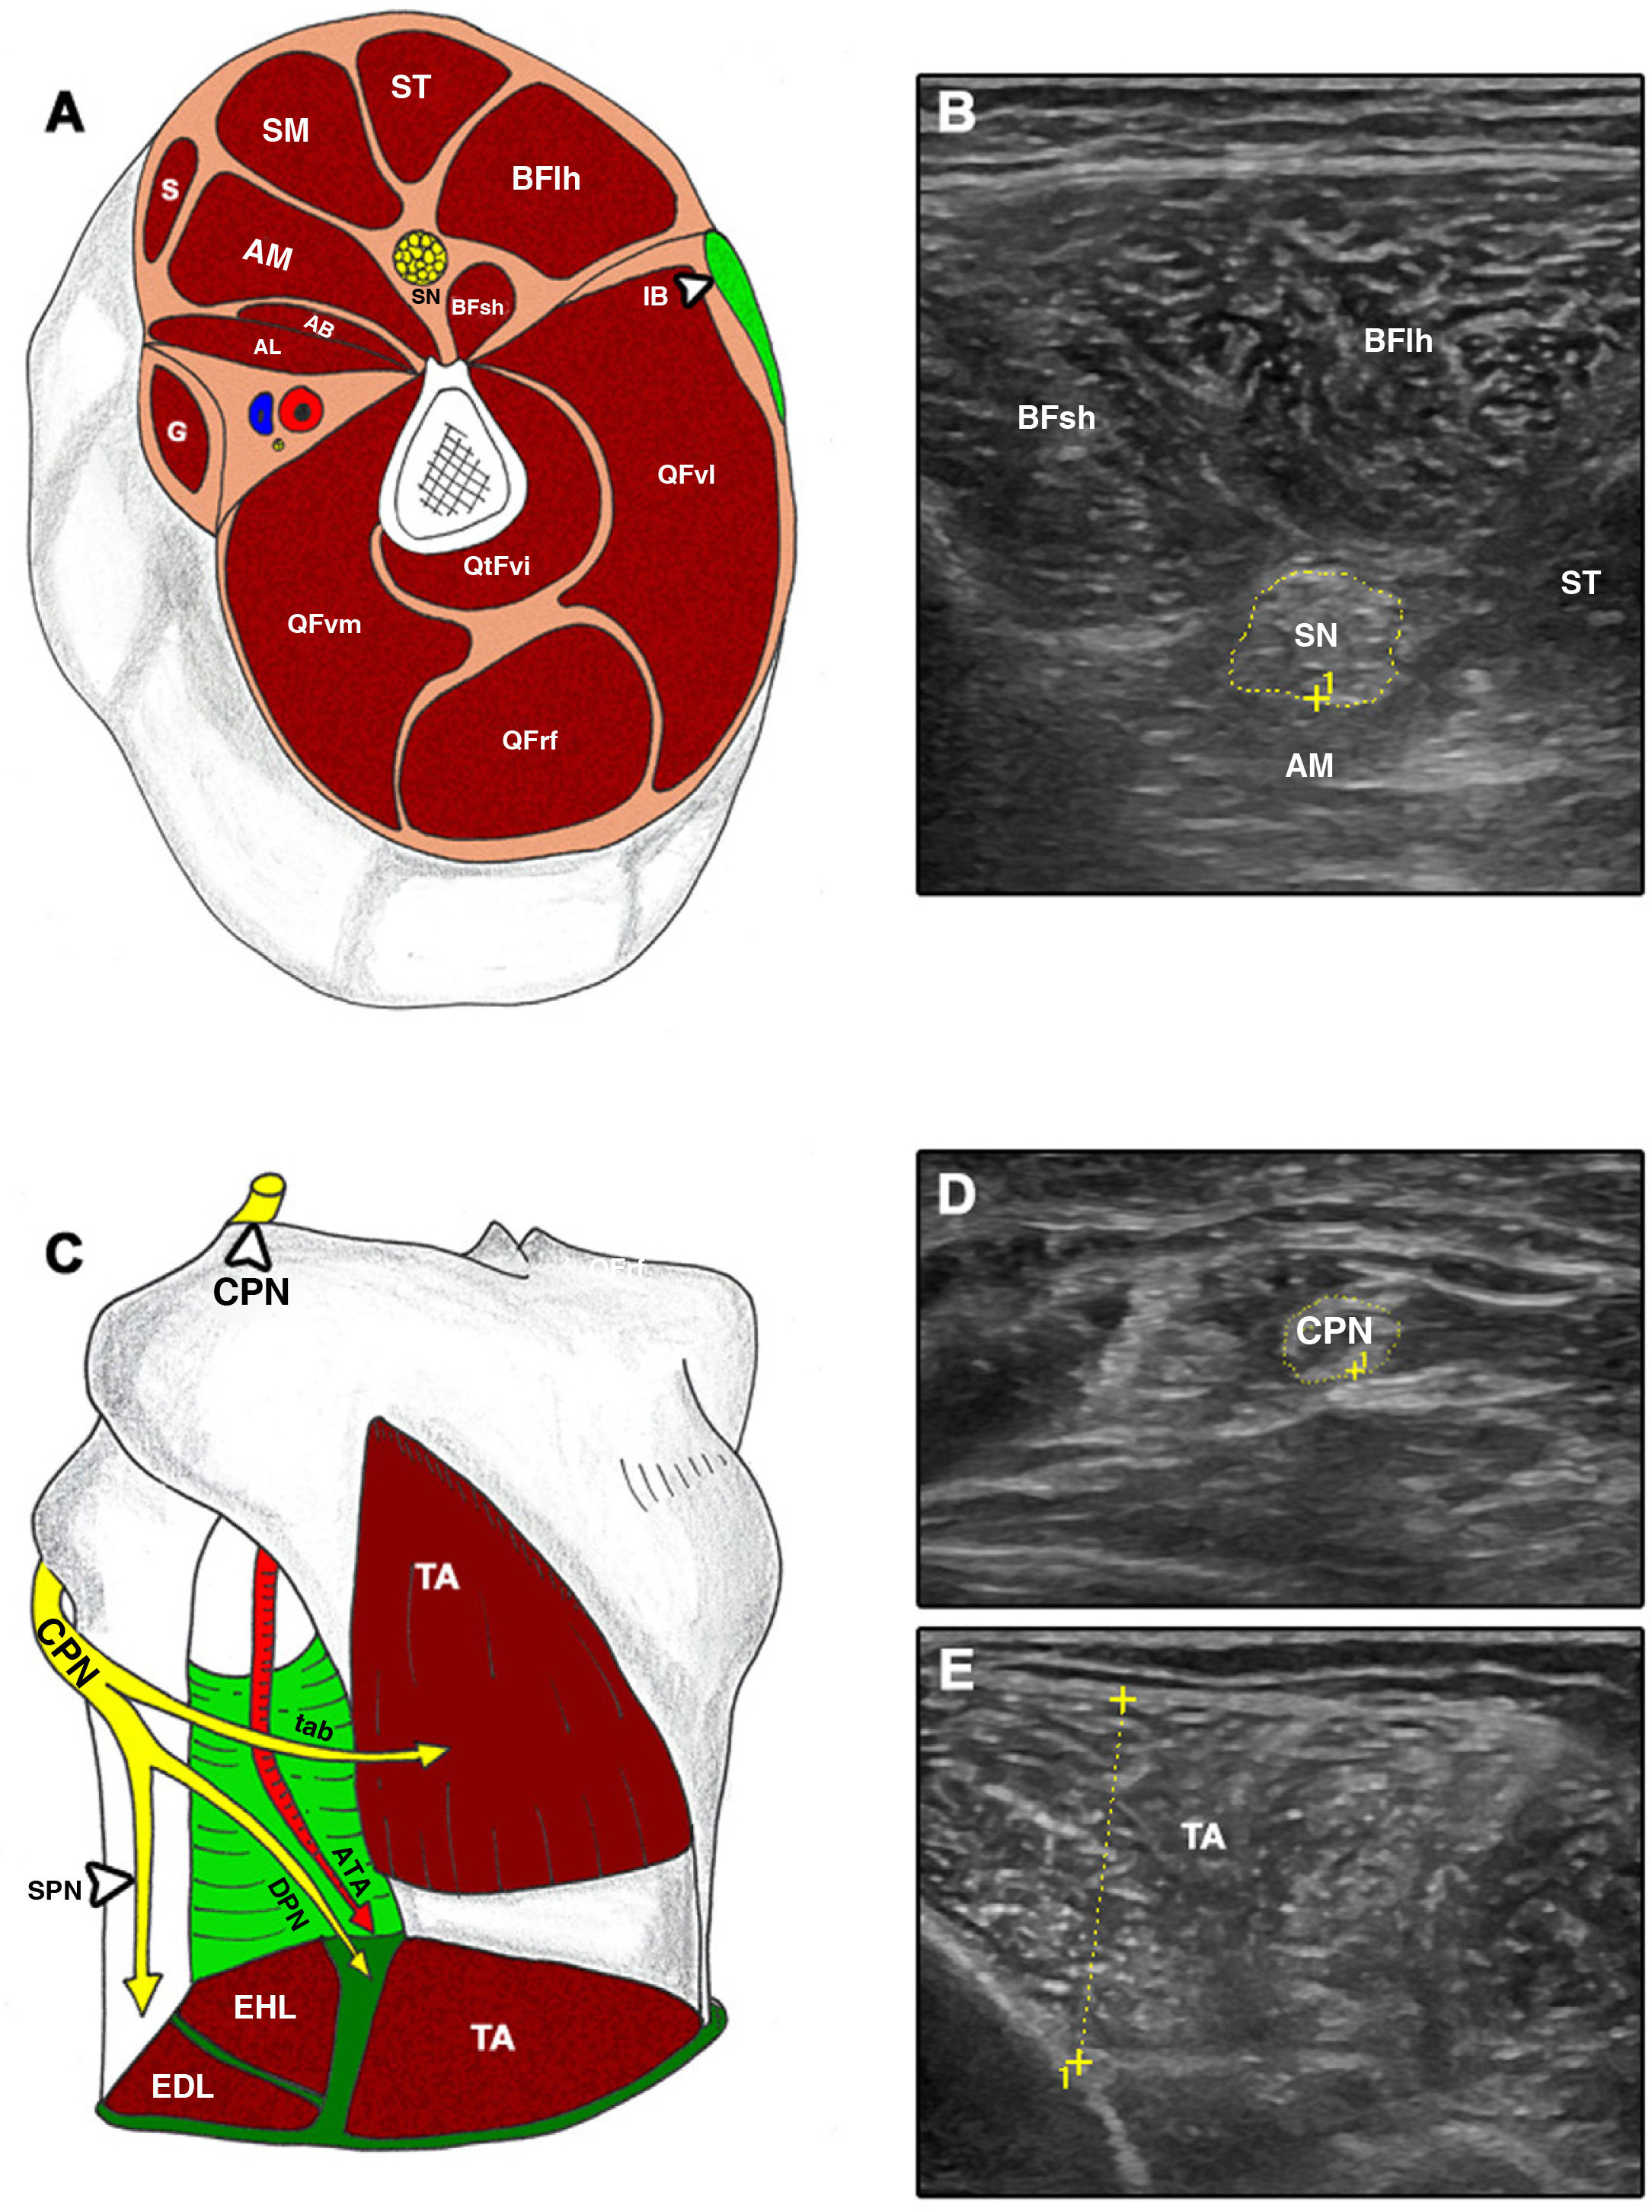
All examinations were performed bilaterally; 3 cross-sectional images were taken from each structure7,23 according to the following protocol (Figs. 1 and 2): 1) MN at the mid-point between the medial epicondyle of the humerus and the axilla12; 2) MN at the wrist, immediately proximal to the carpal tunnel18; 3) APB along the line connecting the mid-point of the volar aspect of the first metacarpophalangeal joint and the volar prominence of the scaphoid bone13,24; 4) SN in the distal third of the thigh and proximal to its division into CPN and anterior tibial nerve25; 5) CPN, proximally to the head of the fibula25; and 6) TA at one-fourth distance from the inferior aspect of the patella to the lateral malleolus.7
 MN at the level of the upper arm. B: brachialis; BB: biceps brachii; MCN: musculocutaneous nerve; RN: radial nerve; TB: triceps brachii; UN: ulnar nerve. Arrowhead: median nerve. C and D) FCR: flexor carpi radialis; FPL: flexor pollicis longus; PC: pronator quadratus; PL: palmaris longus; rb: radial neurovascular bundle; ub: ulnar neurovascular bundle; UN: ulnar nerve. 1: flexor digitorum superficialis; 2: flexor digitorum profundus; 3: flexor carpi ulnaris; 4: brachioradialis. Arrowhead: median nerve. E and F) ABP: abductor pollicis brevis; ADM: abductor digiti minimi; AP: adductor pollicis; DI: dorsal interossei; FDMB: flexor digiti minimi brevis; FPL: flexor pollicis longus; MN: median nerve; ODM: opponens digiti minimi; OP: opponens pollicis; PI: palmar interossei; UN: ulnar nerve; 1: flexor pollicis longus; 2: flexor digitorum superficialis; 3: flexor digitorum profundus; 4: palmaris brevis. Asterisk: flexor pollicis brevis.")
Cross-sectional ultrasound imaging and anatomical correlations of the upper limb.
A and B) MN at the level of the upper arm. B: brachialis; BB: biceps brachii; MCN: musculocutaneous nerve; RN: radial nerve; TB: triceps brachii; UN: ulnar nerve. Arrowhead: median nerve. C and D) FCR: flexor carpi radialis; FPL: flexor pollicis longus; PC: pronator quadratus; PL: palmaris longus; rb: radial neurovascular bundle; ub: ulnar neurovascular bundle; UN: ulnar nerve. 1: flexor digitorum superficialis; 2: flexor digitorum profundus; 3: flexor carpi ulnaris; 4: brachioradialis. Arrowhead: median nerve. E and F) ABP: abductor pollicis brevis; ADM: abductor digiti minimi; AP: adductor pollicis; DI: dorsal interossei; FDMB: flexor digiti minimi brevis; FPL: flexor pollicis longus; MN: median nerve; ODM: opponens digiti minimi; OP: opponens pollicis; PI: palmar interossei; UN: ulnar nerve; 1: flexor pollicis longus; 2: flexor digitorum superficialis; 3: flexor digitorum profundus; 4: palmaris brevis. Asterisk: flexor pollicis brevis.
 AB: adductor brevis; AL: adductor longus; AM: adductor magnus; BFlh: long head of the biceps femoris; BFsh: short head of the biceps femoris; G: gracilis; IB: iliotibial band; QFrf: quadriceps femoris – rectus femoris; QFvi: quadriceps femoris – vastus intermedius; QFvl: quadriceps femoris – vastus lateralis; QFvm: quadriceps femoris – vastus medialis; S: sartorius; SM: semimembranosus; SN: sciatic nerve; ST: semitendinosus. C–E) ATA: anterior tibial artery; CPN: common peroneal nerve; DPN: deep peroneal nerve; EDL: extensor digitorum longus; EHL: extensor hallucis longus; SPN: superficial peroneal nerve; TA: tibialis anterior; tab: tibialis anterior branch.")
Cross-sectional ultrasound imaging and anatomical correlations of the lower limb.
A and B) AB: adductor brevis; AL: adductor longus; AM: adductor magnus; BFlh: long head of the biceps femoris; BFsh: short head of the biceps femoris; G: gracilis; IB: iliotibial band; QFrf: quadriceps femoris – rectus femoris; QFvi: quadriceps femoris – vastus intermedius; QFvl: quadriceps femoris – vastus lateralis; QFvm: quadriceps femoris – vastus medialis; S: sartorius; SM: semimembranosus; SN: sciatic nerve; ST: semitendinosus. C–E) ATA: anterior tibial artery; CPN: common peroneal nerve; DPN: deep peroneal nerve; EDL: extensor digitorum longus; EHL: extensor hallucis longus; SPN: superficial peroneal nerve; TA: tibialis anterior; tab: tibialis anterior branch.
A researcher with experience in imaging analysis (JJMP) used the electronic caliper of the ultrasound device to measure the CSA of the MN, SN, and CPN, taking the internal rim of the most hyperechoic epineurium as a reference. We also measured MT in the APB and TA at rest and at maximal isometric contraction, following a proposal from a recent article, to evaluate the difference between resting and contracted MT.26
FN was quantified directly on the display of the ultrasound device and FD was calculated by dividing FN by CSA.
The mean of the 3 values obtained for each structure was used in the statistical analysis.
Finally, a researcher randomly selected 30 images of nerve structures, which were used by 2 blinded researchers to study intra- and interobserver reliability and reproducibility for FN only, as the remaining biomarkers analysed in this article have been widely studied.7,13,17,26 Images were independently evaluated by both researchers after 2 weeks to prevent a recall effect.
Statistical analysisWe performed a descriptive analysis of quantitative variables, calculating means and standard deviations (SD), as well as ranges and quartiles. Qualitative variables are presented as numbers and percentages. We tested for normal distribution with the Shapiro-Wilk test and normality plots, and calculated the coefficients of asymmetry and kurtosis.
The intra- and interobserver reproducibility analysis was performed by calculating the intraclass correlation coefficient (ICC) with a two-way random effects model (ICC2,1) and absolute agreement for each of the variables of interest.27,28 The ICC is considered to indicate excellent agreement for values > 0.90, good agreement for values 0.75−0.90, moderate agreement for values 0.50−0.70, and poor agreement for values < 0.5.29 We also calculated the limits of agreement following the procedure described in the literature30,31 and the presence of summative or multiplicative bias with the linear regression method described by Passing-Bablock.32,33
To ensure the clinical applicability of our analysis, we calculated the standard error of measurement (SEm = SD · √[1 – ICC]) and its relative value with respect to the average of all measurements,34,35 as well as the smallest real difference (SRD) to determine whether a change in a parameter is due to real change or lies within the limits of error of the measurement (SRD = 1.96 · SEm · √2).36
Lastly, we applied the graphic approach proposed by Luiz et al.,37 which shows the percentage of cases for which a specific level of agreement is reached.
The comparison between patients with ALS and controls for each variable in nerve and muscle structures was performed with mixed linear models stratified by laterality to compare all quantitative ultrasound parameters by age, sex, and BMI. In addition to confidence intervals and statistical significance values (P-values), we calculated the effect sizes of the differences between groups using Hedges’ g,38 which characterises effect size as small (g < 0.20), moderate (g around 0.50), or large (g > 0.80).
The correlations between ALSFRS-R scores and MRC grades were examined with the Pearson correlation coefficient (r) and the coefficient of determination (R2), which measure the percentage of variation shared between 2 variables.
Analysis was performed with IBM SPSS Statistics, version 19.0 (SPSS Inc., 2010), and the jmv package (version 0.9)39 for R (version 3.5.0, 2018).40
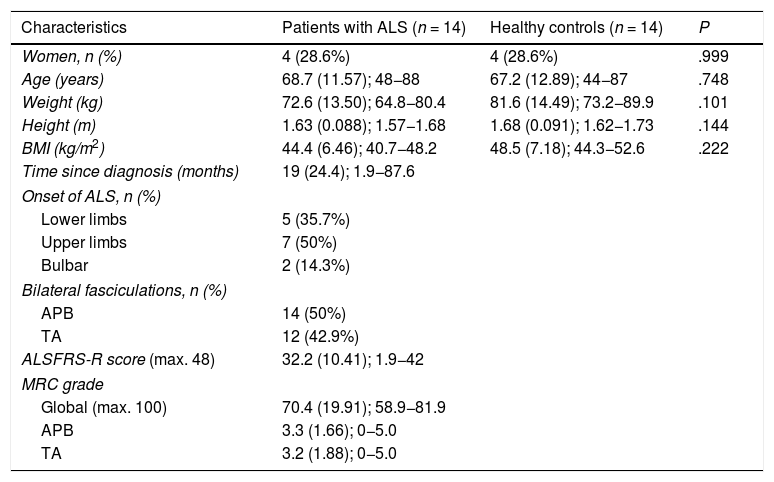
ResultsSample characteristicsThe study included 14 patients diagnosed with ALS (4 women; 29%) and 14 age- and sex-matched healthy controls, no significant differences were observed between groups in terms of weight, height, and BMI. Table 1 summarises the sociodemographic and clinical characteristics of our sample.
Sociodemographic and clinical characteristics of our sample.
| Characteristics | Patients with ALS (n = 14) | Healthy controls (n = 14) | P |
|---|---|---|---|
| Women, n (%) | 4 (28.6%) | 4 (28.6%) | .999 |
| Age (years) | 68.7 (11.57); 48−88 | 67.2 (12.89); 44−87 | .748 |
| Weight (kg) | 72.6 (13.50); 64.8−80.4 | 81.6 (14.49); 73.2−89.9 | .101 |
| Height (m) | 1.63 (0.088); 1.57−1.68 | 1.68 (0.091); 1.62−1.73 | .144 |
| BMI (kg/m2) | 44.4 (6.46); 40.7−48.2 | 48.5 (7.18); 44.3−52.6 | .222 |
| Time since diagnosis (months) | 19 (24.4); 1.9−87.6 | ||
| Onset of ALS, n (%) | |||
| Lower limbs | 5 (35.7%) | ||
| Upper limbs | 7 (50%) | ||
| Bulbar | 2 (14.3%) | ||
| Bilateral fasciculations, n (%) | |||
| APB | 14 (50%) | ||
| TA | 12 (42.9%) | ||
| ALSFRS-R score (max. 48) | 32.2 (10.41); 1.9−42 | ||
| MRC grade | |||
| Global (max. 100) | 70.4 (19.91); 58.9−81.9 | ||
| APB | 3.3 (1.66); 0−5.0 | ||
| TA | 3.2 (1.88); 0−5.0 | ||
ALS: amyotrophic lateral sclerosis; ALSFRS-R: revised Amyotrophic Lateral Sclerosis Functional Rating Scale; APB: abductor pollicis brevis; BMI: body mass index; MRC: Medical Research Council scale; TA: tibialis anterior.
Quantitative data are presented as means (standard deviation) and range, and qualitative data as numbers and percentages. P-values were calculated with the chi-square test (sex) and the t-test for independent samples.
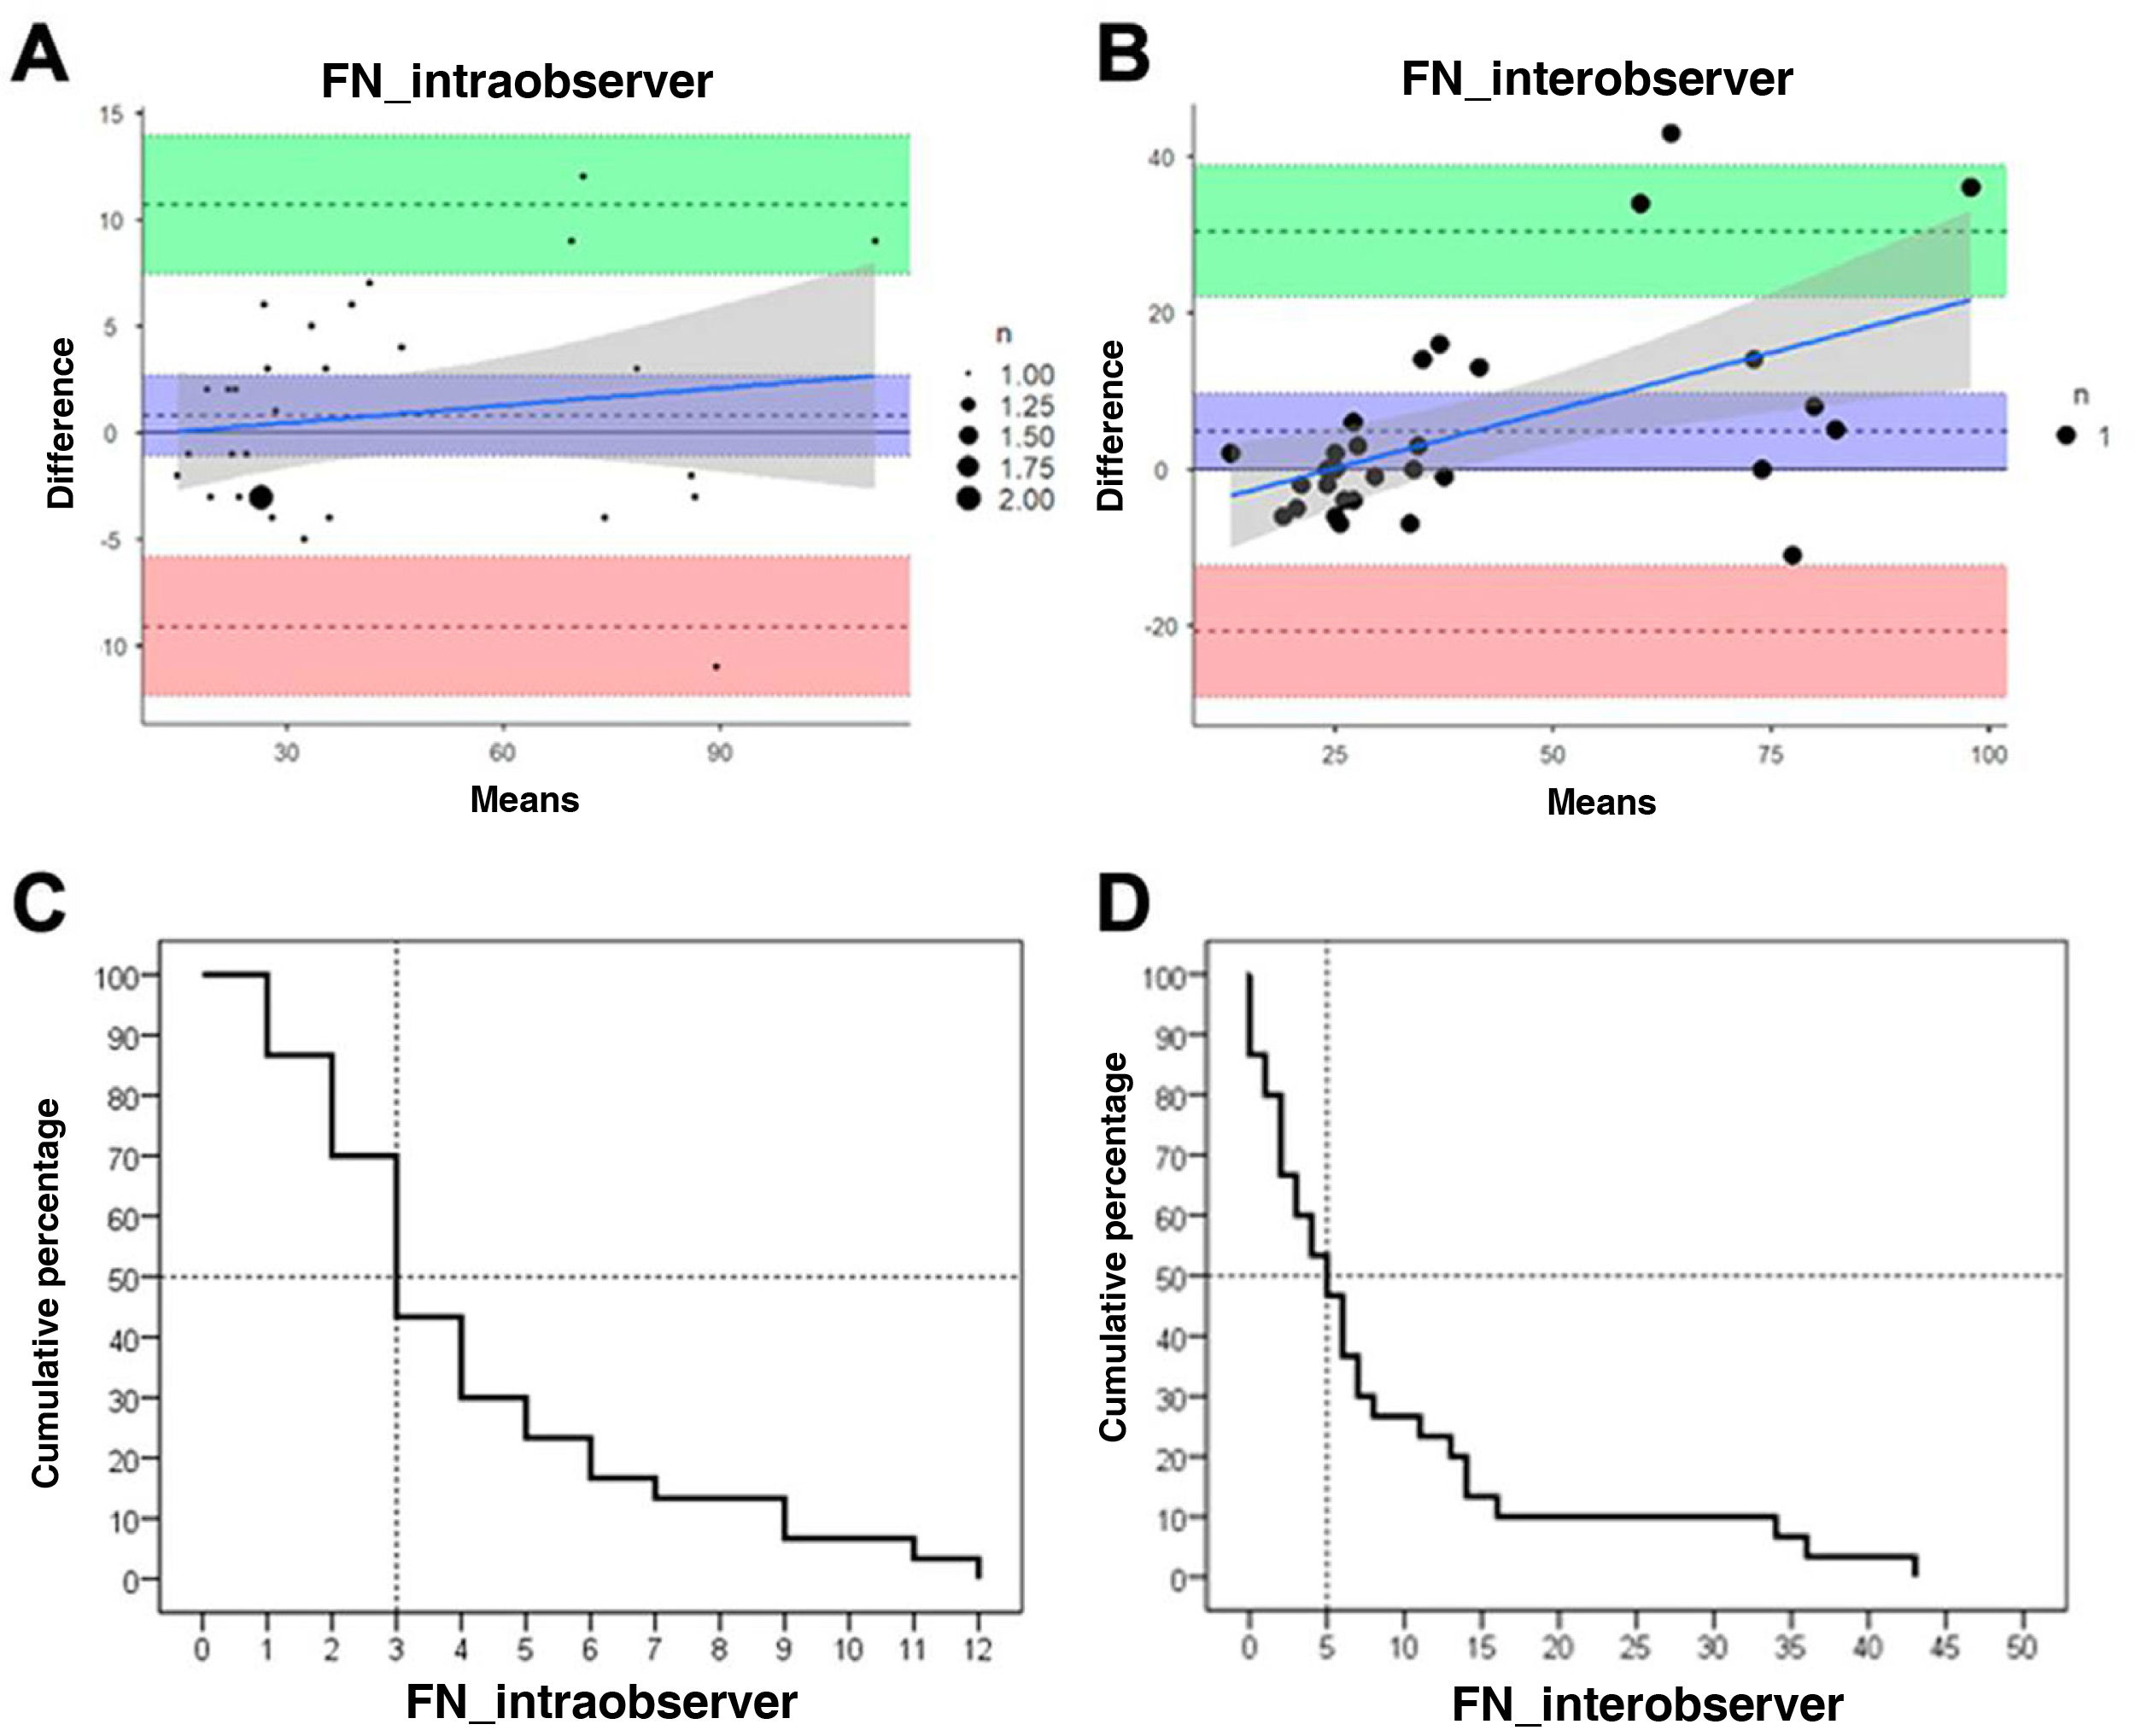
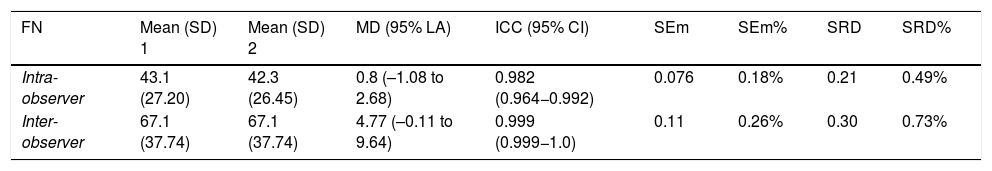
Fascicle number presented excellent intra- and interobserver reliability. No bias was found, and mean differences were very small. The SEm and SRD showed that FN is a reliable measure, detecting changes greater than 1%. The graphic approach proposed by Luiz et al.37 revealed that both intra- and interobserver discrepancies for FN were below 5 fascicles for 50% of images (Table 2; Fig. 3).
Intra- and interobserver reliability and reproducibility.
| FN | Mean (SD) 1 | Mean (SD) 2 | MD (95% LA) | ICC (95% CI) | SEm | SEm% | SRD | SRD% |
|---|---|---|---|---|---|---|---|---|
| Intra-observer | 43.1 (27.20) | 42.3 (26.45) | 0.8 (–1.08 to 2.68) | 0.982 (0.964−0.992) | 0.076 | 0.18% | 0.21 | 0.49% |
| Inter-observer | 67.1 (37.74) | 67.1 (37.74) | 4.77 (–0.11 to 9.64) | 0.999 (0.999−1.0) | 0.11 | 0.26% | 0.30 | 0.73% |
FN: fascicle number; ICC (95% CI): intraclass correlation coefficient (95% confidence interval); MD (95% LA): mean of the difference (95% limit of agreement); SD: standard deviation; SEm: standard error of measurement; SRD: smallest real difference.

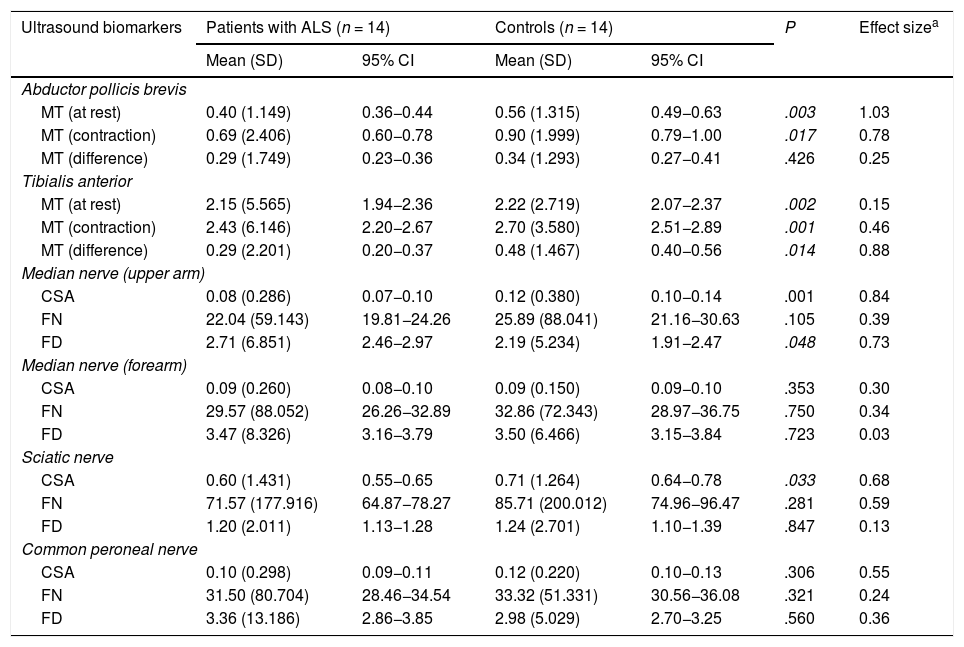
The results of the study of nerve and muscle ultrasound biomarkers are shown in Table 3.
Differences in ultrasound biomarkers between patients with ALS and healthy controls.
| Ultrasound biomarkers | Patients with ALS (n = 14) | Controls (n = 14) | P | Effect sizea | ||
|---|---|---|---|---|---|---|
| Mean (SD) | 95% CI | Mean (SD) | 95% CI | |||
| Abductor pollicis brevis | ||||||
| MT (at rest) | 0.40 (1.149) | 0.36−0.44 | 0.56 (1.315) | 0.49−0.63 | .003 | 1.03 |
| MT (contraction) | 0.69 (2.406) | 0.60−0.78 | 0.90 (1.999) | 0.79−1.00 | .017 | 0.78 |
| MT (difference) | 0.29 (1.749) | 0.23−0.36 | 0.34 (1.293) | 0.27−0.41 | .426 | 0.25 |
| Tibialis anterior | ||||||
| MT (at rest) | 2.15 (5.565) | 1.94−2.36 | 2.22 (2.719) | 2.07−2.37 | .002 | 0.15 |
| MT (contraction) | 2.43 (6.146) | 2.20−2.67 | 2.70 (3.580) | 2.51−2.89 | .001 | 0.46 |
| MT (difference) | 0.29 (2.201) | 0.20−0.37 | 0.48 (1.467) | 0.40−0.56 | .014 | 0.88 |
| Median nerve (upper arm) | ||||||
| CSA | 0.08 (0.286) | 0.07−0.10 | 0.12 (0.380) | 0.10−0.14 | .001 | 0.84 |
| FN | 22.04 (59.143) | 19.81−24.26 | 25.89 (88.041) | 21.16−30.63 | .105 | 0.39 |
| FD | 2.71 (6.851) | 2.46−2.97 | 2.19 (5.234) | 1.91−2.47 | .048 | 0.73 |
| Median nerve (forearm) | ||||||
| CSA | 0.09 (0.260) | 0.08−0.10 | 0.09 (0.150) | 0.09−0.10 | .353 | 0.30 |
| FN | 29.57 (88.052) | 26.26−32.89 | 32.86 (72.343) | 28.97−36.75 | .750 | 0.34 |
| FD | 3.47 (8.326) | 3.16−3.79 | 3.50 (6.466) | 3.15−3.84 | .723 | 0.03 |
| Sciatic nerve | ||||||
| CSA | 0.60 (1.431) | 0.55−0.65 | 0.71 (1.264) | 0.64−0.78 | .033 | 0.68 |
| FN | 71.57 (177.916) | 64.87−78.27 | 85.71 (200.012) | 74.96−96.47 | .281 | 0.59 |
| FD | 1.20 (2.011) | 1.13−1.28 | 1.24 (2.701) | 1.10−1.39 | .847 | 0.13 |
| Common peroneal nerve | ||||||
| CSA | 0.10 (0.298) | 0.09−0.11 | 0.12 (0.220) | 0.10−0.13 | .306 | 0.55 |
| FN | 31.50 (80.704) | 28.46−34.54 | 33.32 (51.331) | 30.56−36.08 | .321 | 0.24 |
| FD | 3.36 (13.186) | 2.86−3.85 | 2.98 (5.029) | 2.70−3.25 | .560 | 0.36 |
95% CI: 95% confidence interval; ALS: amyotrophic lateral sclerosis; CSA: cross-sectional area (cm2); FD: fascicle density; FN: fascicle number; MT: muscle thickness; SD: standard deviation.
Regarding findings from muscles, MT in the APB and TA was significantly lower in patients than in controls, both at rest and in contraction. The difference between resting and contracted MT in both muscles was also smaller in patients than in controls, although it was statistically significant only for the APB.
Regarding the MN, significant differences were only observed in the upper arm, with patients presenting a smaller CSA and greater FD than controls. FN was lower in patients than in controls, although the difference was not statistically significant.
Lastly, regarding the peripheral nerves of the lower limbs, the only significant finding was smaller CSA of the SN in patients than in controls.
Similarly as in the upper limbs, patients with ALS presented a smaller FN than controls, with more marked difference in the SN.
Relationship between ultrasound biomarkers and the clinical parameters MRC grade and ALSFRS-R scoreIn the upper limbs, only MT of the APB at rest showed a significant positive correlation with both total MRC grade (r = 0.34; R2 = 11.6%; P = .011) and ALSFRS-R score (r = 0.44; R2 = 19.4%; P ≤ .001).
In the lower limbs, the difference between resting and contracted MT showed a significant positive correlation with both MRC grade (r = 0.30; R2 = 15.2%; P = .003) and ALSFRS-R score (r = 0.26; R2 = 6.8%; P = .049). FN in the SN showed a significant positive correlation with MRC grade (r = 0.35; R2 = 12.3%; P = .008).
DiscussionOur results show that FN in peripheral nerves is as reliable and reproducible an ultrasound biomarker of ALS as other biomarkers studied previously, including nerve diameter, CSA, and FN, or muscle thickness, echointensity, and echovariation.7,9,12,13,41
Our data confirm the discriminant ability of some variables linked to MT, both at rest and in contraction; these may be useful in monitoring disease progression.26 We also observed markedly lower FN in the nerves affected by ALS, especially in proximal segments; this has previously been described by other authors, although exclusively relating to morphological variables.14,15,42
Reliability and reproducibility of ultrasound biomarkersWith the development of high-resolution ultrasound devices, research efforts in the last 15 years have begun to focus on neuromuscular ultrasound biomarkers of ALS. Different research groups have shown the reliability and reproducibility of these tools.7,13,41–43 However, very little research has been conducted into peripheral nerve FN, and the available studies do not evaluate the reliability of this biomarker. In our study, FN showed very good intra- and interobserver agreement.
Ultrasound biomarkers in patients with ALS and healthy individualsAs other authors have stated, our results show that MT at rest discriminates between healthy individuals and patients with ALS, especially in advanced stages, when muscle atrophy and weakness are more marked.9,44 However, this measure is of limited value for monitoring disease progression, particularly at intermediate and advanced stages of ALS, which are characterised by marked atrophy.8,44
In the light of the above, and in line with studies focusing on the assessment of diaphragmatic contraction,45,46 researchers are beginning to focus on the dynamic assessment of peripheral muscles to monitor ALS progression.26 Our study demonstrates the discriminant capacity of such dynamic biomarkers as MT in contraction and the difference between resting and contracted MT. However, further research is needed to evaluate the potential of these biomarkers for monitoring disease progression.
Regarding the examination of peripheral nerves, and despite the growing interest in peripheral nerve morphology in ALS,15,47 no study to date, to our knowledge, has evaluated FN and FD in these patients. Cartwright et al.17 and Ridolfi et al.18 studied FN exclusively in the median nerve at the wrist in healthy individuals, using an ultra-high-frequency ultrasound device, which is not easily accessible in clinical practice. Our results show a clear trend towards lower FN in the nerves affected by ALS, probably as a result of motor neuron loss, and a significant increase in FD in the MN at the level of the upper arm, as a consequence of the significant decrease in CSA. FD is the quotient of FN by CSA; therefore, if CSA decreases, FD will increase. The same pattern was observed in the rest of the nerves evaluated. Studies with greater statistical power and also evaluating the nerve roots should be conducted to determine the true value of these new nerve biomarkers with respect to the muscle biomarkers currently used.
Relationship between ultrasound biomarkers and the clinical parameters MRC grade and ALSFRS-R scoreThe positive correlation of MT with both muscle strength and level of disability has previously been noted by other authors.7 Our study found a positive correlation between these clinical variables and resting MT of the APB and the difference between resting and contracted MT; the latter parameter may be an interesting line of research for future studies.
Despite the small size of our sample, and unlike the observations made by other authors,48 we found a significant positive correlation between FN and muscle strength, which was particularly marked in the SN with respect to the TA.
Limitations and clinical relevance of the studyThe biomarkers FN and FD in peripheral nerves, like other dynamic variables linked to MT, constitute a promising line of research in the field of ultrasound biomarkers for ALS. However, future studies should include larger samples of patients at different stages of ALS progression to confirm the patterns observed in our study.
The small size of our sample is the greatest limitation of this pilot study: despite the interest of our findings, we were unable to conduct more robust analyses that may have shed some light on the capacity of the biomarkers studied. In any case, this is the first study to evaluate the internal structure, and not only the morphology, of peripheral nerves in patients with ALS, providing evidence of the reliability, reproducibility, and potential of several ultrasound biomarkers for future studies.
Conflicts of interestThe authors have no conflicts of interest to declare.
