


Hypertension is the most prevalent risk factor globally. Calculation of cardiovascular risk in hypertensive patients before initiation of treatment is recommended. This study aimed to assess the predictive value and clinical utility of the SCORE scale in preventing cardiovascular events and all-cause mortality in patients with hypertension.
MethodsPatients with hypertension from the ESCARVAL-RISK cohort were included. Cardiovascular risk was calculated using the SCORE scale. All deaths and cardiovascular events were recorded during a 5-year follow-up period. Sensitivity, specificity and predictive values were calculated for different cut-off points and the effect of different risk factors on the diagnostic accuracy of SCORE charts were assessed.
ResultsIn a final cohort of 9,834 patients, there were 555 cardiovascular events and 69 deaths. The recommended risk value for initiating drug treatment (5%) had a specificity of 92% for death and 91% for cardiovascular events, and a sensitivity of 20% for death and 22% for cardiovascular events. In addition, the scale classified 80.4% of patients who experienced a cardiovascular event and 78.3% of those who died as low risk. Age, body mass index, retinopathy and anticoagulant therapy were associated with reduced predictive ability of the SCORE scale, while being female was associated with better risk prediction.
ConclusionsThe predictive ability of the SCORE scale for cardiovascular disease and total mortality in patients with hypertension is limited.
La hipertensión arterial es el factor de riesgo más prevalente a nivel global. Se recomienda el cálculo del riesgo cardiovascular en pacientes hipertensos antes del inicio de tratamiento. Este estudio tuvo como objetivo evaluar el valor predictivo y la utilidad clínica de la escala SCORE para prevenir eventos cardiovasculares y mortalidad por todas las causas en pacientes con hipertensión arterial.
MétodosSe incluyeron pacientes con hipertensión arterial de la cohorte ESCARVAL-RISK. El riesgo cardiovascular se calculó mediante la escala SCORE. Todas las muertes y eventos cardiovasculares se registraron durante un periodo de cinco años de seguimiento. Se calculó la sensibilidad, la especificidad y valores predictivos para diferentes puntos de corte y se evaluó el efecto de diferentes factores de riesgo sobre la exactitud diagnóstica de las gráficas SCORE.
ResultadosEn una cohorte final de 9.834 pacientes, hubo 555 eventos cardiovasculares y 69 muertes. El valor de riesgo recomendado para iniciar tratamiento farmacológico (5%) presentó una especificidad del 92% para la muerte y del 91% para los eventos cardiovasculares, y una sensibilidad del 20% para la muerte y del 22% para los eventos cardiovasculares. Además, la escala clasificó al 80,4% de los pacientes que sufrieron un evento cardiovascular, y al 78,3% de los que murieron, como de bajo riesgo. La edad, el índice de masa corporal, la retinopatía y el tratamiento anticoagulante se asociaron con una reducción en la capacidad predictiva de la escala SCORE, mientras que ser mujer se asoció con mejor predicción de riesgo.
ConclusionesLa capacidad predictiva de la escala SCORE para la enfermedad cardiovascular y la mortalidad total en pacientes con hipertensión arterial es limitada.
Cardiovascular disease (CVD) is the leading cause of death in Spain,1 and primary prevention is the most cost-effective and efficient prevention strategy. Globally, hypertension is the leading cause of premature death,2 so patients with hypertension represent the perfect target for cardiovascular prevention. Cardiovascular prevention should be a global strategy, going beyond the mere control of isolated risk factors in order to seek a comprehensive approach that includes such important aspects as diet, physical exercise and the control of other risk factors such as diabetes mellitus, hypercholesterolemia, obesity and smoking.3
The relationship between blood pressure and the development of CVD is continuous and linear at levels above 115/75mmHg. In Spain, the prevalence of hypertension in the adult population ranges between 33 and 43% and increases with age to such an extent that in those over 65 years of age it exceeds 60%.4 Both awareness (around 60%) and overall control (around 25%) are low. High blood pressure is often associated with other risk factors.5 The clustering of risk factors has a multiplier effect on cardiovascular risk. Guidelines recommend assessing overall cardiovascular risk using risk assessment systems such as the Systematic Coronary Risk Evaluation (SCORE).3 For risk scores to be useful they must be accurate, well calibrated and the variables needed for their calculation must be accessible in daily clinical practice.
One of the most difficult elements of a score, but also one of the most important, is its external validation. Despite being one of the most important aspects in risk score validity, previous studies have not always demonstrated adequate external validity.6
Therefore, the aim of the present study is to assess the predictive value and clinical utility of the SCORE risk scale for preventing ischaemic heart disease, cerebrovascular disease, cardiovascular mortality and all-cause mortality in patients with hypertension.
MethodsThis observational cohort study included patients from the ESCARVAL-RISK cohort study,7,8 a prospective cohort study in people with cardiovascular risk factors (hypertension, hypercholesterolemia or diabetes mellitus) but without established CVD. The aim of this study is to investigate the association between major CVD risk factors and the incidence of CVD in a cohort of patients in real clinical practice.
The study was conducted in accordance with international recommendations on clinical research involving patients (World Medical Association Declaration of Helsinki, amended October 2013). The Ethics and Clinical Trials Committee of the Public Health Research Centre approved the ESCARVAL-RISK study. All patient data were collected from the electronic medical record in the health information system; data were anonymised and handled in accordance with current data protection legislation. In addition, all investigators with access to the study data signed a document guaranteeing the confidentiality of patient information. Informed consent from the patients was not required.
Study populationThe patients included were recruited in the primary care centres managed by the public health system of the Valencian Community. Each national health system user has a unique patient identifier through which their electronic medical records can be accessed. The ESCARVAL-RISK registry included 73,302 individuals of both sexes who met the study inclusion criteria: aged 30 years or older; without known CVD; who sought routine health care at their local health centre; and who had at least one of the following CVD risk factors: hypertension, diabetes mellitus or hypercholesterolemia. Hypertension was defined as a blood pressure equal to or higher than 140/90mmHg or more measured at the clinic, a recorded diagnosis of hypertension (International Classification of Diseases [ICD] ninth edition code I10) or the use of antihypertensive drugs. The subgroup of patients with hypertension was included in the present study. We excluded patients with missing values for any of the variables required for the calculation of cardiovascular risk using the SCORE scale for low-risk countries; patients with severe comorbidities that limit life expectancy to less than five years; other diseases that could, in the opinion of the investigators, distort the study results; patients participating in a clinical trial; or any other mental or social factors that the research team believed might interfere with follow-up.
An additional adjustment was made for diabetic patients, as proposed by the authors of the original SCORE publication. The risk obtained on the scale was multiplied by four for females and by two for males with diabetes.
Study variablesThe health information system of the Valencian Community has an electronic medical record in which the main epidemiological variables, anthropometric and clinical examination data, CVD risk factors, comorbidities, electrocardiogram data, blood and urine tests, and prescribed pharmacological treatments are recorded. For our study, we extracted the following variables: sex, age, body mass index (BMI), medical and surgical history, drug treatments, smoking, systolic and diastolic blood pressure (mmHg) and total cholesterol (mg/dl). We then calculated the risk of experiencing a cardiovascular event using the SCORE scale for low-risk countries, following the methodology proposed by the European Society of Cardiology.9
Follow-upThe follow-up covered the period from January 2008 to December 2012. Participants were followed by annual hospital record reviews until first admission for acute coronary syndrome or stroke, or death from any cause. An independent assessment was performed to predict all-cause mortality and the composite of cardiovascular events. Mortality data were obtained by linking the ESCARVAL database to the Death Registry of the Valencian Community, and the reason for hospitalisation was determined based on the assigned ICD codes (9th revision: ICD-9 410-414 for ischaemic heart disease or ICD-9 430-438 for stroke and ICD-9 428 for heart failure). Cardiovascular event was considered when the patient presented with ischaemic heart disease, stroke, heart failure or cardiovascular mortality.
Statistical analysisDescriptive statistics were calculated for CVD risk as a percentage, according to the SCORE scale. Receiver operating characteristic (ROC) curves were plotted with SCORE risk versus observed incidence of cardiovascular events or all-cause mortality. Sensitivity, specificity, Youden index and predictive values were also calculated for different cut-off points. The maximum value of the Youden index was used to identify the cut-off point with the best sensitivity and specificity.
Risk calculation was quantitative (risk of cardiovascular mortality at 10 years) and qualitative, depending on whether the risk was less than 5%.8 Sensitivity, specificity, predictive values and overall diagnostic effectiveness were assessed for each scale (percentage of correct classifications for each observed event). Finally, we identified patients who were accurately classified by the scale (i.e. classified as low risk and did not experience an event, or as high risk who did experience an event), as well as those who were inaccurately classified. Multivariable logistic regression models were fitted to calculate the odds ratio (OR) and 95% confidence intervals (CI) for a patient misclassified with the SCORE scale, according to factors associated with the predictive ability of the scale. These models did not include the variables used to construct the SCORE scale, such as age, sex, systolic blood pressure, total cholesterol or smoking.
The explanatory variables in the model were BMI; treatment with insulin, oral antidiabetics, lipid-lowering or antihypertensive agents, anticoagulant drugs; and comorbidities such as diabetes mellitus, hypercholesterolemia, proteinuria, atrial fibrillation, renal disease, retinopathy and metabolic syndrome. Analyses were performed using SPSS® statistical software v.18 and R v.3.5.0.
ResultsThe total sample of the ESCARVAL-RISK registry included 73,302 patients; of those, 9,834 hypertensive patients without CVD or missing values for SCORE calculation were selected to participate in the present study.
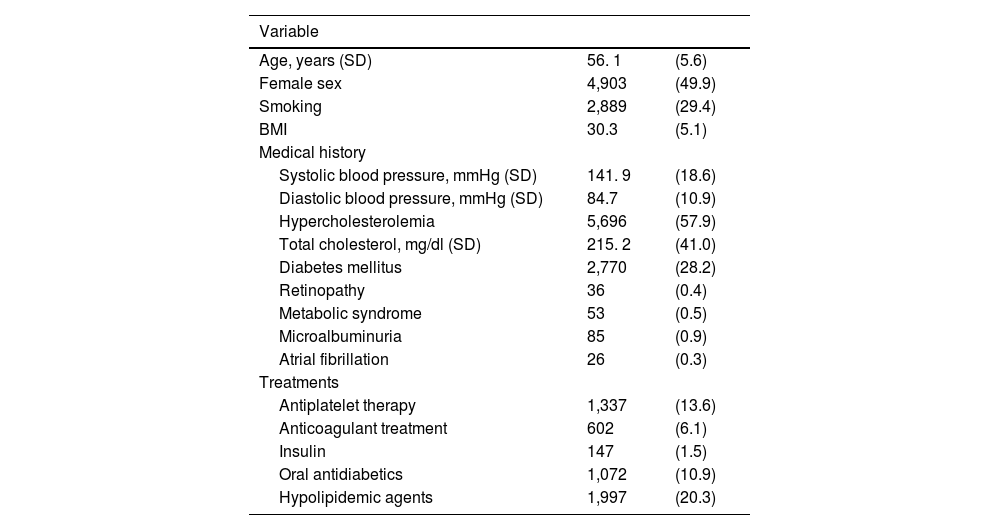
Table 1 shows the baseline characteristics of the study population. The mean age of the sample was 56.1 years (standard deviation [SD]: 5.6), 49.9% of the included patients were female, 28.2% had a history of diabetes mellitus and 57.9% hypercholesterolaemia. Mean total cholesterol was 215.2mg/dl (SD: 41.0), mean systolic blood pressure was 141.9 (SD: 18.6) and diastolic blood pressure was 84.7 (SD: 10.9) mmHg.
Baseline characteristics of the study population (N=9,834).
| Variable | ||
|---|---|---|
| Age, years (SD) | 56. 1 | (5.6) |
| Female sex | 4,903 | (49.9) |
| Smoking | 2,889 | (29.4) |
| BMI | 30.3 | (5.1) |
| Medical history | ||
| Systolic blood pressure, mmHg (SD) | 141. 9 | (18.6) |
| Diastolic blood pressure, mmHg (SD) | 84.7 | (10.9) |
| Hypercholesterolemia | 5,696 | (57.9) |
| Total cholesterol, mg/dl (SD) | 215. 2 | (41.0) |
| Diabetes mellitus | 2,770 | (28.2) |
| Retinopathy | 36 | (0.4) |
| Metabolic syndrome | 53 | (0.5) |
| Microalbuminuria | 85 | (0.9) |
| Atrial fibrillation | 26 | (0.3) |
| Treatments | ||
| Antiplatelet therapy | 1,337 | (13.6) |
| Anticoagulant treatment | 602 | (6.1) |
| Insulin | 147 | (1.5) |
| Oral antidiabetics | 1,072 | (10.9) |
| Hypolipidemic agents | 1,997 | (20.3) |
SD: standard deviation; BMI: body mass index.
The risk of a cardiovascular event was calculated using SCORE for all included patients.
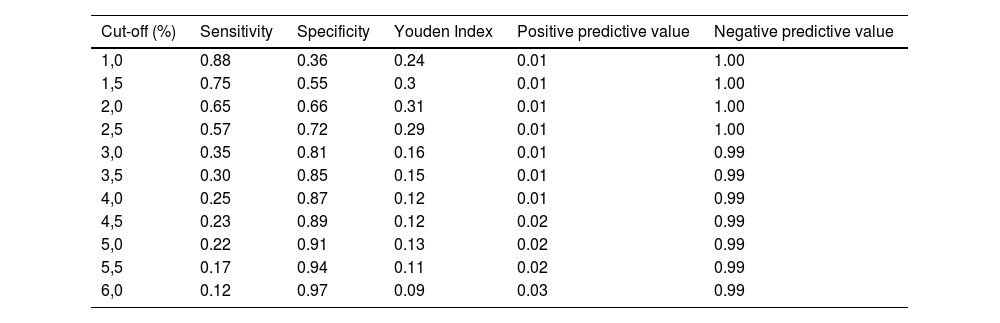
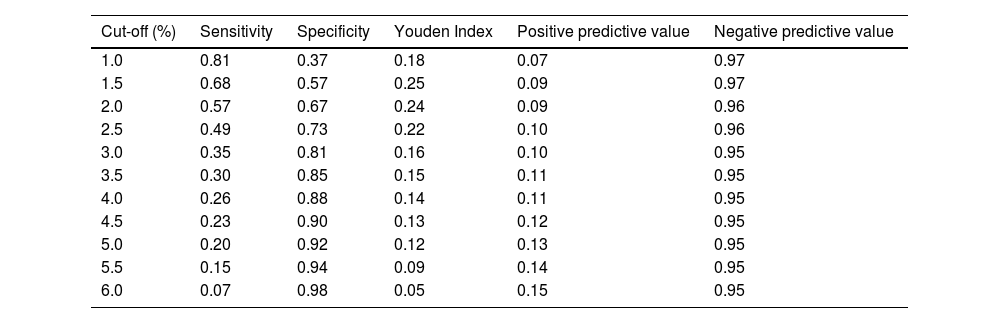
After 5 years of follow-up, a total of 555 cardiovascular events and 69 deaths were recorded. Tables 2 and 3 show the sensitivity and specificity of the SCORE scale for predicting cardiovascular events or mortality. The maximum sensitivity and specificity points were 2.0% for prediction of a cardiovascular event (sensitivity 65%, specificity 66%) and 2.0% for prediction of all-cause mortality (sensitivity 57%, specificity 67%). The cut-off point used in clinical practice of 5% has a high specificity (91% for cardiovascular events and 92% for all-cause mortality) but low sensitivity (22% for cardiovascular events and 20% for all-cause mortality).
Sensitivity, specificity and positive and negative predictive values for the prediction of cardiovascular events at each SCORE cut-off point.
| Cut-off (%) | Sensitivity | Specificity | Youden Index | Positive predictive value | Negative predictive value |
|---|---|---|---|---|---|
| 1,0 | 0.88 | 0.36 | 0.24 | 0.01 | 1.00 |
| 1,5 | 0.75 | 0.55 | 0.3 | 0.01 | 1.00 |
| 2,0 | 0.65 | 0.66 | 0.31 | 0.01 | 1.00 |
| 2,5 | 0.57 | 0.72 | 0.29 | 0.01 | 1.00 |
| 3,0 | 0.35 | 0.81 | 0.16 | 0.01 | 0.99 |
| 3,5 | 0.30 | 0.85 | 0.15 | 0.01 | 0.99 |
| 4,0 | 0.25 | 0.87 | 0.12 | 0.01 | 0.99 |
| 4,5 | 0.23 | 0.89 | 0.12 | 0.02 | 0.99 |
| 5,0 | 0.22 | 0.91 | 0.13 | 0.02 | 0.99 |
| 5,5 | 0.17 | 0.94 | 0.11 | 0.02 | 0.99 |
| 6,0 | 0.12 | 0.97 | 0.09 | 0.03 | 0.99 |
Sensitivity, specificity and positive and negative predictive values for the prediction of all-cause mortality at each SCORE cut-off point.
| Cut-off (%) | Sensitivity | Specificity | Youden Index | Positive predictive value | Negative predictive value |
|---|---|---|---|---|---|
| 1.0 | 0.81 | 0.37 | 0.18 | 0.07 | 0.97 |
| 1.5 | 0.68 | 0.57 | 0.25 | 0.09 | 0.97 |
| 2.0 | 0.57 | 0.67 | 0.24 | 0.09 | 0.96 |
| 2.5 | 0.49 | 0.73 | 0.22 | 0.10 | 0.96 |
| 3.0 | 0.35 | 0.81 | 0.16 | 0.10 | 0.95 |
| 3.5 | 0.30 | 0.85 | 0.15 | 0.11 | 0.95 |
| 4.0 | 0.26 | 0.88 | 0.14 | 0.11 | 0.95 |
| 4.5 | 0.23 | 0.90 | 0.13 | 0.12 | 0.95 |
| 5.0 | 0.20 | 0.92 | 0.12 | 0.13 | 0.95 |
| 5.5 | 0.15 | 0.94 | 0.09 | 0.14 | 0.95 |
| 6.0 | 0.07 | 0.98 | 0.05 | 0.15 | 0.95 |
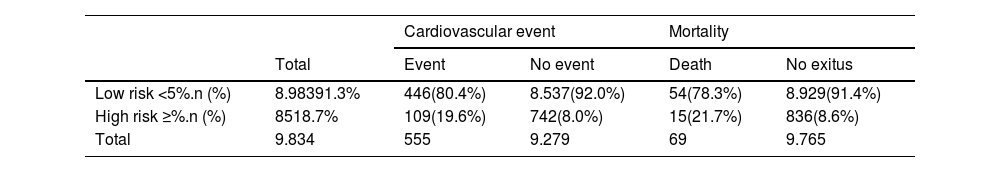
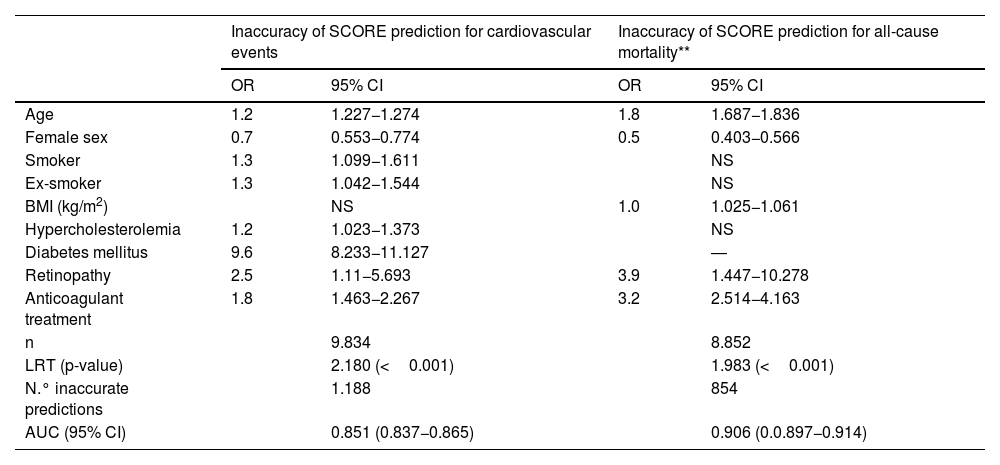
The distribution of patients with events in the overall sample according to the risk attributed by the SCORE charts is shown in Table 4. Of those who suffered a cardiovascular event or death, 80.4% and 78.3%, respectively, had been classified as low risk. Table 5 shows the results of multivariable logistic regression, reporting OR and 95% CI for SCORE misclassification based on cardiovascular events and death. Variables that reduced the predictive power of the SCORE scale were age, body mass index, retinopathy and anticoagulant treatment, while being female was associated with better prediction of SCORE events.
SCORE risk classification for cardiovascular mortality: (expected) 5% cut-off versus (observed) incidence of cardiovascular events and mortality.
| Cardiovascular event | Mortality | ||||
|---|---|---|---|---|---|
| Total | Event | No event | Death | No exitus | |
| Low risk <5%.n (%) | 8.98391.3% | 446(80.4%) | 8.537(92.0%) | 54(78.3%) | 8.929(91.4%) |
| High risk ≥%.n (%) | 8518.7% | 109(19.6%) | 742(8.0%) | 15(21.7%) | 836(8.6%) |
| Total | 9.834 | 555 | 9.279 | 69 | 9.765 |
Variables related to inaccurate prediction of cardiovascular event and mortality using SCORE.
| Inaccuracy of SCORE prediction for cardiovascular events | Inaccuracy of SCORE prediction for all-cause mortality** | |||
|---|---|---|---|---|
| OR | 95% CI | OR | 95% CI | |
| Age | 1.2 | 1.227−1.274 | 1.8 | 1.687−1.836 |
| Female sex | 0.7 | 0.553−0.774 | 0.5 | 0.403−0.566 |
| Smoker | 1.3 | 1.099−1.611 | NS | |
| Ex-smoker | 1.3 | 1.042−1.544 | NS | |
| BMI (kg/m2) | NS | 1.0 | 1.025−1.061 | |
| Hypercholesterolemia | 1.2 | 1.023−1.373 | NS | |
| Diabetes mellitus | 9.6 | 8.233−11.127 | ― | |
| Retinopathy | 2.5 | 1.11−5.693 | 3.9 | 1.447−10.278 |
| Anticoagulant treatment | 1.8 | 1.463−2.267 | 3.2 | 2.514−4.163 |
| n | 9.834 | 8.852 | ||
| LRT (p-value) | 2.180 (<0.001) | 1.983 (<0.001) | ||
| N.° inaccurate predictions | 1.188 | 854 | ||
| AUC (95% CI) | 0.851 (0.837−0.865) | 0.906 (0.0.897−0.914) | ||
AUC: area under the receiver operating characteristic curve; BMI: body mass index; LRT: log ratio test; NS: non-significant; OR: odds ratio.
The present study shows that the SCORE cardiovascular risk chart does not predict the occurrence of cardiovascular events reliably in a non-selected Mediterranean population with hypertension.
Cardiovascular risk scores are useful tools in clinical practice, but a prerequisite for their widespread use is to confirm their validity. In the case of the SCORE scale, it has been extensively evaluated and most studies have shown good discriminatory power, with an area under the curve ranging from 0.70 to 0.80.10–12 In Spain, Baena-Diez et al.13 found that even with acceptable discriminatory power, the SCORE scale significantly overestimated observed cardiovascular mortality. In fact, the Spanish population shows different preventive behaviours compared to northern European countries and even to patients closer to southern Europe.14–16
The SCORE scale was designed to estimate mortality risk in a non-CVD population. Therefore, some important data are not considered in the SCORE scale. Multivariate analysis for inadequate prediction of death or cardiovascular event shows that variables such as diabetes mellitus, hypercholesterolaemia, renal disease, peripheral arterial disease or metabolic syndrome increase the likelihood of the scale not predicting morbidity and mortality correctly.
It should also be considered that the risk scores are designed to predict events at 10 years and not at 5 years as presented in this study. Nevertheless, we need more demanding short-term predictions that allow us to improve activity, intensify interventions, avoid therapeutic inertia and improve adherence and compliance to treatments.
In light of our results, cardiovascular risk estimation could be improved by adding relevant variables to the SCORE risk charts. In the past, a good cardiovascular risk score had to include only a selection of clinical or laboratory variables for the index to be applicable in any setting. However, with the advent of common electronic medical records and big data, cardiovascular risk estimation needs to be optimised by including the maximum amount of information at our disposal. Therefore, more studies on cardiovascular risk assessment and its validation are needed, along with good coding of diagnoses in electronic medical records.
An update of the SCORE risk scale was recently published, called SCORE217 and SCORE2-OP.18 It addresses the limitations of the previous version: such as risk assessment including morbidity, risk estimation in the elderly population (with the SCORE2-OP scale) and improves the accuracy of risk for some risk factors. This is the case for hypercholesterolaemia, taking into account the non-HDL cholesterol parameter instead of total cholesterol. However, there is no difference in the data measured for hypertension and, therefore, risk estimation focusing on this parameter does not seem to particularly change the SCORE assessment. When SCORE2 was used instead of SCORE, 43.91% of the Eastern European population was classified with a higher risk level, representing a dramatic increase in the number of patients with high or very high cardiovascular risk18; these data suggest that this new risk scale might change the estimates described in our SCORE-supported study.
Furthermore, SCORE2 still has limitations as it does not take into account risk factors that are difficult to measure, such as diet, physical activity, socioeconomic status or family history. It also does not take into account other data that could be better estimated, such as chronic kidney disease. For the latter assumption, a determinant factor in the underestimation of risk in some patients that we also observed in our study, complementary data in SCORE2 with parameters such as glomerular filtration rate and creatinine clearance have been proposed, which improves CVD risk prediction beyond SCORE2 and SCORE2-OP.19 Matsushita et al. propose complementary data in SCORE2 with parameters such as glomerular filtration rate and creatinine clearance, which, according to their study, measures CVD risk prediction better than SCORE2 and SCORE2-OP.20 Our results support the inclusion of variables assessing renal function in cardiovascular risk prediction.
Proposals are needed to improve multidisciplinary intervention in hypertension and other risk factors focused on our health centres. There is evidence of reduced morbidity and mortality to support these changes in improving parameters to confirm risk and optimise therapy or blood pressure control in settings other than our own.21
The information provided by ESCARVAL7 and other studies will be essential for primary care health professionals in Spain and other countries with low cardiovascular risk.
We must recognise the limitations of the present study. It is a registry obtained with data from real clinical practice; without external monitoring to control the validity of data entry in the electronic medical record. To minimise possible error, the physicians who collaborated in the study took courses in cardiovascular skills and in the use of the electronic medical record.22
To avoid potential registration bias, the primary endpoints dependent on cardiovascular event or death from any cause were obtained from the minimum basic data set on hospital discharge, the electronic medical record and the national mortality registry. Although laboratory data are not centralised, the study laboratories belong to the public health system of the Valencian Community and have passed their corresponding audits.
The main strength of the study lies in its high power, due to the large sample size, and it has been conducted in routine clinical practice, ensuring external validity; in this way, randomised error is minimised by inferring the results in the population that usually attends health centres. In addition, the source of information is drawn from a single electronic registry that integrates all patient health information.
ConclusionSCORE risk charts have limited predictive ability for CVD and all-cause mortality in primary care patients with hypertension. Different tools are needed to guide a comprehensive and holistic approach to primary prevention of CVD in hypertensive patients.
Ethical considerationsStudy approved by the Ethics and Clinical Trials Committee of the Public Health Research Centre. Investigators with access to the study data signed a confidentiality of information document. Informed consent from patients was not required.
FundingThe authors declare that they have not received any funding for this study.
Conflict of interestThe authors declare that they have no conflicts of interest related to this article.
