


Automated Driving Systems (ADS) may reshape mobility. Yet, related fear and anxiety are largely unknown. We estimated the prevalence and risk factors of anticipated anxiety towards ADS.
MethodIn a nationally representative face-to-face household survey, we assessed anticipated levels of anxiety towards ADS based on DSM-5 specific phobia criteria, using structured diagnostic interviews. We estimated weighted prevalences and conducted adjusted logistic regression models.
ResultsOf N = 2076 respondents, 40.82% (95%-confidence interval (CI) 37.73–43.98) anticipated experiencing some symptoms of phobia of ADS, 15.22% (CI 13.19–17.51) anticipated subthreshold phobia, and 3.39% (CI 2.42–4.75) anticipated full-blown phobia of ADS. Of subjects anticipating subthreshold phobia, 74.02% showed no strong, enduring fears of driving non-automated cars and 65.07% presented no other specific phobias (full-blown anticipated phobia: 50.37% and 50.03%, respectively). Anticipated phobia highly overlapped with anticipating marked or strong fears of passively encountering ADS in traffic (odds ratio 312.4–1982.2).
ConclusionAbout 20% of subjects anticipated at least subthreshold and 4% of subjects anticipated full-blown phobia of ADS. It appears to be distinct from fears related to non-automated driving and other specific phobias. Our findings call for prevention and treatment of phobia of ADS as they become increasingly ubiquitous.
The development of automated driving will substantially impact modern society's mobility during the next decades (Bansal & Kockelman, 2017; Meyer et al. 2017; Pettigrew, 2017). However, it is largely based on the assumption that the use of automated cars is without relevant mental barriers for the vast majority of potential passengers (Maurer et al., 2016). Yet, there is hitherto no data to substantiate this assumption. A number of studies explore the relevant mental functions for using automated vehicles, including, amongst others trust, risk perception, locus of control, mentalization, prediction, decision making, sensory and visceral perceptions, and related attributions (Othersen, 2016; Shariff et al., 2017). Disturbances of these functions are of relevance for a range of psychopathological processes and there are some indications that they may also trigger substantial impairment related to the use of automated vehicles in a non-negligible part of the population (Clark et al., 2017). Moreover, some studies suggest a high prevalence of fears and anxiety related to automated driving (American Psychiatric Association, 2013). To elucidate the potential nature and scope of the phenomenon, estimates of the prevalence and risk factors of anticipated fears and anxiety related to automated driving are urgently needed.
The objective of the present study was to estimate, in a national representative sample, based on face-to-face interviews the prevalence and risk factors of anticipated fear and anxiety towards in-vehicle (i.e., using while in the car) automated driving and related anticipated fulfillment of DSM-5 specific phobia diagnostic criteria, tentatively termed ‘automatophobia’ for the purposes of this study. Fear and anxiety towards automated driving could potentially be conceptualized in different ways. We decided for its conceptualization within a DSM-5 specific situational type phobia framework, because of it being a reliable construct involving a rather specific situation. Furthermore, the diagnosis ‘fear of flying’ is a precedent of a mode of transportation related to a situational type phobia (Oakes & Bor, 2010). Hence, we conceptualized ‘automatophobia’ as a specific form of specific phobia of the situational type and we assessed anticipated automatophobia at three levels (American Psychiatric Association, 2013). First level, symptomatic, that is reporting anticipated fears and anxiety towards active automated driving, subthreshold, and full-blown. Second level, we estimated the association and overlap of automatophobia with i) fears and anxiety related to non-automated driving as well as with ii) symptoms of other specific phobias. Third level, we estimated how automatophobia relates to fear and anxiety towards automated driving as other road traffic participants. Given the current relative scarcity of automated cars, we use the term ‘automatophobia’ in the following prospectively, referring exclusively to anticipated symptoms, if not otherwise stated. ‘Automated car’ refers to a car equipped with an Automated Driving System (ADS) [defined as capable of levels of driving automation 3 or higher, according to the automated driving standard ‘SAE International Standard J3016’ classifying degree of automated driving] (On-Road Automated Driving Committee, 2018). Level 3 was chosen as threshold as it describes ADS as active driving feature when engaged, as opposed to ADS functioning as driver support feature on levels 0–2.
MethodsSetting, ethics approval study registeredThe ethical review board of the International Psychoanalytic University approved the study (approval number: 2018–5/2019–13). We assert that all procedures contributing to this work comply with the ethical standards of the relevant national and institutional committees on human experimentation and with the Helsinki Declaration of 1975, as revised in 2008. The informed verbal consent procedure was approved in advance by the Ethikkommission der Internationalen Psychoanalytischen Universität Berlin (ethics committee of the International Psychoanalytic University Berlin). All respondents provided informed verbal consent, with a caregiver providing additional informed consent if the respondent was younger than 18 years of age. Verbal consent was witnessed and formally recorded. Criteria for inclusion in the study were: i) Age 14 years or older, ii) sufficient German language skills, and iii) no health conditions or impairments that would impede participation in the interview.
Study design and samplingWe applied a national representative survey framework with subjects participating in one of two waves of face-to-face interviews between 2 September 2019 and 17 September 2019. The target sample size was 2000 subjects (Linden, 2013). Respondents were selected from a multi-stage probability sample of the German-speaking population living in a total of 40.35 million private households in Germany, aged 14 years and older (Media-Micro-Census GmbH, 2018). Details of the sampling procedure, interviews, and quality control measures are provided as Supplementary Material 2. In brief, 397 trained interviewers conducted the interviews, which lasted an average of 60 min. Mean age of the interviewers was between 45 and 50 years, approximately 45% were male and 55% were female, and all were trained in various methods and procedures. Each interviewer received specific instructions and underwent a trial period of six months with quality checks by their superiors.
Demographic factorsSociodemographic data included: Gender, age, marital status, level of education, occupational status, associated household income and size of household of subjects (all assessed via survey), size of area of residence, and region (both based on information provided with the Arbeitsgemeinschaft Deutscher Marktforschungsinstitute's (Working Group of German Market Research Institutes) (ADM) network data, all categorized as depicted in Supplementary Material Table 1. Information on region was based on the federal state in which the interview took place, categorized according to Nielsen areas. How federal states relate to Nielsen areas is described in the notes of Supplementary Material Figure 2.
Diagnostic assessmentsWe defined automated driving as in-vehicle use of a car with engaged ADS (Grubmüller et al., 2017). As automated driving is only at the starting point to enter the market, we evaluated anticipated fear, anxiety, and avoidance, relating to a possible future situation in which road traffic mainly consists of cars driving in automated mode and in which respondents regularly rely on automated driving for transportation (see Supplementary Material 1). To ensure that respondents referred to levels of driving automation 3 or higher, we used a vignette approach (Hohenberger et al., 2017), introducing the questions related to automated driving. An English translation of the vignette is provided as Supplementary Material 1 (original German version is available on request).
We assessed symptoms of ‘automatophobia’ with the DSM-5 criteria framework for ‘specific phobia’ (criteria A to G) (American Psychiatric Association, 2013). We adopted items from the development and well-being assessment (DAWBA) (Goodman et al., 2000), a well-validated diagnostic and standardized interview, for which German versions for the age ranges of 11 to 17 years and 18 years and above are available. Items were specified to accommodate DSM-5 criteria for specific phobia regarding fear, anxiety, and avoidance related to driving in an automated car. Specified items are provided as Supplementary Material 3. Exclusion criteria were probed via respective screening items adopted from the Composite International Diagnostic Interview (CIDI) (Wittchen, 1994). In cases of uncertainty arising from ambiguous or missing responses on individual items of the diagnostic section of the interview, a conservative approach was adopted, whereby the absence of clear agreement with any of the presented response options indicating fulfillment of any criterion was coded as the absence of the respective construct underlying the item.
To account for the dimensionality of mental disorders (Haslam et al., 2012) with a high level of granularity, subjects were divided into four groups. The first group, ‘full-blown automatophobia’, included respondents fulfilling all automated-driving-related anticipatory DSM-5 criteria for specific phobia (criteria A to G). The second group, ‘subthreshold automatophobia’, included respondents fulfilling criterion A and at least two, but not all four of criteria B to E. The third group, ‘automatophobic fear/anxiety’, reported a little, marked, or strong fear or anxiety and fulfilled none or one of the criteria B to E.
This group was implemented (see also Imperiale et al., 2021) to account for the finding that symptoms can be present before discernable subclinical phenotypes develop (McGorry & van Os, 2013). The fourth group, ‘no automatophobia’, included respondents reporting no fear or anxiety related to automated driving.
Notably, according to DSM-5, subjects that qualify for full-blown phobia are necessarily impaired (criterion F). Estimating the association between full-blown automatophobia and presence of impairment is consequently meaningless from a DSM-5 perspective. Therefore, we identified respondents fulfilling criteria A to E and G, irrespective of criterion F (full-blown automatophobia irrespective of impairment), which allowed us to contrast the respective associations of impairment with ‘full-blown automatophobia irrespective of impairment’, ‘subthreshold automatophobia’, and ‘automatophobic fear/anxiety’.
Additional fear and anxiety related assessmentsWe collected information on three additional topics: i) Symptoms of ‘passive automatophobia’, that is fear, anxiety, or avoidance related to automated cars in the context of a) being a relatively unprotected road user, or b) as user of a non-automated motor vehicle in the form of motorcar, truck, motorbike, or similar, ii) on clear and persistent fear or anxiety related to driving a non-automated car, and iii) on clear and persistent fear or anxiety of other situations or objects.
Driving historyWe collected information on individual driving history, including i) one question on having a driving license for cars (yes/no) and four questions regarding frequency of car use during the past 12 months in form of ii) automated cars as driver or operator in the driving seat, iii) automated cars as passenger in the passenger seat or rear seat, iv) non-automated cars as driver in the driver's seat, and v) non-automated cars as passenger in the passenger seat or rear seat (cf. Kyriakidis and colleagues) (Kyriakidis et al., 2015), categorized according to categories depicted in Supplementary Material Table 2.
Statistical analysesA distinct two-step weighting scheme was used to make the sample representative for the German-speaking population living in private households in Germany, aged 14 years or older (see Supplementary Material 4).
We used cross-tabulations to calculate i) frequencies of different degrees of fear and anxiety related to automated driving, stratified by sex and age groups, ii) prevalence rates of symptomatic, subthreshold, and full-blown automatophobia stratified by sex and age groups, iii) symptomatic automatophobia stratified by Nielsen area as sensitivity analysis, and iv) frequency of symptoms of passive automatophobia. Furthermore, we used cross-tabulations followed by logistic regression analysis to compare the level of impairment between subjects with symptomatic, subthreshold, and full-blown automatophobia, the latter defined exclusively for this purpose as endorsing all criteria A to G, irrespective of endorsement of criterion F. Throughout all other parts of the manuscript, full-blown automatophobia also requires endorsement of criterion F. We also used cross-tabulations to describe the frequency of subthreshold and full-blown automatophobia with and without concomitant i) fears/anxiety related to non-automated driving, and ii) indications for other specific phobias.
We conducted logistic regression analyses to estimate the association between demographic characteristics, driving history, phobia related to non-automated driving, and other specific phobias with the outcomes prevalence of symptomatic, subthreshold, and full-blown automatophobia as follows: In a first set of models, we concomitantly estimated how sex, age, education, household income, and marital status predicted the outcomes, followed by test for trend in case of age, education, and household income, using Wald tests of linear hypotheses about the parameters across comparisons between variable categories and the respective baseline category. Next, we estimated separate logistic regression models for each of the predictors: City size, Nielsen area (using Nielsen area 2, with the largest population, as reference category), having a driving license, frequency of driving non-automated cars, phobia related to non-automated cars, and symptoms of specific phobia related to driving-unrelated stimuli. All these models were adjusted for the a priori defined potential confounders: Sex, age, education, household income, and marital status. We additionally provide unadjusted, crude models for reasons of transparency. We based all statistical analyses on weighted data and computed them with the Taylor series linearization method (Wolter, 2007), unless otherwise specified, to account for the complex structure of the survey data, including the multistage sampling design.
We described the frequency of fear, anxiety, or avoidance related to automated cars in the context of not using them oneself but encountering them in road traffic (‘passive automatophobic fears’), either as relatively unprotected road user or as user of a non-automated motor vehicle. We used cross-tabulations and logistic regression as outlined above to describe and estimate the association of passive automatophobia with symptomatic, subthreshold, and full-blown automatophobia.
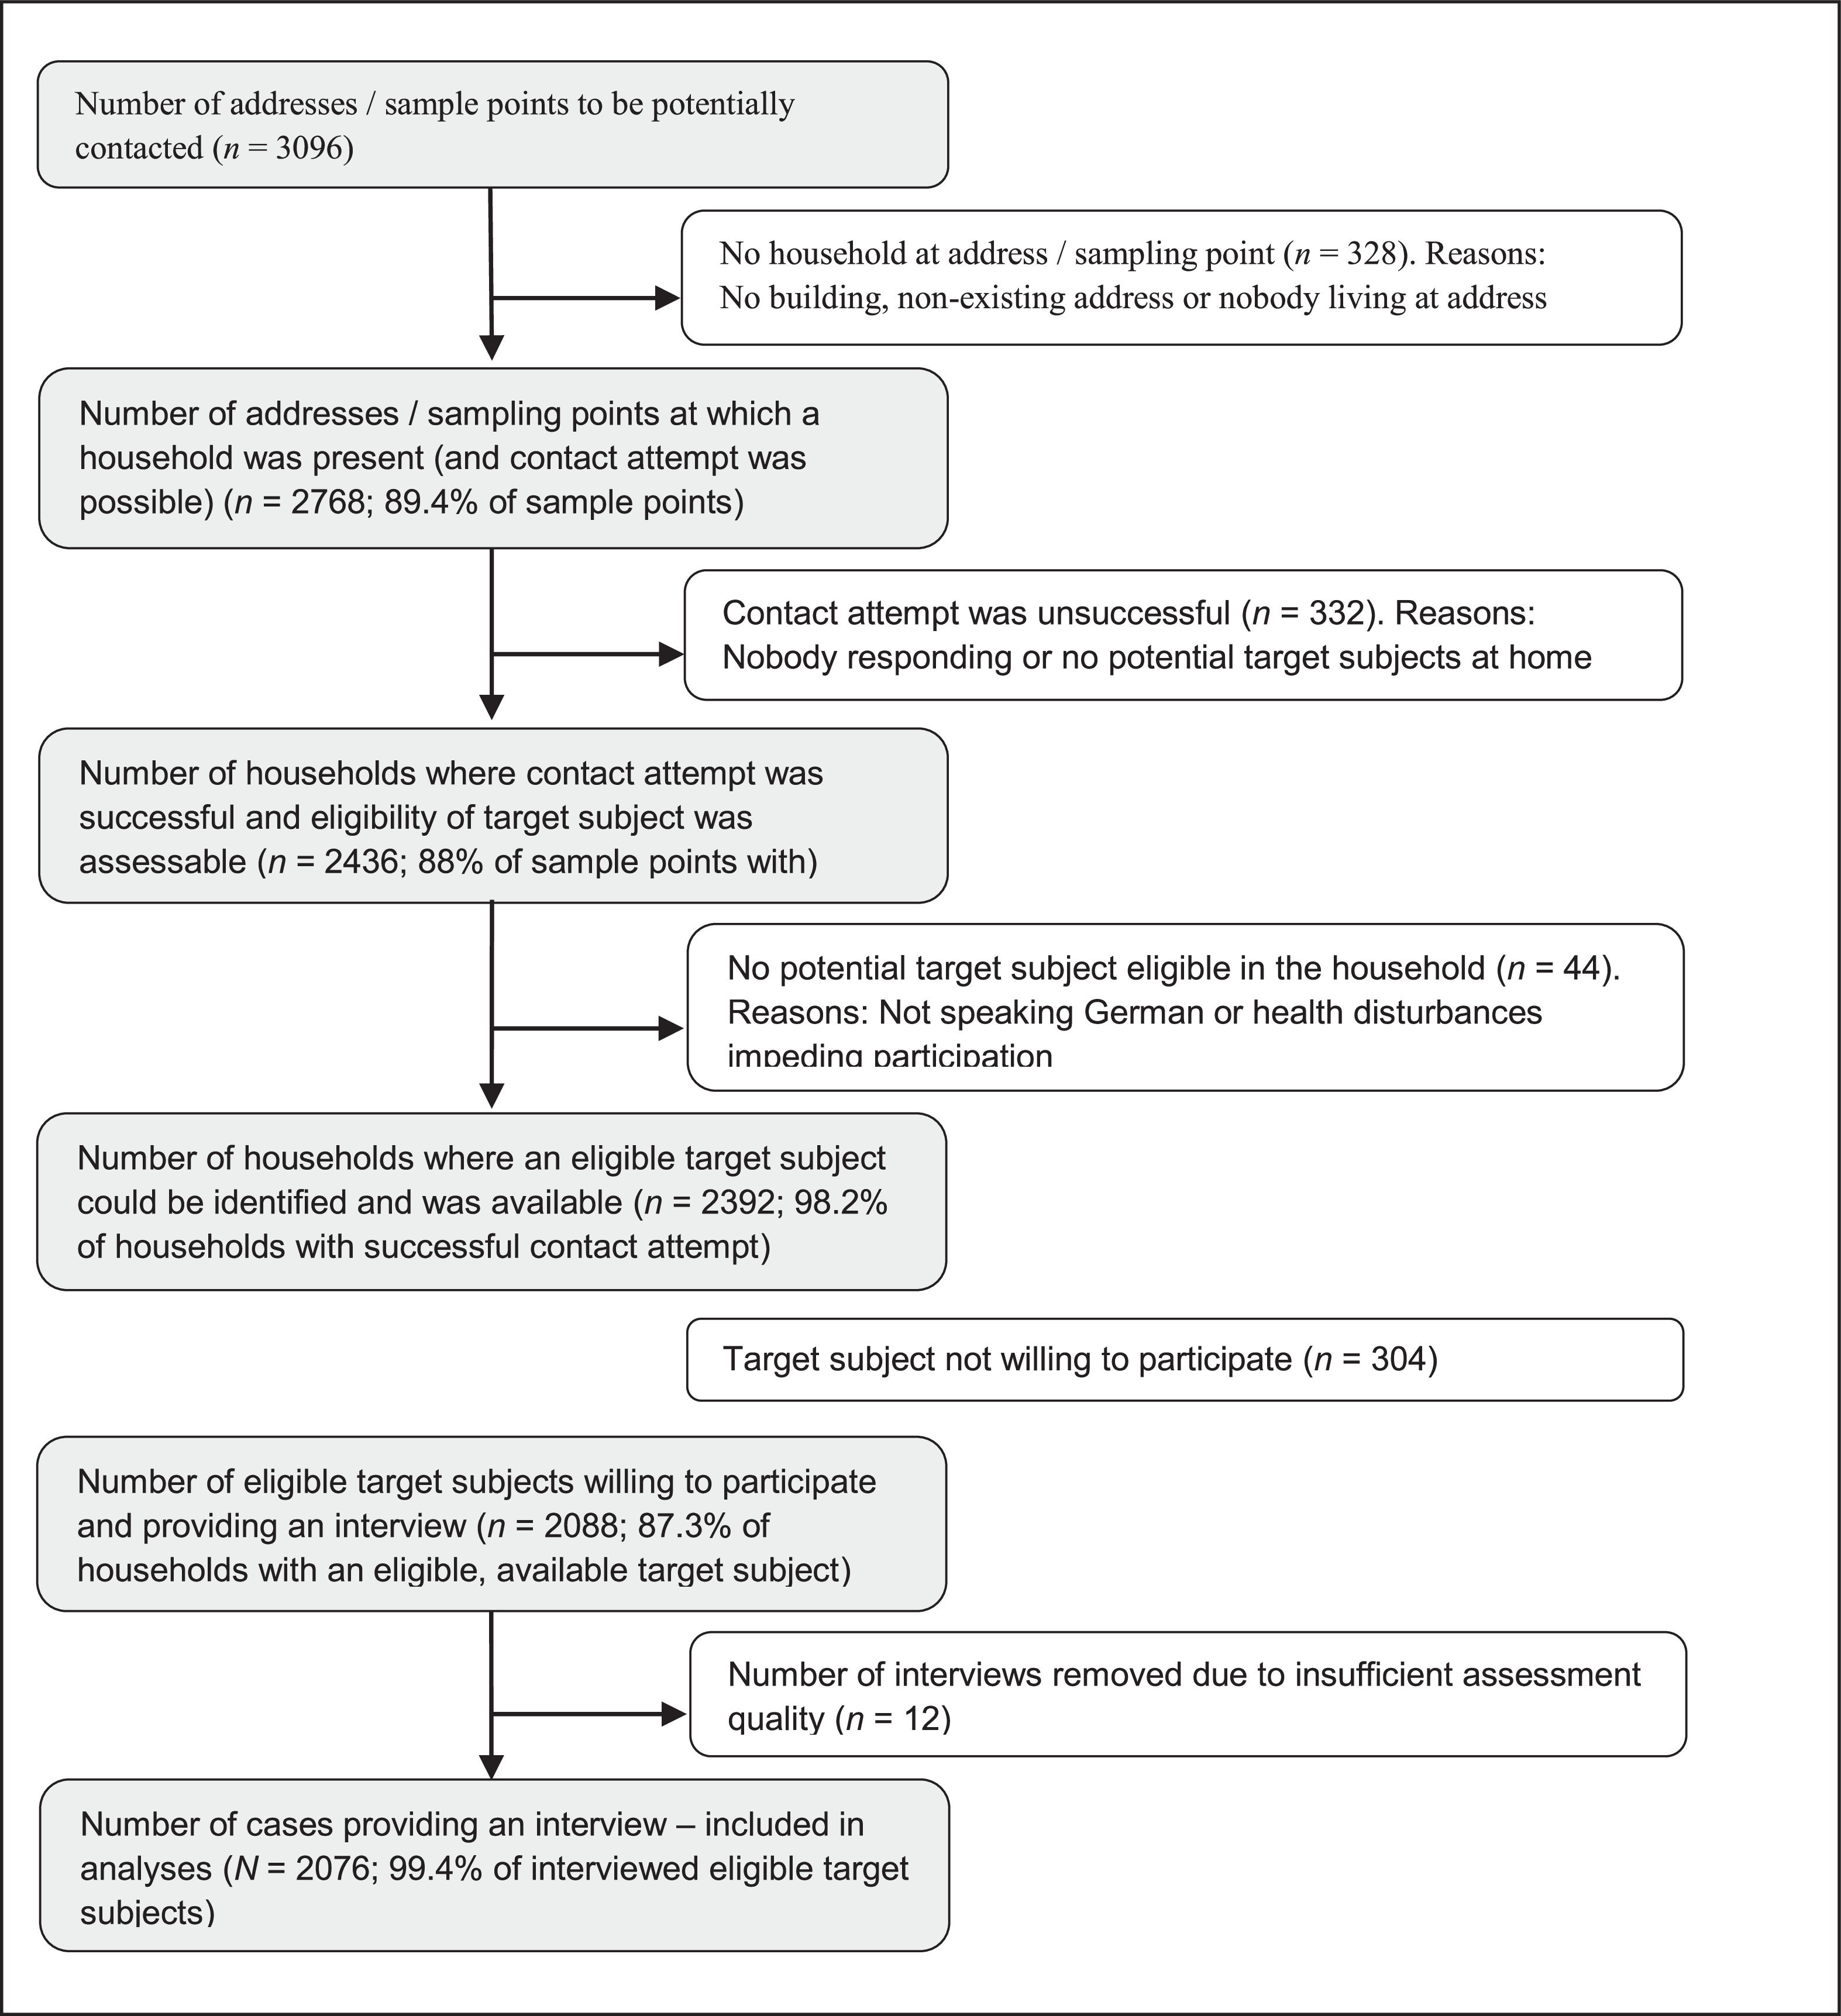
ResultsSample descriptivesWe provide the flowchart of study subjects in Supplementary Material Figure 1. Data from a total of 2076 respondents were included in the analyses. Demographic characteristics and driving characteristics of the total sample stratified by sex are depicted in Supplementary Material Tables 1 and 2. There were 2 cases with missing data on occupational status and 3 cases with missing data on net household income. We conducted complete case analyses (CCA) throughout, leaving out cases with missing data when one of the two above-mentioned variables were included in the analyses, given that CCA is expected to give unbiased results (Hughes et al., 2019).
Prevalence of and impairment by automatophobic fear/anxiety, subthreshold automatophobia, and full-blown automatophobiaWhile 59.18% (CI 56.02 – 62.27) of respondents reported no fear or anxiety related to automated driving, 24.52% (CI 22.22 – 26.98) reported little, 9.05% (CI 7.71 – 10.6) reported marked, and 7.24% (CI 5.82 – 8.99) reported strong fear or anxiety (frequencies stratified by sex and age groups are depicted in Supplementary Material Figure 1). From a DSM-5 specific phobia perspective and based on respondents’ anticipated symptoms, 40.82% (CI 37.73 – 43.98) of respondents reported at least some automatophobic fear/anxiety, 15.22% (CI 13.19 – 17.51) fulfilled criteria for subthreshold automatophobia and 3.39% (CI 2.42 – 4.75) for full-blown automatophobia, with higher prevalence in female subjects than in male subjects across all three levels (see Supplementary Material Table 3 and results from logistic regressions below) and the highest prevalence in subjects aged 75 years and older (see Fig. 1 for prevalence rates across age groups). Impairment was anticipated by 5.34% (CI 3.55 – 7.97) of respondents with automatophobic fear/anxiety, but no subthreshold or full-blown automatophobia, by 26.75% (CI 20.46 – 34.15; odds ratio (OR) = 6.47, CI 3.80 – 11.0, relative to automatophobic fear/anxiety only) of respondents with subthreshold, but not full-blown automatophobia, and by 71.44% (CI 59.31 – 81.10; OR = 44.3, CI 22.9 – 85.6, relative to automatophobic fear/anxiety only) of respondents with full-blown automatophobia – notably, with full-blown automatophobia defined irrespective of endorsement of impairment criterion F.
Subthreshold and full-blown automatophobia with and without i) fear/anxiety related to non-automated driving, and ii) indications for other specific phobias
Strong and enduring fear of driving with non-automated cars was reported by 49.63% (CI 33.79 – 65.55) of subjects with full-blown automatophobia and 25.98% (CI 19.51 – 33.69) of subjects with at least subthreshold automatophobia. Strong and enduring fear of other specific situations, such as using elevators, tunnels, or planes, blood, syringes, animals, heights, or storms were reported by 49.97% (CI 33.43 – 66.52) of subjects with full-blown automatophobia and 34.03% (CI 26.81 – 42.08) of subjects with at least subthreshold automatophobia. Both, fear/anxiety related to non-automated driving and indications of other specific phobias were linked with automatophobia across all levels (see Table 2).
Predictors of automatophobic symptomatology, subthreshold automatophobia, and full-blown automatophobiaBeing female and of older age was linked to an increased risk of automatophobia across all three levels. No association was found between education or marital status and automatophobia risk, while some evidence tentatively suggested that lower household income may be related to increased risk of subthreshold automatophobia (see Table 3).
There was some indication that a larger city predicted a lower risk for automatophobic symptomatology and subthreshold automatophobia. Further, automatophobic symptomatology differed across regions in Germany (see Table 1 & Supplementary Material Fig. 2). While there was no indication that owning a driving license was linked to automatophobia across levels, using non-automated cars less often was linked to an increased risk of automatophobia across levels.
Demographics and socioeconomic data.
*, p < 0.05; **, p < 0.01; ***, p < 0.001; §, DSM-5 criteria for specific phobia were applied.
Abbreviations: CI, confidence interval; DSM, Diagnostic and Statistical Manual of Mental Disorders; OR, odds ratio.
Notes: Analyses are based on weighted data.
Automatophobic symptoms, subthreshold automatophobia, and full-blown automatophobia predicted by other fears.
*, p < 0.05; **, p < 0.01; ***, p < 0.001; §, DSM-5 criteria for specific phobia were applied.
Abbreviations: CI, confidence interval; DSM, Diagnostic and Statistical Manual of Mental Disorders.
Notes: Analyses are based on weighted data.
Automatophobic symptoms, subthreshold automatophobia, and full-blown automatophobia predicted by socio economic status.
* p < 0.05; ** p < 0.01; *** p < 0.001; § DSM-5 criteria for specific phobia were applied.
Abbreviations: CI, confidence interval; DSM, Diagnostic and Statistical Manual of Mental Disorders.
Notes: Analyses are based on weighted data.
The prevalence of passive automatophobia (marked or strong fears) was 12.71% (CI 10.71 – 15.01) as non-automated motor vehicle user, and 15.94% (CI 13.82 – 18.33) as pedestrian, bicycle- or e-scooter-user (for details, see Table 4).
Frequency of anxiety related to not using highly automated cars oneself but encountering them in road traffic (‘passive automatophobia’).
Abbreviations: CI, confidence inter.
The prevalence of passive automatophobia as non-automated motor vehicle user was 0.67% (CI 0.32 – 1.38) in subjects with no anticipated symptoms of active automatophobia (i.e. as in-vehicle user of an automated car), 7.03% (CI 4.70 – 10.39) in subjects with active automatophobia (adjusted OR = 11.5, CI 5.29 – 24.8, as compared to subjects without active automatophobia), 65.58% (CI 58.22 – 72.25) in subjects with subthreshold active automatophobia (adjusted OR = 312.4, CI 129.4 – 754.4, as compared to subjects without active automatophobia), and 81.12% (CI 67.52 – 89.87) in subjects with active automatophobia (OR = 662.1, CI 208.7 – 2100.6, as compared to subjects without active automatophobia).
The prevalence of passive automatophobia in terms of marked or strong fears as pedestrian, bicycle- or e-scooter-user was 0.56% (CI 0.26 – 1.21) in subjects with no active automatophobia, 12.15% (CI 9.12 – 16.01) in subjects with active automatophobia (adjusted OR = 26.5, CI 11.1 – 63.2, as compared to subjects without active automatophobia), 79.68% (CI 73.28 – 84.86) in subjects with subthreshold active automatophobia (adjusted OR = 837.4, CI 328.2 – 2136.8, as compared to subjects without active automatophobia), and 90.73% (CI 79.69 – 96.07) in subjects with active automatophobia (adjusted OR = 1982.2, CI 563.0 – 6979.2, as compared to subjects without active automatophobia).
DiscussionWe estimated the prevalence and risk factors of anticipated fear and anxiety towards actively using cars driving in automated mode (‘automatophobia’) and collected data via face-to-face interviews in a national representative sample. Approximately 41% of subjects anticipated experiencing fear and anxiety, 15% fulfilled criteria for subthreshold, and 3% for full-blown automatophobia, with automatophobia defined as a form of DSM-5 specific phobia. Given that about 27% of those with subthreshold automatophobia anticipated relevant impairment and that all with full-blown automatophobia are impaired by definition, we estimated the overall prevalence of subjects with subthreshold and full-blown automatophobia with relevant impairment at 7% of the total population. Risk estimates were approximately twice as high in female subjects as compared to male subjects, and substantially increased with age. Data tentatively indicated that the risk of subthreshold automatophobia was lower when household income was high and that the risk of automatophobic symptoms was higher in subjects living in villages or small towns, and that both risks increased when not frequently using non-automated cars.
Our findings complement initial reports documenting that fears and anxiety related to automated driving are rather common (Continental Corporate Media Relations, 2018; Haboucha et al., 2017; Hohenberger et al., 2016, 2017; Kyriakidis et al., 2015), including first data suggesting that anticipation of being frightened by automated cars may be higher in women than men (Hohenberger et al., 2016). Further, our findings, regarding a higher prevalence in women as compared to men, are in line with recent estimates of the general prevalence of DSM-IV specific phobia, amounting to life-time prevalence estimates, cross-nationally, of 9.8% in females and 4.9% in males (Wardenaar et al., 2017), as well as 12 month-prevalence estimates in Germany of 15.4% in females and 5.1% in males (American Psychiatric Association, 2013; Jacobi et al., 2014). While we found the risk of automatophobia across all levels to increase with age, general specific phobia 12-month-prevalences appear to decrease in the elderly (Jacobi et al., 2014). Our findings add to a larger body of evidence suggesting that about one fourth of the population suffers from fears related to new technologies, such as fear of autonomous robots and artificial intelligence (FARAI) (Liang & Lee, 2017). These studies, along with others on related constructs such as technophobia (Di Giacomo et al., 2019; Nimrod, 2021), show comparable aging effects, indicating that our results may reflect a true aging effect.
Our study has several strengths: First, we used face-to-face interviews which, as compared to other data collection modes, usually i) have better coverage properties, ii) allow more accurate screening and household enumeration procedures that are required to construct the probability sample, iii) have higher response rates, iv) allow for longer and more complex interviews, while v) minimizing the problem of respondents dropping out of the interview (Groves et al., 2011). Second, we adopted a DSM-5 specific phobia framework. Third, our interview items were adapted from established items of standardized clinical interviews. Fourth, we based our analyses on a representative general population sample, including the application of weighting procedures to correct for potential sampling bias.
Our study has several limitations: First, we did not include non-German speaking subjects, potentially limiting the generalizability of findings to the German speaking resident population. However, it is estimated that only less than 2% of the resident population in Germany do not identify themselves as speaking German (Adler, 2018; Gärtig et al., 2010). Second, our sampling strategy omitted people living in shared accommodations, such as hostels, student dormitories, military barracks, monasteries, prisons, and assisted living centres. Additional data collection modalities are needed to target these specific populations. Third, interviews were conducted by trained lay interviewers. Yet, the structured interview from which our items have been derived can be well conducted with very good assessment properties by lay interviewers (Goodman et al., 2000).
Our findings are generalizable to the German-speaking population living in private households in Germany, aged 14 years or older. It can be assumed that our findings largely translate to other industrialized countries – however with some variation. This is indicated by recent surveys on mobility (Continental Corporate Media Relations, 2018).
We evaluated anticipated fear, anxiety, and avoidance, which may differ from fear, anxiety, and avoidance once the technology has been widely introduced. Still, it has been suggested that public imagination and societal representations are a valuable approach to study automated mobility systems (Wahlström, 2017). Preceding widespread introduction of automated mobility, additional studies on automatophobia utilizing different prompts are required to replicate our findings in other countries, to better anticipate future health care needs. Future studies are also needed to monitor how anticipated fears, anxiety, and avoidance translate into fears, anxiety, and avoidance experienced in the context of real automated mobility. Automatophobia may occur in individuals without any previous experience with automated mobility (‘primary automatophobia’) or develop in individuals that previously perceived no fear or anxiety when using automated cars (‘secondary automatophobia’). Studies following large-scale adoption of automated mobility may concomitantly elucidate both phenomena and their relevance.
Even though related, automatophobia showed only partial overlap with fears related to non-automated driving and symptoms of other specific phobias. The size of this overlap was comparable to the size of overlap between different established subtypes of specific phobias (Grenier et al., 2011; LeBeau et al., 2010; Wardenaar et al., 2017). Further, automatophobia appeared to be rather distinct from other specific phobias regarding its risk increasing with age. Interestingly, ‘active automatophobia’ was virtually overlapping with ‘passive automatophobia’. This suggests that active and passive automatophobia should be subsumed under a broader definition of automatophobia comprising both fear and anxiety related to in-vehicle use of automated vehicles as well as to encountering automated vehicles as other road traffic participant.
Relevant mechanisms, to be elucidated in future studies on the development of automatophobia, include: Risk perception, trust, a lack of subjective prediction models, risk communication, driving frequency, and many others. These may also be relevant to better understand the gender differences in prevalence estimates. To better understand whether the identified higher automatophobia prevalence in older subjects (perhaps related to increasing time since obtaining one's driving license) is a true aging effect, or rather a cohort effect, requires further studies. In case of a cohort effect, prevalence rates across all ages would be expected to decrease over time. However, to date, there is ambiguous data across countries regarding whether fears and anxiety related to automated driving increased or decreased over the past couple of years (Continental Corporate Media Relations, 2018). Furthermore, our data indicate regional variations in prevalence estimates, which warrants further studies to explore potential underlying factors, such as variations in public transport facilities and fraction of rural population across counties.
Our findings stimulate and contribute to the development of a theoretical basis for the construct of ‘automatophobia’ and data highlight the relevance of further elucidating the concept of ‘automatophobia’. Our data suggests defining automatophobia as a form of specific phobia, defined as clinically relevant fears, anxiety, and avoidance of actively using or passively encountering vehicles moving in automated mode. Notably, automatophobia appears to be distinct from fears related to non-automated driving and other specific phobias. Clinically, our findings call for action to develop diagnostic and therapeutic tools to address clinically relevant fears and anxiety in the context of automated driving. Economically, substantial fears and anxiety related to automated driving may constitute a substantial barrier towards its broad introduction. From a policy perspective, the findings call for special attention to prevent automatophobia from challenging parts of a society strongly and exclusively relying on automated mobility. Given the anticipated ubiquitous presence of automated mobility, mental barriers towards its use can be expected to lead to substantial individual suffering and even exclusion from participation in daily living, with detrimental effects not only on an individual, but also a societal level. This matter seems particularly urgent given that our results indicate that demographic factors such as age, gender, area of residence and – to a lesser degree – household income are predictors of automatophobia. It stands to reason that these factors might further entrench existing or create new dynamics of inequality.
About 1 out of 5 subjects anticipates substantial fear and anxiety towards driving with automated cars, in many cases going along with considerable impairment, including a substantial percentage of subjects that prospectively fulfilled the criteria of automatophobia as a form of specific phobia. Automatophobia appears to be distinct from fears related to non-automated driving and other specific phobias, while automatophobia and fears related to active use or passive encounter of automated cars in road traffic largely overlap. Our findings call for special attention to preventing automatophobia from challenging parts of a society that increasingly relies on automated mobility.
Author contributionsGM, ES, LG, and MT devised the study concept. GM, ES, LG, and MT devised the methodology. GM acquired funding. GM and LG curated the data. GM, ES, and MT planned the formal analysis. GM carried out the formal analysis. GM, ES, and LG produced visualizations. GM, ES, LG, MB, and MT were involved in the validation. GM wrote the first draft of the manuscript and all authors contributed to reviewing and editing the final version. GM was responsible for project adminstration.
Ethics approvalThe ethical review board of the International Psychoanalytic University approved the study (approval number: 2018-5/2019-13). We assert that all procedures contributing to this work comply with the ethical standards of the relevant national and institutional committees on human experimentation and with the Helsinki Declaration of 1975, as revised in 2008. All respondents provided informed verbal consent, with a caregiver providing additional informed consent, if the respondent was younger than 18 years of age. Verbal consent was witnessed and formally recorded.
Data availabilityData are available to researchers upon personal request made to the corresponding author after confirmation that all legal and ethical requirements are met by the recipient(s).
