


Compared to clinical bulimia nervosa, sub-threshold bulimic symptoms are becoming more prevalent in non-clinical or general population, which is repeatedly linked with the connectivity in orbitofrontal cortex (OFC), including functionally heterogeneous the medial and lateral OFC (mOFC; lOFC). However, the specific connectivity patterns of the mOFC and lOFC in individuals with severe or mild bulimic symptoms (SB; MB) remain poorly understood.
MethodsWe first utilized resting-state functional connectivity (FC) and spectral dynamic causal modeling (spDCM) to investigate abnormal functional and effective connectivity (EC) of OFC subregions in adults with different severity of bulimic. The SB group (n = 21), MB group (n = 114), and healthy controls (HC, n = 91) underwent rs-fMRI scans. A generalized linear model was applied to determine the OFC-seeded whole-brain FC across the three groups. Subsequently, spDCM was used to estimate differences in EC among the three groups based on the FC results.
ResultsWe observed a shared neural basis for SB and MB groups (i.e., weaker lOFC-superior parietal lobule connectivity), which may support the role of dysfunctional inhibitory control in general bulimic symptomatology. Whereas, SB group displayed greater lOFC-occipital pole connectivity than MB group, suggesting the specificity of the neural correlates of full-threshold/severe bulimia. The directional links from the mOFC to lOFC and amygdala could further explain the aberrant interactions of reward sensitivity with inhibitory control and homeostatic energy in sub-threshold/mild condition.
ConclusionThe current study provides novel evidence that divergent connectivity patterns of the lOFC and mOFC may contribute to different severities of bulimia, which will expands our understanding of the neurobiological substrates underlying bulimia across a spectrum from healthy to unhealthy.
Bulimia nervosa (BN) is defined by recurrent episodes of binge eating (i.e., consuming an objectively large amount of food with loss of control) and compensatory behaviors (i.e., self-induced vomiting, abuse of laxatives or diuretics, or extreme exercise) to avoid weight gain, with a lifetime prevalence rate of 1.9 % for women and 0.6 % for men (American Psychiatric Association, 2013; Galmiche et al., 2019). With the availability of palatable food in modern society, sub-threshold bulimia-type eating (i.e., binge eating and compensatory behaviors) has increasingly become a means to seek reward and control body weight and shape in non-clinical individuals who may have great risk to develop into clinical eating disturbances (Fan et al., 2010; Micali et al., 2014; Oliva et al., 2019, 2020; Santomauro et al., 2021). Hence, it is urgent to focus on them in order to broaden our understanding of the bulimic pathology, which may represent potential contributing factors for the development of clinical BN.
Recurrent bulimic symptoms have repeatedly been linked with neurobiological alterations in the orbitofrontal cortex (OFC), which is a crucial region for food consumption (Bryden & Roesch, 2015; Kringelbach, 2005; Seabrook et al., 2020; Simon et al., 2016; Torregrossa et al., 2008). The OFC is composed of distinct cytoarchitectonic and functional sub-regions, and an increasing number of studies have investigated the functional distinction between the medial and lateral OFC (mOFC; lOFC) (Noonan et al., 2010; Wang et al., 2022). Specifically, the mOFC is more relevant to hot executive functions, including reward valuation and emotion, while the lOFC, a part of the lateral prefrontal cortex, is more closely related to cold executive functions, including inhibitory control and evaluating punishment, which may change an individual's ongoing behavior (Friedman & Robbins, 2022; Kringelbach & Rolls, 2004; McClure et al., 2004, 2007; Salehinejad et al., 2021).
At the node level, there may be a reversed neural pattern to food stimuli in which those with BN (i.e., clinical patients) exhibit hypoactivation in the lOFC and inferior parietal lobule (i.e., frontoparietal inhibitory control regions), combined with hyperactivation in the mOFC and amygdala (i.e., paralimbic reward areas) (Simon et al., 2016; Uher et al., 2004). Evidence from a resting-state fMRI study revealed the opposite connectivity pattern of OFC in binge eaters from the general population; the mOFC connection was positively associated with low-calorie food (LF) reward sensitivity, while the lOFC connection was negatively associated with high-calorie food (HF) reward sensitivity (Li et al., 2022). Similarly, weaker FC between the lOFC and parietal cortex and stronger FC between the mOFC and amygdala have been found to be associated with bingeing and body weight changes (Ahn et al., 2022; Duan et al., 2020; Lee et al., 2014).
More broadly, brain's inhibitory control and reward systems play a particularly important role in excessive food intake and overeating (for reviews, see Brooks et al., 2012; Ehrlich et al., 2019; Lowe et al., 2020). The impulse-control spectrum model of eating disorders has also demonstrated that different severity of disordered eating may be linked to varied levels of impairment in reward and inhibitory control regions (Brooks et al., 2011). Our recent large-scale brain network studies reported that adults with high level of disordered eating displayed weakened functional synchrony within and between executive control and reward networks (Chen et al., 2021, 2022). Nonetheless, the large-scale network research may not provide precise biomarkers of problematic eating, which hinders the development of more targeted prevention strategies; therefore, it is of crucial importance to focus on critical brain nodes/regions contributing to individual variations in bulimic symptoms (e.g., examining the unique role of the mOFC and lOFC in eating-related psychopathology) (Bonelli & Cummings, 2022; Kringelbach & Rolls, 2004). Our current hypothesis-driven study sought to investigate the underlying OFC-seeded FC patterns among adults with mild and severe bulimic symptoms, and healthy controls. However, in the absence of any prior knowledge of OFC connectivity patterns in different BN symptoms, we expected to observe differences between the bulimic and control groups. We hypothesized that there would be (i) altered FC between the lOFC and frontoparietal control regions (involved in dysfunctional behavioral control) and (ii) abnormal FC between the mOFC and reward limbic regions, such as the amygdala (related to aberrant reward function), in the bulimic population.
Furthermore, abnormal directional effect between brain regions may act as the basis for functional synchrony (Friston et al., 2014; Razi et al., 2015). Effective connectivity (EC) is an advanced variation of FC, determining causal interaction among different brain regions (Friston et al., 2014). However, the directional links between reward and inhibitory control areas in bulimic-type individuals have been understudied (Brooks et al., 2012; Friederich et al., 2013). Thus, this study would further quantify the EC of mOFC and lOFC among the three groups by using spectral dynamic causal modeling (spDCM), a reliable approach widely applied in psychopathology, which could identify the direction of connections and the valence of connections (excitatory versus inhibitory) between key brain regions (Fonzo et al., 2021; Friston et al., 2014; Li et al., 2020; Razi et al., 2015). To date, spDCM has been used to reveal the direction of connectivity that contribute to emotional intelligence (Bajaj & Killgore, 2021), binge eating (Chen et al., 2023), obesity (Voigt et al., 2021), and clinical outcomes (e.g., focal dystonia and major depressive disorder) (Battistella & Simonyan, 2019; Li et al., 2020). Given the functional heterogeneity of mOFC and lOFC (as mentioned above), and given the strong relationship of dysfunctional eating (e.g., binge eating and overeating) with potential interaction between brain's reward and cognitive control systems (e.g., Chen et al., 2021; Oliva et al., 2020; Shapiro et al., 2019), we further assumed that (iii) bulimic individuals might exhibit altered connectivity between these two OFC subregions (e.g., an inhibitory effect from the mOFC to lOFC). Additionally, there is evidence that bulimic symptoms are highly associated with body image concerns and food impulsivity (Bohon & Stice, 2011; Higgins et al., 2015), we thus examined the differences between groups on several behavioral factors, including negative body self, reward reactivity, and inhibitory control. The present study is the first to combine FC and EC indices to reveal the shared and unique neural substrates of different severity of bulimic. Studying the specificity of the neural basis of subclinical eating disorder symptoms would deepen our understanding of symptomatologic variability associated with BN, which is essential for the promotion of well-being in as many individuals as possible.
MethodsParticipantsParticipants were selected from our ongoing project, the Behavioral Brain Research Project of Chinese Personality, and recruited through online and offline advertisement at Southwest University, Chongqing. The project was reviewed and approved by the Ethics Committee of the Southwest University (IRB No. H19040). All of the content in this study complied the 6th revision of the Declaration of Helsinki. All participants completed the same behavioral measures and MRI scanning from September 2019 to September 2020.
Following a self-reported Eating Disorder Diagnosis Scale (EDDS; Stice et al., 2000) and the screening criteria of a previous study by Stice et al. (2018), participants who met full-threshold BN criteria were defined as severe bulimic (SB) group, and those who met sub-threshold BN criteria were defined as mild bulimic (MB) group. Participants scored zero on EDDS were selected in healthy controls (HC), indicating no episodes of binge eating and compensatory behaviors. According the rigorous DSM-5 criteria, we selected a representative sample of SB and MB in non-clinical population. Individuals with other neurological disorders, use of psychoactive medications, and other chronic diseases were excluded. Given the comorbidity between bulimia and overweight/obesity (e.g., Da Luz et al., 2018; Jebeile et al., 2021), and given that the sample was drawn from a general population, those with a BMI above/below normal weight were not excluded (e.g., Abdo et al., 2020; Hagan & Bohon, 2021) in order to maximize the number of participants and the ecological validity of the results. Instead, we included BMI as covariates to ensure that our results were not confounded by participants’ BMI. The final sample consisted of 21 participants with SB, 123 participants with MB, and 91 HC. For detailed information of screening criteria, see Section 2.3. To ensure the reliability of participants’ score on EDDS, we reported overeating score from a nine-items uncontrolled eating subscale of Three Factor Eating Questionnaire (Anglé et al., 2009). Results showed significant group difference across three groups (see supplementary material 5).
The present study is part of a broader line of research that examines the neuroimaging patterns of dysregulated eating behaviors and associated cognitive patterns. The resting-state OFC-based FC measure and directed influences of one region on another in adults with different levels of bulimic symptoms are novel and have not been reported before.
Behavioral paradigmsWe used modified Stroop task and go/no-go task to measure an individual's food-related inhibitory control, and food incentive delay task and dot probe task were used to evaluate food reward processing. Participants performed these tasks on laboratory computers using E-Prime 2.0 software, with seated approximately 60 cm from the screen. For the details of above tasks, see supplementary material 1 and Fig. S1.
MeasuresDemographicsInformation was solicited about participants’ age and sex. BMI was measured using a medical body composition analyzer (M515; seca, Hamburg, Germany).
Eating disorder diagnosis scaleEDDS, a 22-item self-report screening based on DSM-IV eating disorder criteria, consists of a brief assessment for providing diagnoses of BN, anorexia nervosa, and binge eating disorders (Stice et al., 2000). The EDDS is a rigorous assessment with good reliability and validity in Chinese samples across different regions of mainland China (Chen & Jackson, 2008; Jackson & Chen, 2010; Luo et al., 2020) and has a gender-equivalent univariate structure comprising all items (Jackson & Chen, 2008). In this study, items of diagnostic BN in EDDS (i.e., eating binges, compensatory behaviors, and body weight or shape concern) were used to screen participants. For SB, participants reported (a) at least three episodes of binge eating per week on average over the past three months as indexed by a response of yes to items 5 and 6, and a response of greater than 2 on item 8; (b) at least eight compensatory behaviors per week on average over the past three months as indexed by a response of 8 or greater on the sum of items 15, 16, 17, and 18; and (c) undue influence of body weight or shape on self-evaluation as indexed by a score of 4 or greater on either item 3 or 4. For MB group, participants reported (a) at least one episode of binge eating and one compensatory behavior, but fewer than the number of episodes in SB group, per week on average over the past three months as indexed by a response of yes to items 5 and 6, and a response of greater than or equal to 1 and less than 3 on item 8; and a response of greater than or equal to 1 and less than 8 on the sum of items 15, 16, 17, and 18; and (b) undue influence of body weight or shape on self-evaluation as indexed by a score of 4 or greater on either item 3 or 4. The HC group scored zero on the sum all items of EDDS.
Negative physical self scaleNegative Physical Self (NPS) scale is a 48-item multidimensional scale that measures individuals’ body image concerns about cognition-affect, behaviors, and projections. Relative to other scales, NPS includes more comprehensive and targeted subscales of body image concerns, namely general appearance, fatness, thinness, shortness, and facial appearance. The scale is a 5-point scale which consists of 48 items. Response options ranged from 0 = never to 4 = always. Higher scores on these items indicate a higher level of negative body image. All subscales have been found to have satisfactory reliability and validity in Chinese young adult samples (Chen et al., 2006; Jackson et al., 2016).
Neuroimaging data acquisition and preprocessingFor each participant, an 8 min rs-fMRI scan was performed in a 3T Trio scanner (SIEMENS PRISMA, Erlangen, Germany). We used a gradient echo planar imaging sequence to obtain resting-state functional images. Scanning parameters were as follows: repetition time (TR) = 2000 ms, echo time (TE) = 30 ms, slices = 62, slice thickness = 2 mm, field of view (FOV) = 224 × 224 mm2, flip angle = 90°, resolution matrix = 112 × 112, voxel size = 2 × 2 × 2.3 mm3, phase encoding direction = PC >> AC. Each section contained 240 vol. High-resolution T1-weighted structural images were acquired for coregistration purposes. The 3-D spoiled gradient-recalled sequence employed the following parameters: TR = 2530 ms, TE = 2.98 ms, FOV = 256 × 256 mm2, flip angle = 7°, base resolution = 256 × 256, slices per slab = 192, slice oversampling = 33.3 %, voxel size = 0.5 × 0.5 × 1 mm3, phase encoding direction = AC >> PC. During the 8-min scanning process, participants were instructed to remain still and relaxed, keep their eyes closed, and avoid thinking of anything deliberately. Foam pads and earplugs were employed to reduce head motion and scanning noise.
The publicly available Data Processing Assistant for Resting-State fMRI (DPARSF) toolbox (http://www.restfmri.net) working on MATLAB R2018b (MathWorks, Inc., Natick, MA, USA) was used to preprocess neuroimaging data. Preprocessing was conducted as follows: the first 10 time points were removed to minimize the instability of initial scanning. The remaining 230 vol were slice timing-corrected, realigned. Functional volumes were then spatially normalized to the Montreal Neurological Institute (MNI) 152-brain template with a resolution voxel size of 2 × 2 × 2 mm3 by Diffeomorphic Anatomical Registration through Exponentiated Lie Algebra (DARTEL). All functional images were smoothed using a Gaussian kernel of 6 mm full width at half-maximum and further denoised by regressing out several nuisance signals, including the Friston-24 head motion parameters and signals from white matter and cerebrospinal fluid, before linear detrending and temporal band-pass filtering (0.01–0.08 Hz). All individualized mean framewise displacement (FD) Power values fell within a reasonable range (less than 0.5 mm), as in previous study (Power et al., 2012; Yan et al., 2013). Therefore, no participants were excluded during data preprocessing.
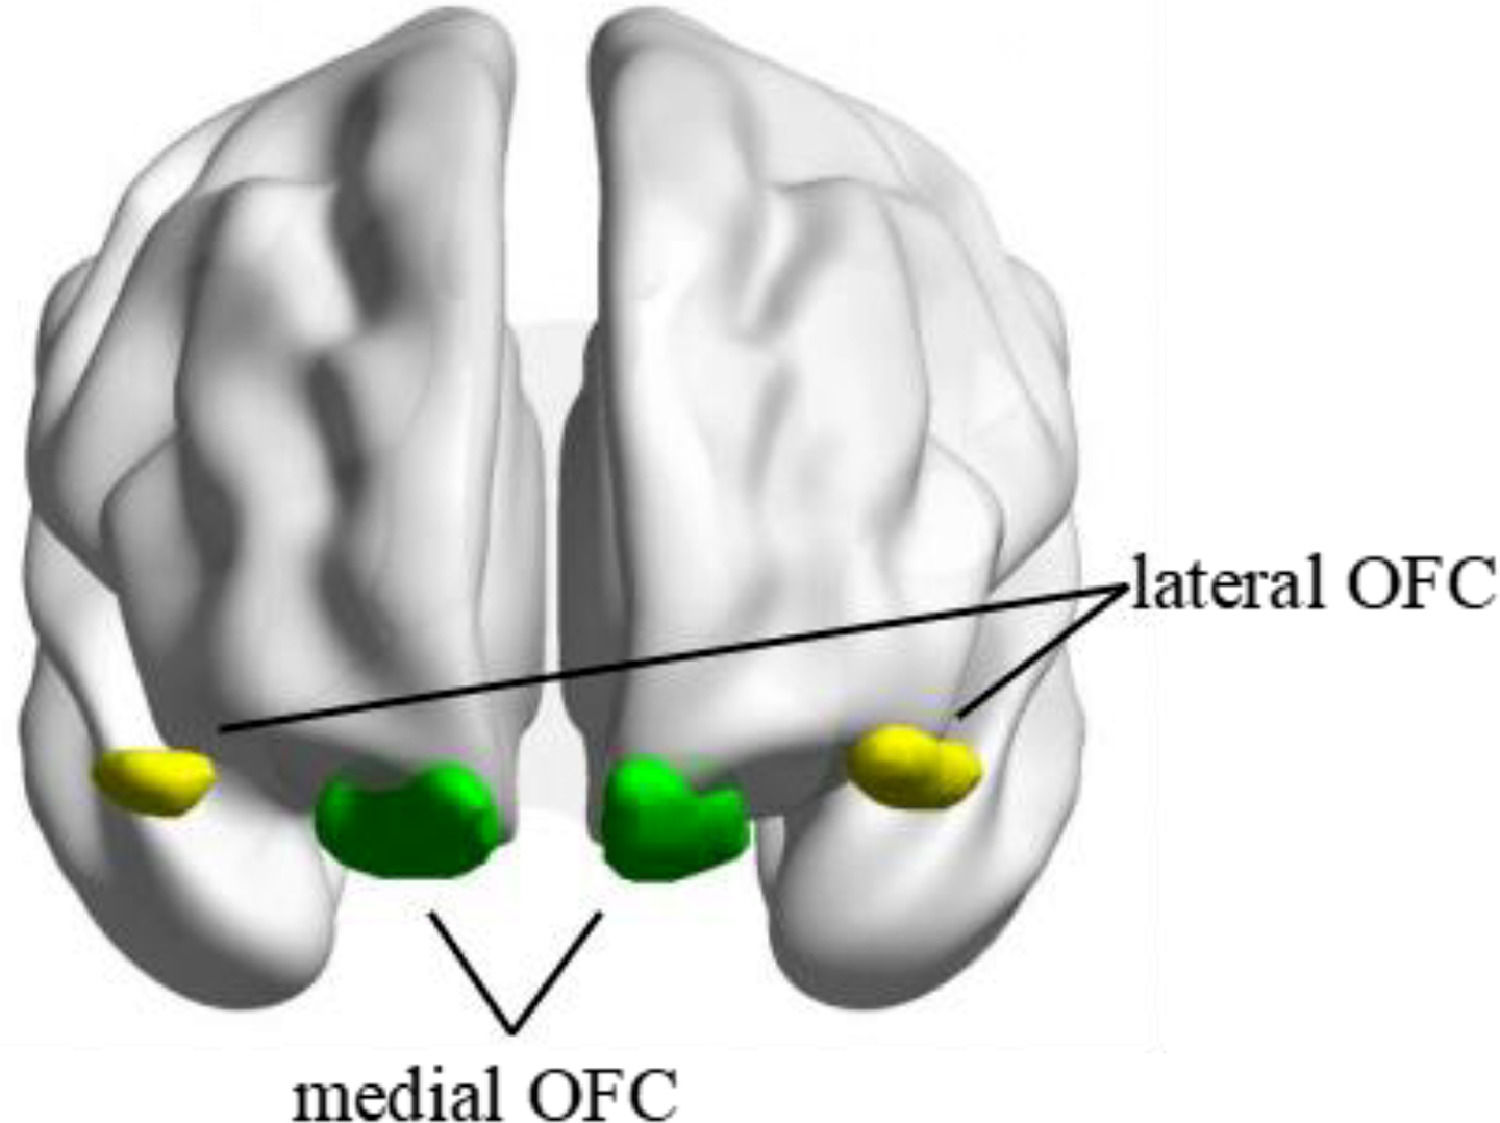
Seed-based functional connectivityThe seed regions of bilateral mOFC and lOFC were derived from the Automated Anatomical Labelling Atlas 3 (AAL3) (https://www.gin.cnrs.fr/en/tools/aal/) (Rolls et al., 2020) (see Fig. 1). The mean BOLD signal time series from each region of interest (ROI) was extracted and correlated with the time series of all other voxels within the brain to create whole-brain Pearson's correlation coefficient maps. Fisher's r-to-z transformation was then applied in these maps to improve the normality of the correlation coefficients.
Effective connectivity
Based on the results in seed-based FC analysis, we assessed their ECs using spectral DCM to further reveal the directional interaction between reward and inhibitory control regions in bulimic population.
ROI selection and time series extractionBOLD time series (the first eigenvectors) was extracted from preprocessed (slice timing, realigned, normalized, and smoothed) rs-fMRI data. In line with the FC analysis, we applied the same masks to extract time series of the mOFC and lOFC. For the significant clusters in OFC-seeded FC analysis, times series were extracted from a sphere of 8 mm radius centered on the peak coordinates, as in previous studies (Bajaj & Killgore 2021; Preller et al., 2019). We corrected nuisance regressors including six head-motion parameters, cerebrospinal fluid, and white matter. Low-frequency signal drifts were filtered using a 128-s high-pass filter. After quality control, four HC and four MB participants were excluded from DCM analysis due to insufficient time series extraction in one or more ROI. Thus, the final cohort of participants for EC analysis included 87 HC, 119 MB participants and 21 SB participants.
First level analysis: specification and inversion of DCMThe spectral DCM analyses were conducted using DCM12 implemented in the SPM12 (revision 7771, www.fil.ion.ucl.ac. uk/spm). We build a DCM for each significant FC at the subject level, generating a total of 6 models, which fits the complex cross spectral density using a power-law model of endogenous neuronal fluctuations. We then estimated each participant's DCM with Bayesian model inversion, finding the posterior density over parameters. For more details, see Friston et al. (2014).
Second level analysis: parametric empirical bayesSecond-level analysis with the Parametric Empirical Bayes (PEB) framework examined the between-group differences in EC. The PEB framework specifies a hierarchical statistical model of connectivity parameters. We built a PEB model to partition the variability in connectivity parameters across subjects into hypothesized group-level effects and uninteresting between-subject variability. Two covariates were specified (overall group mean and between-group difference) in the design matrix. The parameters of the PEB model are estimated using the standard variational Laplace procedures at second-level. Then, Bayesian model reduction was used to automatically search over the reduced models (Friston et al., 2016). Bayesian model averaging was performed on the second-level PEB model to investigate which the direction of connection best described the between-group differences (HC vs SB, HC vs MB, and SB vs MB separately). Under the PEB framework, parameters best describing between-group effects were reported not in terms of p value but instead in terms of posterior probability (PP) (Zeidman et al., 2019). We applied a more rigid threshold of PP values > 0.95, indicating strong evidence for group differences in effective connectivity.
Statistical analysesA χ2 test was conducted to test group differences in sex. A parametric analysis of linear regression was applied to test the demographic characteristics and behavioral differences across three groups, with age, sex, and BMI as covariates. Given the different sample sizes across three groups, we additionally used a nonparametric Kruskal-Wallis analysis to determine whether the results of parametric analyses could be replicated. These two methods showed similar results (see supplementary material 3). For all tasks, trials with errors and trials with RTs more than 3 standard deviations above or less than –3 standard deviations below were discarded to reduce the influence of outliers. Moreover, we tested the Pearson's correlation between behavioral task performance and symptoms (i.e., the Z scores of episodes times of binge eating and compensatory behaviors) in the bulimic population by combining SB and MB groups. The rank-based inverse normal transformation (Soloman et al., 2009) was applied for behavioral tasks to meet normal distribution. Sex, age and BMI were included as covariates.
A generalized linear model was used to examine the differences in mOFC- and lOFC-based FC values based on their z-maps across three groups, which was implemented in the CONN toolbox (https://web.conn-toolbox.org). The random field theory was used for multiple comparisons correction (a voxel height threshold of p < 0.001, and the false discovery rate (FDR)-corrected cluster-size threshold of p < 0.05), which could appropriately control the family-wise error rate and improve the reliability of results (Worsley et al., 1996). To assess the effects of possible confounding factors, we controlled for the effects of age, sex, BMI and head motion.
Based on the FC results, we further used spDCM approach to further examine the directionality of FC, with statistical significance set at PP values > 0.95 (see 2.6. Effective connectivity for more details).
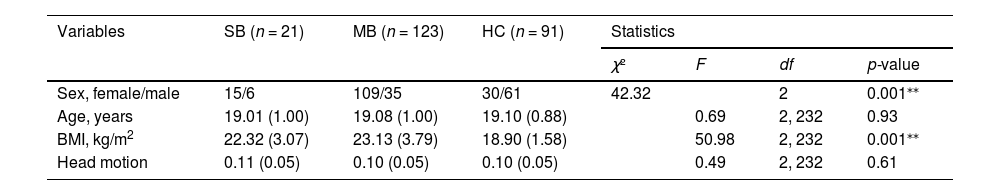
ResultsDemographic and behavioral resultsDemographic characteristics and results of behavioral tasks are presented in Table 1 and Table S1, respectively. No group differences were observed in age and head motion. Sex was significantly different across three groups (χ(1)2= 42.32, p < 0.001), consistent with the notion that dysregulated eating is more prevalent in women than in men (Galmiche et al., 2019). SB and MB groups had significantly higher BMI than HC (F(2, 234) = 50.98, p = 0.001). To avoid differences in age, sex and BMI, we included them as covariates in subsequent analysis. In addition, SB and MB groups had significantly higher NPS scores than HC (F(2, 229) = 19.93, p = 0.001).
Demographic characteristics of the samples.
| Variables | SB (n = 21) | MB (n = 123) | HC (n = 91) | Statistics | |||
|---|---|---|---|---|---|---|---|
| χ² | F | df | p-value | ||||
| Sex, female/male | 15/6 | 109/35 | 30/61 | 42.32 | 2 | 0.001⁎⁎ | |
| Age, years | 19.01 (1.00) | 19.08 (1.00) | 19.10 (0.88) | 0.69 | 2, 232 | 0.93 | |
| BMI, kg/m2 | 22.32 (3.07) | 23.13 (3.79) | 18.90 (1.58) | 50.98 | 2, 232 | 0.001⁎⁎ | |
| Head motion | 0.11 (0.05) | 0.10 (0.05) | 0.10 (0.05) | 0.49 | 2, 232 | 0.61 | |
Notes: Variables are expressed as mean (standard deviation), or n/n, as appropriate.
*p < 0.05;
In the Stroop task, the Stroop effect of low-calorie word on HF image was greater in SB and MB groups (F(2, 229) = 3.52, p = 0.03) than in HC. In the go/no-go task, SB group showed higher LF (F(2, 229) = 7.47, p < 0.001) and HF (F(2, 229) = 6.71, p < 0.001) commission errors, compared to MB and HC. In tasks related to reward processing, there were no significant differences in food vigilance and reward sensitivity across three groups. Correlational analyses further indicated that binge eating frequency and compensatory behaviors in the bulimic population were both positively associated with HF and LF commission error. Compensatory behaviors were positively associated with NPS and HF reward sensitivity (see supplementary material 4 for details).
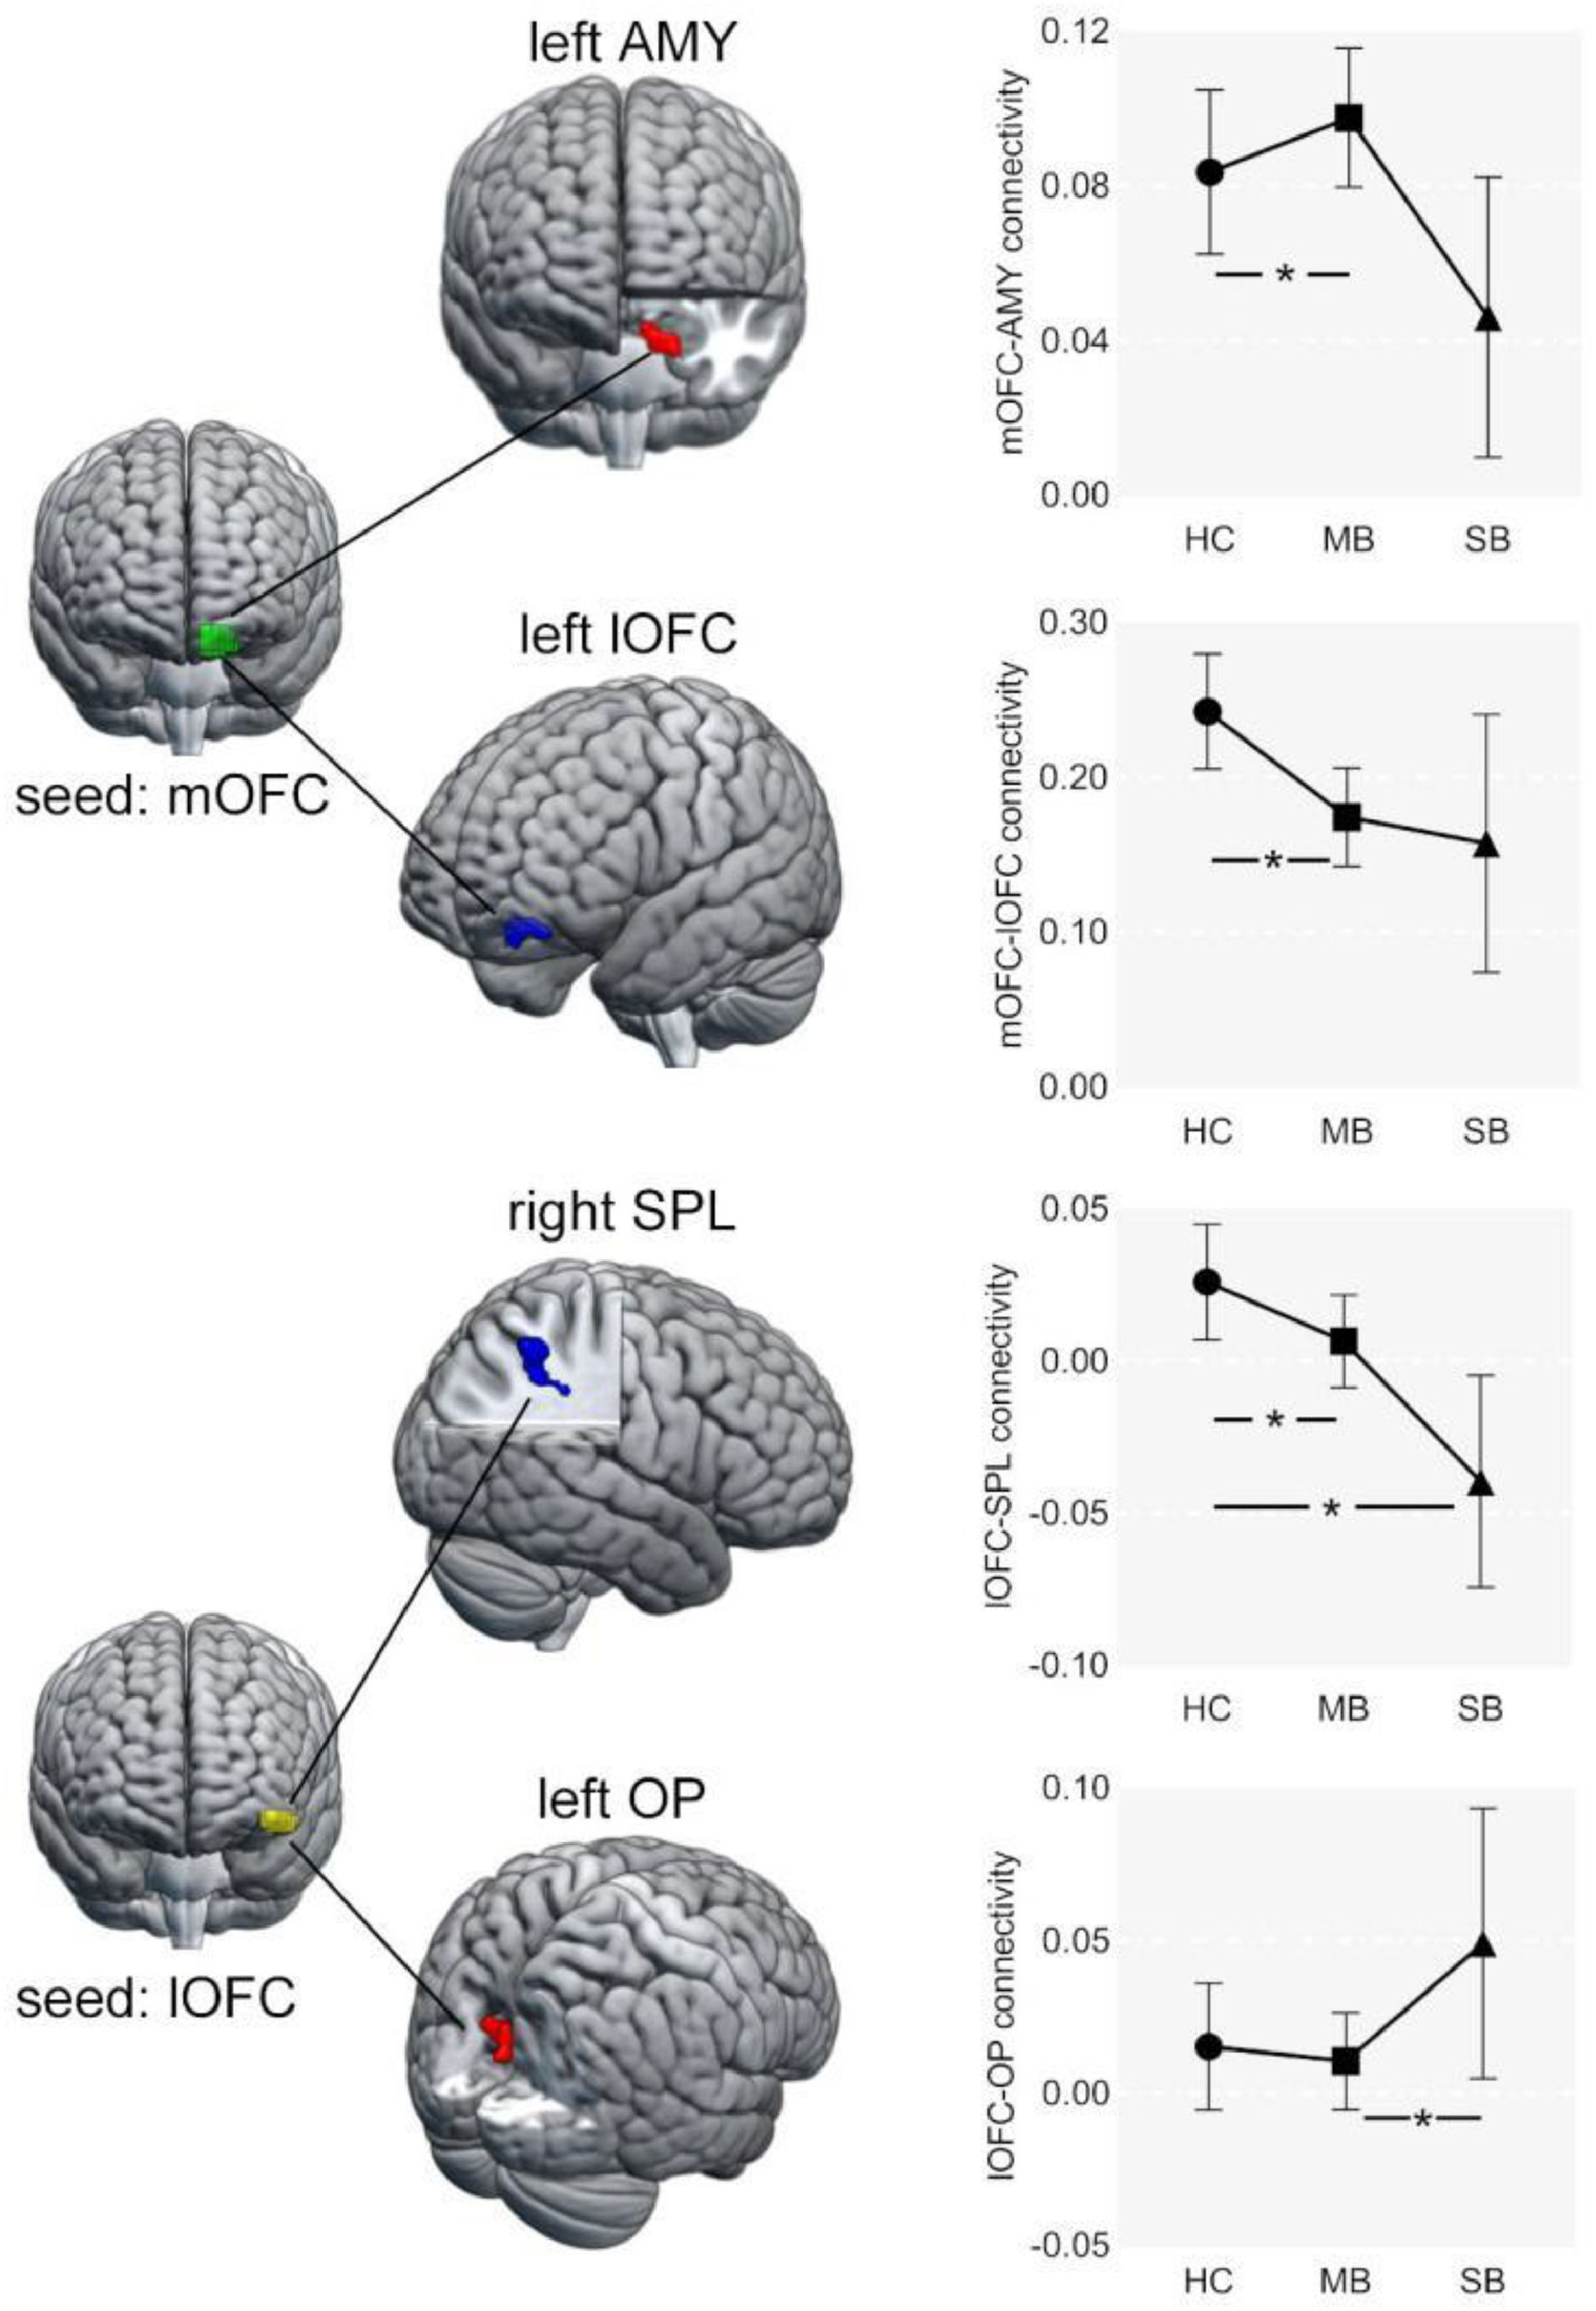
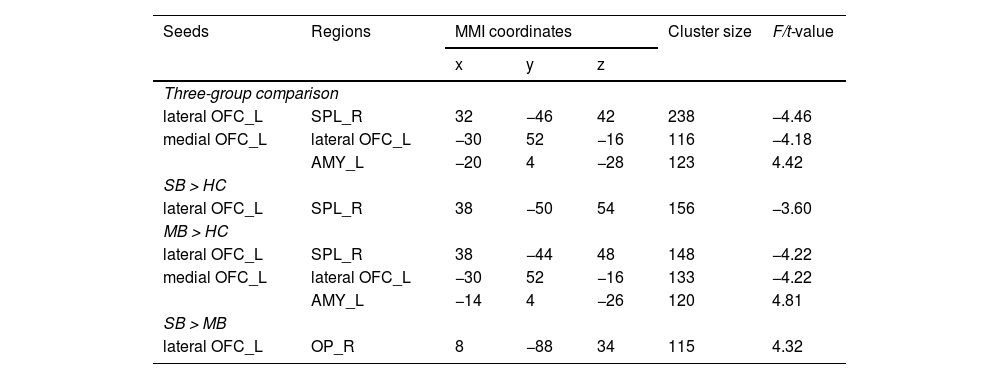
Seed-based functional connectivity analysisThere were significant differences in the FC between lOFC and superior parietal lobule (SPL), and the FC of mOFC with amygdala and lOFC across three groups (Table 2 and Fig. 2). The specific results between two groups are shown below.
Altered resting-state functional connectivity of lateral and medial OFC across three groups.
Notes: Statistical significance was set at a voxel height threshold of p < 0.001, and the cluster-size threshold of p < 0.05 false discovery rate (FDR) corrected. Covariates included sex, age, BMI, and head motion.
Abbreviation: SB = severe bulimic group; MB = mild bulimic group; HC = healthy controls; OFC = orbitofrontal cortex; SPL = superior parietal lobe; AMY = amygdala; OP = occipital pole; L = left; R = right; MNI = Montreal Neurological Institute.

Compared to HC, the FC between left lOFC and right SPL was significantly lower in the SB group (Fig. 2B).
Abnormal FC in MB group (MB vs. HC)Relative to HC, the FC between left lOFC and right SPL was also significantly lower in the MB group. In addition, the FC between left mOFC and left lOFC was lower, while the FC between left mOFC and left amygdala was higher in MB group (Fig. 2A).
Abnormal FC between SB and MB groups (SB vs. MB)The SB group had higher strength in FC between left lOFC and right occipital pole (OP) than the MB group (Fig. 2C).
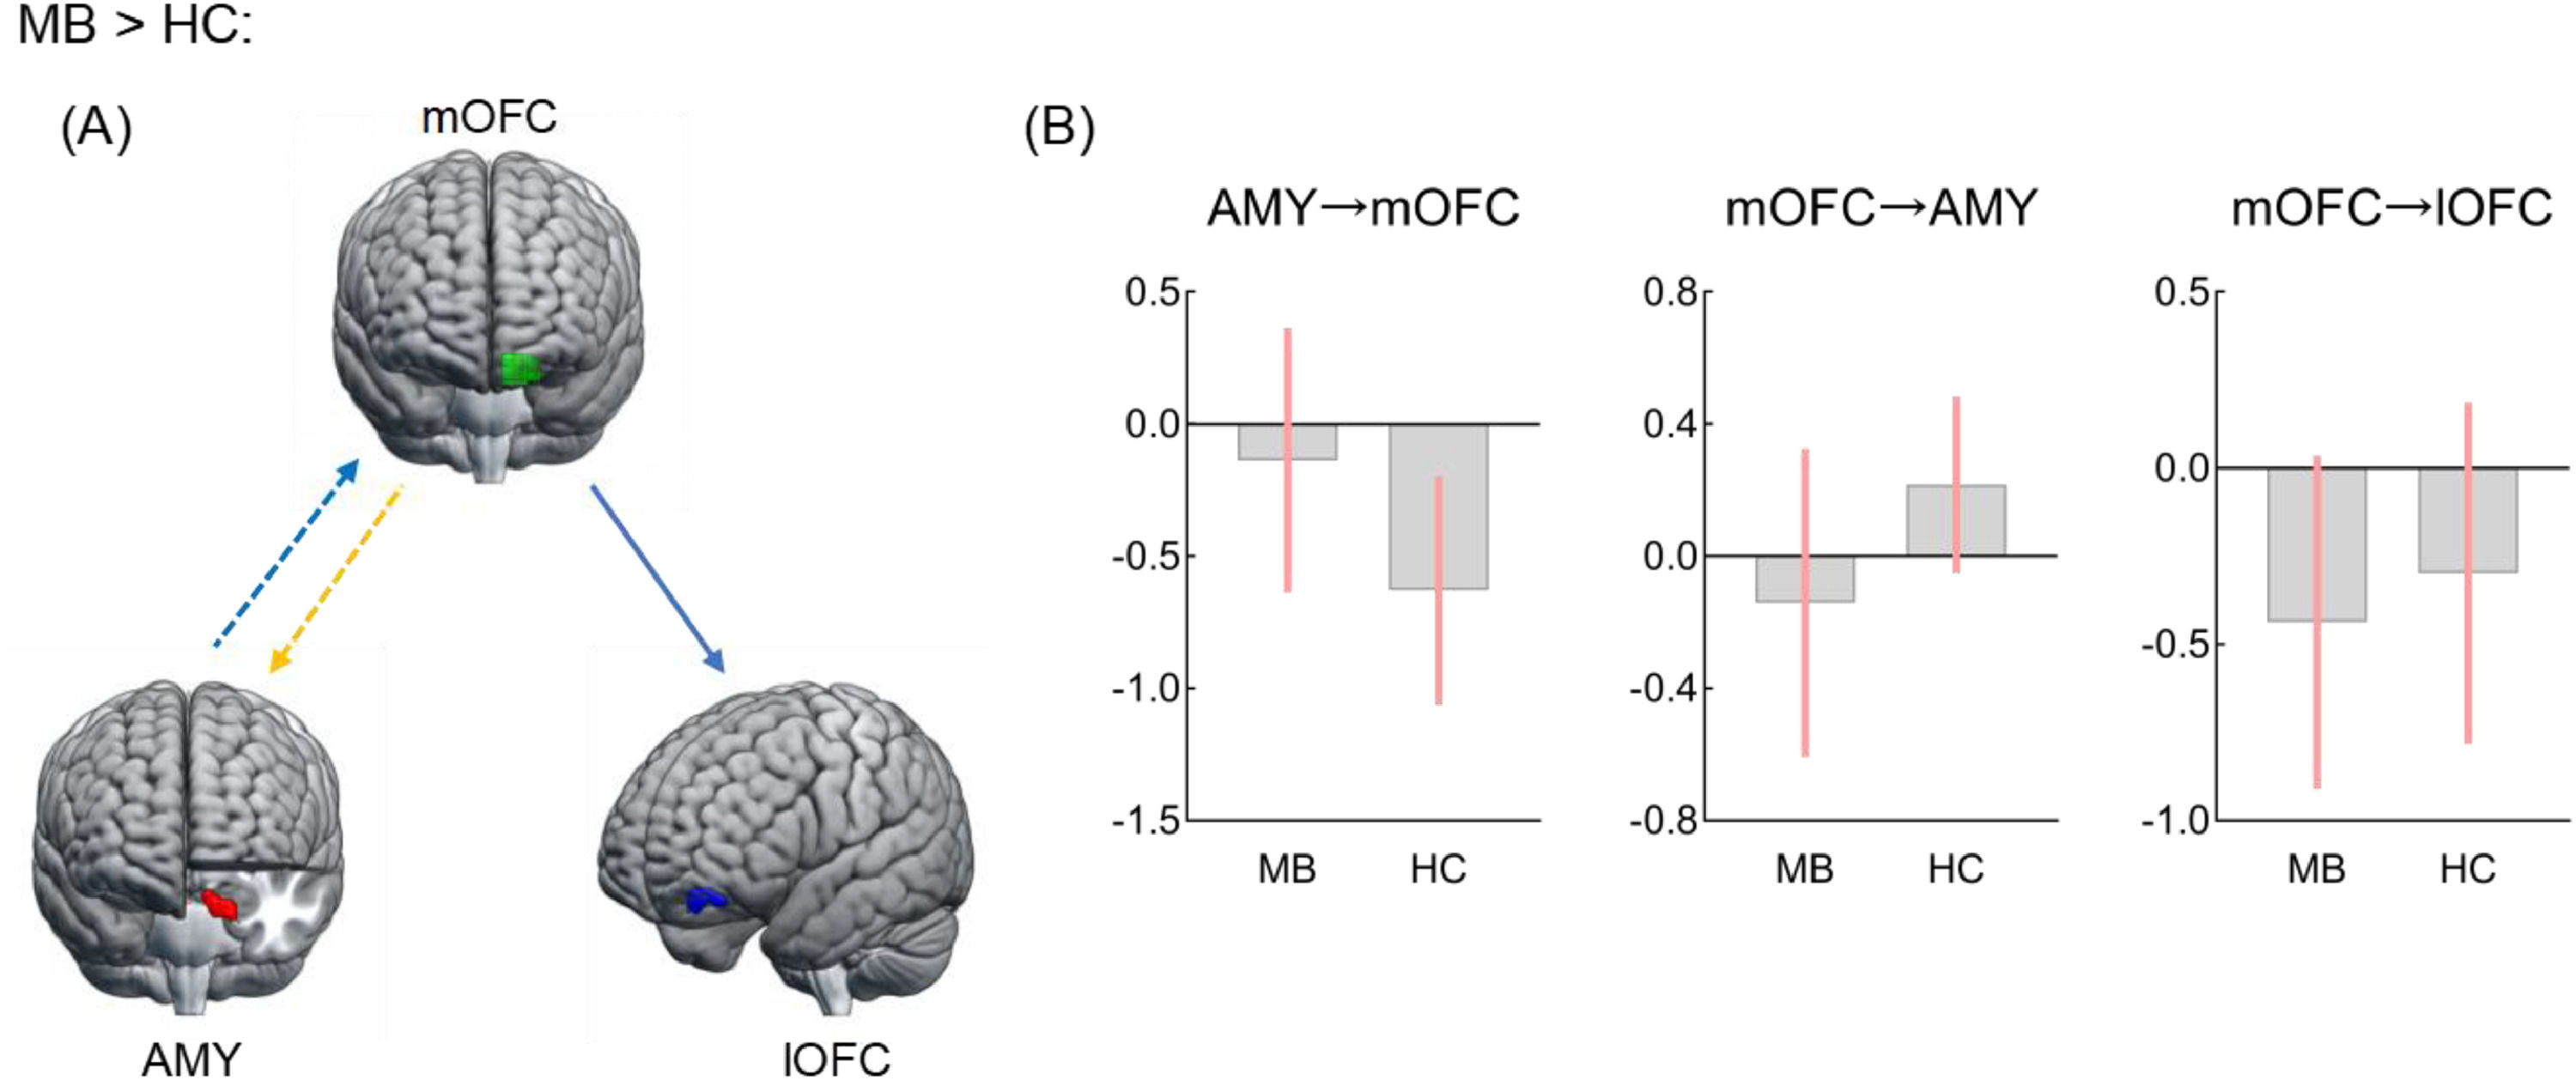
Effective connectivity analysisRelative to HC, the MB group showed lower excitatory effect from the left mOFC to the left amygdala, lower inhibitory effect from the left amygdala to the left mOFC, and greater inhibitory effect from the left mOFC to the left lOFC (Fig. 3). There were, however, no significant directional differences in the lOFC-SPL connectivity between SB and HC and in the lOFCOP connectivity of between SB and MB groups.

Effective connectivity seeded from medial OFC between MB and HC groups.
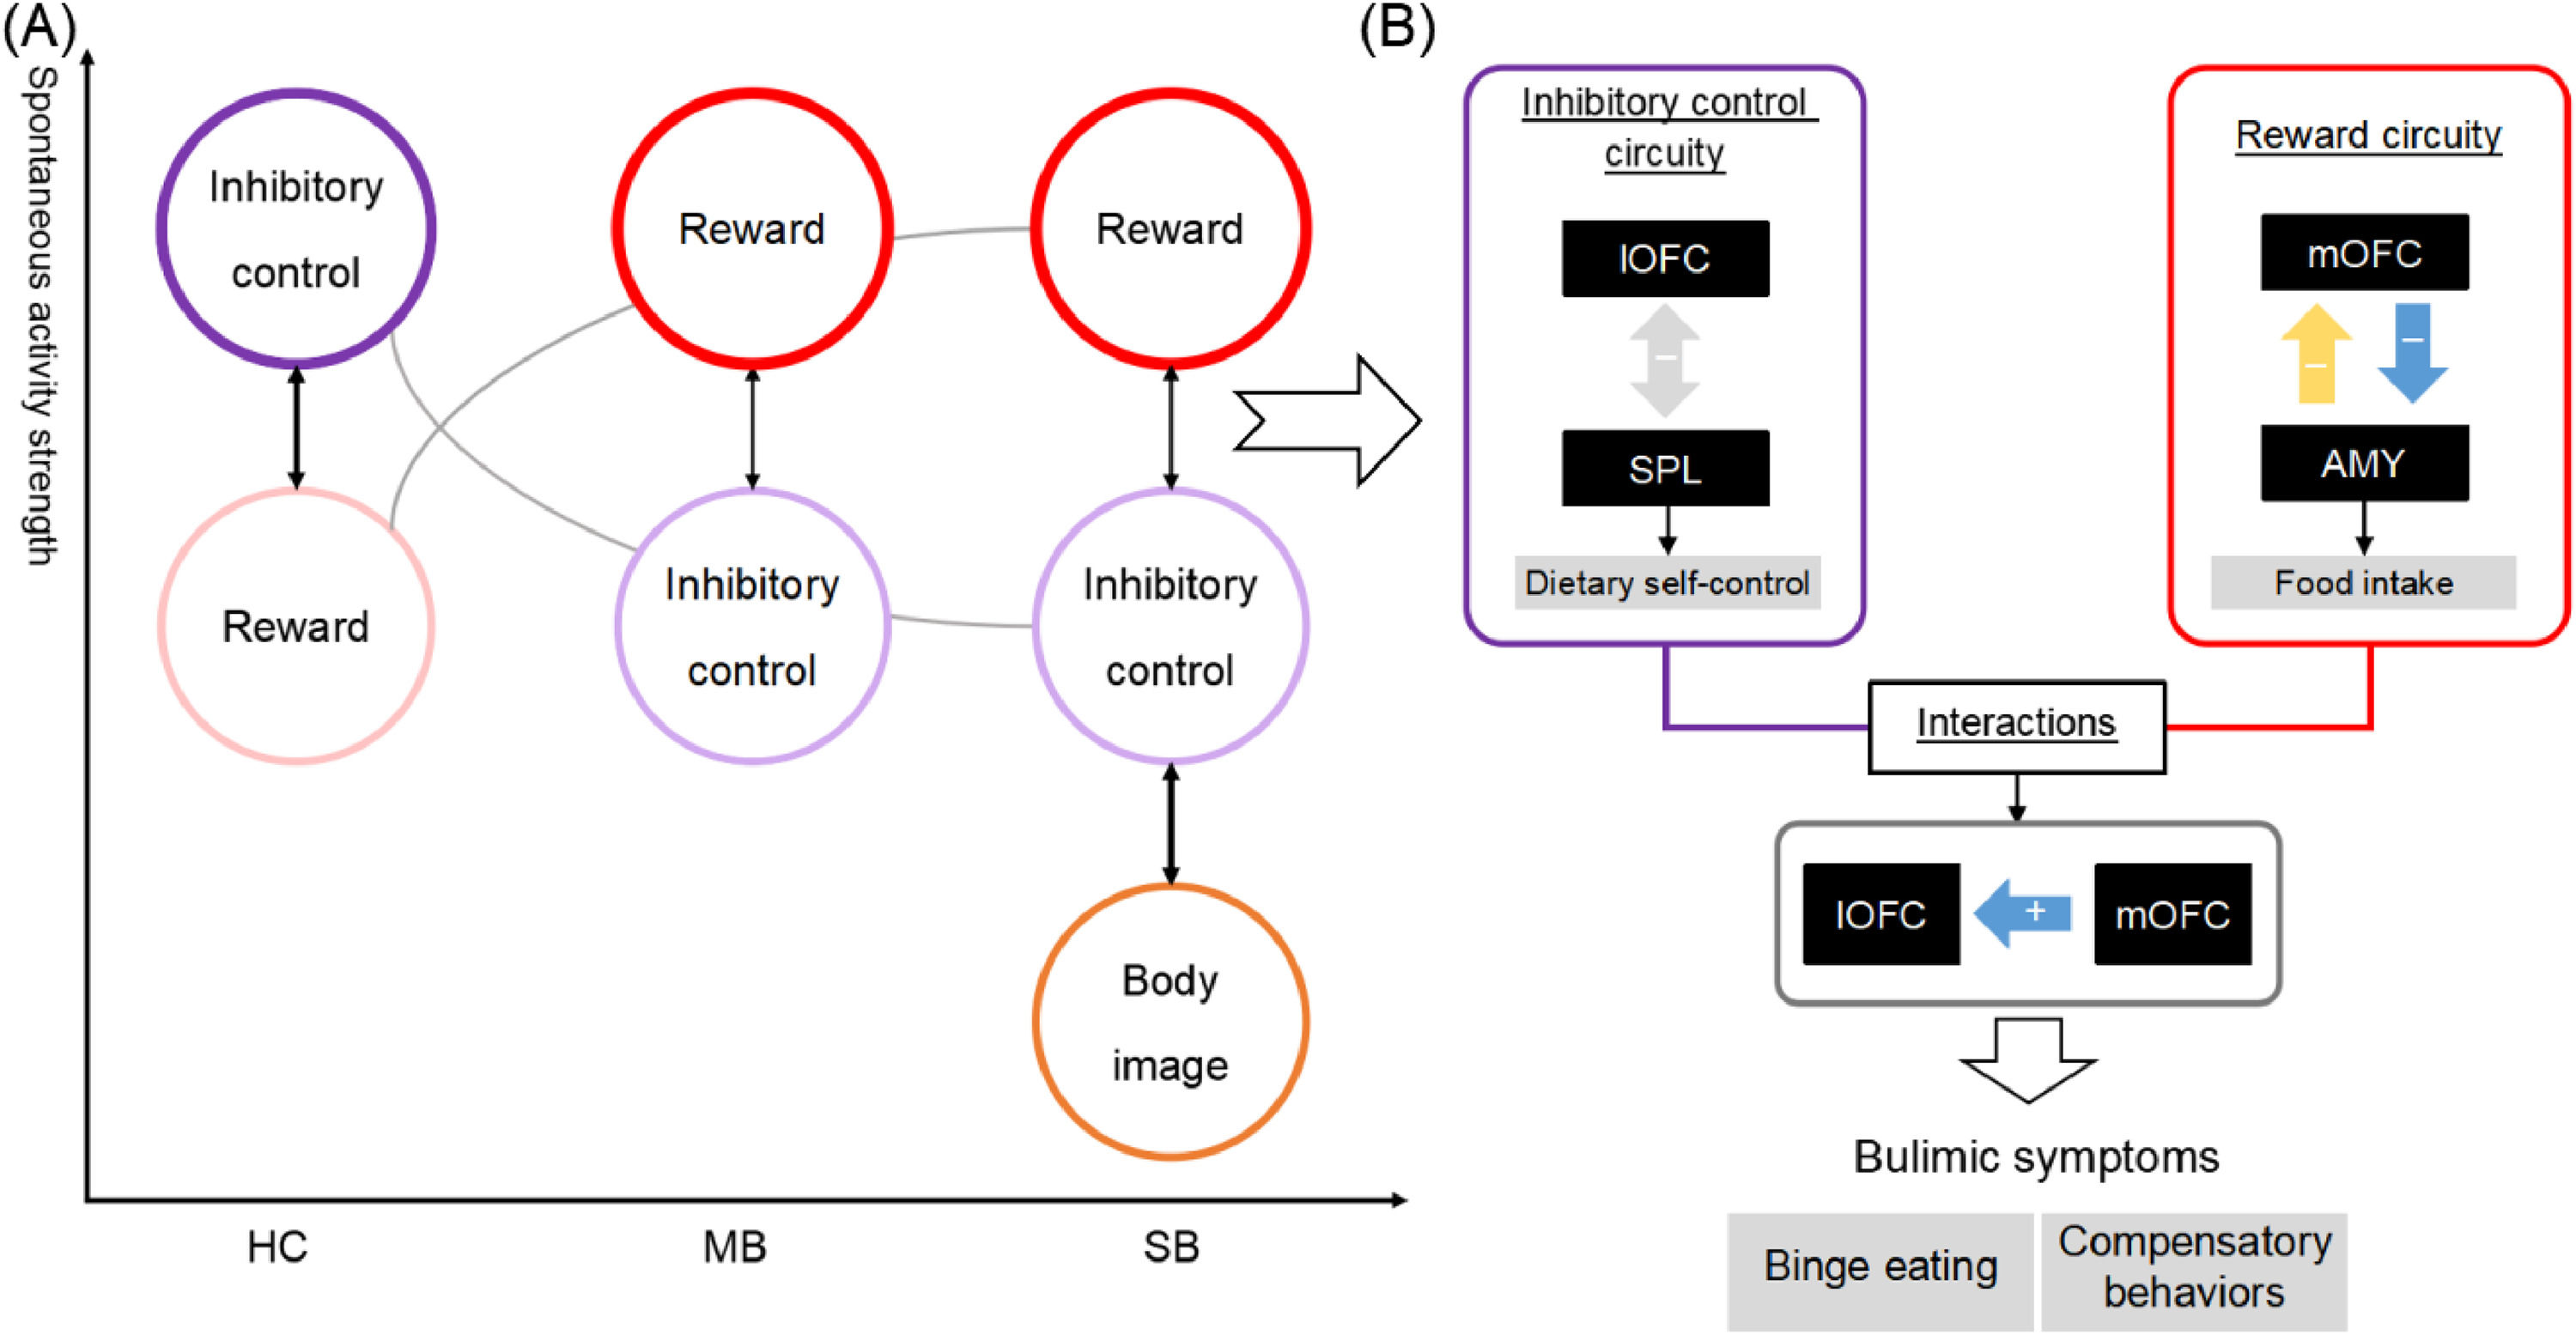
Given that the functional heterogeneity of OFC subregions were closely associated with bulimic symptoms, this study utilized FC and EC approaches to identify the divergent neural patterns in the lOFC and mOFC in individuals with SB and MB. There were three principal findings (see Fig. 4 for an overview of the results). First, SB and MB groups showed diminished functional synchrony in inhibitory control circuity (i.e., the lOFC-SPL connectivity), along with an impairment of this capacity. Second, SB group displayed greater lOFCOP connectivity than MB group, suggesting the specificity of the neural basis of full-threshold/severe bulimia. Lastly, the MB group showed abnormal directed links from the mOFC to lOFC and amygdala that could further explain the aberrant interactions of reward sensitivity with inhibitory control and homeostatic energy in sub-threshold/mild condition. The current study provides crucial insight into bulimic pathophysiology and highlights a potential neural target for the prevention and treatment of eating disorder symptoms.

An overview of the results.
The Stroop effect of low-calorie words on HF images was greater in the SB and MB groups than in the HC group. This finding suggested that bulimic-type individuals are more likely to experience a stronger conflict between tempting food intake and caloric control, which relates to an interplay between reward and inhibitory control systems (Brooks et al., 2011; Kollei et al., 2022). In the go/no-go task, the SB group showed higher LF and HF commission errors than MB and HC, indicating an impaired capability to resist behavioral responses towards food in SB adults (Berner et al., 2022). However, behavioral data of reward-related tasks found no significant group differences, consistent with previous clinical findings (Knutson et al., 2008; Simon et al., 2016), which may be related to insensitive reward tasks.
Differences in functional connectivityCommon alteration in functional connectivity in SB and MB groupsThe finding that the SB and MB groups both showed lower lOFC-SPL connectivity strength than HC is in accordance with the results of a previous resting-state fMRI study (Wang et al., 2022). As crucial hubs of the frontoparietal network, the lOFC and SPL have been implicated in initiating and modulating cognitive control abilities, such as the downregulation of inhibition and reappraisal of food carving (Hollmann et al., 2012; Siep et al., 2012; Zanto & Gazzaley 2013). Evidence from task-evoked fMRI indicated that BN patients showed reduced activation in these areas when responding to food stimuli (Uher et al., 2004). Furthermore, it has been suggested that unsuccessful restrained eaters (i.e., eating more after dieting) exhibited diminished FC within the frontoparietal network compared to their successful counterparts (Zhang et al., 2021). The current result suggested that hypoconnectivity in the frontoparietal circuit that underlies deficits in food-related inhibitory control (as also reflected by our behavioral tasks results) may play a key role in the origin and persistence of bulimia (Brooks et al., 2012; Friederich et al., 2013).
Divergent functional connectivity between SB and MB groupsRelative to the MB group, the SB group showed higher strength in the lOFCOP connectivity, which is involved in the perception of the human body (Downing et al., 2001). In healthy women, the frontal and occipital cortices were activated to involve in a realistic body perception while viewing their distorted bodies pictures, but such brain response was not observed in women with BN (Mohr et al., 2011). Also, impaired fronto-occipital white matter pathways may contribute to body image distribution in BN patients (Mettler et al., 2013). Therefore, we speculated that the greater lOFCOP connectivity strength could serve as a neural basis for SB by intensifying abnormal interactions between the inhibition and body perception regions. In other words, more severe symptoms (compared to MB) may have potential impacts on the information exchange between inhibitory control and primary visual regions (more than just the inhibitory control circuit). This unique neuroimaging feature might be able to distinguish individuals with mild and severe symptoms and predict the transformation of bulimic states. Since comparative research on the unique neural basis of different severity of bulimic is lacking, this finding should be interpreted with caution and warrants further investigation.
Altered functional connectivity only in MB groupWe found a greater mOFC-amygdala connectivity strength in the MB group than in the HC group. It is known that the mOFC and amygdala are core components of reward limbic regions, wherein the amygdala drives dopamine activation and energy homeostasis, while the mOFC processes food-related information such as taste and smell (Pauli et al., 2012; Rolls, 2015). The regulation of food consumption relies on the interaction between the mOFC and amygdala (Lichtenberg et al., 2017; Volkow et al., 2011). During the receipt of food rewards, BN patients exhibited increased activity and aberrant structural connectivity in these two regions (Bohon & Stice, 2012; Frank et al., 2016; Simon et al., 2016). Furthermore, studies involving obese women have reported that stronger FC in this circuitry may alter internal feedback mechanisms in response to food, leading to an inability to terminate food intake during physiological satiety (Duan et al., 2020). Thus, the higher functional synchrony between the mOFC and amygdala may be fundamental to the disrupting food intake and energy homeostasis in adults with mild bulimic symptoms. In addition, we observed that the strength of the mOFC-lOFC connectivity was weaker in the MB group than in the HC group. The resting-state FC of OFC is linked to food rewards (Rolls, 2021). An increasing number of studies have demonstrated that the mOFC is involved in reward processing, while the lOFC is responsible for inhibitory control (Friedman & Robbins, 2022; Kringelbach & Rolls, 2004). During the response to food reward, BN patients showed converse activity pattern in OFC subregions, with hyperactivation in the mOFC and hypoactivation in the lOFC (Frank et al., 2011; Uher et al., 2004). It is plausible that the weakened mOFC-lOFC connectivity in the MB group points toward a possible disequilibrium between cognitive control and reward processes, which has been repeatedly demonstrated in previous eating studies (Chen et al., 2021; Friederich et al., 2013; Haynos et al., 2021).
Differences in effective connectivityAltered effective connectivity only in MB groupInterestingly, we found that the MB group exhibited a greater inhibitory effect from the mOFC to lOFC relative to HC. As mentioned above, the mOFC and lOFC involved in heterogeneous functions of reward valuation and inhibition control, respectively. Previous meta-analytic review study concluded that there was co-activation between the mOFC and lOFC in healthy adults (Zald et al., 2014); whereas, BN patients showed an opposite activation mode of the two OFC subregions in response to food stimuli (Simon et al., 2016; Uher et al., 2004). In addition, the greater surface area of the lOFC could more reliably predict healthy food consumption than that of the mOFC in adolescents (Hall et al., 2023). Hence, the EC findings expand previous studies by identifying that greater inhibitory effect from reward regions (i.e., mOFC) to control regions (i.e., lOFC) may be linked to an altered balance of reward and inhibitory processing, thus facilitating unhealthy food intake in MB individuals.
Notably, the potential EC may play a key role in the FC (Friston et al., 2014; Razi et al., 2015). Given that little is known about the directionality between key regions in individuals with bulimic symptoms, we further examined group differences in EC based on the FC results. In our MB group, there was lower excitation of the mOFC over the amygdala and lower inhibition of the amygdala over the mOFC, compared to HC. Such diminished bidirectional effects in regions involved in food consumption and energy homeostasis might further demonstrate that MB is insufficient to modulate in homeostatic energy at rest. Besides modulating energy homeostasis, projections from the amygdala to the mOFC are associated with modifying goal-directed behaviors according to reward outcomes (Lichtenberg et al., 2017; Voigt et al., 2021). Previous evidence showed that disrupted EC within the circuitry of energy homeostasis and food reward processing is fundamentally different between BN and controls during sweet taste stimulation, possibly linked to worse reversal learning (Frank et al., 2016). Therefore, the declined bidirectional effects in the mOFC-amygdala connectivity might indicate the insensitivity to homeostatic energy changes and an inflexible behavioral pattern towards food in individuals with MB.
Limitations and future directionsThis study has some potential limitations. First, compared to the other two groups, the number of participants in the SB group was relatively small, owing to the lower prevalence of SB (Galmiche et al., 2019). Multi-center BN data could be gathered in future research to avoid the potential influence of a small sample size. In addition, although the rigorous DSM-5 criteria were used to select SB and MB, the diagnosis was not confirmed by a clinician and based on self-report scale, which may tend to be over-reported their binge frequency. Thus, it should be cautious to generalize our findings to clinical patients. Second, we attempted to investigate the neural differences between individuals with severe and mild bulimic symptoms, expanding the psychopathology of the spectrum of eating disorder symptoms. However, since it was not a longitudinal investigation, it is still unclear whether neural activity precedes BN, develops BN, or is a consequence of BN, which warrants prospective longitudinal studies addressing these questions. Third, feelings of hunger were not reported by the participants before the imaging scan, which should be considered in future studies. In addition, we found that reward regions might suppress the activity of inhibitory control areas at rest. However, the interaction between the reward and inhibitory systems might be modulated by different situations, including temptation and caloric control scenarios (Hofmann et al., 2008). Future research can adopt some more ecological approaches to explore which of the two systems will dominate when bulimic-type individuals is in different scenarios.
ConclusionThis is the first attempt to combine FC and EC methods to identify the underlying neural patterns of OFC subregions across individuals with SB and MB at rest. Three principal findings are as follows. First, impaired functional synchrony of the inhibitory control circuity was a shared neural basis for both MB and SB. Second, the disrupted interaction between the inhibitory and body perception regions might act as a biomarker distinguishing individuals with MB and SB. Lastly, the directional links from the mOFC to lOFC and amygdala could further explain the altered interactions of reward sensitivity with inhibitory control and homeostatic energy in sub-threshold condition. The current study provides novel evidence that divergent connectivity patterns of the lOFC and mOFC may contribute to different severities of bulimic symptoms, which may contribute to the prevention and treatment of bulimic symptomatology.
Compliance with ethical standardsThe research protocol was reviewed for compliance with the standards for the ethical treatment of human participants and approved by the Ethical Committee for Scientific Research at the university with which the authors are affiliated.
Research involving human participantsAll ethical guidelines for human subjects’ research were followed.
Informed consentAll participants provided written informed consents to participate in the study.
FundingThis study was funded by National Social Science Foundation of China (No. 22&ZD184).
This study was funded by National Social Science Foundation of China (No. 22&ZD184). We would like to thank all the members of the Self and Health Research Lab, Southwest University for their invaluable help in data acquisition. We would also like to thank the Editage (www.editage.cn) for English language editing.
