


Limited screening and delays in diagnosis and linkage-to-care are barriers for hepatitis C virus (HCV) elimination. The LiverTAI study focused on patients tested for HCV using AI technologies to describe their demographic and clinical characteristics and pre-testing patient journeys, reflecting clinical practice in hospitals.
Patients and methodsLiverTAI is a retrospective, secondary analysis of electronic health records (EHRs) from 6 tertiary Spanish hospitals, extracting unstructured clinical data using natural language processing (NLP) EHRead® technology. Adult subjects with an HCV testing procedure from January 2014 to December 2018 were grouped according to HCV seropositivity and viremia.
ResultsFrom 2,440,358 patients, 16,261 patients were tested for HCV (13,602 [83.6%] HCV seronegative; 2659 [16.4%] seropositive). Active HCV viremia appeared in 37.7% (n=1003) of patients, 18.6% (n=494) had negative viremia, and 43.7% (n=1162) unknown viremia. Patient journeys showed core departments (Gastroenterology, Internal Medicine, and Infectious Disease) and others including Emergency perform ample HCV testing in Spanish hospitals, whereas Medical Oncology lags. Patients were PCR-tested and genotyped significantly faster in core departments (p<.001).
ConclusionsOur results highlight hospital departments responsible for HCV testing. However, further testing was sub-optimal during the study period. Therefore, we underscore the need for HCV screening and reflex testing to accelerate diagnosis and linkage-to-care.
El cribado limitado, los retrasos diagnósticos y la vinculación a la atención sanitaria son obstáculos para la eliminación del virus de la hepatitis C (VHC). El estudio LiverTAI se centró en analizar pacientes testeados para VHC mediante tecnologías de IA para describir sus características demográficas, clínicas y los recorridos de los pacientes antes del test, reflejando la práctica clínica en los hospitales.
Pacientes y métodosLiverTAI es un análisis retrospectivo y secundario de las historias clínicas electrónicas (HCE) de 6 hospitales españoles de tercer nivel, en el que se extraen datos clínicos no estructurados mediante la tecnología EHRead® de procesamiento del lenguaje natural (PLN). Los sujetos adultos con un test de VHC desde enero de 2014 hasta diciembre de 2018 se agruparon según la seropositividad y la viremia del VHC.
ResultadosDe 2.440.358 pacientes, 16.261 fueron testeados para VHC (13.602 [83,6%] seronegativos al VHC; 2.659 [16,4%] seropositivos). La viremia activa del VHC apareció en el 37,7% (n=1.003) de los pacientes, el 18,6% (n=494) mostró viremia negativa y el 43,7% (n=1.162), viremia desconocida. Los recorridos de los pacientes mostraron que los departamentos core (gastroenterología, medicina interna y enfermedades infecciosas) y otros, incluyendo urgencias, realizan numerosos test de VHC en los hospitales españoles, mientras que oncología médica se queda atrás. Los pacientes fueron sometidos a la prueba de la PCR y el genotipo significativamente más rápido en los departamentos core (p<0,001).
ConclusionesNuestros resultados destacan los departamentos hospitalarios responsables de realizar test de VHC mediante pruebas serológicas. Sin embargo, las pruebas posteriores (PCR, genotipado) experimentaban retrasos durante el periodo de estudio. Por lo tanto, subrayamos la necesidad de realizar el cribado del VHC y de diagnóstico en un solo paso para acelerar el diagnóstico y la vinculación a la atención sanitaria.
Hepatitis C virus (HCV) is one of the major global causes of death and morbidity.1 The global prevalence of individuals infected with HCV in 2019 was estimated by the World Health Organization (WHO) at 0.75% of the population, which corresponds to approximately 58 million people.2,3 Even though the prevalence of HCV infection shows considerable variation across the globe, countries with a past or present history of iatrogenic infections (that is, infections due to the activity of a physician or medical therapy) show the highest infection rates. In this context, the WHO developed the Global Health Sector Strategy (2016–2021), aiming to eliminate viral hepatitis as a significant public health threat by 2030.3,4 Of note, recent updates show Spain as the second closest worldwide toward achieving this goal.5
HCV is primarily transmitted through percutaneous exposure to blood, owing to medical procedures or sharing contaminated devices for injection drug use. Additionally, mother-to-infant transmission and sexual transmission also occur but are less common.3,4 HCV infection is a slowly progressive disease, often associated with end-stage liver disease, liver cirrhosis, and hepatocellular carcinoma.6 Epidemiological studies show an association between HCV and several extrahepatic manifestations, including insulin resistance, type 2 diabetes mellitus, glomerulopathies, non-Hodgkin lymphomas (NHL), cardiovascular disease, and neurological and psychiatric manifestations.7
Due to this disease's silent course, a substantial proportion of patients are undiagnosed and hence unaware of their viral infection.2,8 Although the development of oral direct-acting antiviral (DAAs) agents has changed the HCV field dramatically by showing high cure rates, only diagnosed patients can benefit from these therapies.6 Indeed, one of the main objectives of the Spanish strategic national and regional plans for HCV elimination since 2019 is to promote early diagnosis.9,10 Though efforts are ongoing, it has been estimated that less than 25% of viremic infections in 2020 were diagnosed, and fewer than 10% were initiated on treatment.2 Therefore, implementing targeted testing to detect HCV-infected patients through hospital-wide efforts is crucial to treat infected patients in a timely manner. The strategy could include HCV screening in diverse hospital departments prior to any surgery, oncological intervention, or treatment with biologics.
Since 2015–2017, which falls within the study period encompassed in this work (2014–2018), several novel approaches to HCV testing and treatment have been implemented. The proportion of Spanish hospitals that apply reflex testing, in which the same biological sample is used for HCV antibody and RNA detection, increased from 31% to 89% from 2017 to 2019.11,12 Unfortunately, the COVID-19 pandemic has had a negative impact on the progress of reflex testing implementation.13 The use of DAAs was introduced in 2015, extending to pangenotypic options a few years later, which precludes genotyping and potentially reduces the time to full HCV diagnosis.14
The analysis of vast amounts of real-world data (RWD) holds great potential to determine the number of hospital patients being tested for HCV in different hospital areas and their linkage to care. The information in patients’ electronic health records (EHRs) represents an important source of RWD; particularly, recent studies have highlighted the value of the unstructured clinical notes in EHRs to describe patients’ clinical characteristics, management, and journey within the hospital.15–25 By applying natural language processing (NLP) and machine learning to EHRs of hospital patients tested for HCV using the previously validated EHRead® technology,15–25 we detected the pre-testing patient journey and linkage to care, conveying a real-world snapshot of HCV testing and viremia status within different hospital departments.
Patients and methodsData sourceThis study was based on the secondary use of data captured in the EHRs of 6 third-level hospitals within the Spanish National Healthcare Network, namely: Hospital Universitario de Fuenlabrada (Madrid), Hospital Universitario y Politécnico La Fe (Valencia), Hospital Universitario Puerta de Hierro (Madrid), Hospital Universitario Infanta Sofía (Madrid), Hospital del Río Hortega (Valladolid), and Hospital de la Santa Creu i Sant Pau (Barcelona). The data source was free-text information in EHRs, including outpatient clinic reports, discharge reports, emergency reports, and other medical reports. Structured data from hospital pharmacy, microbiology, radiology, and elastography reports were not fully available for all sites and were therefore not included in the data set. Data were collected between January 1, 2014, and December 31, 2018 (study period) from all available services and departments in each participating site.
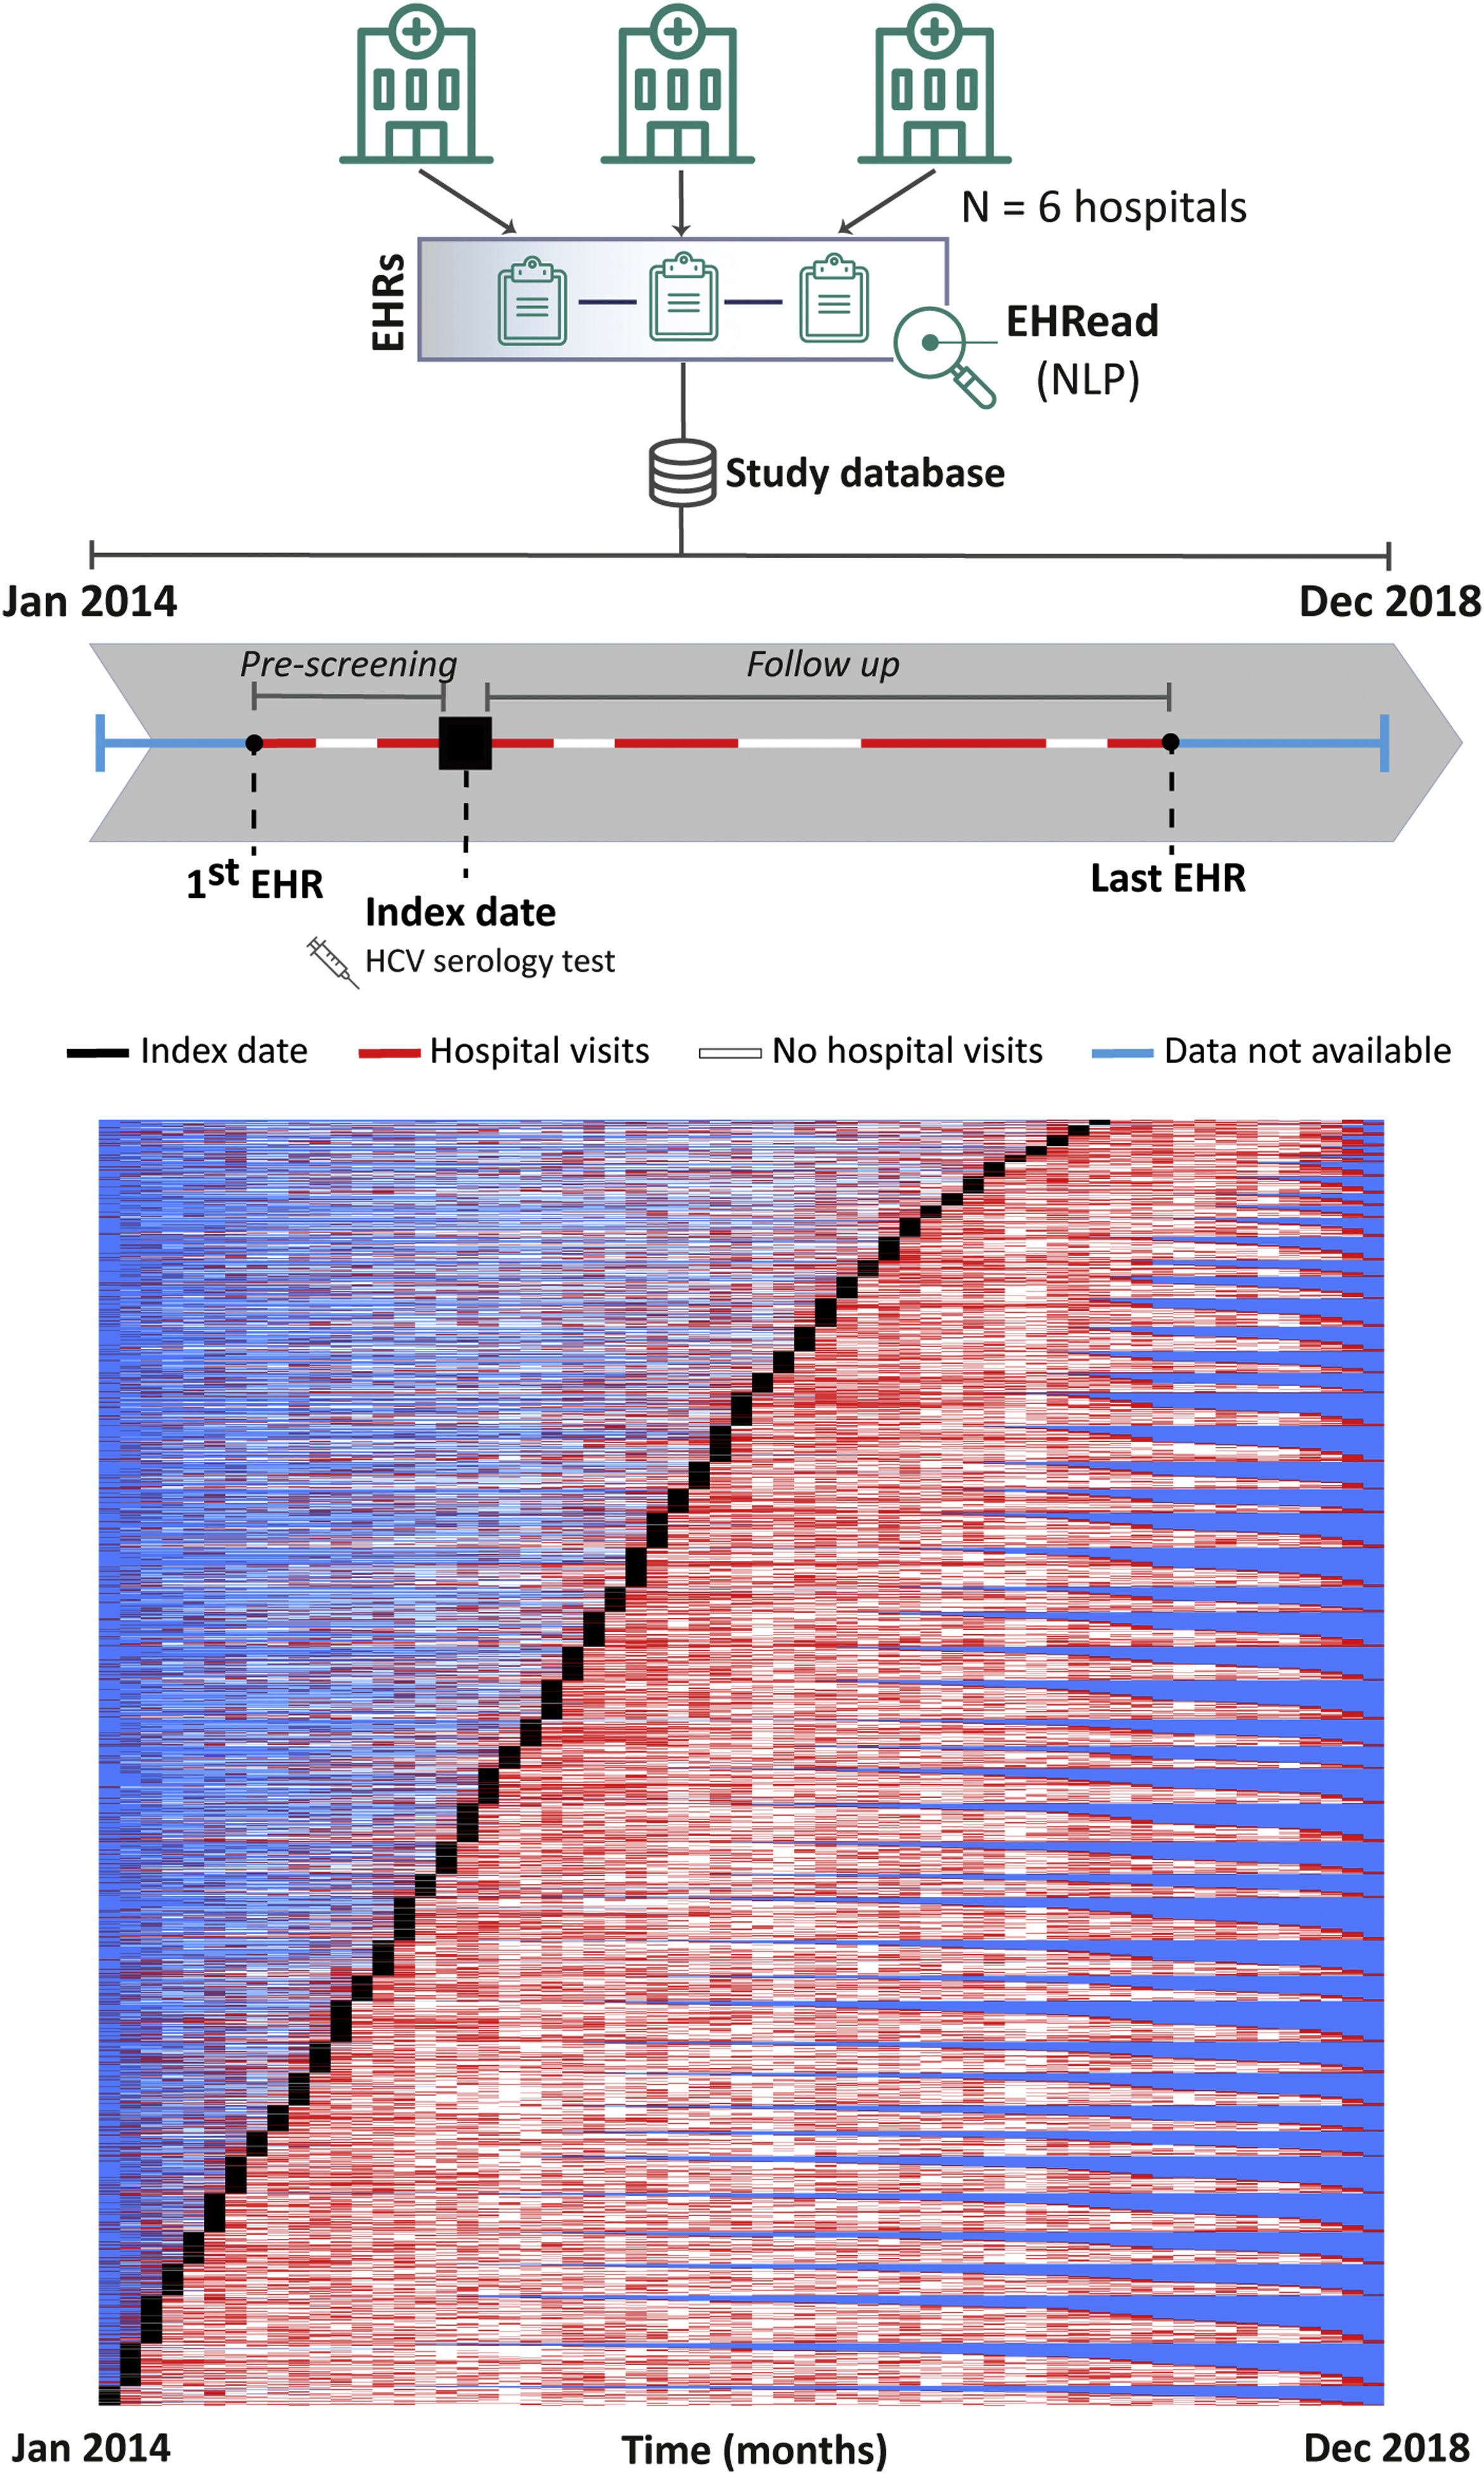
Study designThis was a retrospective and multicenter study where we conducted a cross-sectional analysis of all patients at the time of inclusion. Index date (inclusion date) corresponds to the time when an HCV serology test was documented in the EHRs. Follow up comprised the time from index date to the last EHR available for each patient within the study period (Fig. 1, top). The LiverTAI study was designed to fulfill the following objectives: to identify the potential factors associated with HCV infection in the Spanish population, to generate a predictive model of undiagnosed HCV patient detection (subject of a future publication), to describe the demographic and clinical characteristics of patients tested for HCV, and to reflect their pre-testing patient journey. This publication focuses on the latter two objectives and the potential factors associated with HCV infection.
. The period from the first EHR to a patient's index date is referred to as “pre-testing” and the time from index date to the last EHR is the follow-up period. In the overall patient inclusion representation of the study period, each row corresponds to a single patient. From their first to last EHRs, throughout the study period, there are months during which no data is available for a patient (blue), months when hospital visits are detected (red), or months between hospital visits during which there is no visit detected (white).")
Patient inclusion dynamics. EHRead® technology is a system based on NLP that applies machine learning and deep learning to extract, analyze, and interpret the free-text information written in millions of de-identified EHRs. The unstructured free-text information from EHRs from the 6 participating sites is organized in a study database. Analyzed patients did not have a prior history of HCV mentioned in their EHRs and their records contained at least 12 months of follow up after HCV serology testing. The schematic timeline shows each patient being included in the study at the time that an HCV serology test was detected, referred to as index date (black box). The period from the first EHR to a patient's index date is referred to as “pre-testing” and the time from index date to the last EHR is the follow-up period. In the overall patient inclusion representation of the study period, each row corresponds to a single patient. From their first to last EHRs, throughout the study period, there are months during which no data is available for a patient (blue), months when hospital visits are detected (red), or months between hospital visits during which there is no visit detected (white).
The full analysis set (FAS) included all adult patients in the source population tested for HCV infection during the study period. Patients with documented prior history of HCV (HCV serology, PCR, genotype, or HCV-specific treatment) and patients with less than one year of follow up after HCV serology testing were excluded from the study. Within the study period, patients with an HCV-specific treatment or genotype defined, or patients with positive HCV PCR but no information regarding HCV serology testing were considered as having active viremia (i.e., HCV serology and RNA positive). Patients with at least one visit during follow up to the Gastroenterology, Internal Medicine, or Infectious Disease departments were classified into the “core departments” group. That visit had to include a mention to the term “HCV” or related terms such as serology, PCR, genotype, or specific HCV treatment. Patients that were not detected to have an HCV-related visit to the core departments were included in the “other departments” group.
Extraction of unstructured free text from EHRsClinical data were obtained using the EHRead® technology, as described previously.15–25 Briefly, the free text from de-identified, processed EHRs is extracted using NLP, machine learning, and deep learning techniques and translated into a synthetic database. Using the information obtained from this processing (study database), a statistical model was generated to describe the population that has undergone HCV testing.
External validation of EHRead® performanceEHRead® was assessed regarding its ability to identify key variables associated with the study disease within patients’ EHRs, as described previously.18,20–23 Briefly, a comparison was established between a physician-annotated set of EHRs, (i.e., “gold standard”), and the output of EHRead® upon reading that same set of EHRs.22 The “output vs. gold standard” comparison is reflected in the standard calculated metrics of precision, recall, and their harmonic mean (F1-score), as reflected in the Results section (Supplemental Table 1).
Analysis at index dateFor each patient, the index date was defined as the time point within the study period when available data on HCV testing by serology was first identified. For patients with diagnosis of HCV, information from available records prior to the study period were also considered. A time window of ±6 months from index date was used for data extraction and analysis, unless otherwise stated in the table footnotes, and the closest value to the index date was considered.
Patient journey and linkage to care analysesThe number of visits to the different services both prior to and after HCV serology mentions was analyzed for the different groups according to HCV seropositivity, viremia, and follow-up department. Patient journeys were displayed in alluvial diagrams. Linkage to care was reflected by mean times between HCV serology and HCV PCR, genotyping, or treatment, as well as time-to-event curves showing cumulative incidence rates of first mentions of these variables.
Statistical data analysesFrequency tables were generated for categorical variables, whereas continuous variables were described using summary tables. The number of non-evaluable outcomes and missing data is also provided, where relevant. Data was analyzed and represented using “R” software, version 4.0.2. To statistically compare subgroups regarding categorical variables, we tested the null hypothesis (equal proportions) using Fisher's exact tests. For subgroup comparison of numeric variables, we tested the null hypothesis (equal means) using independent-samples T tests. Welch's adjustment was incorporated for unequal variances. Mann–Whitney U tests were performed instead if the normality assumption (Shapiro–Wilk test) was not met. In time-to-event analyses, Cox proportional hazards models were used. Differences were considered statistically significant when p<.05 in two-tailed tests. p values were adjusted by the Benjamini & Hochberg method when accounting for multiple hypothesis testing.
ResultsStudy population and groupsA total of 49,704,746 EHRs corresponding to a source population of 2,440,358 patients were analyzed. External evaluation metrics of variable detection yielded F1-scores ≥80%, indicating robust identification of key clinical terms by the EHRead® NLP system (Supplemental Table 1). Within the source population, 16,261 patients were tested for HCV (FAS). The dynamics of patient inclusion and follow up within the study period are shown in Fig. 1 (bottom). Patient inclusion, which was performed throughout the study period, was overall constant across the years. The scarcity of hospital visits pre-testing indicates that many patients were new or did not visit the hospital regularly before being tested for HCV.
Fig. 2A shows the distribution of the FAS into the study groups according to HCV seropositivity and viremia. Within the FAS, HCV seropositivity was detected in 16.4% (n=2659) of patients. Within the HCV seropositive group, 37.7% (n=1003) had an HCV positive PCR result, genotype, or treatment, comprising the active viremia group. The HCV negative viremia proportion of patients was 18.6% (n=494) and those with unknown viremia (no mention of a PCR or its result) represented 43.7% (n=1162). The remaining HCV-tested patients (83.6%; n=13,602) had either a negative (50.6%, n=8221) or unknown (33.1%; n=5381) HCV serology test result and make up the HCV seronegative group.
 The number and percentage of patients included in the FAS are shown according to HCV seropositivity and viremia. Red shading represents HCV seropositive patients and blue shading corresponds to HCV seronegative patients. Within HCV seropositive patients, HCV active viremia (orange), negative viremia (green), or unknown viremia (gray) patients are described. (B) The FAS is shown divided into patients with follow up at core departments or other departments. As above, HCV seropositivity and viremia are shown in terms of patient number and percentage, following the same color coding.")
Study population groups by HCV status and follow-up departments. (A) The number and percentage of patients included in the FAS are shown according to HCV seropositivity and viremia. Red shading represents HCV seropositive patients and blue shading corresponds to HCV seronegative patients. Within HCV seropositive patients, HCV active viremia (orange), negative viremia (green), or unknown viremia (gray) patients are described. (B) The FAS is shown divided into patients with follow up at core departments or other departments. As above, HCV seropositivity and viremia are shown in terms of patient number and percentage, following the same color coding.
Aiming to categorize patients according to testing for a suspected HCV infection vs. routine screening, we detected whether they had an HCV-related visit to an HCV-related department during their follow-up period (Supplemental Table 2). As expected, patients detected as HCV seropositive had significantly more visits to the Gastroenterology and Infectious Disease departments (p<.001) than HCV seronegative patients. Patients with HCV active viremia had significantly more visits to the Gastroenterology (p=.041), Infectious Disease, Obstetrics and Gynecology, Neurology, and Endocrinology departments (all p<.001) than those with negative viremia. Patients with HCV unknown viremia predominantly visited the Emergency (63.3%; n=736), Gastroenterology (56.8%; n=660), Surgery (25.3%; n=294), or Obstetrics and Gynecology (23.3%; n=271) departments.
Patients in the core vs. other departments were also grouped according to HCV seropositivity and viremia. Within the FAS, 38% (n=6173) of patients were followed by core departments and 62% (n=10,088) in other departments (Fig. 2B). HCV seropositivity was detected in 26.2% (n=1619) of core department patients, which was significantly higher (p<.001, OR=3.09 [2.84, 3.37]) than for patients followed in other departments (10.3%; n=1040). Active viremia was detected in 43.5% (n=704) of the core department group but only in 28.75% (n=299) of those in other departments (p<.001, OR=1.91 [1.61, 2.26]).
Patient characteristicsTable 1 shows the patient characteristics in the FAS and study groups. The distribution of patients followed in core vs. other departments are shown in Supplemental Table 3 and Supplemental Table 4, respectively. The median (Q1, Q3) age of the FAS was 50 (37, 65) years; 43.8% (n=7129) were male (Table 1). Among HCV seropositive patients, the median (Q1, Q3) age was 53 (41, 63) years and 51.4% (n=1367) were male, reflecting significantly older patients and more males than in the HCV seronegative group (p<.001 for both variables). The proportion of males with HCV active viremia was also significantly higher than with negative viremia (p<.001, OR=1.24 [1.11, 1.36]).
Patient characteristics.
| FAS | HCV sero+ | HCV sero− | p ValueOR (95% CI) | HCV active vir | HCV negative vir | HCV unk vir | p valueOR (95% CI) | |
|---|---|---|---|---|---|---|---|---|
| Total | 16261 | 2659 | 13602 | 1003 | 494 | 1162 | ||
| Gender | ||||||||
| Female n (%) | 9132 (56.2) | 1292 (48.6) | 7840 (57.6) | <0.001*0.69 (0.64, 0.76) | 444 (44.3) | 237 (48) | 611 (52.6) | 0.001*0.76 (0.64, 0.89) |
| Male n (%) | 7129 (43.8) | 1367 (51.4) | 5762 (42.4) | 1.31 (1.24, 1.36) | 559 (55.7) | 257 (52) | 551 (47.4) | 1.24 (1.11, 1.36) |
| Agea(years) | ||||||||
| Median (Q1, Q3) | 50 (37, 65) | 53 (41, 63) | 49 (36, 65) | <0.001*2.03 (1.36, 2.69) | 52 (44, 63) | 53 (41, 62) | 53 (39, 65) | 0.3191.00 (-1.00, 2.00) |
| Risk factors | ||||||||
| Drug addiction (IDU) n (%) | 245 (1.5) | 123 (4.6) | 122 (0.9) | <0.001*5.36 (4.12, 6.97) | 73 (7.3) | 27 (5.5) | 23 (2) | <0.001*2.52 (1.72, 3.72) |
| Blood transfusions n (%) | 3025 (18.6) | 662 (24.9) | 2363 (17.4) | <0.001*1.58 (1.43, 1.74) | 223 (22.2) | 185 (37.4) | 254 (21.9) | 0.014*0.79 (0.66, 0.96) |
| Presence of piercings n (%) | 1704 (10.5) | 372 (14) | 1332 (9.8) | <0.001*1.50 (1.32, 1.70) | 140 (14) | 79 (16) | 153 (13.2) | 1.001.00 (0.79, 1.26) |
| Presence of tattoos n (%) | 160 (1) | 64 (2.4) | 96 (0.7) | <0.001*3.47 (2.48, 4.82) | 27 (2.7) | 11 (2.2) | 26 (2.2) | 0.5141.21 (0.70, 2.06) |
| Comorbiditiesn(%) | ||||||||
| Hepatic manifestations | ||||||||
| Cirrhosis n (%) | 992 (6.1) | 482 (18.1) | 510 (3.7) | <0.001*5.68 (4.97, 6.50) | 169 (16.8) | 56 (11.3) | 257 (22.1) | 0.1940.87 (0.70, 1.07) |
| Hepatocellular carcinoma n (%) | 172 (1.1) | 96 (3.6) | 76 (0.6) | <0.001*6.67 (4.87, 9.16) | 41 (4.1) | 11 (2.2) | 44 (3.8) | 0.3351.24 (0.80, 1.91) |
| Cardiovascular risk factors | ||||||||
| Hypertension n (%) | 7698 (47.3) | 1357 (51) | 6341 (46.6) | <0.001*1.19 (1.10, 1.30) | 448 (44.7) | 288 (58.3) | 621 (53.4) | <0.001*0.66 (0.56, 0.78) |
| Diabetes n (%) | 6080 (37.4) | 1079 (40.6) | 5001 (36.8) | <0.001*1.17 (1.08, 1.28) | 343 (34.2) | 244 (49.4) | 492 (42.3) | <0.001*0.65 (0.55, 0.77) |
| Dyslipidemia n (%) | 7910 (48.6) | 1353 (50.9) | 6557 (48.2) | 0.012*1.11 (1.02, 1.21) | 432 (43.1) | 316 (64) | 605 (52.1) | <0.001*0.60 (0.51, 0.71) |
| Psychiatric disorders | ||||||||
| Anxiety n (%) | 2285 (14.1) | 390 (14.7) | 1895 (13.9) | 0.3141.06 (0.94, 1.20) | 155 (15.5) | 62 (12.6) | 173 (14.9) | 0.3961.11 (0.88, 1.38) |
| Depression n (%) | 1914 (11.8) | 342 (12.9) | 1572 (11.6) | 0.0611.13 (0.99, 1.28) | 136 (13.6) | 53 (10.7) | 153 (13.2) | 0.4031.10 (0.87, 1.40) |
| Dual pathology n (%) | 598 (3.7) | 156 (5.9) | 442 (3.2) | <0.001*1.86 (1.53, 2.24) | 88 (8.8) | 26 (5.3) | 42 (3.6) | <0.001*2.25 (1.60, 3.16) |
| Others | ||||||||
| Peripheral neuropathy n (%) | 1746 (10.7) | 261 (9.8) | 1485 (10.9) | 0.1000.89 (0.77, 1.02) | 92 (9.2) | 38 (7.7) | 131 (11.3) | 0.4200.89 (0.67, 1.17) |
| Rheumatoid arthritis n (%) | 2681 (16.5) | 357 (13.4) | 2324 (17.1) | <0.001*0.75 (0.67, 0.85) | 109 (10.9) | 65 (13.2) | 183 (15.7) | 0.003*0.69 (0.54, 0.88) |
| Hypothyroidism n (%) | 1886 (11.6) | 255 (9.6) | 1631 (12) | <0.001*0.78 (0.67, 0.90) | 85 (8.5) | 41 (8.3) | 129 (11.1) | 0.1350.81 (0.61, 1.07) |
| Non-Hodgkin lymphomas n (%) | 596 (3.7) | 111 (4.2) | 485 (3.6) | 0.1281.18 (0.95, 1.46) | 28 (2.8) | 52 (10.5) | 31 (2.7) | 0.005*0.54 (0.34, 0.85) |
| Co-infections | ||||||||
| HIV n (%) | 235 (1.4) | 109 (4.1) | 126 (0.9) | <0.001*4.57 (3.49, 5.98) | 73 (7.3) | 11 (2.2) | 25 (2.2) | <0.001*3.53 (2.32, 5.47) |
CI: confidence interval; FAS: full analysis set; HCV active vir (viremia): positive HCV antibody and RNA test results; HCV negative vir (viremia): positive HCV antibody and negative RNA test results; HCV unknown vir (viremia): positive HCV antibody test result and no information regarding RNA test or its result; HIV: human immunodeficiency virus; IDU: injecting drug user; OR: odds ratio (Fisher tests); Sero+: positive HCV antibody test result; Sero-: negative HCV antibody test result; Vir: viremia.
Regarding the potential factors associated with HCV infection, Table 1 shows that detection of injection drug users (IDU), blood transfusions, piercings, or tattoos was significantly higher in the HCV seropositive than the seronegative group (p<.001 for all variables). IDU detection was significantly higher both in the HCV seropositive vs. seronegative group (p<.001, OR=5.36 [4.12, 6.97]) and in the HCV active vs. negative viremia group (p<.001, OR=2.52 [1.72, 3.72]).
Comorbidities (Table 1) such as hypertension, diabetes, and dyslipidemia were significantly more detected in the HCV seropositive group than its negative counterpart (p<.001, p<.001, and p=0.012, respectively). Cirrhosis (p<.001, OR=5.68 [4.97, 6.50]) and hepatocellular carcinoma (p<.001, OR=6.67 [4.87, 9.16]) followed a similar trend. Our data also show a significant positive correlation of HIV co-infection with HCV seropositivity (p<.001, OR=4.57 [3.49, 5.98]) and active infection (p<.001, OR=3.53 [2.32, 5.47]) (Table 1). The most common genotype in FAS patients with active HCV viremia was HCV genotype 1 (77.7%; n=342), particularly genotype 1b (41.4%; n=182) and genotype 1a (20.2%; n=89), followed by genotype 3 (14.5%; n=64) and genotype 4 (7.0%; n=31) (Supplemental Table 5). HCV genotype was significantly more detected in active viremia core department patients than in others (p<.001, OR=4.66 [3.36, 6.54]).
HCV patient journey prior to first HCV testing at hospitalsWe analyzed patients’ pre-testing journey to detect the hospital services visited prior to HCV serology testing (index date). As shown in Fig. 3 and Supplemental Fig. 1, a prominent peak in patients’ hospital visits at index is observed. Analysis of the FAS revealed that the Gastroenterology department is visited more by patients in the HCV seropositive vs. seronegative group (p<.001). Conversely, visits to the Obstetrics and Gynecology department are significantly more prominent in the HCV seronegative group (p<.001) (Supplemental Fig. 1).
 or other departments (right). The number of patients visiting each hospital department is shown as a function of time, represented per month during the 4-year period prior to index date (HCV serology testing, time 0). Patients are divided into HCV seropositive (A) and seronegative (B). The 11 most visited hospital departments by patients tested for HCV are color-coded according to the legend and are in order of appearance in each histogram from top (teal, Emergency) to bottom (bright yellow, other). Note that the rest of the services are included in the “other” category. *Statistical differences between the core vs. other department groups shown in the legends were considered significant when p<0.05 in two-tailed tests. Mann–Whitney U test differences in location (CI 95%) were performed for statistical analysis of HCV seropositive patients (core vs. other depts). Welch's t-test differences of group means (CI 95%) were performed for statistical analysis of HCV seronegative patients (core vs. other depts). +When correcting for multiple testing (adjusted p values), p>0.05. CI: Confidence interval.")
Pre-testing visits to hospital departments by HCV test results and department. Alluvial diagrams of pre-testing visits to the different hospital departments in HCV-tested patients followed in the core departments (left) or other departments (right). The number of patients visiting each hospital department is shown as a function of time, represented per month during the 4-year period prior to index date (HCV serology testing, time 0). Patients are divided into HCV seropositive (A) and seronegative (B). The 11 most visited hospital departments by patients tested for HCV are color-coded according to the legend and are in order of appearance in each histogram from top (teal, Emergency) to bottom (bright yellow, other). Note that the rest of the services are included in the “other” category. *Statistical differences between the core vs. other department groups shown in the legends were considered significant when p<0.05 in two-tailed tests. Mann–Whitney U test differences in location (CI 95%) were performed for statistical analysis of HCV seropositive patients (core vs. other depts). Welch's t-test differences of group means (CI 95%) were performed for statistical analysis of HCV seronegative patients (core vs. other depts). +When correcting for multiple testing (adjusted p values), p>0.05. CI: Confidence interval.
As shown in Fig. 3, HCV seropositive patients followed in other departments visit the Obstetrics and Gynecology, Nephrology, and Hematology departments more than their core counterparts (p<.001 for all departments). Interestingly, there is a clear abundance of HCV seronegative patients in the Obstetrics and Gynecology and Rheumatology departments. The Emergency department is frequently visited by all groups.
As shown in Fig. 4, the top departments where HCV testing was first mentioned were Gastroenterology (17.3%), Obstetrics and Gynecology (12.4%), and Internal Medicine (10.7%). HCV active viremia levels were highest in the Gastroenterology (10.4%), Medical Oncology (8.1%), and Surgery (7.9%) departments. Interestingly, the Emergency department was the fourth department with the most first mentions of HCV testing (7.3%), and the second excluding core departments (Fig. 4). In fact, though Internal Medicine ranked third regarding HCV testing, several non-core departments such as Medical Oncology, Surgery, Emergency, and Cardiology yielded higher percentages of HCV active viremia than this core department.
 and detected as having HCV active viremia (right). Percentages are calculated respect to the total number of HCV-tested patients that visit each department. The 11 most visited hospital departments are color-coded according to the legend (matching the alluvial diagrams) and in descending order of HCV testing.")
HCV testing and HCV active viremia levels per hospital department. Histograms representing the percentage of patients with a first mention of HCV testing in each of the departments (left) and detected as having HCV active viremia (right). Percentages are calculated respect to the total number of HCV-tested patients that visit each department. The 11 most visited hospital departments are color-coded according to the legend (matching the alluvial diagrams) and in descending order of HCV testing.
To address linkage to care, we calculated the time between an HCV serology and the subsequent first mention of HCV PCR, genotyping, or treatment in the patients’ EHRs (Supplemental Fig. 2) HCV active viremia patients followed in core departments showed a mean (SD) time of 3.9 (8.4) months to HCV PCR, 7.4 (10.5) months to genotyping, and 10.1 (12.1) months to treatment (Supplemental Fig. 2, top). On the other hand, HCV active viremia patients followed in other departments showed mean (SD) times of 5.2 (8.9), 9.1 (11.8), and 9.8 (12.5) months (Supplemental Fig. 2, bottom). Therefore, there is a longer delay between HCV serology testing and HCV PCRs or genotyping in the other departments than in the core departments, whereas treatments are performed within a similar timeframe in both groups.
Time-to-event analyses revealed HCV active viremia patients followed in core departments presented statistically significant higher cumulative incidence of HCV PCR and genotyping than patients followed in other departments (p<.001) (Fig. 5). Specifically, patients in the core departments at any time point during the study period were 2.54 (CI 2.14, 3.01) times more likely to undergo a PCR and 3.49 (CI: 2.66, 4.58) times more likely to be genotyped than patients in other departments. No differences between groups were observed regarding time to treatment (p=.181, HR=0.89 [0.76, 1.05]). These results indicate that, regarding linkage to care, significantly less time passes from HCV diagnosis to performing PCR or genotyping when HCV active viremia patients were followed in core departments than in other departments. First mentions of HCV treatments appeared within a similar timeframe regardless of the follow-up department group.
, genotype (B), or treatment (C) during the study period, in months. They show the frequency at which the events (HCV PCR, genotype, or treatment) occur during a 5-year period after HCV serology testing. The number of patients at risk, i.e., those that do not yet have a mention for the corresponding HCV event at that timepoint, is shown below each graph. Red: patients followed in core departments. Blue: patients followed in other departments. The shaded areas surrounding the curves correspond to the CI (95%). *Statistical differences between the core vs. other department groups were considered significant when p<0.05 in two-tailed tests. The p values and Cox proportional hazards ratios (CI 95%) are shown in each graph. CI: Confidence interval.")
Time-to-event curves regarding HCV PCR, genotypes, and treatment of HCV active viremia patients by department groups. Time-to-event cumulative incidence curves of first mention of HCV PCR (A), genotype (B), or treatment (C) during the study period, in months. They show the frequency at which the events (HCV PCR, genotype, or treatment) occur during a 5-year period after HCV serology testing. The number of patients at risk, i.e., those that do not yet have a mention for the corresponding HCV event at that timepoint, is shown below each graph. Red: patients followed in core departments. Blue: patients followed in other departments. The shaded areas surrounding the curves correspond to the CI (95%). *Statistical differences between the core vs. other department groups were considered significant when p<0.05 in two-tailed tests. The p values and Cox proportional hazards ratios (CI 95%) are shown in each graph. CI: Confidence interval.
In a novel approach, our RWD study used NLP and machine learning tools to analyze intra-hospital data of HCV-tested patients to detect their patient journey and linkage to care. In doing so, we obtained updated levels of HCV seropositivity and active viremia (16.4% and 6.0%, respectively) in a representative set of Spanish hospitals. Previous estimates of HCV seropositivity in Spain relying on outpatient and primary care data found lower values for these variables, such as the PREVHEP-ETHON Cohort (HCV seropositivity was 1.1%) or a study led by the Spanish National Health System (HCV seropositivity was 0.85%).26,27 However, both these studies were performed among the total population, not patients within hospital settings. In hospital settings, an Italian study reported HCV seropositivity at 3.7%,28 and a U.S.-based study compared the levels of HCV active viremia at different sites across one academic medical center, which varied from 2% in Family Medicine up to 14.8% in the Inpatient department, similarly to our results.29 Interestingly, we observed a large proportion of patients with HCV unknown viremia in our study, possibly reflecting loss of follow up or follow up in a different site.
Our RWD results, obtained using AI techniques, further reflected those obtained using traditional observational methods in several aspects. In HCV seropositive patients, we detected significantly higher proportions of cirrhosis and hepatocellular carcinoma, as well as extrahepatic manifestations such as diabetes and hypertension, in line with previous findings.7 The proportion reported by the WHO in 2021 of HIV-coinfected HCV patients is also similar to our results (4.0% vs. 4.1–7.3% in our study).3 We corroborated known HCV risk factors in our study population, including injection drug use (IDU), blood transfusions, piercings, or tattoos. The distribution of different HCV genotypes and their subclasses is also in line with previously described epidemiological data for the Spanish population30 and follows the trend found for high income countries.6
The main rationale behind using RWD to describe the patient journey of HCV-tested groups is to detect where patients are being followed and tested, and ultimately to accelerate HCV diagnosis.29 The most visited departments by patients tested for HCV were the Gastroenterology, Obstetrics and Gynecology, Internal Medicine, and Emergency departments. Obstetrics and Gynecology departments perform extensive HCV screenings in pregnant women, which the European Association for the Study of the Liver recommended in 2020 to be performed universally during pregnancy.31 The Rheumatology, Hematology, and Nephrology departments prescribe treatments with biologics, treatments with immunosuppressive side effects, or pre-dialysis treatments. As reflected here, they screen their patients for pathogens to avoid reactivation of latent infections, including HCV. However, it is noteworthy that the Medical Oncology department, in which there are immunosuppressive treatments prescribed as well, did not appear in our study as performing HCV testing to a similar extent, despite presenting the second highest HCV active viremia levels.
We further analyzed the pre-testing patient journey to study whether we could disambiguate patients that underwent HCV serology testing as part of routine screening from those with suspected HCV infection. The higher granularity obtained by separating patients according to follow-up departments highlighted that many patients with HCV active viremia were detected in departments that perform routine screening (Hematology, Surgery, Rheumatology, and Nephrology). Unexpectedly, we also found many first mentions of HCV tests at the Emergency department. Interestingly, the Emergency department of a high-level Spanish hospital has recently carried out a plan for HCV screening, yielding 4% of HCV seropositive patients.32
Time-to-event analyses reflected an unnecessary wait in non-core departments from HCV serology testing to confirmatory tests (HCV PCR and genotyping). The advent of reflex testing will accelerate HCV diagnosis, minimizing the risk of loss to follow up between tests and reducing time to treatment. Speedy diagnosis will also reduce the deleterious effects of chronic HCV infection by accelerating the time to HCV treatment for infected patients. According to WHO, only an estimated 21% of people living with hepatitis C knew their HCV status in 2019, whereas the 2030 global testing target is that 90% of HCV-infected individuals will have been diagnosed.3 Therefore, near-universal screening would be necessary to bridge this gap, which would entail a substantial healthcare resource burden. Results from this study could help pinpoint the hospital departments where previously unknown HCV active viremia patients are being detected primarily, or departments where HCV testing is lacking, to re-focus screening efforts accordingly within Spanish hospitals.
LimitationsSince we reused clinical data collected in routine practice, the availability of the desired variables in EHRs cannot be guaranteed, which explains the reported missing data. Furthermore, as this is a multicenter study, discrepancies in the EHR systems and type of data collected across settings may have contributed to the heterogeneity of the data, such as site- or physician-specific use of abbreviations and acronyms. Also, the patients included in the study were those for which a first HCV test was detected during the study period; however, if patients were first tested outside the hospital setting or the test was not recorded in their EHRs, we might include patients re-tested for HCV in the population, unawares. This population of re-tested patients could be enriched in HCV seropositive cases and thus contribute to a slight overrepresentation of this group. The present findings are also limited by the extent to which physicians accurately describe patients’ status in their medical records as unstructured data. Limited availability of structured data such as hospital pharmacy, microbiology, or other test reports (e.g., FibroScan®) prevented their inclusion in this study. While most of the patient-centered clinical information collected in EHRs is unstructured and clinical notes are a rich source of RWD,22 combining unstructured and structured information, as well as complementary data sources (e.g., genetic databanks, health apps, pharmacy databases, or microbiology and laboratory results) may lead to a most accurate depiction of patients screened for HCV.
ConclusionUsing AI techniques, we described the demographic and clinical characteristics of patients tested for HCV and identified potential factors associated with HCV infection in the Spanish population, which were in line with results described previously using traditional methodologies. The pre-testing journey of patients with HCV seropositivity reflected that they were significantly more abundant in HCV-related (core) departments. Other hospital departments also performed widespread HCV testing, such as Obstetrics and Gynecology, Rheumatology, Hematology, or, unexpectedly, Emergency, detecting HCV seropositive cases that would otherwise have remained undiagnosed. These other departments showed significantly delayed times from HCV serology testing to HCV PCR and genotyping during the study period than core departments, reflecting sub-optimal linkage to care. This in-depth analysis of the patient journey of HCV-tested patients highlights testing efforts on behalf of certain hospital departments, but also points for improvement to streamline HCV patient detection and linkage to care, contributing to the ongoing effort of HCV elimination.
Ethical considerationsThis study was classified as a “non-post-authorization study” by the Spanish Agency of Medicines and Health Products (AEMPS) and was approved by the Independent Ethics Committee of each participating hospital. It was conducted in compliance with legal and regulatory requirements and followed generally accepted research practices described in the Helsinki Declaration in its latest edition, Good Pharmacoepidemiology Practices, and applicable local regulations. Patient consent was waived, since data were retrospectively analyzed from patients’ EHRs, anonymized, and aggregated in an irreversibly dissociated manner.
FundingThis study was funded by AbbVie Spain S.L.U.
Conflicts of interestJL Calleja has been a consulter and speaker for AbbVie and Gilead Sciences. R Santos de Lamadrid is an employee at AbbVie and may have AbbVie stocks. C Maté is an employee at MedSavana. G Sánchez-Antolín has nothing to disclose. G de la Poza has nothing to disclose. MV Aguilera has nothing to disclose. L Hidalgo has nothing to disclose. X Torras has nothing to disclose.
Support to conduct the study was provided by Savana who took part with AbbVie in the study design, research, analysis, data collection, writing and data interpretation, all funded by AbbVie. No honoraria or payments were made for authorship. AbbVie was responsible for review and approval of the publication. The authors thank Sara Paris from AbbVie for taking part in the study design, Francisco Ledesma and Eva Sanz from AbbVie for writing and data interpretation and Miren Taberna MD PhD, David Casadevall MD PhD, Víctor Fanjul PhD, Hugo Casero, Natalia Polo, Clara L. Oeste PhD from Savana for study design, research, analysis, data collection, and writing within the AbbVie funding.
The following are the supplementary data to this article:
