


Observational studies reveal only small correlations between patient characteristics and outcome. Thus, the clinical impression that some patients are harder to treat than others is not reflected in different treatment outcomes. Possibly, in observational research the prognostic value of patient characteristics is masked by the amount of treatment received by the patient. According to this idea, patients with complex problems receive more treatment and will achieve the same outcome at the end of treatment as less complex patients. The treatment dose may mediate the relationship between clinical complexity and outcome.
MethodThis hypothesis was investigated in a national database with treatment outcomes of patients in curative care for mild to moderately severe psychiatric problems, predominantly mood and anxiety disorders. Complexity of the patients was operationalized based on the severity of care demands; treatment dose was measured by amount of treatment and length of the treatment period; treatment outcome was assessed with self-report questionnaires for symptomatology.
ResultsOn average, treatments with more complex patients involve more minutes of treatment, last longer, and lead to a less favourable outcome compared to less complex patients. Although statistically significant, these associations were not strong. The variance within the patient groups remained large and the prognostic value of complexity for treatment dose and for outcome of treatment was small.
ConclusionsThe relationship between complexity and outcome was not clearly mediated by treatment dose. Other variables, such as unmeasured patient characteristics, the nature of the treatment, characteristics of the therapist, the therapeutic relationship or the culture of the institution may be more important predictors of the treatment outcome and deserve further study.
Many patients who seek treatment in Mental Health Care (MHC) achieve relatively quickly a favourable outcome. However, for some patients improvement is much harder to attain and progress slower achieved. In particular, patients with more severe or complex problems appear to be less responsive to therapeutic interventions and may require more intensive or longer treatment. Research into the prognostic value of patient characteristics for outcome has yielded mixed results. Weiss and Blais1 provide an overview and conclude that demographic factors such as gender, age, level of education or socio-economic status are not strong predictors. Living conditions, such as marital status or having children, employment status or following an education, also appear to have little influence on the treatment result. Clinical characteristics of patients have more prognostic value; such as the diagnosis, psychiatric or somatic comorbidity, additional psychosocial problems (relationship problems, social problems), general functioning and, in particular, the severity of psychopathology at the start of treatment.2
In 2011, a nationwide project started in the Netherlands, aimed at routinely collecting outcome data in MHC.3 An organisation was setup (Foundation for Benchmarking MHC) and data were collected from all treatment providers in the Netherlands. In 2018 about 50% of all treatments in Dutch MHC could be evaluated.4 With this national data set we have previously conducted research into factors that may be predictive of treatment outcome.2,4,5 We were primarily interested in finding relevant confounders or “casemix variables” to control for, required for a fair comparison between healthcare providers.6 If confounders are not taken into account, a comparison of outcomes among various treatment providers is ill-fated, as one healthcare provider may have a population that is more difficult to treat than another. However, our search for predictors of treatment outcome, yielded only a few variables with a substantial association with outcome of treatment,5 with the exception of initial severity of the symptoms, which usually determines 25% of the posttest level (Warmerdam et al. 2016), which amounts to a substantial association in psychological research. Apparently, it is always important to take the pretest level into account, when we operationalize outcome of treatment as the posttest end-state.
Still, in addition to pretest severity, another patient characteristic that may have prognostic value for treatment outcome is complexity. Kathol et al.7 consider health complexity present when a medical illness is complicated by mental or behavioural health problems. Complex patients have more extensive care needs and their outcomes are worse, unless some form of integrated care is offered.8 Feltz-Cornelis9 offers a comprehensive summary of the research on complexity and presents implications for assessment and treatment. Huyse et al.10 devised an instrument to assess the extent of service needs, called “INTERMED”, which may serve as operationalization of complexity in health care settings. INTERMED assesses biological, psychological, and social aspects of the condition and suggests interventions.11 In the Dutch mental health care sector, another method of operationalizing complexity was explored by a working group in which health insurers, health care providers, professionals and scientists were involved.12,13 The aim of the working group was to develop an indicator that could predict the required treatment effort in MHC and was composed of information that was present in administrative databases of care providers. For the present study we used this indicator to operationalize the patient characteristic of clinical complexity.
Outcome of treatment is not merely determined by patient characteristics. Variables such as the nature, intensity or duration of the treatment (so-called process variables) will also influence the outcome. In randomized controlled trials (RCTs), the treatment dose is kept under control of the investigator by offering all participants in the study the same number of treatment sessions or the same daily dose of medication. In contrast, in observational outcomes research, the dose of the treatment is not under the control of the investigator.
The relationship between treatment dose and outcome in MHC has intrigued researchers since the mid 1980s. Howard et al.14 proposed a simple dose-response model: on average, the complaints decrease according to a logarithmic curve of diminishing returns over time: the largest gain is achieved in the first 5–10 sessions and later sessions add less and less effect. This finding by Howard et al.14 was replicated in recent research by Stulz et al.15 The latter study used outcome data that were collected at each session and compared a linear and a curvilinear model for symptom reduction. Stulz et al.15 report better fit of the curvilinear relationship. This pattern is quite consistent and occurs with both short and lengthier treatments; the degree of change of longer treatments is slower per session, but it follows the same pattern of reduced benefit over time. More recently, this outcome pattern for session-by-session data was also reported by Lutz et al.16
Howard et al.14 brought up a second issue: looking only at average treatment gain conceals that there is much variation among patients: some recover after 5–10 sessions, whereas others require 40–50 sessions or even more. Barkham et al.17 proposed the “good enough level” (GEL) model to describe variation in treatment duration: treatment is provided until an acceptable result or severity level of symptoms is achieved in patients. And with some patients it takes longer or requires more treatment sessions to achieve an acceptable level than with others.
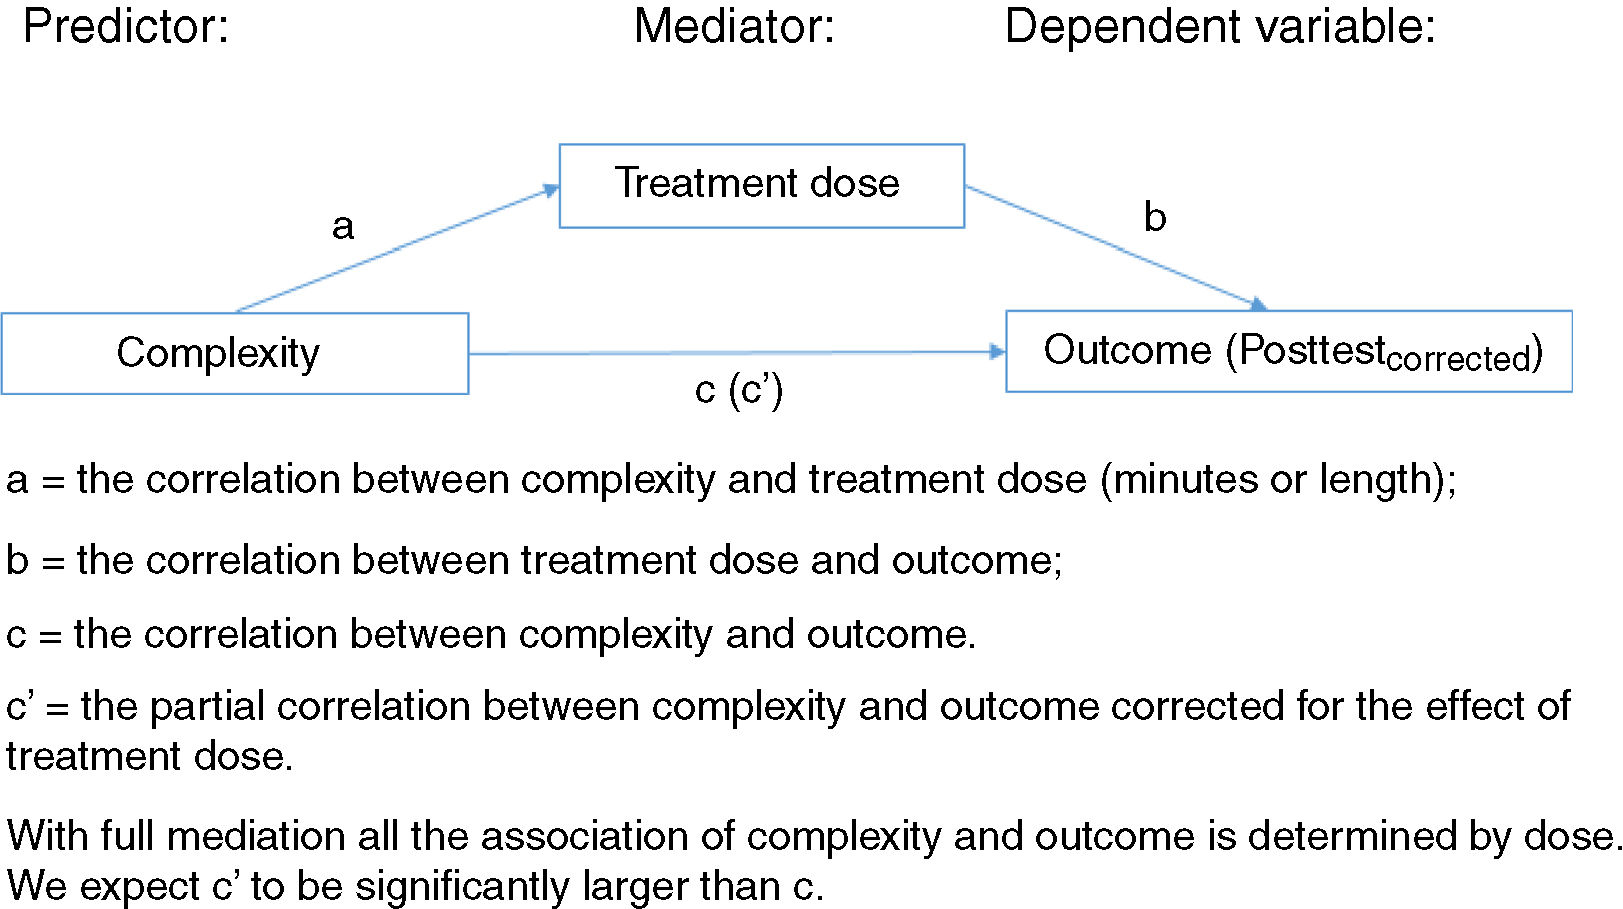
The treatment dose, the number of treatment sessions or the length of the treatment period may be related to the patient's clinical complexity. Complex, difficult-to-treat patients may need more treatment than simple, easy-to-treat patients. When both types of patients ultimately achieve the same treatment outcome, outcome will no longer be related to the complexity or the severity of the symptoms. The dose of treatment (the number of treatment sessions or the length of the treatment period) would then serve as a mediating variable, which nullifies the direct effect of complexity on therapy outcome. This is the hypothesis that we want to investigate in this study: does the dose of treatment mediate the relationship between clinical complexity and the outcome of treatment. Put differently: if we tend to continue treatment until an acceptable result is achieved, then complex patients will receive more treatment than less complex patients with eventually the same outcomes for both groups.
Thus, we hypothesize that the amount of treatment is a mediator of the relationship between the predictor clinical complexity and the dependent variable treatment outcome (see also18. Fig. 1 depicts the relationships more formally.
MethodComposition of the patient sample
We analysed N = 36 775 treatments of patients receiving outpatient treatment which were concluded between February 2013 and March 2015 from over 200 care providers (predominantly mental health care institutions). Treatment involved complete care trajectories for patients with common mental disorders, such as mood and anxiety disorders, which usually last for a year or less. All data were anonymized before being provided to the first author for analysis. According to Dutch law, no explicit informed consent is required for use of existing clinical or administrative data for scientific research.
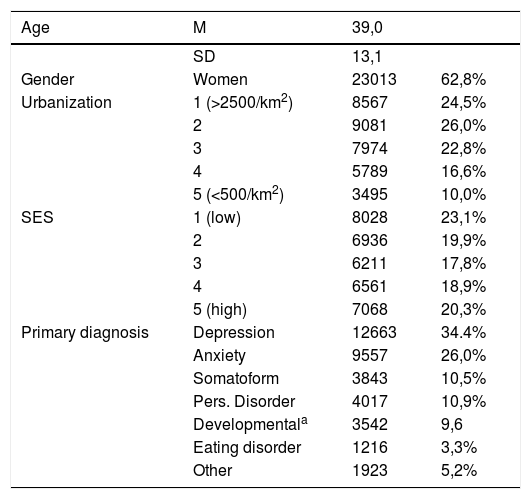
The sample consisted of 62.6% women and the average age was M = 39.0 (SD = 13.1). Table 1 provides an overview of demographic and clinical characteristics of the group that was included. Socio-economic status (SES) was determined based on the first four numbers of the zip code, according to a procedure of the Dutch Census Bureau.19 SES based on zip codes was divided into 5 classes, 1 = low SES, 5 is high SES. Urbanization degree was also determined on the zip code, but now based on the number of addresses per square kilometre (1 = very high, 2500 or more addresses per square kilometre; 5 = very low, less than 500/km2).
Demographic and clinical characteristics of the sample.
| Age | M | 39,0 | |
|---|---|---|---|
| SD | 13,1 | ||
| Gender | Women | 23013 | 62,8% |
| Urbanization | 1 (>2500/km2) | 8567 | 24,5% |
| 2 | 9081 | 26,0% | |
| 3 | 7974 | 22,8% | |
| 4 | 5789 | 16,6% | |
| 5 (<500/km2) | 3495 | 10,0% | |
| SES | 1 (low) | 8028 | 23,1% |
| 2 | 6936 | 19,9% | |
| 3 | 6211 | 17,8% | |
| 4 | 6561 | 18,9% | |
| 5 (high) | 7068 | 20,3% | |
| Primary diagnosis | Depression | 12663 | 34.4% |
| Anxiety | 9557 | 26,0% | |
| Somatoform | 3843 | 10,5% | |
| Pers. Disorder | 4017 | 10,9% | |
| Developmentala | 3542 | 9,6 | |
| Eating disorder | 1216 | 3,3% | |
| Other | 1923 | 5,2% |
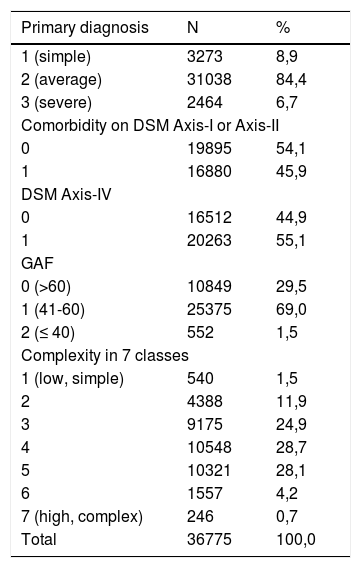
Patient complexity was operationalized with the indicator for the patient-based severity of care demands from the working group mentioned in the introduction.12,13 The working group produced the following operationalization of complexity. The patient-based indicator is composed of the primary diagnosis on Axis I of the DSM-IV taxonomy (subdivided into three severity levels 1, 2 and 3), comorbidity on Axis I or Axis II (0 or 1), psychosocial problems on Axis IV (0 or 1) and the DSM-IV Global Assessment of Functioning (GAF) score in three levels (0–40 = 2, 41–60 = 1 and 61–100 = 0). Thus. the final variable has a value from 1 to 7. A value of 7 implies a main diagnosis of a serious nature (3), comorbidity present (1), psychosocial complicating factors present (1) and a GAF score of 40 or less (2), i.e., “Some impairment in reality testing or communication or major impairment in several areas, such as work or school, family relations, judgment, thinking, or mood”. We will use the term complexity for patient-based severity of care demands. Table 2 shows the distribution of the sample over the various categories.
Patient based care demand indicators.
| Primary diagnosis | N | % |
|---|---|---|
| 1 (simple) | 3273 | 8,9 |
| 2 (average) | 31038 | 84,4 |
| 3 (severe) | 2464 | 6,7 |
| Comorbidity on DSM Axis-I or Axis-II | ||
| 0 | 19895 | 54,1 |
| 1 | 16880 | 45,9 |
| DSM Axis-IV | ||
| 0 | 16512 | 44,9 |
| 1 | 20263 | 55,1 |
| GAF | ||
| 0 (>60) | 10849 | 29,5 |
| 1 (41-60) | 25375 | 69,0 |
| 2 (≤ 40) | 552 | 1,5 |
| Complexity in 7 classes | ||
| 1 (low, simple) | 540 | 1,5 |
| 2 | 4388 | 11,9 |
| 3 | 9175 | 24,9 |
| 4 | 10548 | 28,7 |
| 5 | 10321 | 28,1 |
| 6 | 1557 | 4,2 |
| 7 (high, complex) | 246 | 0,7 |
| Total | 36775 | 100,0 |
We used two indicators from the national data set for treatment duration: the number of treatment minutes and the length of the treatment period (the number of days between the date of the first and the last treatment session). Both were derived from administrative databases of providers.
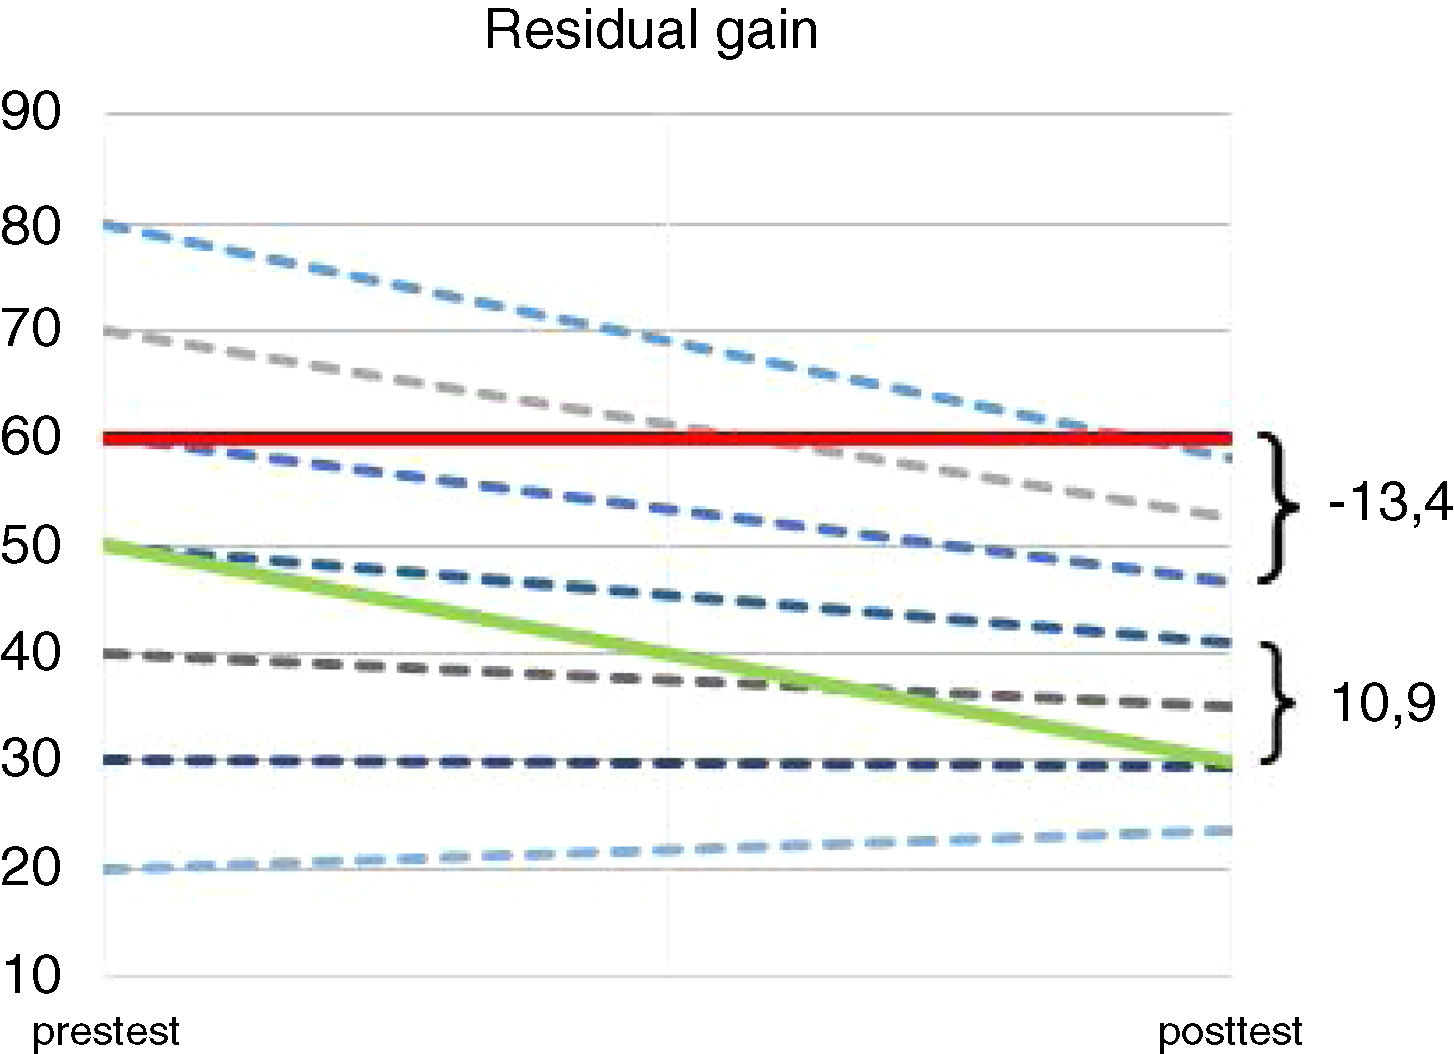
Treatment outcomeTreatment outcome was assessed with various self-report instruments that were filled in by patients in a specified time interval around the intake and around the last session of the treatment. Rough scores on questionnaires were standardized and normalized to T-scores, calibrated on the average MHC outpatient. For more details we refer to de Beurs et al.3 The dependent variable of the model, the outcome of the treatment, has been operationalized as the health gain from pre- to posttest, corrected for the starting level. This is also referred to as “residual gain” or “residual change” in the research literature.20 For all patients on average this value is 0, a positive value indicates that there has been a greater decrease in symptomatology than could be expected based on the pre-test, a negative value indicates that the patient has changed less than could be expected based on the pre-test (See Fig. 2).
. Regression analysis of pre- to posttest scores for the entire group showed (r = .575; p < .0001; ypost = 0,575*xpre + 12.15) Thus, a pretest score of Tpre = 60,0 yields a posttest score of Tpost = 46,7 and with a pretest score of Tpre = 50,0 a posttest score of Tpost = 40,9 is predicted. A patient without improvement and a pre- and posttest score of Tpre = Tpost = 60,0 will get a residual gain outcomecorrected = -13,4 (The scores reveal a 13,4 point outcome short of what would be expected given the pretest score), represented by the red line). In contrast, a patient with a pretest score of 50 and a posttest score of 30,0 gets a residual gain outcomecorrected = 10,9 (10,9 points more improvement than was expected based on the pretest level, represented by the green line).")
Decrease of symptoms over time for two patients, depicted against a background of expected improvement based on their pretest level (dotted lines).
Regression analysis of pre- to posttest scores for the entire group showed (r = .575; p < .0001; ypost = 0,575*xpre + 12.15) Thus, a pretest score of Tpre = 60,0 yields a posttest score of Tpost = 46,7 and with a pretest score of Tpre = 50,0 a posttest score of Tpost = 40,9 is predicted. A patient without improvement and a pre- and posttest score of Tpre = Tpost = 60,0 will get a residual gain outcomecorrected = -13,4 (The scores reveal a 13,4 point outcome short of what would be expected given the pretest score), represented by the red line). In contrast, a patient with a pretest score of 50 and a posttest score of 30,0 gets a residual gain outcomecorrected = 10,9 (10,9 points more improvement than was expected based on the pretest level, represented by the green line).
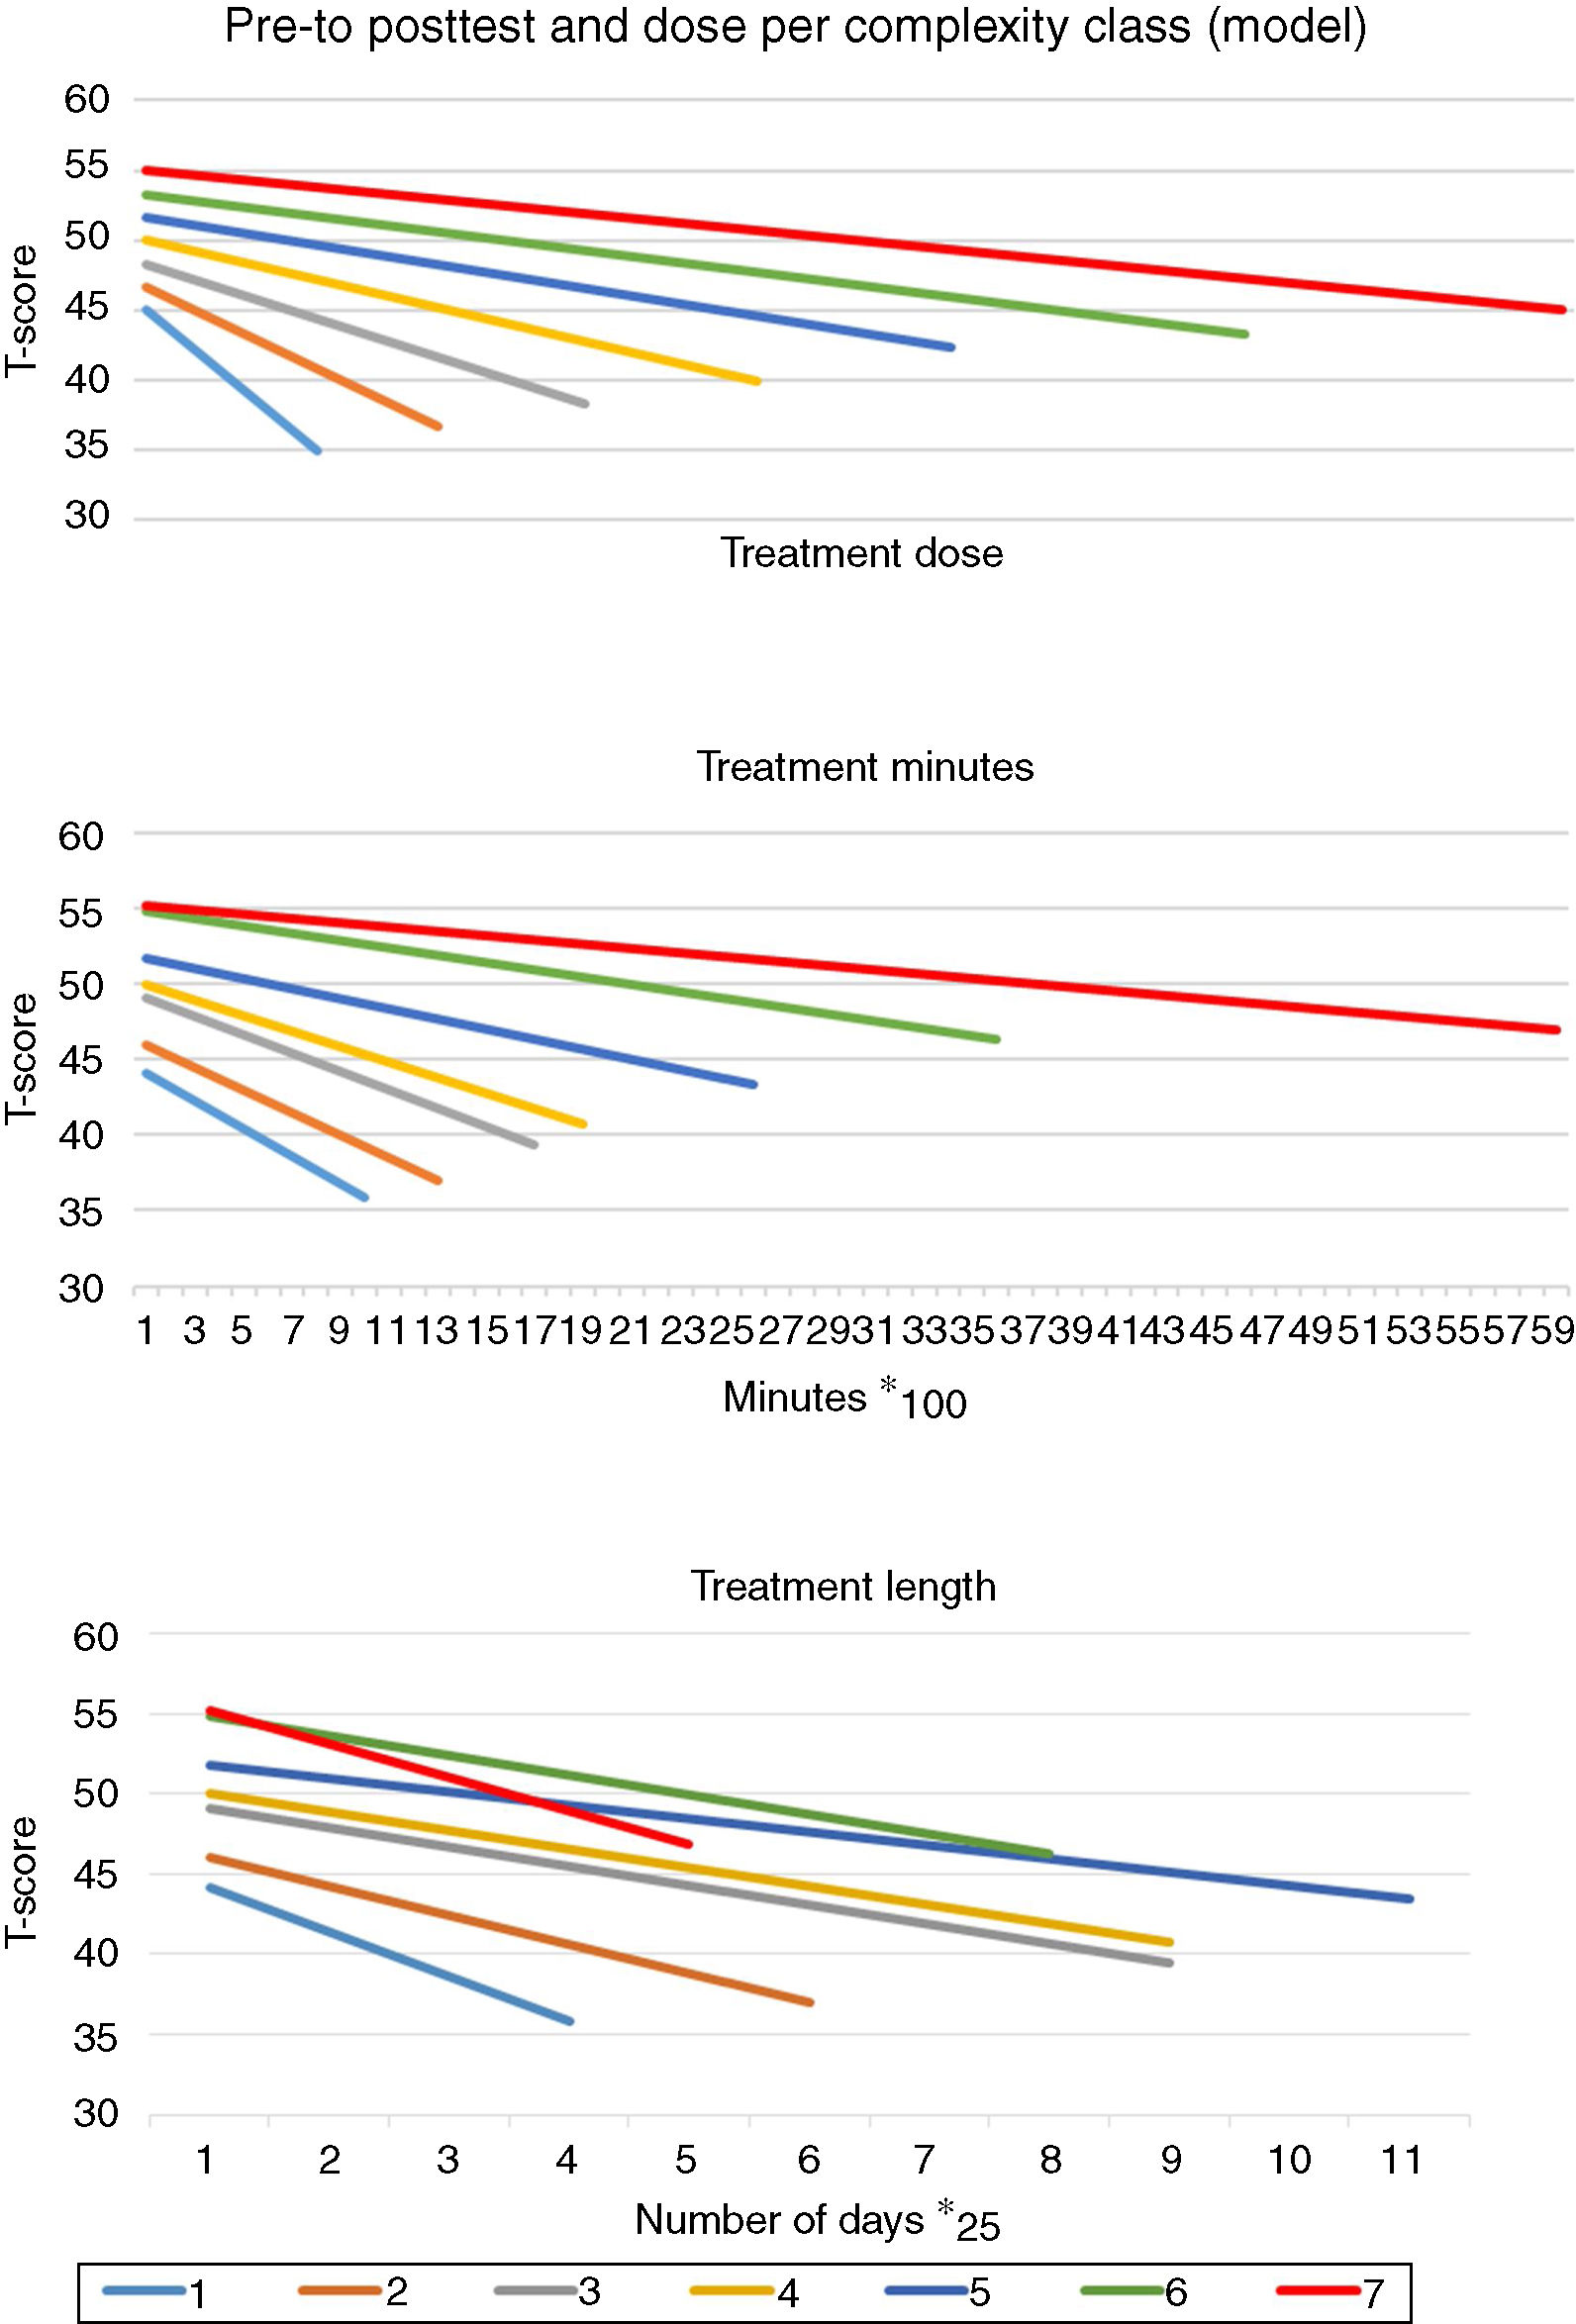
Fig. 3 presents for seven complexity classes, the severity of psychopathology over time on the y-axis and the length of treatment (on the x-axis) according to the “good-enough” model with full mediation. The mediation is expressed by the fact that the average decrease in complaints is the same for each complexity class (c = 0), but the length of treatment increases per complexity class (a > 0) and there is a correlation between treatment length and outcome (b > 0). The same diminishment in symptomatology (the pre-to-posttest health gain) is achieved within all complexity classes, but the duration of treatment increases for each higher level of complexity. There is also an association between complexity and the initial severity of symptoms, but this is taken into account by correcting the post-test severity with the pre-test level. The hypothesis was tested by analysing the data with hierarchical regression analyses.21
ResultsComplexity and actual findings for the expected decline of symptoms by treatment minutes (middle graph) and treatment length (lower graph) for seven complexity classes: 1 = simple, 7 = complex.")
As can be seen in Table 2, most patients were classified in the average category regarding their primary diagnosis (84.4%), almost half had comorbid conditions (45.9%), more than half had additional psychosocial problems (55.1%), and the largest group functioned in the intermediate range with a GAF-score of 41–60 (69.0%). The complexity categories were filled unevenly, but according to a normal distribution: complexity levels 1, 6 and 7 occurred relatively infrequent. The low frequency of highly complex patients in this study reflects our selection of a specific MHC domain (outpatient care for common mental disorders). For benchmarking, patients with severe mental illness are categorized into a different care domain. They are treated more intensely (more frequently in day care or as inpatients); their outcome is assessed in a different manner,22 and they were excluded from this study. The average need for care was M = 3.7 (SD = 1.2).
Treatment and outcomeThe average number of treatment minutes was M = 2183 (SD = 2650; range 50–66,000); this comes down to 36.4 h. The average length of the treatment period was M = 241 days with substantial variation (SD = 143); 14.8% of the cases were treated longer than one year. As expected, the length of the treatment period and treatment minutes were related: r = .35, p < .001), although not strongly, suggesting that there was also quite some variance among treatments in frequency of sessions over time.
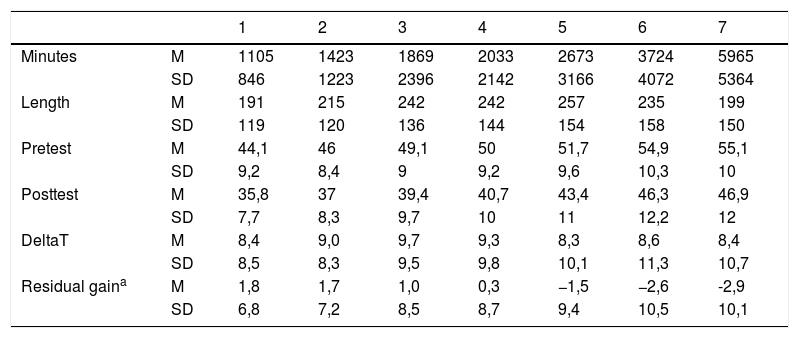
On average, the patients had a score of T = 49.4 (sd = 9.3) at the pre-tests. The average change in T score from pre- to posttest was Delta-T = 9.6 (sd = 9.5). Table 3 shows the average number of treatment minutes, the length of the treatment period in weeks, the pre- and post-test score and the average residual change for the various complexity levels. With increasing levels of complexity, the number of minutes of treatment increased as well, especially for the highest complexity class. The length of the treatment period also increased per complexity level, but the length of treatment decreased for the two highest complexity classes. See the difference in Fig. 3 for the highest complexity classes (green and red in the Figure). This discrepancy between treatment minutes and length of treatment period for complexity level 6 and 7 is probably due to the greater share of day care and inpatients treatments (admissions) at these levels, which leads to more treatment minutes in a shorter time period.
Treatment characteristics and outcome for seven complexity classes.
| 1 | 2 | 3 | 4 | 5 | 6 | 7 | ||
|---|---|---|---|---|---|---|---|---|
| Minutes | M | 1105 | 1423 | 1869 | 2033 | 2673 | 3724 | 5965 |
| SD | 846 | 1223 | 2396 | 2142 | 3166 | 4072 | 5364 | |
| Length | M | 191 | 215 | 242 | 242 | 257 | 235 | 199 |
| SD | 119 | 120 | 136 | 144 | 154 | 158 | 150 | |
| Pretest | M | 44,1 | 46 | 49,1 | 50 | 51,7 | 54,9 | 55,1 |
| SD | 9,2 | 8,4 | 9 | 9,2 | 9,6 | 10,3 | 10 | |
| Posttest | M | 35,8 | 37 | 39,4 | 40,7 | 43,4 | 46,3 | 46,9 |
| SD | 7,7 | 8,3 | 9,7 | 10 | 11 | 12,2 | 12 | |
| DeltaT | M | 8,4 | 9,0 | 9,7 | 9,3 | 8,3 | 8,6 | 8,4 |
| SD | 8,5 | 8,3 | 9,5 | 9,8 | 10,1 | 11,3 | 10,7 | |
| Residual gaina | M | 1,8 | 1,7 | 1,0 | 0,3 | −1,5 | −2,6 | -2,9 |
| SD | 6,8 | 7,2 | 8,5 | 8,7 | 9,4 | 10,5 | 10,1 |
Pretest psychopathology was positively associated with complexity (r = .22; p < .001). Complexity and the raw gain score (DeltaT) have a curvilinear association (inverse U: DeltaT increases for the first 3 classes and then decreases). The correlation of complexity with residual change (change in psychopathology corrected for pre-test level) showed that the result of treatment in the higher complexity classes lagged behind what was achieved in the lower complexity classes (r = −0.138; p < .001). Fig. 3 (middle graph) shows the average pre and post scores and the average number of treatment minutes per complexity class; Fig. 3 (lower graph) shows pre and posttest scores for length of treatment period classes.
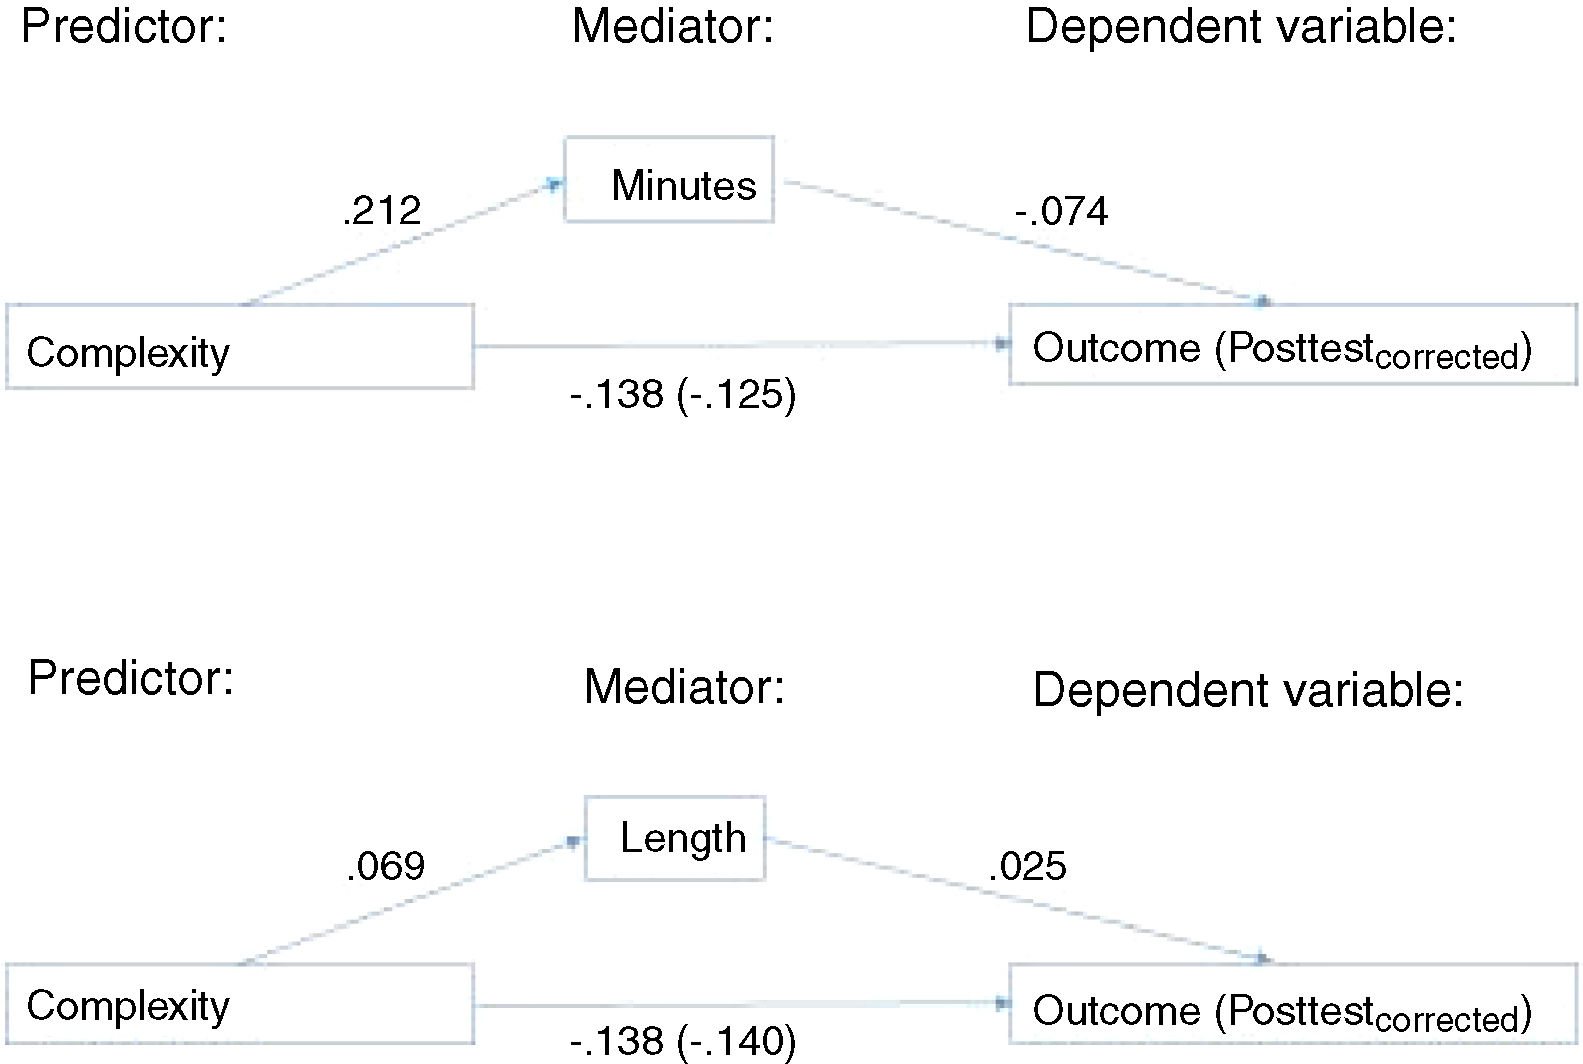
To test the mediation model, the relationship between the variables was investigated. The correlation between complexity and treatment outcome was c = −.138 (p < .001): the more complex the problem, the less progress is made in treatment. The correlation between complexity and treatment minutes was a = .212; p < .001: the more complex the problem, the more treatment is given. The correlation between treatment minutes and treatment outcome was b = −.074; p < .001: the more treatment minutes, the less progress is made in treatment. The association of complexity and treatment outcome, taking into account the mediation effect, was c’ = −, 125. The direct association c was therefore hardly mediated by treatment duration, due to the lack of a substantial association between treatment minutes and outcome.
The relationship with the length of the treatment period (Fig. 3, lower graph) was investigated in a similar way. The correlation between complexity and treatment outcome was still c = −, 138 (p < .001). The correlation between complexity and the length of the treatment period was a = .069 (p < .001): the more complex the problem, the longer it was treated. The relationship between length and treatment outcome was significant, albeit very small c = .025 (p < .001). Length of treatment did not mediate the association between complexity and treatment outcome. Fig. 4 shows an overview of the findings.
Discussion and length of the treatment period (below).")
The hypothesis that the relationship between the complexity of the problem and the treatment outcome is mediated by the treatment effort was only partially supported by the results of the analyses. At first glance, the average outcomes for complexity classes, as shown in Fig. 3, corresponded with the hypothesis and correlations were statistically significant. In particular, the middle graph in Fig. 3 shows the expected pattern of more treatment minutes and the same effect (pre-to-posttest difference) as complexity increases. However, the variance within the classes of minutes and outcomes was also considerable, which implies that complexity ultimately predicted little variation in outcome, even when we controlled for treatment effort. The results of the regression analysis (Fig. 4) indicated that the negative correlation between complexity and outcome hardly changed when we controlled for the treatment effort (from c = −.138 to c' = −.125 for minutes and to c' = −.140 for length of treatment). There was a positive correlation between need for care and treatment effort (r = .212; 5% explained variance for minutes), but hardly any association for treatment length (r = .069; which indicates less than 1% variance in outcome determined by length) and also the association between the treatment effort and treatment outcome was negligible, so this mediation path ultimately determined little variance in treatment outcome. The report from the working group on care demand12 mentioned 5% explained variance in treatment minutes due to complexity of the patient for all MHC treatments in the Netherlands. We replicated this finding here for the more homogeneous group of patients with common mental disorders. The hypothesis that the relationship between complexity and therapy outcome is concealed by treatment intensity as a mediating factor (more minutes or longer treatment with high complexity) was therefore only partially supported by the present results.
The aim of this research was the premise that differences in treatment outcomes among care providers may be confounded by case mix differences, for which we should correct. This premise assumes that some patients are harder to treat than others (and that “difficult-to-treat” patients are more prevalent in some institutions than in others). We have operationalized difficulty-to-treat by the complexity indicator, a combination of a patient's diagnostic characteristics, such as the primary diagnosis, comorbidity and the level of functioning (see Table 1). This brings about the question whether this indicator is an appropriate operationalization of difficulty level. Other important aspects, such as the patient's previous treatment history and whether favourable results have been achieved with previous treatments, were not included in the indicator. These aspects may also determine a patient's level of difficulty and, in any case, deserve to be examined separately as a predictor of the treatment outcome.5 Previous research has shown that complexity could only predict the use of care (remunerated treatment costs) to a limited extent.12 We don’t know whether this was due to poor validity of the complexity indicator or simply due to unexplained variance in costs13 or unwarranted practice variation.23 However, some aspects of the complexity indicator could definitely be improved. For instance, in spite of its widespread use, the GAF-scale has been criticized for combining clearly distinct dimensions of psychopathology (e.g., psychological, social, and personal functioning) in a single scale.24 Specific aspects of functioning deserve extra attention. For example, in the IAPT project in GB it was found that (paid) work or receiving education increases the chance of treatment success.25 Finally, there was limited variation in GAF-scores in the present study sample, diminishing the correlation with outcome. We have just started a project to develop a Computer Adaptive Test for functioning26 as an alternative to the GAF scale. Other aspects, such as motivation for treatment27 and effort and early treatment response28,29 appear to play an important role and determine treatment completion and outcome.
As our complexity indicator appeared not strongly related to the actual use of MHC,12,13 other instruments deserve consideration. For instance, INTERMED, the instrument developed by Huyse et al.10 for the medical setting, needs to be evaluated on its feasibility and suitability to detect complex patients in MHC settings. Once detected, complex patients need more extensive care. Kathol et al.8 suggest to let patients express their expectations regarding treatment and what it should bring about. Furthermore, they suggest to let them indicate vulnerabilities to oppose future relapses. Our findings suggest that also in MHC complex patient require more treatment and their outcomes are less favorable compared to less complex patients.
Another issue is whether residual change is the optimal operationalization of treatment outcome. In the research literature there is discussion about residual change as a measure of treatment effect. Some authors are in favour of a more simple pre-to-posttest difference score.30 In RCT’s in which group averages are compared (and randomization ensures equality of groups), the pre-to-posttest difference score is the most obvious outcome measure. However, Cronbach and Furby20 have suggested the residual change score for regression models, as applied in this study. For more information about the advantages and disadvantages of difference scores and residual gain scores, we kindly refer the reader to elsewhere.31,32 We have exploratively analysed two alternative models: a model with the pre-to posttest difference score as a dependent variable and a model where the pre-measurement score is included as a separate predictive variable. The findings with these models were basically the same, but the second model is more complex and harder to understand, compared to the model presented in this paper.
The treatment effort was operationalized in two ways: the number of treatment minutes and the length of the treatment period. Although both aspects are related, they also highlight a different aspect of the dose of treatment that the patient has received. This was also reflected in the results. The correlation of complexity with the number of minutes (r = .212 is significantly stronger than the association of complexity with the length of the treatment period (r = .069). There is also a clear discrepancy between treatment minutes and length of treatment as mediating variable. When we compare treatment minutes and length of treatment for the seven complexity classes (Figs. 4 and 5), it appears that treatments in classes 6 and 7 last on average shorter but include more minutes, due to more admissions or day treatments in these higher classes. Because the data examined here lack more information about the nature of the treatment and there is no detailed clinical data about the patients, such as suicidality, we can only speculate about the appropriateness of these indicators of treatment effort.
The number of minutes of treatment is most similar to the number of sessions that have previously been associated with treatment outcome.14,17 We have investigated here whether complexity is the distinguishing factor between patients receiving long-term or short-term treatment and the need for care does not seem to explain much variance in treatment minutes. An alternative explanation, arising from the GEL model of Barkham et al.17 is, that especially unsuccessful treatments last longer, because they are continued and possibly intensified precisely due to not achieving favourable results. When a treatment has a favourable outcome, it will be concluded; however, if little or no result is achieved, the therapist may continue to try out new interventions. It is notoriously difficult to terminate a treatment due to lack of results33 and it is not consistent with the professional ethics of GGZ professionals. Further research into this hypothesis requires additional data regarding outcome of treatment at intermediate time points.
Another process aspect of the treatment is the intensity or the number of sessions per week. Cuijpers et al.34 have demonstrated in a meta-analysis that it is not the number of minutes of treatment or how long it lasts, but rather the intensity that improved the effectiveness of the treatment. An increase in the intensity from 1 to 2 sessions per week led to considerably better results. For logistical reasons, outpatient treatment in the Netherlands usually follows a format of weekly sessions, instead of two sessions per week or a varied format with initial more frequent sessions and later in treatment less frequently. In this dataset we didn’t have information to determine the treatment intensity in detail. Further investigation into the optimum match of intensity and patient needs is called for.
Finally, in our view treatment evaluators (and therapists) should be modest about the impact of treatment in MHC. Important events in a patient's life will happen during treatment and may lead to a diminishment of psychopathology (the patient changes jobs, wins a hefty prize in a lottery, gets or ends a relationship, etc.). A favourable outcome may be attributable to such life events, rather than to the treatment.
Strengths and weaknesses of the researchStrengths of the present research are the size of the dataset and the fact that these data were acquired in everyday practice of Dutch mental health care. Thus, the findings are generalizable to clinical practice. At the same time, collecting data is more difficult in clinical practice than under controlled research conditions. The available data are far from complete: a substantial proportion of patients have not been pre-measured and/or not re-measured; around 50% in total.4 In addition, it is likely that missing data is systematically missing. For example, patients who unilaterally discontinued treatment after the first or second appointment (early drop-outs) are usually not measured and their data were not included in this study. Collecting diagnostic data, for example, is not as thorough and systematic in everyday practice as in controlled research. For example, standardized diagnostic interviews, such as the MINI-plus,35 are not applied in clinical practice and the diagnosis is based on clinical judgement, diminishing the reliability and validity of the complexity indicator (in addition to the earlier critical comments about the operationalization of complexity).
Finally, a weakness of this research is that the data investigated is based on data required by the Minimum Data Set (MDS) definition of the Foundation for Benchmarking MHC, aimed at nationwide data collection; “minimum” implies that much potentially relevant information about the patients and their treatment was not included in de MDS. Suicidality has already been noted as a potentially important clinical feature. The nature of the treatment (outpatient, day-clinical or clinical, or other forms such as “intensive home treatment”) is also an interesting variable to investigate further. The current results certainly give reason to look more closely at the relationship between patient characteristics, features of the treatment, and treatment outcome.
ConclusionAll in all, we conclude that the outcome of treatment was not determined to a significant extent by the clinical patient characteristics investigated (complexity) nor by characteristics of the treatment (extent of treatment in minutes or length of the treatment period). Part of the explanation is that our operationalization of complexity may have failed to include some relevant patient variables and we also noted that the assessment of functioning should be improved. Other variables may be more important predictors of the treatment outcome, such as unmeasured patient characteristics, the nature of the treatment, characteristics of the therapist or the therapeutic relationship or structural factors (such as management and culture at the care provider, the region). They deserve to be examined further.
Ethical considerationsFor the present research we used data from the national database of the Foundation for Benchmarking MHC. These data were collected by providers for administrative purposes and monitoring of treatment outcome and submitted in anonymized form to the foundation. As stated in the Method section: According to Dutch law, (and in accordance with the Helsinki Declaration, and according to the Dutch Central Medical Ethical Committee), no explicit informed consent is required for the use of clinical or administrative data, collected in the context of treatment provision.
FundingThe study was performed without financial support.
Conflict of interestNone.