
Current healthcare settings and ICUs especially are complex, highly technical, and multidisciplinary, with interactions between healthcare professionals and users, in which there may be errors at different levels. Our objective was to assess the perception of patient safety in our unit at the end of the third wave of the COVID pandemic, with the intention of conducting subsequent improvement actions.
MethodsObservational, cross-sectional, and descriptive study. The perception of Safety Culture was estimated using the HSOPS questionnaire translated into Spanish. Some questions were posed in a positive sense, and others in a negative sense. The response was also rated as positive, negative, or neutral. Our findings were compared visually, not mathematically, with those found in the previous national study «Analysis of the culture on patient safety in the hospital setting of the Spanish National Health System» published in 2009. A subgroup analysis was performed according to professional group and seniority as a health worker. The Student’s t, χ2 and ANOVA tests were used.
ResultsSixty-two professionals responded to the questionnaire, 73.90% of the total. The median time working in ICU 2 years (interquartile range 2–4.5 years). The rating for the degree of safety was 8.06 (SD 1.16). The majority (91.20%) had not reported any adverse event in the last year. A total of 30.90% had recently received patient safety training. The dimensions considered as weaknesses were 9 (“Staffing”, with 27.57% of positive responses) and 10 (“Support of the hospital management in safety”, with 17.64% of positive responses). The dimensions considered as strengths were 3 (“Expectation of actions by management/supervision of the service”) with 85.29% of positive responses, and 5 (“Teamwork”) with 95.58% of positive responses. The Cronbach's alpha index values suggest that the questionnaire has adequate internal consistency. In general, our data are more positive than those collected in the 2011 national survey, although the 2 dimensions considered weaknesses were already considered such in the previous work.
ConclusionsThe perception of patient safety in the ICU of our hospital after the end of the third wave of the COVID pandemic is adequate, with a more positive rating than that of the national study on safety culture at the hospital level carried out in 2009. The constant quest for patient safety should prioritize activity in the 2 dimensions considered weaknesses: staffing, and support from hospital management in everything related to patient safety.
El ambiente sanitario actual y, especialmente, las UCI, sen un medio complejo, altamente tecnificado y multidisciplinar, con interacciones entre los profesionales sanitarios y los usuarios, en los que puede haber errores a distinto nivel. Nuestro objetivo fue valorar la percepción de seguridad del paciente en nuestra unidad al terminar la tercera ola de la pandemia de COVID-19, con la intención de llevar a cabo acciones de mejora posteriores.
MétodosEstudio observacional, transversal y descriptivo. La percepción sobre la cultura de seguridad se estimó mediante el cuestionario HSOPS traducido al castellano. Algunas preguntas se plantearon en sentido positivo y otras en sentido negativo. También se calificó la respuesta como positiva, negativa o neutra. Se compararon visualmente, no de forma matemática, nuestros hallazgos con los encontrados en el estudio nacional previo «Análisis de la cultura sobre seguridad del paciente en el ámbito hospitalario del Sistema Nacional de Salud español» publicado en 2009. Se realizó un análisis de subgrupos en función del grupo profesional y de la antigüedad como sanitario. Se emplearon las pruebas t de Student, χ2 y ANOVA.
ResultadosRespondieron al cuestionario 62 profesionales, el 73,90% del total. La mediana del tiempo de trabajo en UCI fue 2 años (rango intercuartil 2–4,5 años). La calificación del grado de seguridad fue 8,06 (DE 1,16). La mayoría (91,20%) no había notificado ningún evento adverso en el último año. Un 30,90% había recibido formación en seguridad de paciente recientemente. Las dimensiones consideradas como debilidad fueron la 9 («Dotación del personal», con 27,57% de respuestas positivas) y la 10 («Apoyo de la gerencia del hospital en la seguridad», con 17,64% de respuestas positivas). Las dimensiones consideradas como fortalezas fueron 3 («Expectativa de acciones por parte de dirección o supervisión del servicio») con un 85,29% de respuestas positivas y 5 («Trabajo en equipo») con el 95,58% de respuestas positivas. Los valores del índice α de Cronbach indican una consistencia interna adecuada del cuestionario. En general, nuestros datos son más positivos que los recogidos en la encuesta nacional de 2011, aunque las 2 dimensiones consideradas debilidades ya lo eran en el trabajo previo.
ConclusionesLa percepción de seguridad del paciente en la UCI de nuestro hospital tras finalizar la tercera oleada de la pandemia de COVID-19 era adecuada, con estimaciones más positivas que las del estudio nacional sobre cultura de seguridad hospitalaria realizado en 2009. La búsqueda constante de la seguridad del paciente debería priorizar su actividad en las 2 dimensiones consideradas debilidades: la Dotación de personal y el Apoyo de la gerencia del hospital en todo lo relacionado con la seguridad del paciente.
What is known
An appropriate patient safety culture is necessary to prevent the occurrence of adverse events. Its assessment will make it possible to identify the weaknesses of the healthcare system and carry out improvement actions to prevent new adverse events.
What it contributes
It is the first ICU patient safety assessment study after the third COVID-19 wave. An adequate safety culture is perceived although the staffing and management support could be improved.
Study implications
As part of our ongoing work with the critically ill, and after the tsunami of the COVID-19 pandemic, we need to promote a culture of safety, improve staffing levels and also management support in promoting safety.
Today’s healthcare environment (and especially intensive care units [ICUs]) is a complex, highly technical and multidisciplinary environment, with numerous interactions between healthcare professionals and users, in which errors can occur at different levels.
In 1999, the US Institute of Medicine published the book “To err is human: building a safer health system” and, as a result, patient safety (PS) took on a global dimension, so that states and different organisations were obliged to take measures in this area. In Spain, PS was strengthened with strategy no. 8 of the Quality Plan for the Healthcare System, which has been in place since 2005, and more recently, in January 2020, the legal framework was redesigned and the Patient Safety Act was passed in Congress.1
Modern healthcare systems, in their quest for continuous improvement or excellence, focus their attention on quality of care. Although it is a term with multiple meanings and nuances, the WHO defines it as “the level of realisation of intrinsic goals for health improvement by health systems and responsiveness to the legitimate expectations of the population”.2
PS could be defined as the lowering of the risk of harm associated with healthcare to a minimum considered acceptable; or the conscious attempt to avoid patient injury caused by healthcare, which is one of the main components of quality of care.3 Practitioners should promote safe practices to eliminate, reduce or mitigate these adverse events (AE) or their consequences.3
According to the SYREC study (2007),4 all critically ill patients are exposed to errors, up to 2 errors per patient per day, considering that 20% of them could experience a serious AE. Taking into account that an average of 178 interventions are performed per user per day in the ICU, according to Donchin's study, the risk increases for each day of stay.5
Prevention of AE’s therefore has a threefold purpose: to reduce the risk of their occurrence, to address them early on in order to reduce their evolution and mitigate their consequences, and finally, to prevent their recurrence and reduce their impact.4 To this end, specific measures were introduced: hand washing, incident reporting (“National Study of Adverse Events Associated with Hospitalisation”, ENEAS for its initials in Spanish), a checklist in work routines, the use of smart infusion pumps, computerised treatment orders, packages of measures aimed at reducing nosocomial infection (Zero Pneumonia, Zero Bacteraemia, Zero Resistance, Zero UTI). With all this, a significant reduction in complications associated with long ICU stays was achieved.6
The aim of our work was to assess the perception of PS in our unit, with its strengths and weaknesses, at the end of the third wave of the COVID-19 pandemic, a critical moment in shaking the foundations of our healthcare system. The aim was to detect areas for improvement in PS-related knowledge and to assess attitudes and perceptions about PS culture and quality of care, with the proactive intention of carrying out subsequent improvement actions. The secondary objectives were to compare the results of our work with those of the 2009 national multicentre study,7 conducted in several hospital departments, and to describe the relationship between the perception of PS culture and the socio-demographic variables of the respondents in our sample.
MethodA descriptive cross-sectional observational study was carried out on a convenience sample from the ICU of a second level hospital. The professionals to whom the survey was addressed were nurses, nursing care assistants (NCAs), orderlies, cleaning staff and medical professionals. The criterion for professional inclusion in the study was having worked in our ICU after the third wave of the COVID-19 pandemic (April and May 2021). The exclusion criterion was that they had been working for less than one month.
The perception of PS culture was estimated using the Hospital Survey on Patient Safety Culture (HSOPS)8 questionnaire developed by the Agency for Healthcare Research and Quality and translated into Spanish.9 This is a semi-structured questionnaire with appropriate psychometric properties (reliability, validity and scale) to provide valid information about the study population. It consists of 42 questions relating to the security climate grouped into 12 dimensions. These questions on the perception of professionals have 5 response options on a Likert-type scale: from 1 (strongly disagree or never) to 5 (strongly agree or always). Some questions are worded positively and others negatively.
For example, question 40, “errors that are discovered and corrected before affecting the patient are reported” is desirable for our safety culture, so the appropriate or positive answers are “almost always”/ “always” and “agree”/“strongly agree”. Negative or inappropriate responses to this question would be “almost never”/“never” and “disagree”/“strongly disagree”. And the intermediate or neutral answers would be “sometimes” and "indifferent”.
On the other hand, question 17 “in this unit there are problems related to patient safety” is formulated in a negative sense. This means that the described element is not desirable for an adequate safety culture. The answers “almost always”/“always” and “agree”/“strongly agree” would in this case be inadequate or negative. The answers “almost never”/“never” and “disagree”/“strongly disagree” would be appropriate or positive. And the statements of the intermediate or neutral responses would also be “sometimes” or “indifferent”.
The 12 dimensions of safety culture explored in the questionnaire, grouped in 3 sets of questions, are:
Group 1. Safety culture results, at the global level. Includes:
- -
Dimension 1 “Frequency of reported adverse events” (questions 40, 41 and 42).
- -
Dimension 2 “Perception of safety” (questions 10, 15, 17 and 18).
Group 2. Dimensions of safety culture at unit or service level. Including:
- -
Dimension 3 “Expectations of actions by management or supervision that favour PS” (referred to medical leadership or ICU nursing supervision; questions 19, 20, 21 and 22).
- -
Dimension 4 “Organisational learning or continuous improvement” (questions 6, 9 and 13).
- -
Dimension 5 “Teamwork within the service” (questions 1, 3, 4 and 11).
- -
Dimension 6 “Openness in communication” (questions 35, 37 and 39).
- -
Dimension 7 “Feedback and communication about mistakes” (questions 34, 36 and 38).
- -
Dimension 8 “Non-punitive response to errors” (questions 8, 12 and 16).
- -
Dimension 9 “Staffing” (questions 2, 5, 7 and 14).
- -
Dimension 10 “Hospital management support for patient safety” (questions 23, 30 and 31).
Group 3. Hospital-wide dimensions of safety culture. Includes:
- -
Dimension 11 “Cross-unit teamwork” (questions 24, 26, 28 and 32).
- -
Dimension 12 “Problems in shift change and transition between services” (questions 25, 27, 29 and 33).
Similar to the Spanish translation of the HSOPS9 questionnaire, other questions were included:
- -
A couple of initial questions, before the HSOPS questionnaire, on gender and professional group.
- -
A question on the overall perception of the PS culture or perceived security climate.
- -
Several questions on socio-occupational characteristics of the professionals: in which year did you start working in your current profession, in your current hospital, in our ICU; how many hours of work do you do per week.
- -
A question on frequency of reporting AEs in the last year.
- -
A question on whether you have direct contact with patients.
- -
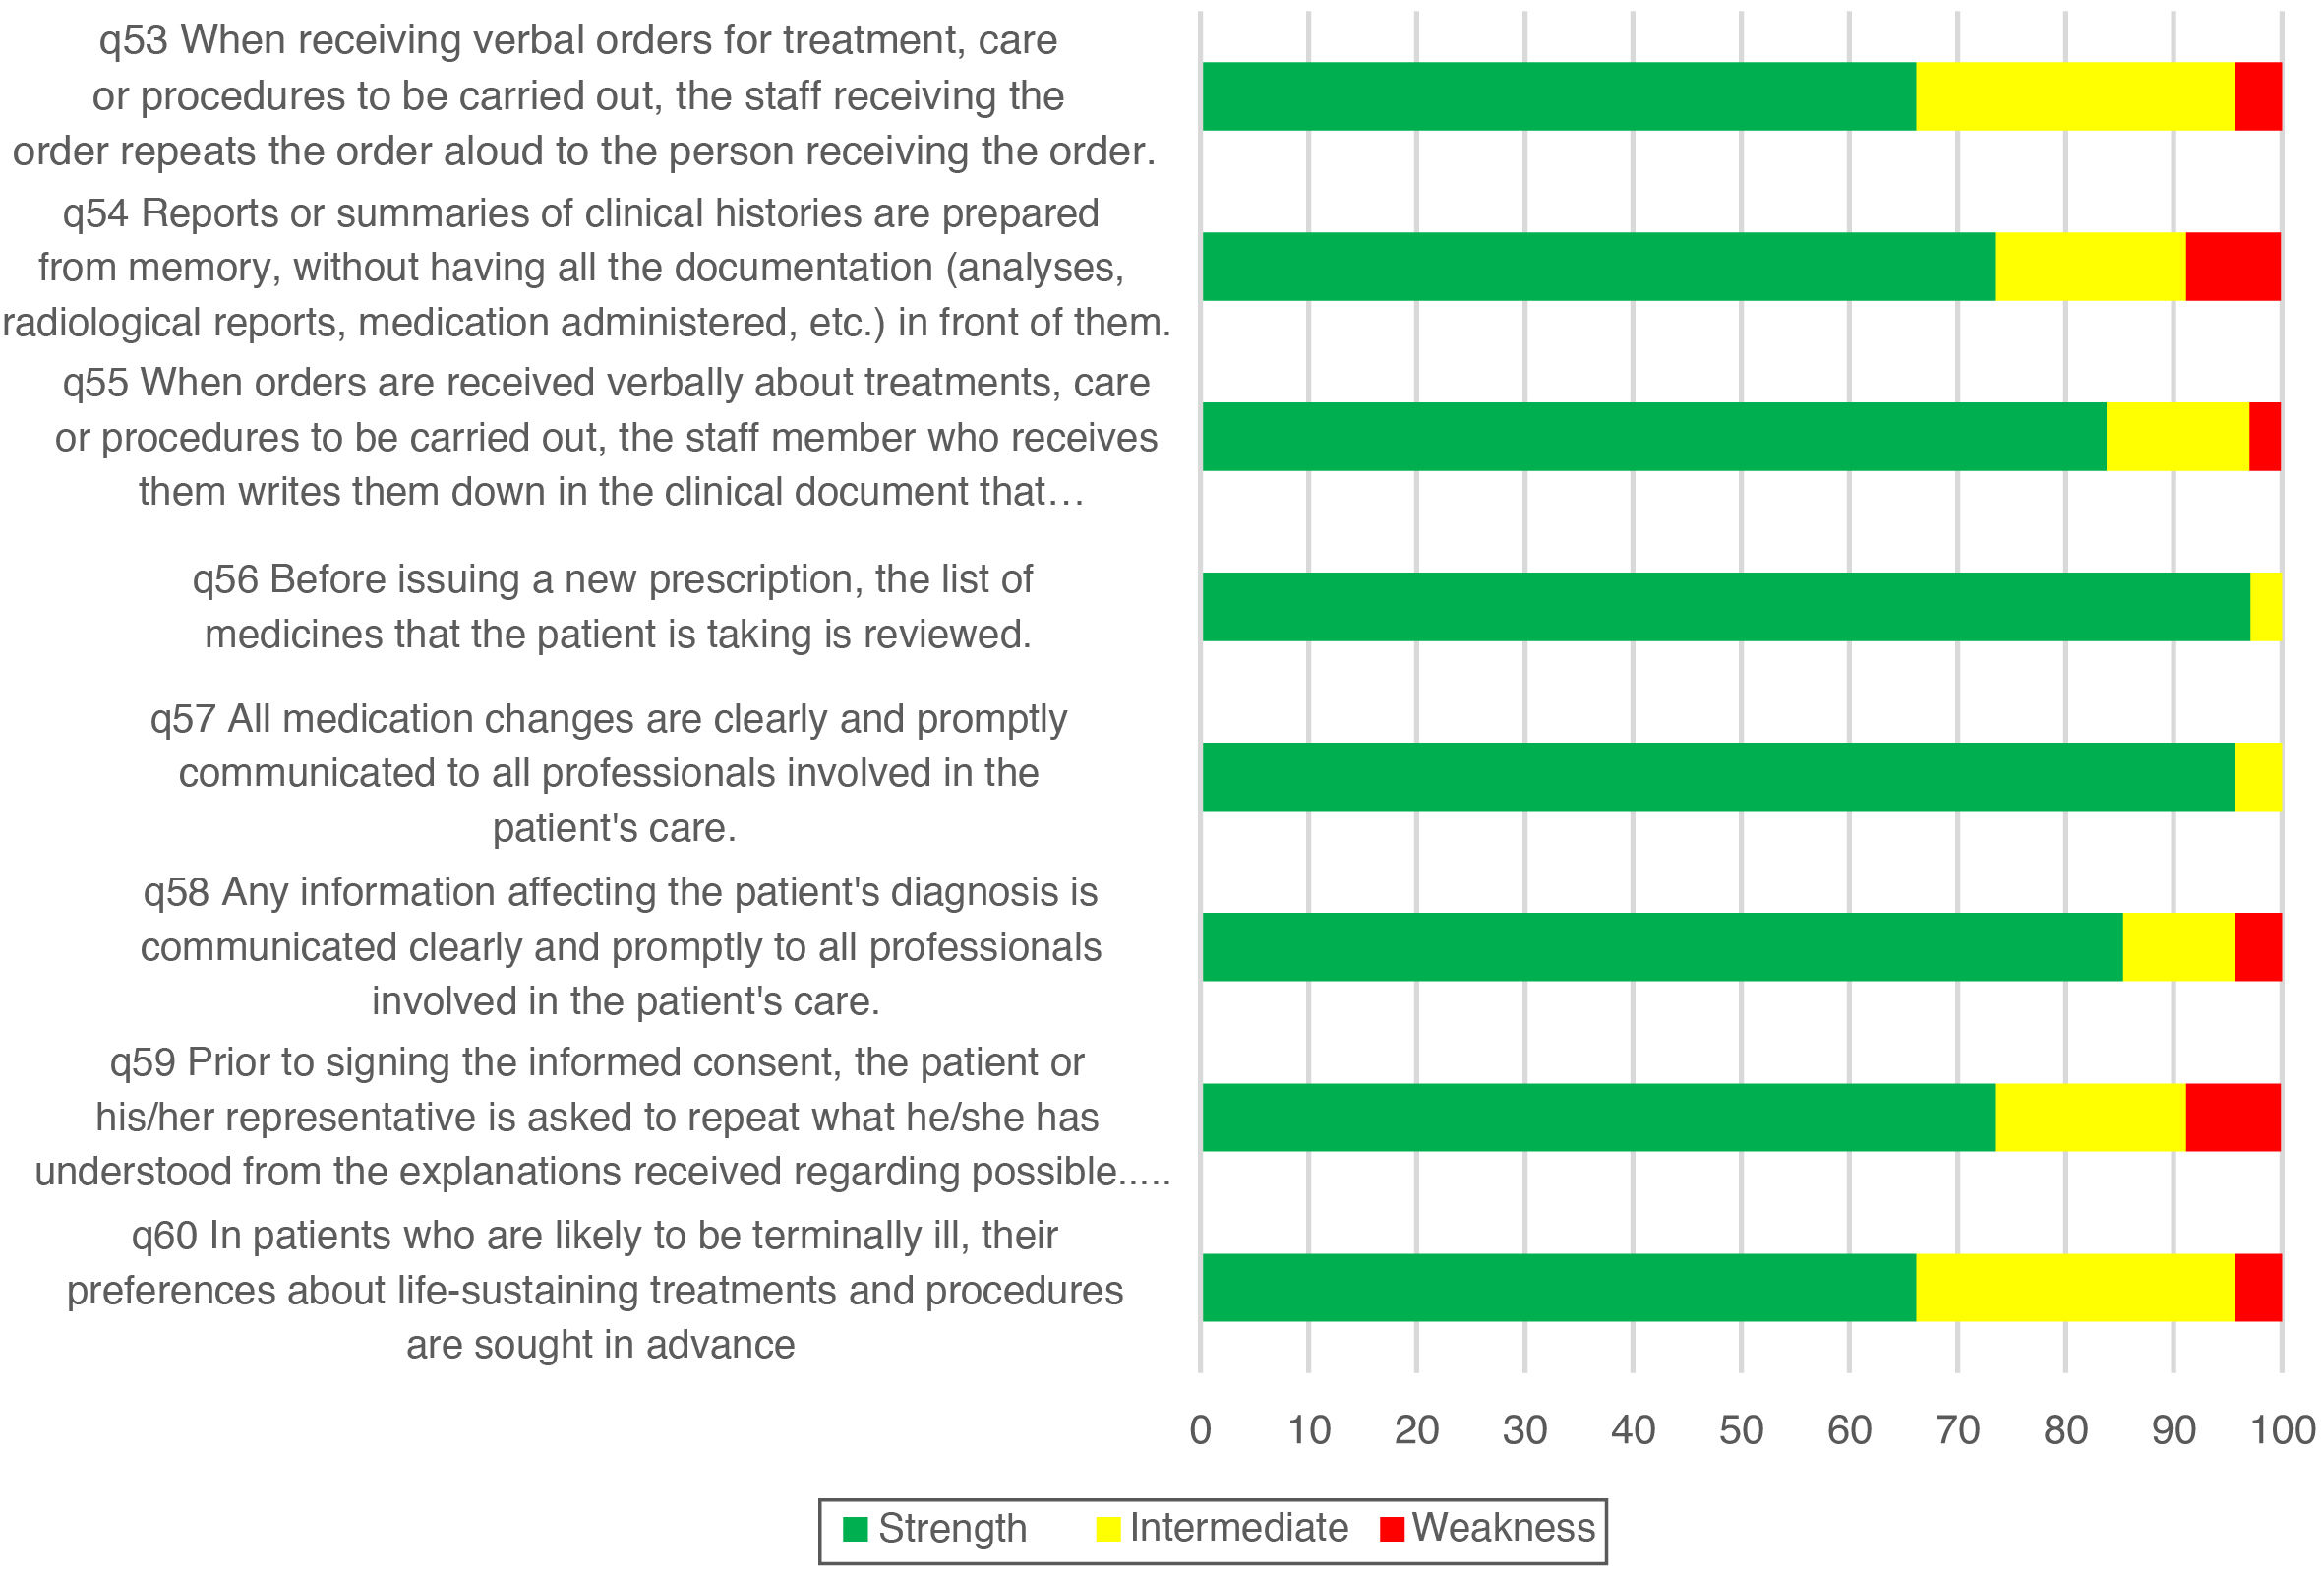
Another 8 questions (from 53 to 61) concerning common work practices that indicate quality culture: working with verbal orders, drawing up medical history reports, medication changes, diagnostic information, requesting informed consent and assessing treatment preferences in probably terminal patients.
- -
A question regarding whether they have recently received PS training.
To ensure data confidentiality, an online questionnaire was made available (link https://docs.google.com/forms/d/14hLw0SDAXStjJVKVUFSAKfcLJr4hnOy8TatLlkMZQP4/edit). Responses were collected during the period 29 May to 12 June 2021. During this period, several reminders were sent, both in person and via comments from the unit’s Whatsapp groups, of the convenience of answering the questionnaire.
Approval was obtained from the Clinical Research and Trials Committee for the development of this study.
For the frequency analysis, the questionnaire responses were recorded into 3 categories: negative (strongly disagree/never and disagree/rarely), intermediate (neither agree nor disagree, sometimes) and positive (agree/almost always and strongly agree/always). With this new coding, the relative frequencies of positive responses were calculated for each question and also combined for each dimension, with the quotient between the number of positive responses in the questions of a dimension and the total number of responses (positive, negative and neutral) in the items of a dimension. The analysis of strengths and weaknesses was carried out for each item and for the dimensions as a whole. To rate a question or dimension as a strength, ≥75% positive responses to positively worded questions or ≥75% negative responses to negatively worded questions were required. To rate a question or dimension as a weakness there must be ≥50% negative responses to questions asked in the positive, or ≥50% positive responses to questions asked in the negative.
Except for the variables of seniority (of profession, hospital work and ICU work) and number of hours worked per week, the remaining variables were categorical. Continuous variables were described with mean, standard deviation (SD), median and interquartile range (IQR); categorical variables (percentages of positive responses to each question or dimension) with frequency and percentages. A comparison was made of the percentage of positive responses in each question and in each dimension according to the length of service as a healthcare worker (less than, equal to or more than 2 years) with Student’s t-test. The same subgroup analysis was repeated to assess recent training in PS and the safety score of our unit. A significant difference was considered when the significance level p was less than 0.05.
An analysis was carried out to check the internal consistency of each dimension of the HSOPS questionnaire by calculating Cronbach’s α index. Cronbach’s α index allows us to measure the level of internal consistency of a measurement scale of a magnitude that is difficult to assess, constructed from the n variables observed.
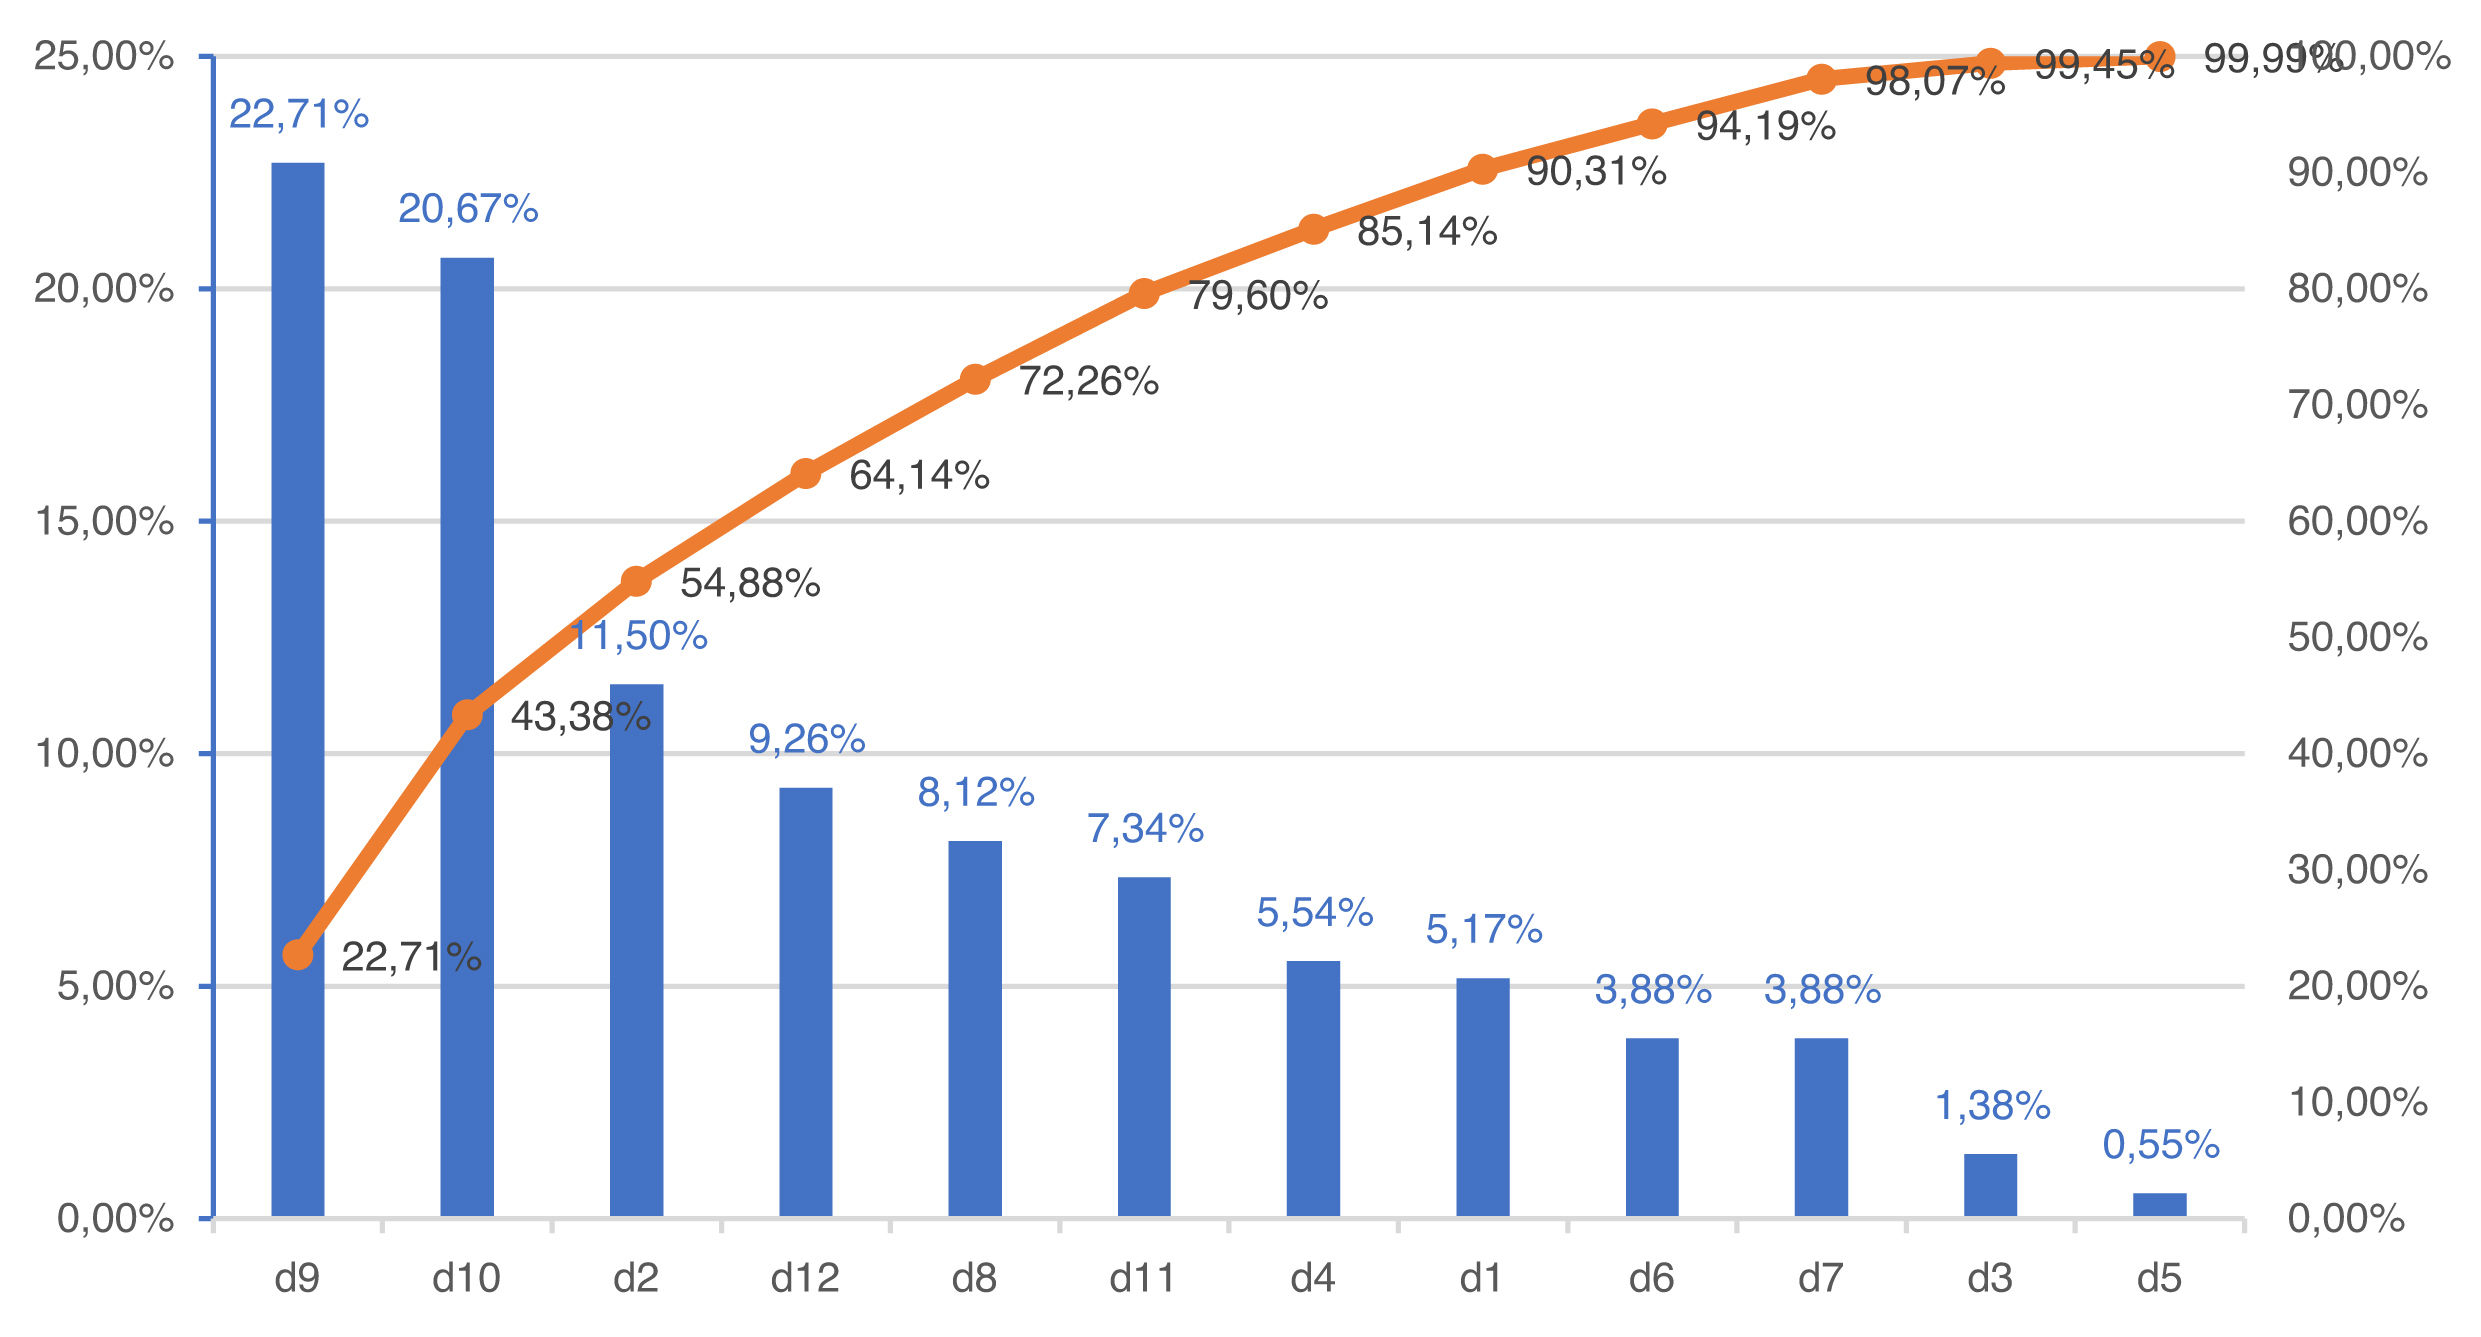
A Pareto chart was constructed to identify the dimensions rated with the highest percentage of negative responses.
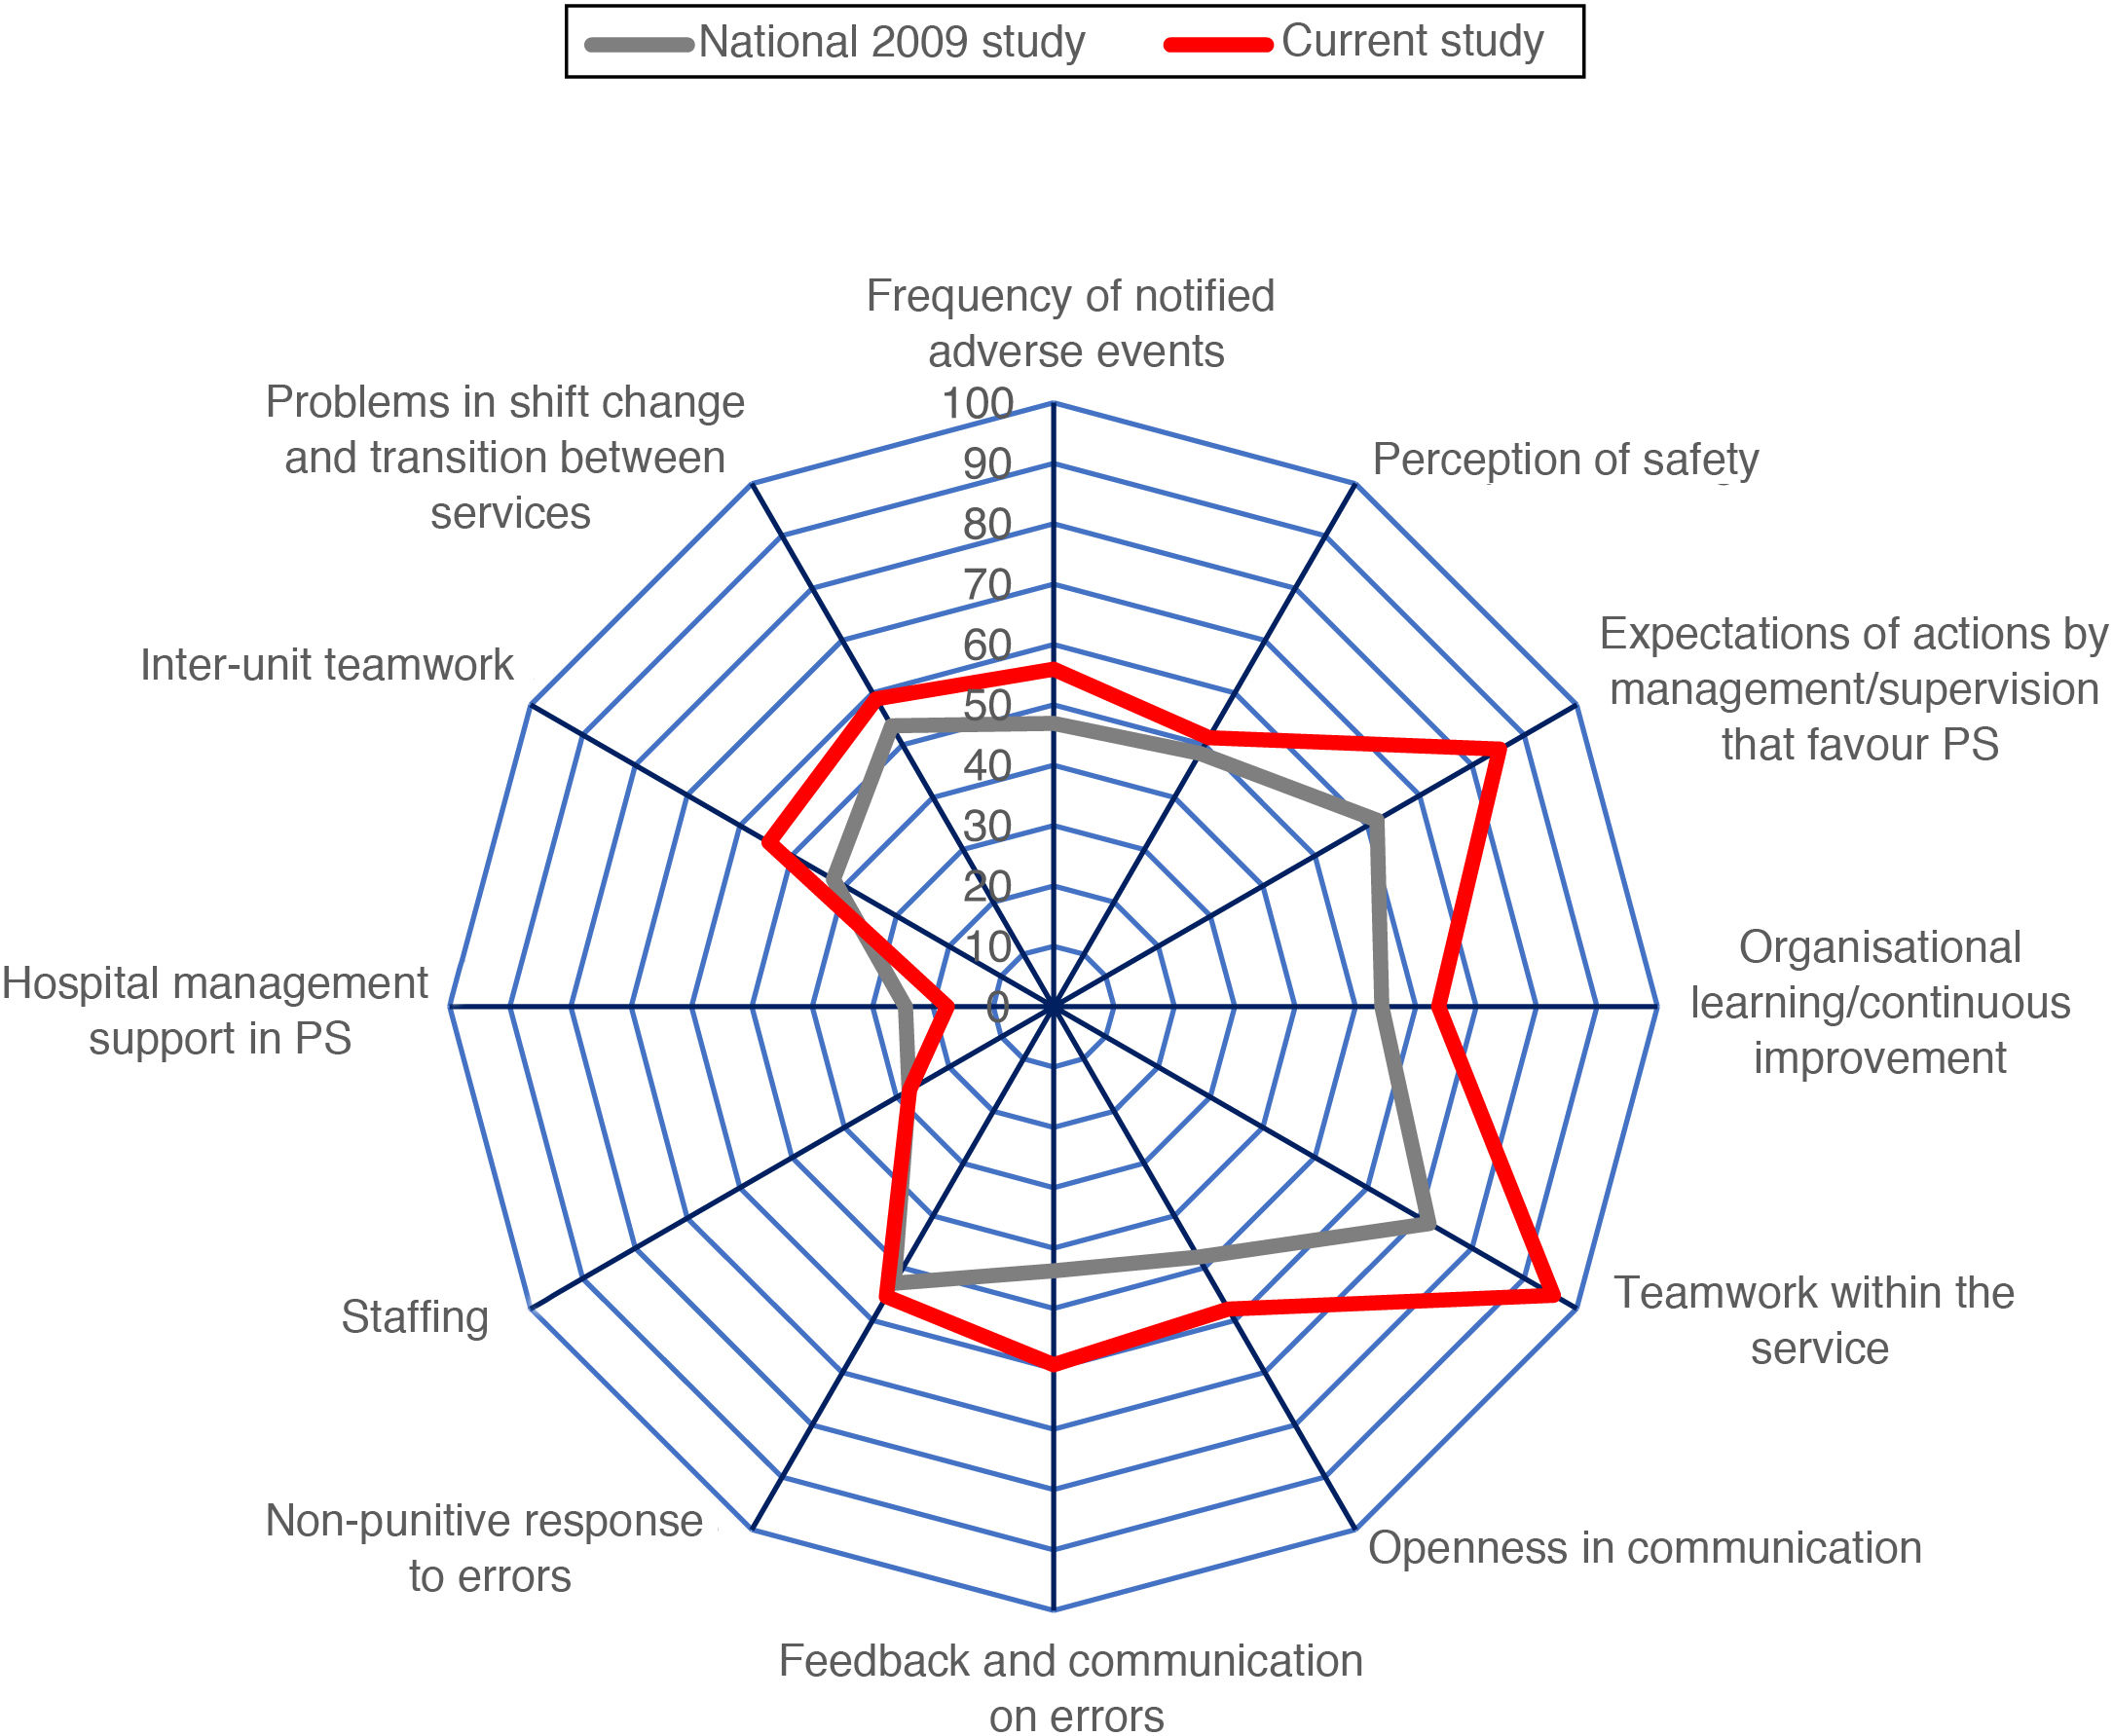
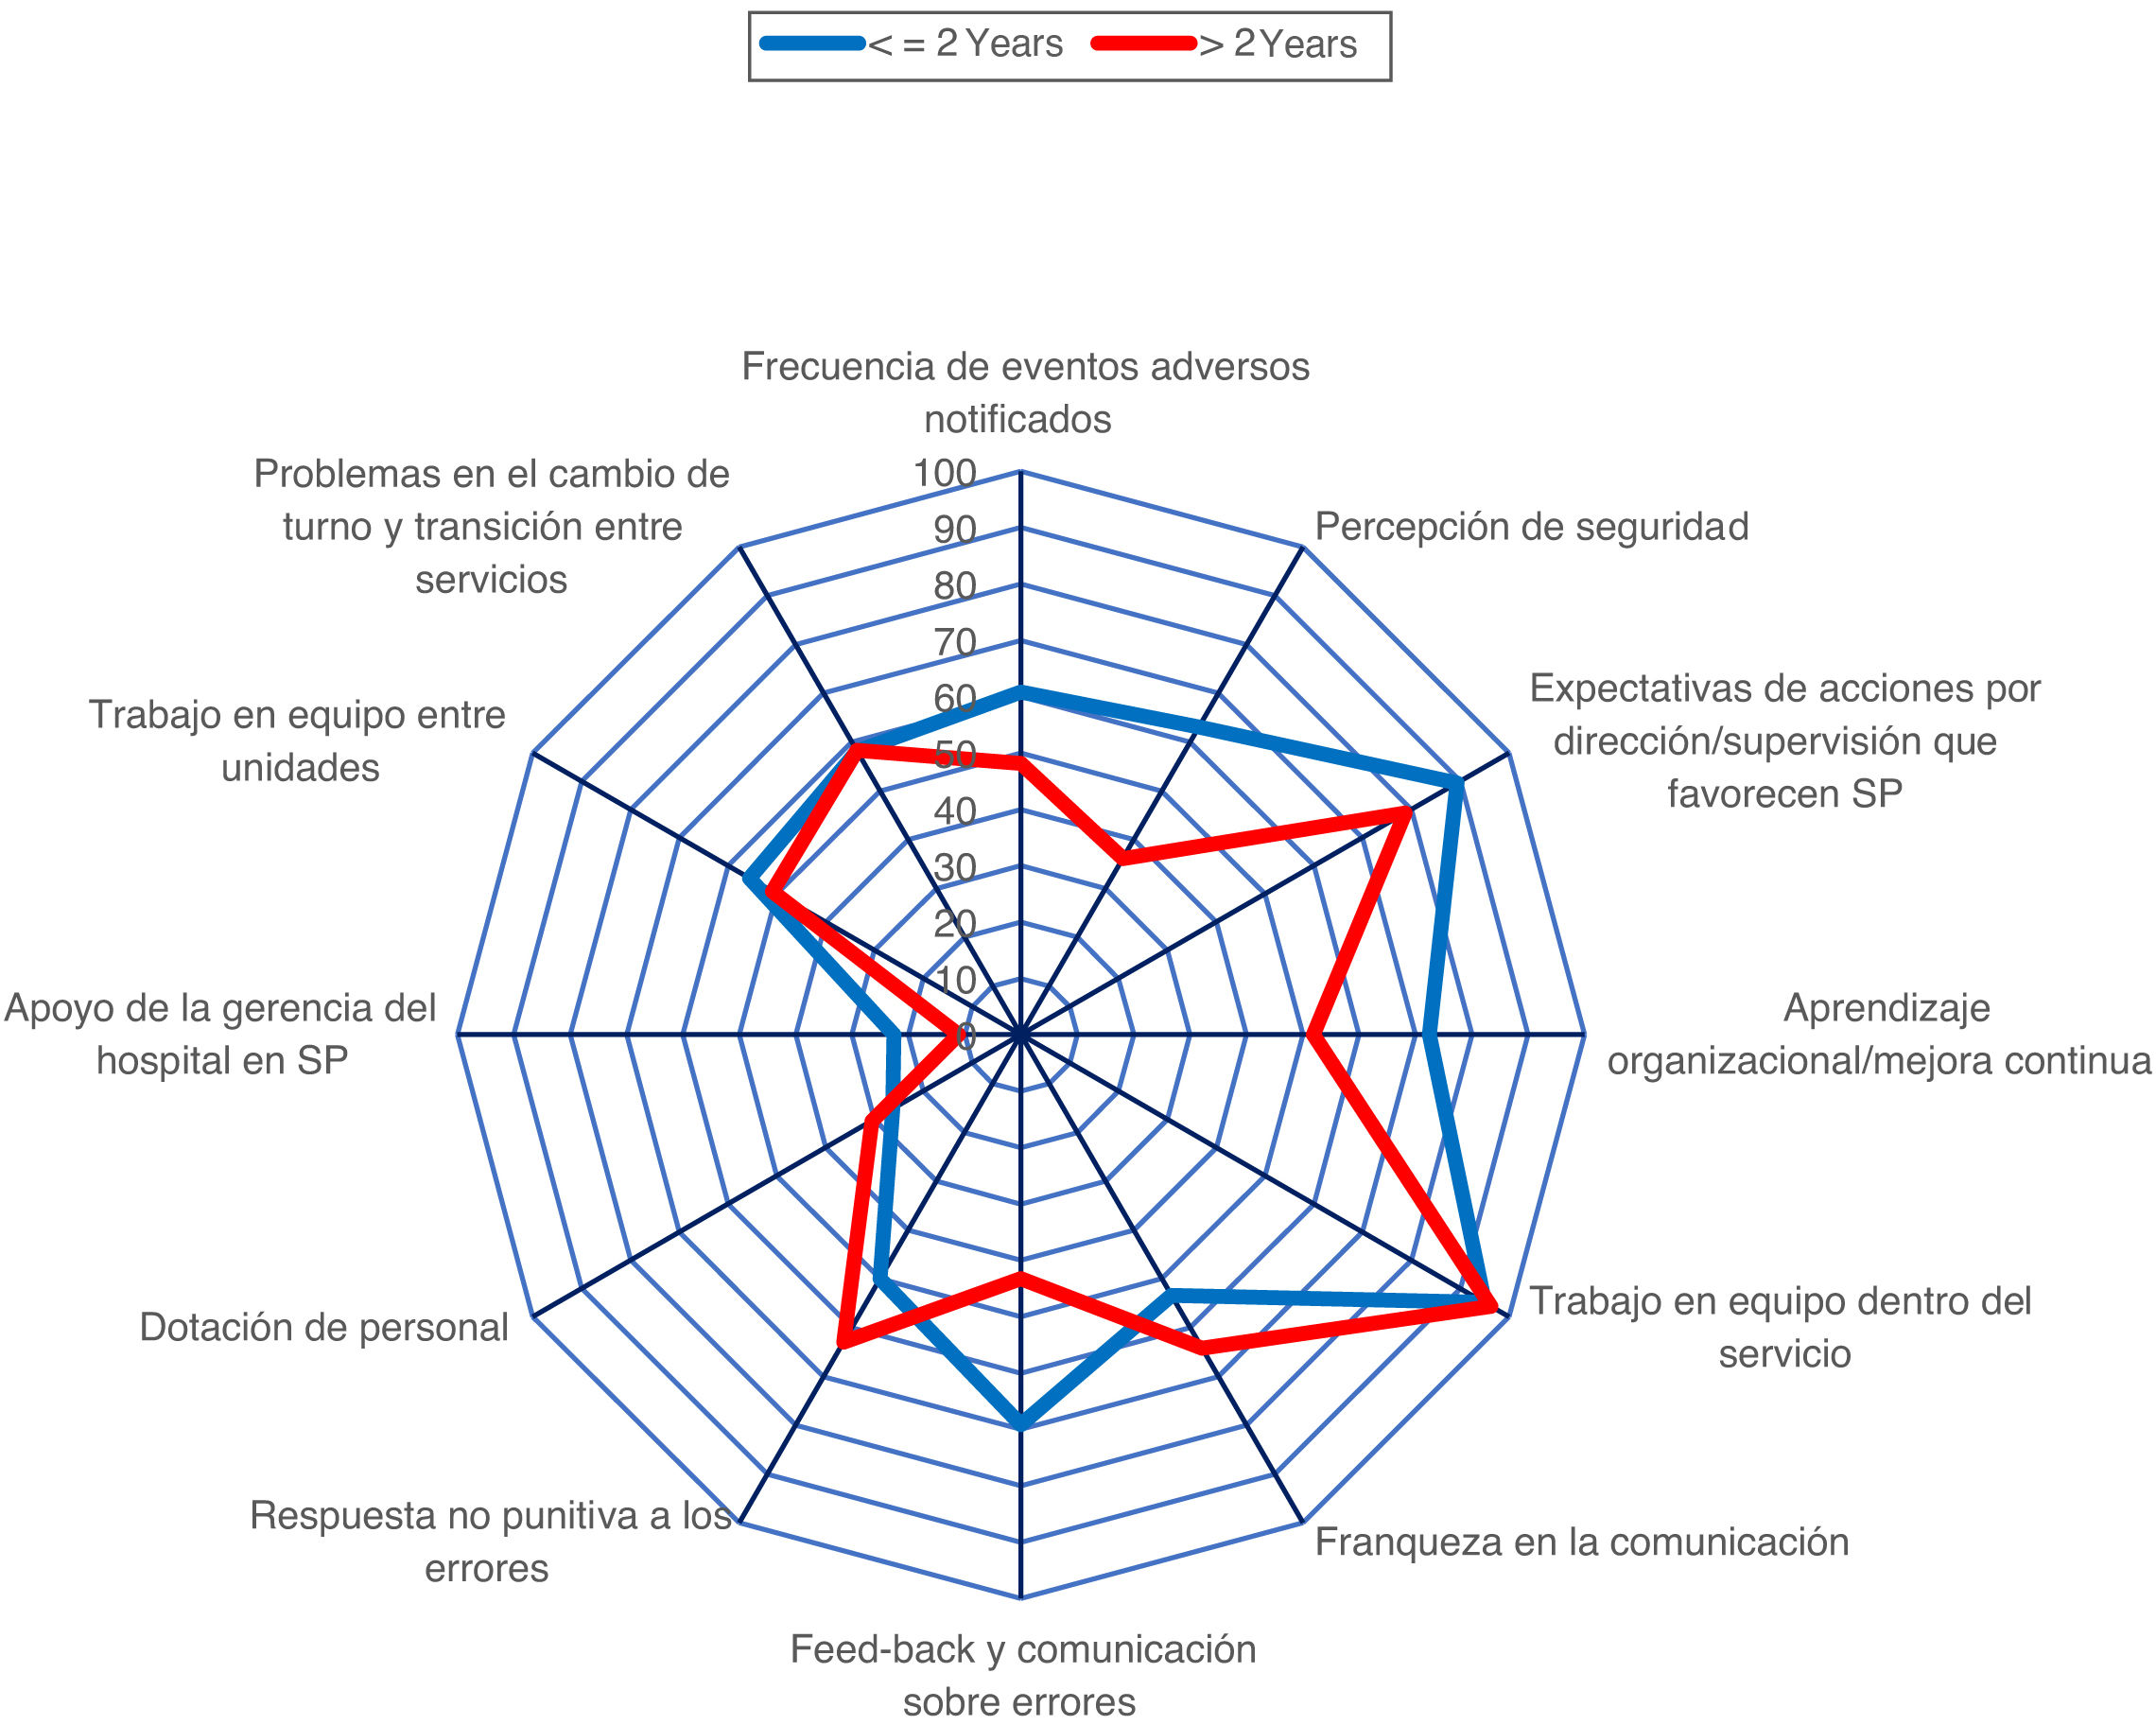
The percentages of positive responses of the different dimensions in our work and those described in the national study “Analysis of the patient safety culture in the hospital setting of the Spanish National Health System” published in 20097 were compared visually, with a radial graph and a table, with the idea of showing a trend between what was observed years ago in this national study and our current study, focused on the ICU; the absence of the individual data of the healthcare professionals in that work makes any mathematical analysis impossible.
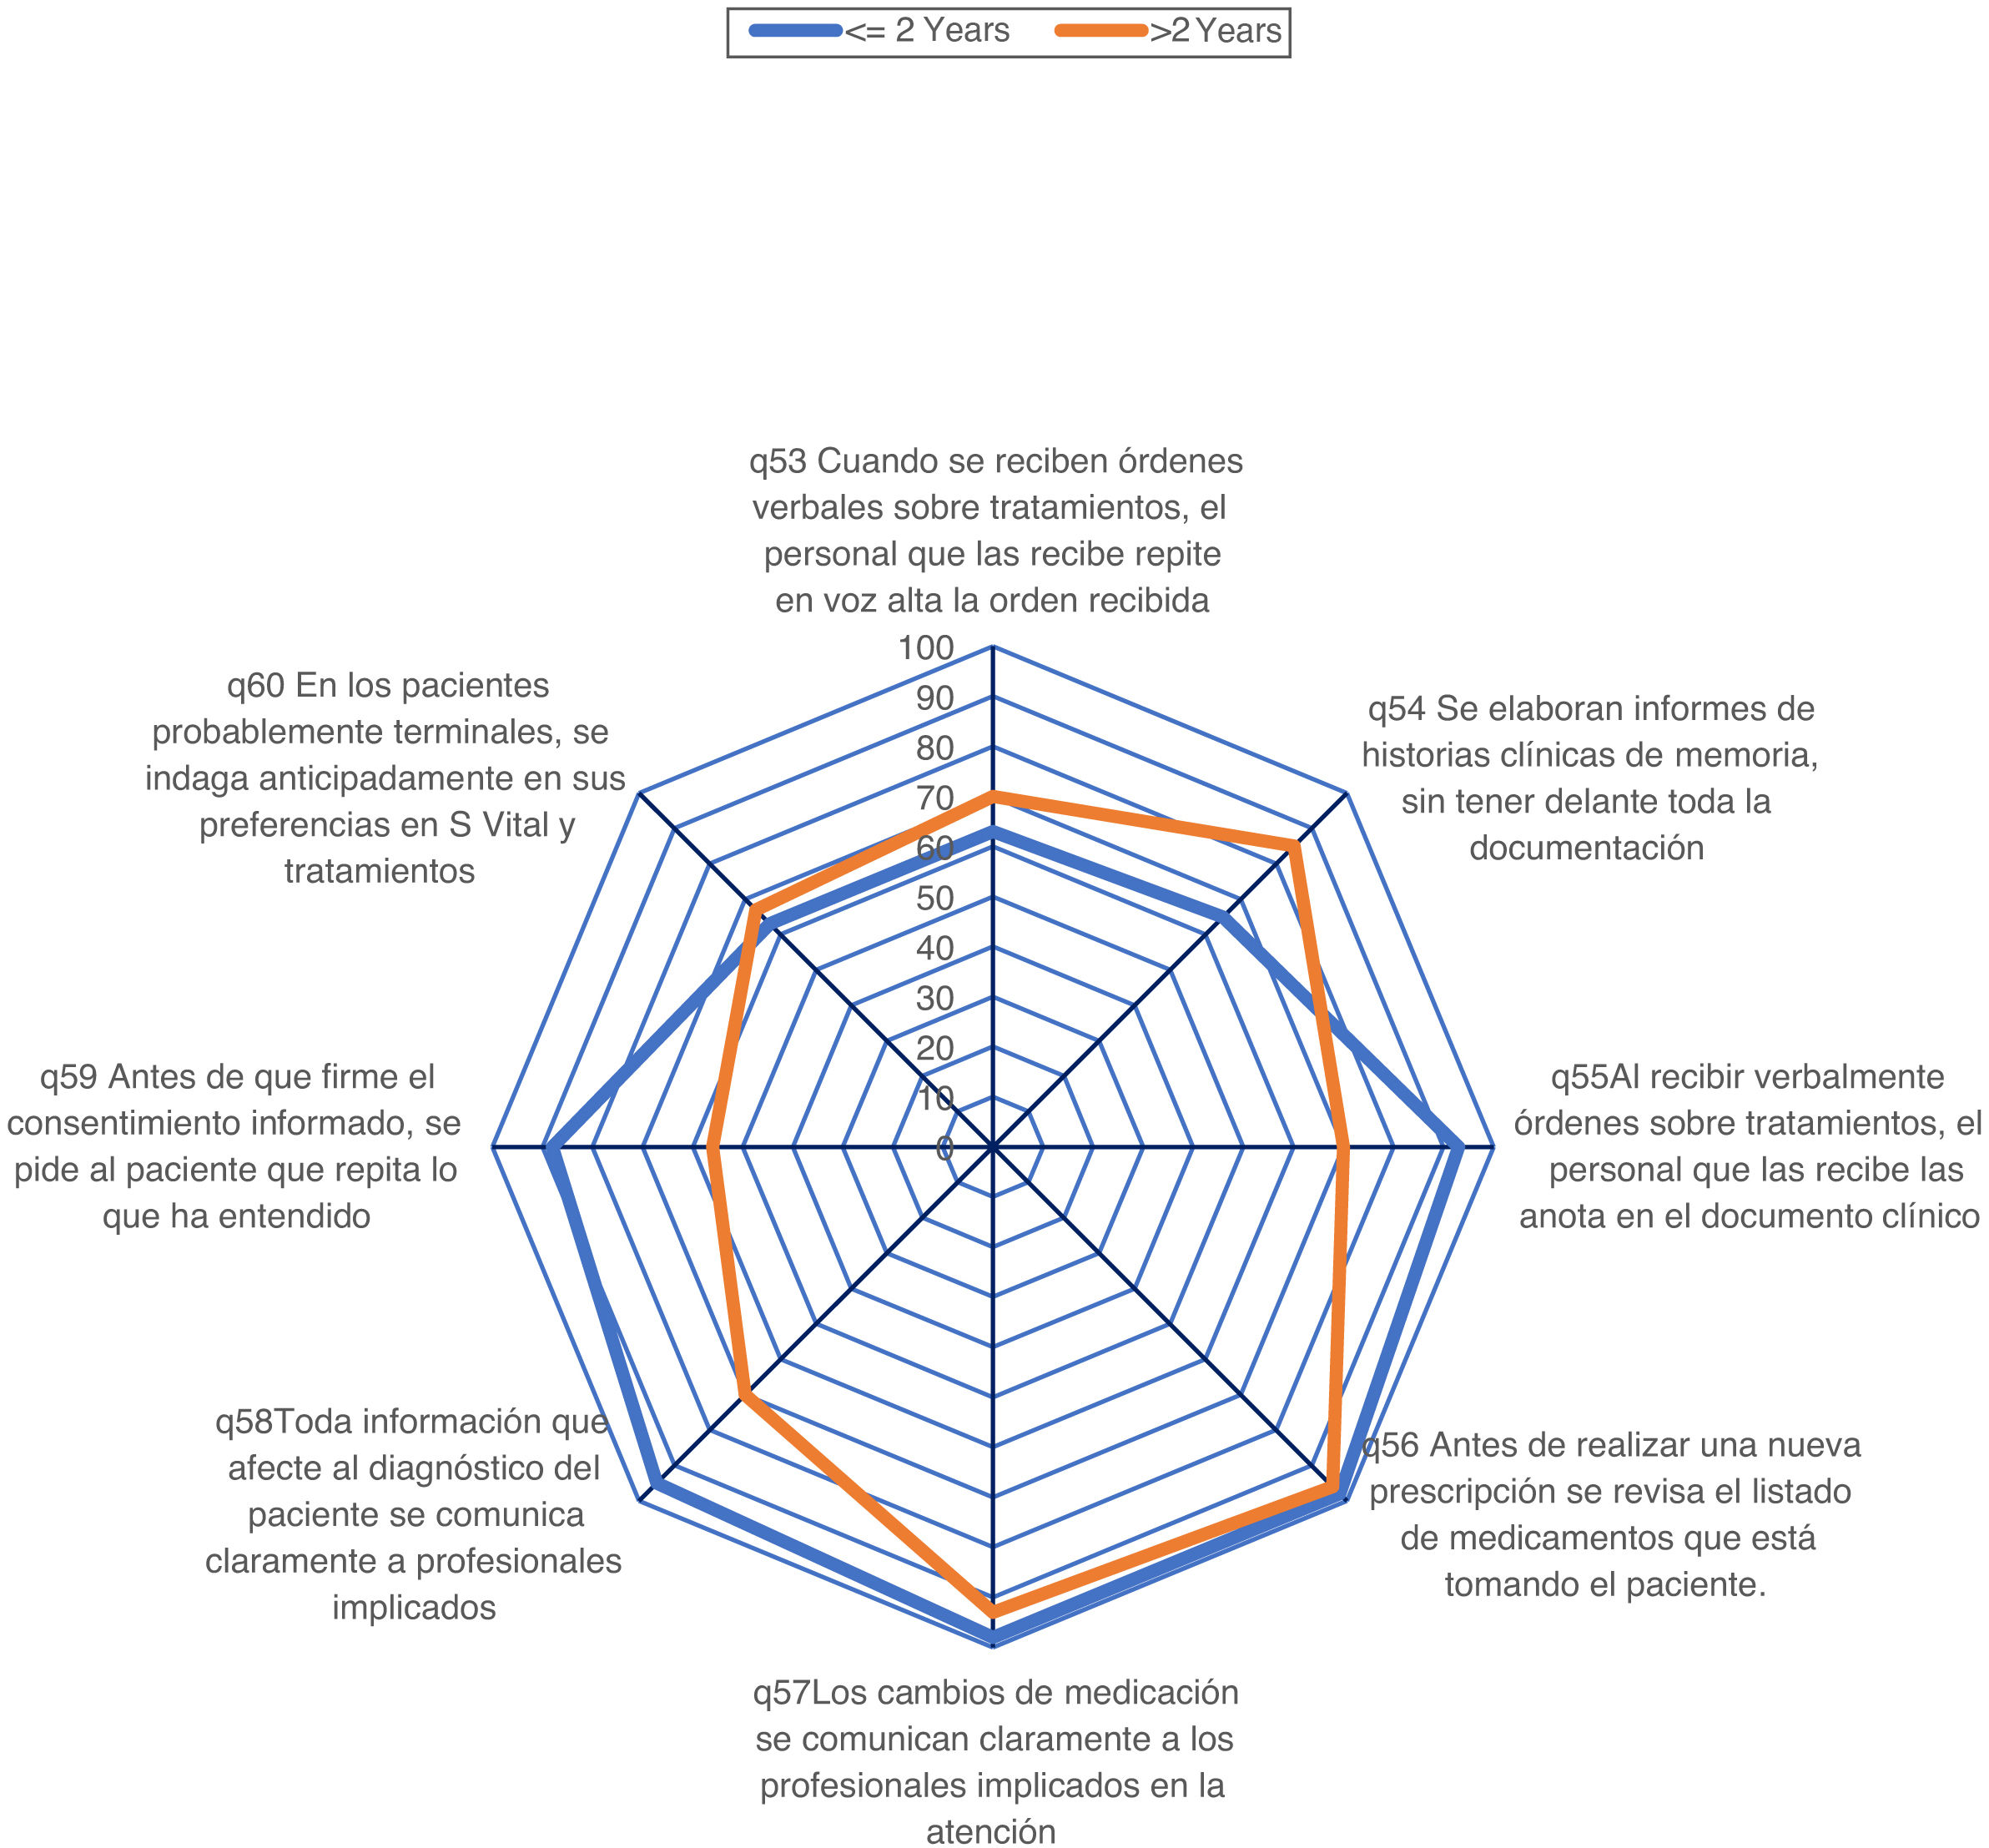
Other radial comparison graphs were also made, in the groups of workers with ≤2 years of seniority versus those with ≤2 years, of the point estimates in the different dimensions and of the scores of questions 53–60.
Data analysis was performed with SPSS v 15.0.
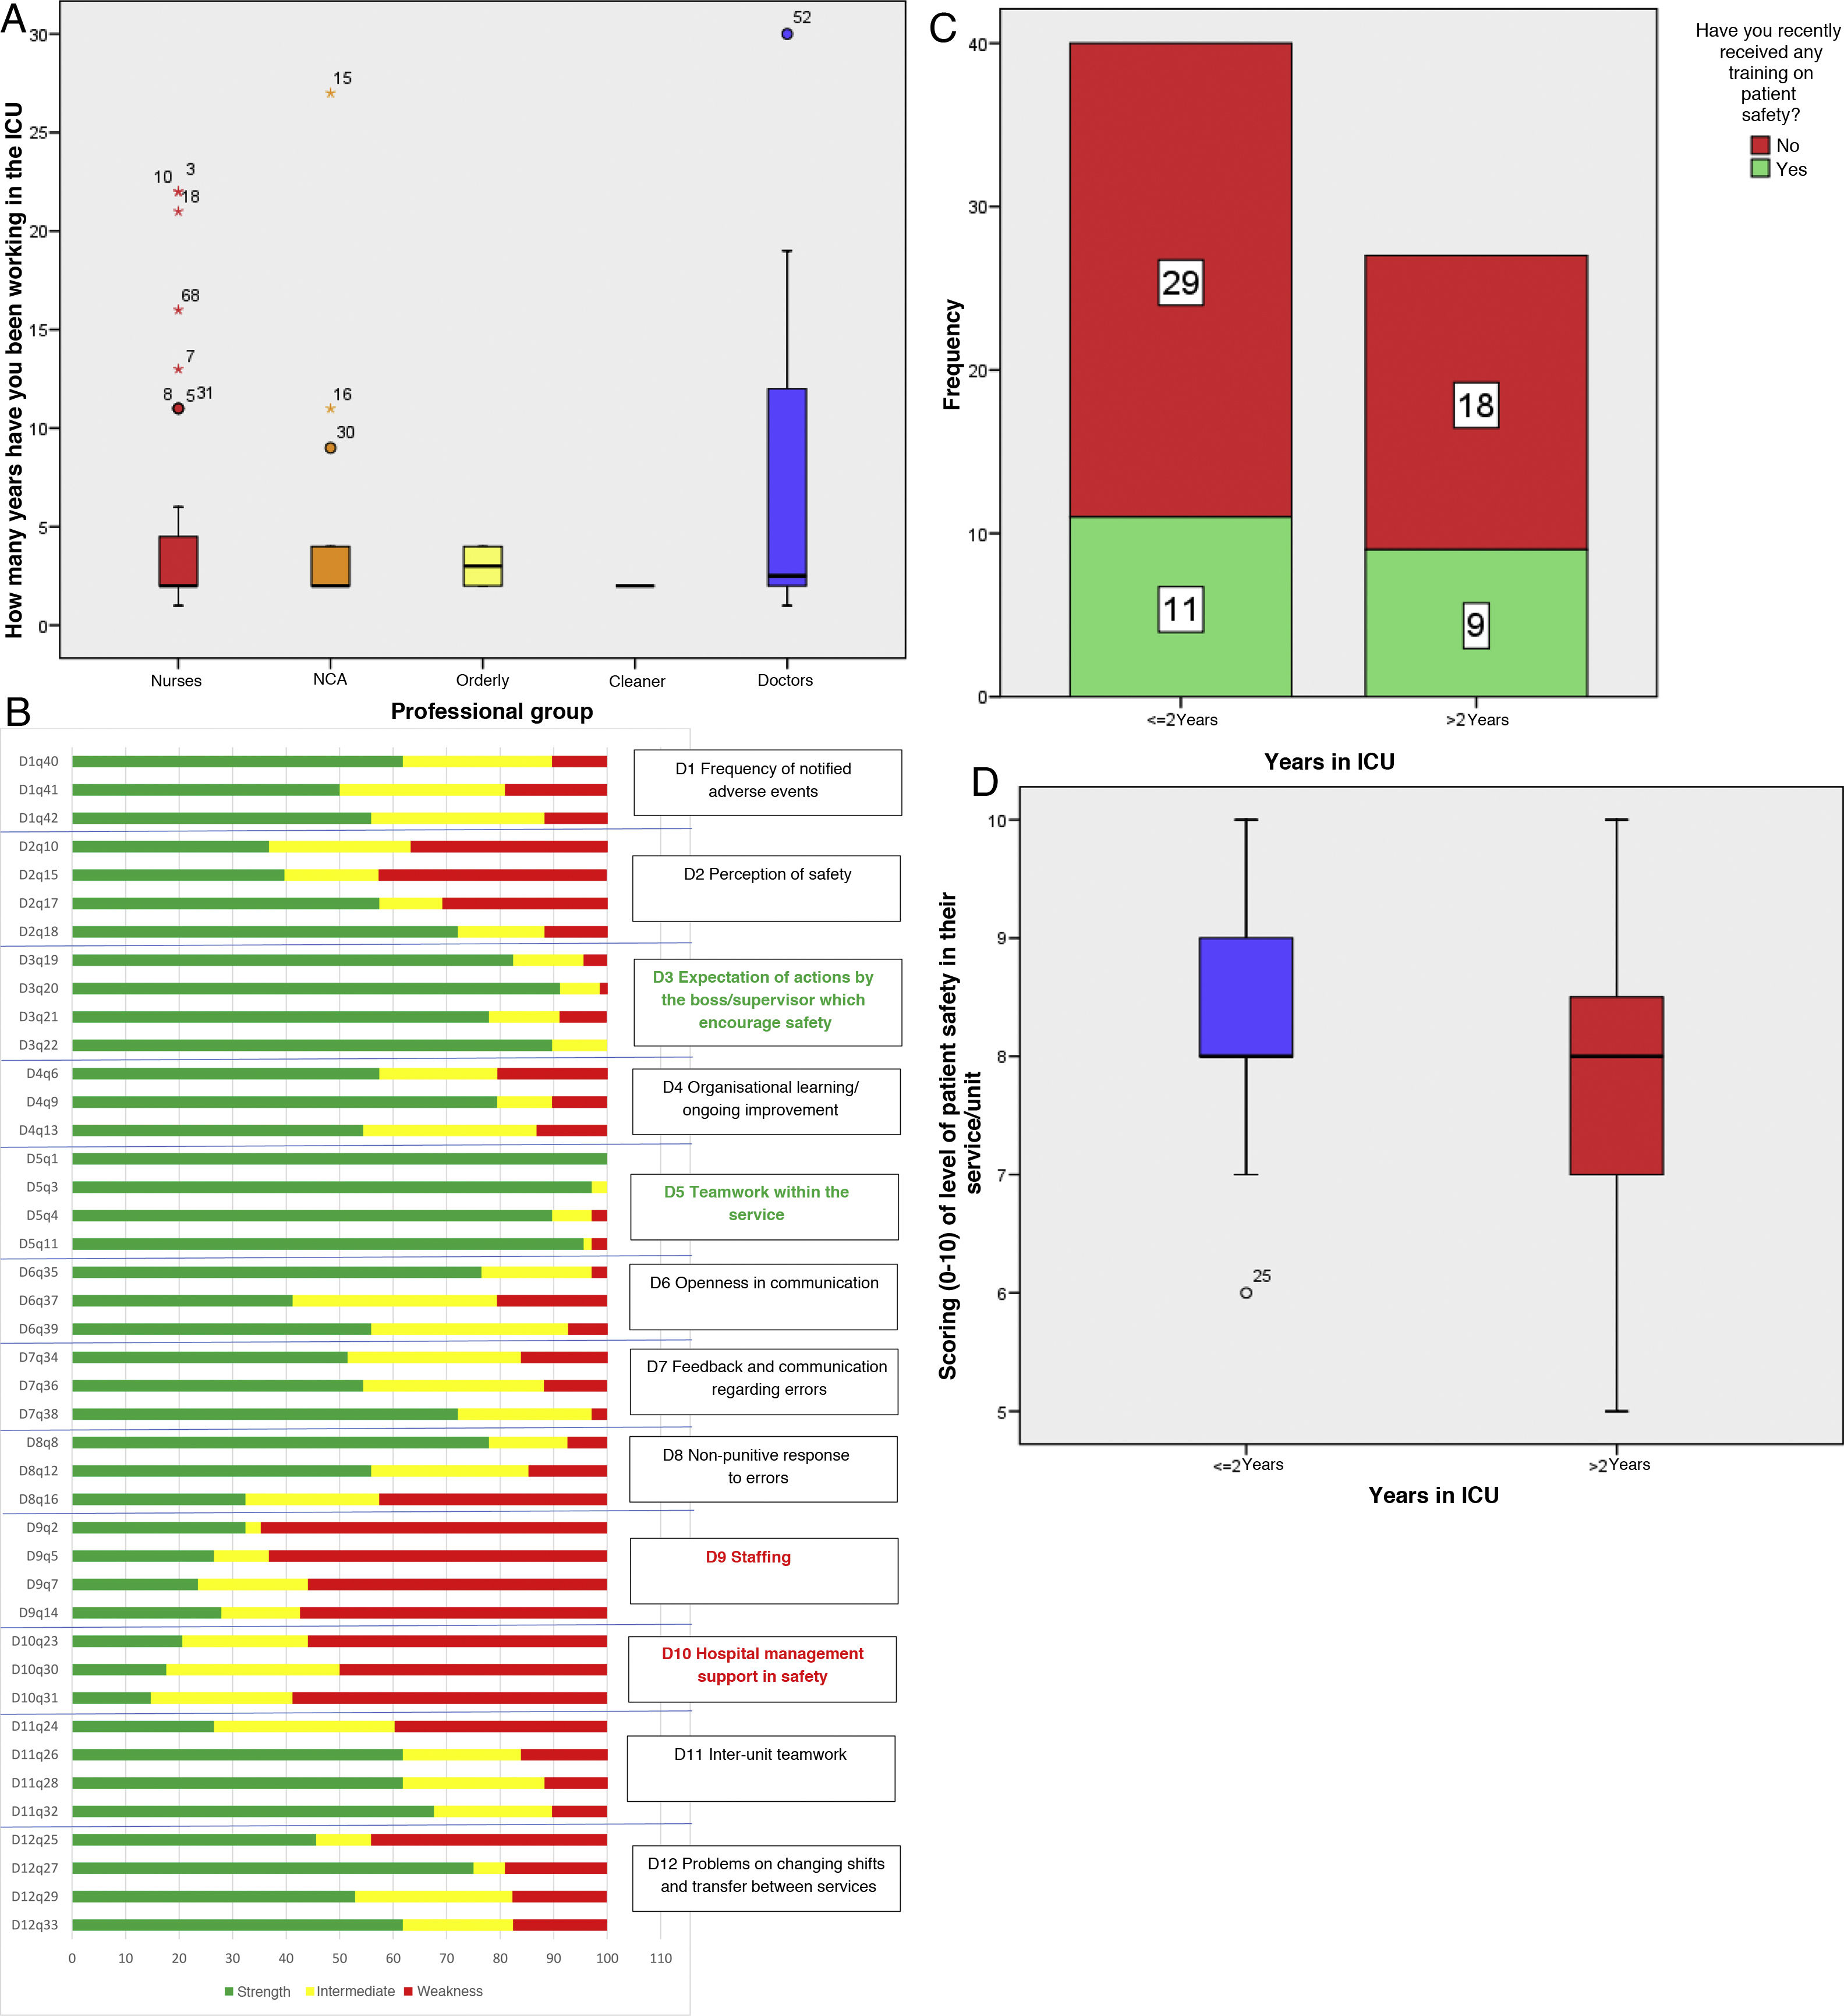
ResultsSixty-eight questionnaires were collected, answered by 50 women (73.5%) and 18 men, which corresponds to a response rate of 73.9%. There were 40 nurses, 14 nursing care assistants, 2 orderlies, 1 cleaning staff and 11 medical professionals. They have been working in their current profession for 12.79±11.09 years (median 7, IQR 4–18). They started working in our hospital 8.05±8.56 years ago (median 4, IQR 2–11). And they started working in our ICU 5.84±6.70 years ago (median 2, IQR 2–4.5). The distributions of length of service in the ICU of the different professional groups are similar (Fig. 2A).


A. Box plot with the ICU seniority distributions of the different professional groups. B. Stacked bar chart with the percentage of positive, intermediate and negative responses to the first 42 questions of the questionnaire ordered by dimensions. D12q33, Dimension 12 question 33. C. Stacked bar chart with the assessment of the professionals with/without recent training in patient safety and the greater/lesser seniority of the professional in the ICU. D. Distribution of the scores of the degree of safety of the professional in the groups of <=2 years and more than 2 years.
The working day is 33.26±8.06h (median 35, IQR 28–38). Up to 67 have direct contact with the patient (98.53%). In particular, 62 (91.18%) report not having reported any AE in the last year (3 reported one AE and one reported 2). Twenty-one respondents (30.88%) have received PS training in the last year. The unit’s safety rating is 8.06±1.16 (median 8, IQR 7–9).
The overall Cronbach’s α index is 0.814 and that obtained by eliminating each dimension one by one obtains similar values, between good (0.700–0.790) and excellent (≥0.800)9 (Table 1). With the data obtained, it can be affirmed that the questions in this questionnaire have adequate internal consistency.
Cronbach’s indices obtained by successively eliminating each Dimension from the overall estimate of consistency.
| Cronbach’s alpha is element eliminated | |
|---|---|
| Dimension 1 | 0.794 |
| Dimension 2 | 0.785 |
| Dimension 3 | 0.806 |
| Dimension 4 | 0.790 |
| Dimension 5 | 0.812 |
| Dimension 6 | 0.824 |
| Dimension 7 | 0.794 |
| Dimension 8 | 0.805 |
| Dimension 9 | 0.804 |
| Dimension 10 | 0.814 |
| Dimension 11 | 0.781 |
| Dimension 12 | 0.780 |
The percentages of the 42 positive, negative and neutral responses to the questions of the standardised questionnaire, arranged in 12 dimensions, are shown in Fig. 2B. The percentage is highly variable. Question 1 “The service supports each other” of dimension 5 “Teamwork within the service” has 100% positive responses; question 3 “When we have a lot of work, we all work together to get it done” of the same dimension 5 has 97.1% positive responses and 2.9% intermediate responses. On the contrary, question 31 “The hospital management only seems to be interested in patient safety when an adverse event has already occurred in a patient” of dimension 10 “Hospital management support for patient safety” has the lowest percentage of positive responses (14.7%). Question 2 “There are enough staff to cope with the workload” of dimension 9 “Staffing” has 64.7% negative responses. Question 37 “Staff can freely question decisions or actions of their superiors” of dimension 6 “Openness in communication” has the highest percentage of intermediate answers (38.2%).
The national study7 included responses from 6257 professionals, 6.4% of whom were ICU professionals (approximately 400 ICU workers from all over Spain) and includes a small subgroup analysis by services involved. Most of the differences between services were non-significant, except in several dimensions: teamwork (ICU had a high percentage of positive responses of 81%, higher than the overall 71.8%, although lower than our current assessment of 95.58%). Feedback and communication about errors (38.7% positive responses, a low value lower than the estimated mean of 43.8%, and also lower than our current assessment of 59.31%); and problems with shift change and transition between services, with 60.6% positive responses in ICU, a higher value than the average for all services of 53.7%, and analogous to our result (58.82%).
The comparison of percentages of positive responses for all the dimensions in our study compared to the national study9 is shown in Table 2, and Fig. 3.
Comparison of the percentages of positive responses in the 12 quality dimensions.
| Current study | National 2009 study | |||
|---|---|---|---|---|
| D1. 1. Frequency of reported AE's | 55.88 | 46.9 | W | |
| D2. Perception of safety | 51.47 | 48.4 | W | |
| D3. Expectations of actions by medical management or supervision of the service | 85.29 | S | 61.8 | |
| D4 Organisational learning or continuous improvement | 63.72 | 54.4 | ||
| D5 Teamwork within the service | 95.58 | S | 71.8 | |
| D6 Openness in communication | 57.84 | 47.9 | W | |
| D7 Feed-back and communication regarding errors | 59.31 | 43.8 | W | |
| D8 Non-punitive response to errors | 55.39 | 52.9 | ||
| D9 Staffing | 27.57 | W | 27.6 | W |
| D10 Hospital management support in patient safety | 17.64 | W | 24.5 | W |
| D11 Inter-unit teamwork | 54.41 | 42.1 | W | |
| D12 Problems in shift changes and transition between services | 58.82 | 53.7 |
Alzheimer’s disease: adverse events; S: Strength; W: Weakness.

Most of the dimensions have percentages of positive responses of between 50% and 70%. Two dimensions, the third “Expectations of actions by management or supervision of the department favouring patient safety” and the fifth “Teamwork within the department” can be considered strengths (percentages of positive responses of over 70%, specifically 85.29% and 95.58%, respectively). In contrast, dimension 9 “Staffing” and the tenth dimension “Hospital management support for patient safety” have percentages of positive responses well below 50% (27.57% and 17.64%), and are therefore considered weaknesses. The situation in the 2009 national survey was different, with a greater number of dimensions considered weaknesses (in addition to the 2 above, dimension 1 “Frequency of AE's reported”, dimension 2 “Perception of safety”, dimension 6 “Openness in communication” and dimension 7 “Feed-back and communication about errors”). The figure shows that, in general, the percentages of positive responses are higher in our study with one exception: dimension 10 “Hospital management support for patient safety” (17.6%, compared to 24.5% in the national study).
Fig. 4 (Pareto chart) shows that up to 54.88% of the negative responses are concentrated in dimensions 9, 12 and 2. In other words, efforts to improve our safety culture should place more emphasis on these 3 dimensions than on the remaining 9 dimensions.

The comparison of the percentage of positive responses to the 12 dimensions between ICU professionals with 2 years or less working in our service versus professionals with more than 2 years of seniority is shown in Fig. 5. The professionals in the most junior group have similar or higher percentages of positive responses than the most senior professionals in most dimensions. The differences in favour of the group with 2 years or less are statistically significant in dimension 2 (“Perception of safety”, 63.12% vs. 36.11%; p<0.001), in dimension 4 (“Organisational learning/continuous improvement”, 72.5% vs. 51.85%; p=0.017) and in dimension 7 (“Feed-back and communication about errors, 69.17% vs. 43.21%; p=0.006), and the difference appears clinically important, but does not reach statistical significance in dimension 1 ("Frequency of adverse events reported”, 60.83% vs. 48.15%). Conversely, the percentage of positive responses is higher in senior professionals in dimension 6 (“Openness in communication”, 53.33% vs. 64.19%) and 8 (“Non-punitive response to errors”, 50.00% vs. 62.96%), in both cases with differences that are not statistically significant, but may be clinically important.

The percentages of positive responses in questions 53–60 are depicted in Fig. 6. The percentages of positive responses are close to 70% (question 53 on verbal orders for treatment and question 60 on inquiring about preferences for life-sustaining or life-sustaining treatment in possibly terminally ill patients) and above 70% (i.e., strengths) in the remaining questions.

Subgroup analysis of the answers to these questions 53–60 according to their length of time in the ICU also shows some differences. Fig. 1 shows that the values of the less senior workers are generally higher than those of the more senior ones. The percentage of positive responses is higher in the group of those hired in the last 2 years in question 55 (“When orders are received verbally about treatments, care or procedures, the staff receiving them write them down in the corresponding clinical document”, 93% vs. 70%; p=0.031), question 58 (“Any information affecting the patient’s diagnosis is communicated clearly and promptly to all professionals involved in the care of that patient”, 95% vs. 70%; p=0.015) and question 59 (“Before the informed consent is signed, the patient or his/her representative is asked to repeat what he/she has understood from the explanations received about possible risks and complications of the intervention, examination or treatment involved”, 88% vs. 56%; p=0.006). On the contrary, the percentage is higher in the most senior patients in question 54 (“Reports or summaries of clinical histories are drawn up from memory, without having all the documentation [analyses, radiological reports, medication administered, etc.] in front of them”, 85% vs. 65%; p=0.055) and in question 53 (“When orders about treatments, care or procedures are received verbally, the staff receiving them repeat aloud the order received to the person issuing it, to ensure that it has been well understood”, 70% vs. 63%; p=ns).
The percentage of professionals with recent training in PS is lower among novices (27.5%) than among veterans (33.3%), although the difference is not statistically significant (Fig. 1C). The PS grade score in our unit is higher among veterans than among novices (8.33±.97 vs. 7.67±1.33), with a statistically significant difference (p=0.22, Fig. 1D).
DiscussionThe results of our study are striking. The perception of the PS climate in our unit at the present time seems better than the overall perception of the PS climate in hospital services throughout Spain in 2009. This perception, as reflected in the percentages of positive responses to the different dimensions of perception of the culture of PS in our department, are, in general, higher than those obtained in the national survey conducted in 2009, to the extent that the 7 dimensions that in the previous study were considered weaknesses have been reduced to only 2 (“Staffing” and “Support from hospital management in safety”), although with percentages far from 50%. 91.2% of workers have not reported any AE in the last year (a very low figure; in the national study, the percentage of professionals not reporting was 77.8%). The PS culture score is somewhat higher than in the national study (median 7, IQR 6–8 in the latter). And one last point of interest, only 30.88% of respondents received PS training in the last year.
The interpretation of these results is subject to several elements. The work was carried out in the ICU of a second level hospital after the end of the third wave of the COVID-19 pandemic. The healthcare personnel had to adapt their work dynamics in response to the enormous increase in the care load and the lack of knowledge and the risks that this has entailed. It is these adaptations that, to a greater or lesser extent, affected the monitoring of some of the protocols with which they had been working on patient safety, such as the Zero projects (Bacteraemia, Pneumonia, Resistance, UTI).10 For all these reasons, and now that the most critical periods of the pandemic have passed, it is time to analyse the perspective on the safety culture of ICU staff in order to identify our strengths and weaknesses and thus focus our future training actions on enhancing the positive and minimising the negative. Another important fact is the arrival of many workers who had not worked in the ICU or in our ICU, with a 75th percentile of seniority in the ICU of 4.5 years (in the national study, 36.5% of workers had been in their current service for 5 years or less). This figure, similar to that of ICUs throughout Spain in our recent situation, may partly explain the results obtained. Finally, the psychometric item chosen, the HSOPS questionnaire, was designed to assess the perception of safety culture in a hospital environment in a generic way. Other tools, such as the Safety Attitude Questionnaire ICU Version (SAQ-ICU)11 or the Standford PSCI Culture Survey12 apparently assessed the culture of PS in the ICU in a more specific way. However, although certain elements of daily work in the ICU may be inappropriately assessed with the HSOPS, this questionnaire allows the assessment of the perception of PS culture in other hospital services, with specific measures for the promotion of PS in the different hospital services.
Several studies developed in Spanish hospitals with the same questionnaire (Laborde, developed in the entire environment of a tertiary hospital in Valencia; Muñoz, with data from primary care and hospital and Jaraba, among family medicine residents)13–15 showed results quite similar to those of our work, with low scores in dimensions 9 (“Staffing”), 10 (“management support for PS”), 8 (“Non-punitive response to errors”) and 1 (“reporting of AE”). The national study with which we compared our results (2009) had a similar objective to ours: to assess the perception of the culture of PS in different hospital services in many hospitals in Spain. This study was used as a benchmark for comparison because it is a study, developed under the auspices of the University of Murcia and with the approval of the Ministry of Health, and is considered a reference when it comes to assessing the culture of PS in the hospital setting.
Several relevant data stand out which may be understood as weaknesses or aspects of the perception of PS that need to be improved. A low level of AE reporting has been observed over the last year. We could relate this result to several aspects: the lack of established protocols for the communication of an AE or the lack of knowledge regarding them; the lack of an environment and culture of openness in which the transmission of this information is encouraged and appreciated and the individual is not blamed for doing so, etc.16 In relation to these concepts, we have detected another relevant fact: the new workers in our unit (less than 2 years working) show high percentages in the dimensions related to beliefs regarding the punitive consequences they could have after communicating an AE and openness in communication; emphasis should therefore be placed on creating an environment of trust that helps to banish these erroneous thoughts.
The respondents’ perceptions of staffing and support from the hospital management or leadership are also weaknesses. We might think that there is a certain relationship between both aspects and that these, in turn, have been influenced by the conditions endured by the staff during this pandemic period, circumstances such as the high pressure of care, inexperience and fear of an unknown virus, the pressure of compromising socio-familial health, the incorporation of committed but inexperienced reinforcement staff, obsolete infrastructures, etc. For all these reasons, and without forgetting the difficulty that must have been involved in managing a health emergency situation such as the one experienced over the past year, these results are a reflection of the desire of the healthcare professionals for a greater proactive presence of the senior management, promoting closer communication, which not only encourages greater involvement of the hospital management in the problems or weaknesses detected in the unit, but also the creation of working groups, committees, etc., whose main objective is to make the culture of PS the hallmark of the quality of our hospital.
With regard to the strengths detected, we can highlight the importance of teamwork in the staff of our ICU.17 If we consider teamwork as the coordination of 2 or more workers in achieving our common goal of patient welfare, the staff of this unit have shown, through the high score in this section, that teamwork may be the cornerstone on which to build an effective and efficient PS culture, that seeks to achieve the highest standards of quality. However, it is fair to note that the high score in the dimension of “expectations or trust conveyed by the management or supervision of the unit to its workers” may have been one of the key elements in improving teamwork. One might think that this is due to the fact that this is a second-level hospital with fewer staff and greater proximity. However, it should also be noted that in the last two years there has been an exponential increase in the number of new staff. Maintaining teamwork as a strength can therefore be considered a very good result on which to continue working for patient safety.
With regard to our study limitations, it has been mentioned that the questionnaire selected is not specific to an ICU setting, but consists of many general questions, which may have hindered the assessment and integration of the staff consulted in their day-to-day professional life. This questionnaire does not include aspects related to invasive diagnostic or treatment techniques, catheter or probe insertion procedures, the double check in the preparation of vasoactive drugs or sedation, or aspects as significant as the safety and well-being of the sedated patient.
Another limitation of our work could be the time period in which the study was carried out, at the end of the third wave of the COVID-19 pandemic. It would therefore be advisable to repeat this study one or two years after the complete end of the SARS-CoV-2 pandemic, in order to compare the influence that the health situation experienced has had on the unit's staff perception of the PS culture.
Another factor that may limit the validity of our work is non-response bias, i.e., that the population that does not respond to the questionnaire perceives real quality problems in our unit and feels inhibited in expressing this judgement and decides not to answer our questionnaire. The questionnaire was not compulsory and several reminders were sent out about the importance of responding to it. Another related fact is that all the questions in the questionnaire were compulsory; all the questions were answered in each of the questionnaires, but the absence of the possibility of leaving the question blank may have conditioned the final answer chosen to some extent.
Our study does, however, have several positive elements. It is a study that was developed to assess the perception of the PS culture in an ICU after the end of the third wave of the COVID-19 pandemic, with the need to restart the usual procedures in our patients, after the time of maximum care pressure and psychological tension that this pandemic has entailed. In this sense, it is an original study; we have not found any other published work with a similar approach to ours. The high response rate, over 70%, also indicates that the data obtained are fairly representative of the opinion of ICU workers as a whole at the time of the survey. The possibility of repeating this study in other departments would make it possible to compare the late effect of this overpressure of care in different hospital settings. Repeating it in our ICU after the end of the pandemic may also yield interesting data.
ConclusionsThe perception of PS in the ICU of our second-level hospital after the end of the third wave of the COVID-19 pandemic is adequate, with estimates in general somewhat more positive than those obtained in the national study on hospital safety culture in 2009. The proposals for improvement in our department, based on our study, follow 2 directions: rationalising the staffing and organisation of personnel and the way in which they work, and making the hospital management's promotion of PS more visible.
FundingThis study was undertaken without receiving any subsidy, grant or financial support.
Conflict of interestsThe authors have no conflict of interests to declare.
The authors would like to thank the staff of the ICU of the Hospital de Sagunto for their enormous enthusiasm and good work during the different waves of COVID-19 and for their participation in this study.