


Childhood obesity is an extremely prevalent pathology and, in order to be able to address it, it is necessary to understand the factors that influence on its genesis and maintenance. We hypothesise that the timing of meals and sleep, the regularity of these throughout the week and a sedentary lifestyle influence the degree of obesity.
Material and methodsWe included children and adolescents with obesity who attended a first check-up visit at the Childhood Obesity Unit between January 2018 and February 2020. The data were obtained from a questionnaire on food (36-h intake, frequency of consumption, eating times and habits) and sleep.
ResultsThe degree of obesity was influenced to a greater extent by later meal times and the distribution of calories throughout the day (less at breakfast, more at dinner) than by the total number of calories ingested. In addition, a lower consumption of vegetables was related to a higher degree of obesity. The difference between the hours of sleep at weekends and on weekdays correlated positively with a higher degree of obesity. Finally, the anthropometric data correlated negatively with the number of hours of physical activity. Almost half of the children did not exercise after school.
ConclusionIn the approach to childhood obesity, it is necessary to include recommendations on the regularity of meal and sleep times, as well as the distribution of calories throughout the day. Additionally, it is necessary to encourage the practice of physical exercise.
La obesidad infantil es una patología extremadamente prevalente y para su abordaje es necesario profundizar en los factores que influyen sobre su génesis y mantenimiento. Hipotetizamos que el horario de comidas y sueño, la regularidad de los mismos a lo largo de toda la semana y el sedentarismo influyen en el grado de obesidad.
Material y métodosSe incluyen niños y adolescentes con obesidad atendidos como primera revisión en la consulta de obesidad infantil entre enero del 2018 y febrero del 2020. Los datos se obtuvieron de un cuestionario sobre alimentación (ingesta de 36 h, frecuencia de consumo, horarios y hábitos de ingesta) y sueño.
ResultadosEl grado de obesidad se encontraba influenciado en mayor medida por los horarios de las comidas más tardíos, la distribución calórica a lo largo del día (menos en desayuno, más en cena), más que por el número total de calorías ingeridas. Además, el menor consumo de verduras se relacionaba con mayor grado de obesidad. La diferencia del número de horas que se duerme entre los fines de semana y días laborables correlacionaban positivamente con mayor grado de obesidad. Finalmente, los datos antropométricos se relacionaban negativamente con el número de horas de deporte. Casi la mitad de los niños no realizaba ejercicio extraescolar.
ConclusiónEn el abordaje de la obesidad infantil es necesario incluir recomendaciones sobre regularidad de horarios de comidas y sueño, así como de la distribución calórica a lo largo del día. Adicionalmente, es necesario fomentar la práctica de ejercicio físico.
In recent decades, there has been a notable increase in the prevalence of obesity in the paediatric age group, constituting an important public health problem. In this regard, a multinational study has shown that the prevalence of obesity has gone from 0.7% to 5.6% in girls, and from 0.9% to 7.8% in boys, between 1975 and 2016 in the 5–19 years age group.1 Spain is among the European countries with the highest percentage of childhood obesity in children aged 6–9 years,2 with an alarming prevalence of severe obesity in this age range standing at 4%.3 These worrying data have been associated, on the one hand, with the growing economic development and food industry, which has led to an increase in the consumption of diets with a higher energy content and saturated fats and, on the other, with a trend towards a more sedentary way of life.4
Obesity is a complex disorder which is caused by an imbalance between energy intake and expenditure, generating an increase in adipose tissue.5 Said fatty tissue acts as a true endocrine organ, secreting adipokines that regulate different metabolic processes. In this way, the alteration in the functionality of adipose tissue, changing the pattern of synthesis and secretion of different adipokines, contributes to the generation of a state of low-grade chronic inflammation.6 All this predisposes to the appearance of different comorbidities.7
Genetic, environmental and behavioural factors participate in the aetiopathogenesis of obesity. Thus, different lifestyle habits, such as the type of diet and physical exercise, play an important role in the onset, maintenance, and degree of obesity in children.5 In recent decades, other factors that could influence the pathophysiology of obesity, such as sleep, have been studied. This has resulted in sleep being considered as a variable to take into account in the aetiology of obesity, since the duration and quality of sleep have been related to the degree of obesity.8 In this sense, sleep deprivation could influence the development of excess weight in various ways: increasing intake, decreasing physical activity during the day, and acting on hormonal mediators such as leptin or insulin.9
In addition, the greater knowledge of the regulation of circadian rhythms, as well as their molecular bases, has made it possible to advance in the knowledge of the pathophysiology of obesity and its metabolic complications, which could be influenced by both the chronotype and the alterations of the circadian rhythms (chronodisruption).10 In this way, changes in meal times have been related to the appearance of excess weight.11 Thus, in recent decades, the influence of the timing of the intake of certain foods, as well as the individual’s biological rhythms, on the maintenance and success of diets to lose weight has been investigated.12
Taking into account that obesity is related to the appearance of different comorbidities already in childhood4 and that childhood obesity has a high probability of persisting into adulthood,13 we can consider excess weight in early childhood as a metabolic and cardiovascular risk factor. However, there is also the possibility that some overweight children reverse this state and reach adulthood with a normal weight. This group of subjects considerably reduces the risk of cardiovascular disease.14 Everything described above highlights the importance of an early approach to this pathology.
The current treatment of childhood obesity is based on a multidisciplinary intervention that focuses primarily on the content of the intake. Other recommendations focus on reducing a sedentary lifestyle, involving the family in the treatment and evaluating and acting on the child’s psychosocial sphere.15 In this approach, we think that other less explored variables that influence both the appearance and the perpetuation of obesity should be included. For this reason, we set out to study the possible relationship of the patterns of food intake, exercise and sleep with the anthropometry of children and adolescents with obesity.
Material and methodsType of studyDescriptive study of patients diagnosed with childhood obesity between January 2018 and February 2020 under follow-up in a Childhood Obesity Unit of a tertiary university hospital in Madrid.
Calculation of the sample sizeThis was carried out using the Ene 2.0 sample size calculation program (UAB, Spain). In this way, to study the possible relationship of dietary intake, exercise and sleep patterns with anthropometric data, assuming that the expected correlation is ≥0.2, with a statistical power β of 70% and a level of significance α of 5%, it would be necessary to include a minimum of 115 subjects. It should be made clear that an expected correlation ≥0.2 was selected because it is the minimum value from which, in our experience, significant differences (p < 0.05) are obtained in the correlation analysis between quantitative variables. On the other hand, the choice of a statistical power β >70% would have required a much larger sample size, which we thought was not necessary for the objectives of this study.
Inclusion criteriaChildren between 6 and 18 years of age with a body mass index (BMI) above +2 SDS according to the Spanish reference tables of the 2008 cross-sectional study,16 without chronic disease prior to the diagnosis of obesity, nor chronic therapy with corticosteroids, antidepressants, antipsychotics and/or antiepileptics, who filled out a questionnaire on lifestyle habits in relation to obesity (Appendix A Annex 1).
Study variablesDemographic variables: age (years), sex.
Anthropometric data: weight (kg), height (cm), BMI (absolute value and z-score for age and sex, according to reference tables16) and waist (cm and z-score, according to reference tables17).
Pubertal stage: according to Tanner’s classification.18,19
Body composition: fat mass (% and kg) measured by impedancemetry (Tanita 3000®, Tanita Corporation, Japan).
Food intake: data obtained from the survey given to the patients (Appendix A Annex 1). The survey was given, and explained in detail, at the first visit to both the patient and the family members by members of the Paediatric Endocrinology Unit. Subsequently, once completed, the results were always reviewed by the same physician of the team (TGP). After analysing it, the family were informed and, if necessary, asked to provide any additional information.
Intake pattern: number of meals per day, time at which each meal is taken, snacking between meals, repetition of dishes, screens while eating.
: the survey recorded the intake of 72 consecutive hours and a survey of consumption frequency. Using the nutritional information on food labels, the BEDCA database and the APP Lifesum® (Lifesum AB, Sweden) data on average daily caloric intake were extracted from the 72-h intake record, as well as the amount and mean daily proportion of protein, carbohydrate (distinguishing fibre and simple sugars) and fat (distinguishing saturated and unsaturated) intake. The frequency of consumption of 46 types of food was also recorded on a numerical scale from 1 to 7.
Time of average caloric intake: with the data obtained from the meal times and the calories ingested in each of them, this variable was calculated, which refers to the time of day at which half of the total daily calories are consumed.
Exercise: number of weekly hours dedicated to exercise, both at school and out of school, and lifestyle categorised as sedentary, moderate or active, according to the parents, regarding the leisure activities they do their spare time.
Sleep: data obtained from the questionnaire in which the bedtime, the time it takes to fall asleep, the presence and number of awakenings, the get-up time and the subjective quality of sleep were recorded, differentiating between weekdays and holidays (Appendix A Annex 1).
Statistical analysisQuantitative variables were expressed as means and 95% confidence interval. Qualitative variables were expressed as numbers and percentages.
The Kolmogorov–Smirnov test was used to assess the normality of the quantitative variables. The comparison between qualitative variables was made using the χ2 test. For the comparison of quantitative variables between two unrelated groups, Student’s t test was used for parametric variables and the Mann–Whitney U test for non-parametric variables. For the comparison between three or more groups, ANOVA was used for parametric variables and the Kruskal–Wallis test for non-parametric variables. The correlation between variables was analysed using Pearson’s correlation coefficient for parametric variables, or Spearman’s for non-parametric variables.
The difference was considered significant when p < 0.05. For the statistical analysis, we used the SPSS program, version 25.0® (IBM Corp., Armonk, NY, USA).
Ethical-legal considerationsThe study was approved by the Research Ethics Committee of our hospital (protocol no.: TFG027-18, 28 March 2018) and was carried out in accordance with the latest version of the Declaration of Helsinki, in compliance with current Spanish legislation.
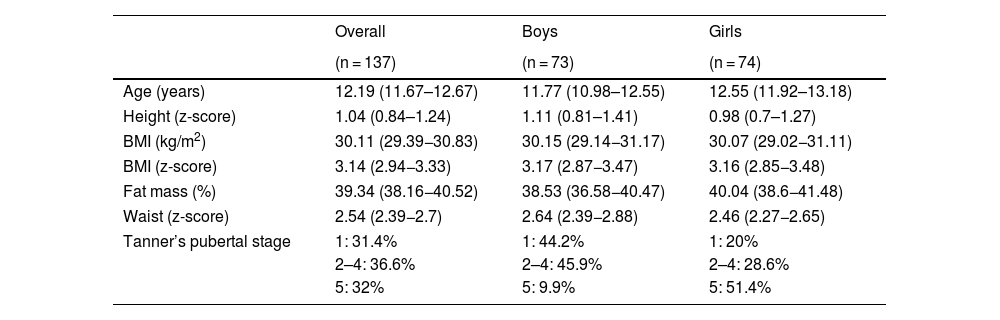
ResultsDescription of the sampleThe questionnaire was distributed to 178 patients during the study period. Of these, 137 (76.9%) completed the questionnaire and handed it in at the consultation. Thus, the final sample was made up of 137 patients, 74 girls (54%) and 63 boys (46%). The mean age was 12.19 years (11.67–12.67) and, according to sex, it was 11.77 years (10.98–12.55) in boys and 12.55 years (11,92–13,18) in girls. Of the boys, 44.2% were prepubertal (Tanner stage 1), 45.9% were in Tanner stages 2–4, and 9.9% in Tanner stage 5. Of the girls, 20% were Tanner stage 1, 28.6% were between Tanner stage 2 and 4, and 51.4% had already completed pubertal development (Tanner stage 5).
The anthropometric variables are shown in Table 1. These variables did not show significant differences between the sexes.
Mean values (mean and 95% CI) of the anthropometric data of the total sample and differentiating by sex.
| Overall | Boys | Girls | |
|---|---|---|---|
| (n = 137) | (n = 73) | (n = 74) | |
| Age (years) | 12.19 (11.67–12.67) | 11.77 (10.98–12.55) | 12.55 (11.92–13.18) |
| Height (z-score) | 1.04 (0.84–1.24) | 1.11 (0.81–1.41) | 0.98 (0.7–1.27) |
| BMI (kg/m2) | 30.11 (29.39−30.83) | 30.15 (29.14−31.17) | 30.07 (29.02−31.11) |
| BMI (z-score) | 3.14 (2.94−3.33) | 3.17 (2.87−3.47) | 3.16 (2.85−3.48) |
| Fat mass (%) | 39.34 (38.16−40.52) | 38.53 (36.58−40.47) | 40.04 (38.6−41.48) |
| Waist (z-score) | 2.54 (2.39−2.7) | 2.64 (2.39−2.88) | 2.46 (2.27−2.65) |
| Tanner’s pubertal stage | 1: 31.4% | 1: 44.2% | 1: 20% |
| 2–4: 36.6% | 2–4: 45.9% | 2–4: 28.6% | |
| 5: 32% | 5: 9.9% | 5: 51.4% | |
Of the 41 patients who did not submit the questionnaire, 21 were girls (51%) and 20 were boys (49%), their mean age was 12.14 years (11.13–13.51), their BMI (z-score) was 3.34 (2.73–3.86) and their percentage of fat mass was 40.77% (38.39–43.1), without finding statistically significant differences in any of the parameters with respect to the patients who did submit the questionnaire.
Food consumption and its relationship with anthropometric variablesThe study population consumed an average of 1635 kcal/day (1571–1700). The daily caloric consumption by primary nutrients was the following: proteins 20.1% (19.2–21), carbohydrates 48.1% (46.6–49.5) and fats 31.02% (29.58–32.48), of which saturated fats were 25.13% (23.21–27.06). Saturated fats accounted for 7.8% (7.08–8.52) of the total daily kcal.
Overall, 52.38% of the children consumed more than 10% of the daily caloric intake in the form of simple sugars, and only 4.76% of the children consumed less than 5% of the daily calories in the form of these sugars. Mean fibre intake was 14.39 g/day (12.99–15.80).
The average proportion of daily calories in each of the intakes was as follows: breakfast 20.47% (19.05–21.89), mid-morning 5.66% (4.63–6.7), lunch 36.91% (35.09–38.73), afternoon snack 11.37% (10.05–12.70), dinner 24.33% (22.85–25.82) and other intakes 1.21% (0.49–1.43).
No significant correlation was observed between anthropometric data and total daily kilocalories (kcal), percentage of primary nutrients, nor with higher consumption of simple sugars or saturated fats.
Regarding the distribution of kcal by meals, a significant negative correlation was observed between the percentage of daily calories ingested at breakfast and the percentage of fat mass of the children (r = −0.245, p < 0.05), and a positive correlation between the percentage of daily kcal ingested at dinner and BMI (z-score) (r = 0.19, p < 0.05).
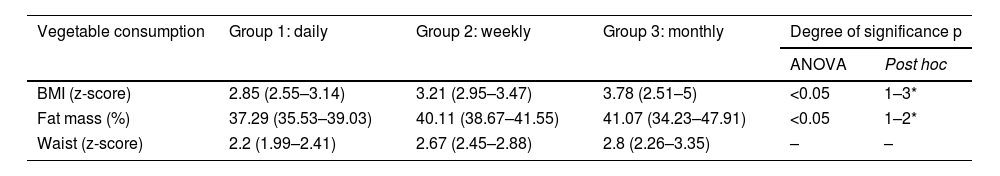
In the consumption frequency survey, only a significant relationship was observed between the degree of obesity and the consumption of vegetables, indicating a higher degree of obesity with lower consumption of vegetables. Thus, obese children were divided by vegetable consumption into three groups: a) group 1: daily intake; b) group 2: weekly intake; c) group 3: less than once a week. In this way, a significant difference was observed in the BMI values (z-score) and the % fat mass between the vegetable consumption groups (Table 2).
Analysis of the anthropometric variables based on the frequency of consumption of vegetables.
| Vegetable consumption | Group 1: daily | Group 2: weekly | Group 3: monthly | Degree of significance p | |
|---|---|---|---|---|---|
| ANOVA | Post hoc | ||||
| BMI (z-score) | 2.85 (2.55–3.14) | 3.21 (2.95–3.47) | 3.78 (2.51–5) | <0.05 | 1–3* |
| Fat mass (%) | 37.29 (35.53–39.03) | 40.11 (38.67–41.55) | 41.07 (34.23–47.91) | <0.05 | 1–2* |
| Waist (z-score) | 2.2 (1.99–2.41) | 2.67 (2.45–2.88) | 2.8 (2.26–3.35) | – | – |
Only 1.5% of the children stated that they ate two meals a day, 21% three meals, 33.6% four meals, and 49% five meals a day. Meanwhile, 75.2% stated that they snacked between meals.
Of all the children in the sample, 37.2% stated that they repeated a dish and 66.4% considered that they ate at an excessively fast rate. When analysing the data based on the speed of eating, those who reported eating quickly had a higher BMI (2.83 [2.49–3.18] vs. 3.3 [3.03–3.59], p < 0.05) and higher percentage of fat mass (36.46 [34.25–38.68] vs. 40.68 [39.33–42.03], p < 0.01).
The average time at which the children ate their meals was as follows: breakfast 8.82 a.m. (8.64–9.01), mid-morning 11.43 a.m. (11.29–11.57), lunch 2.40 p.m. (2.27–2.53), afternoon snack 5.74 p.m. (5.59–5.89) and dinner 9.20 p.m. (9.01–9.40). When analysing the relationship between eating hours and anthropometric data, a significant correlation of BMI (z-score) was found with dinner time (r = 0.20, p < 0.05), and a trend was observed towards higher BMI (z-score) and % fat mass scores with later meal times. We observed a significant correlation between the BMI (z-score) and the hour of the average caloric intake (r = 0.316, p < 0.01) and an almost significant correlation with the percentage of fat mass (r = 0.26, p = 0.06).
Sleep pattern and its relationship with anthropometric variables. Physical activity and time dedicated to the digital world and their relationship with anthropometric dataThe children in the study slept an average of 8.77 h (8.56–8.97) from Monday to Friday and an average of 10.17 h (9.99–10.36) on weekends, with a mean difference of hours of sleep between weekdays and weekends of 1.51 h (1.28–1.74). The average bedtime was at 10.36 p.m. (10.06–11.07) from Monday to Friday and at 11.96 p.m. (11.79–12.13) on public holidays.
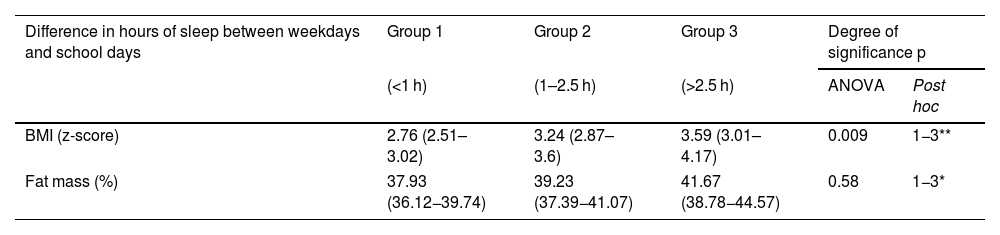
A positive correlation was observed between the anthropometric variables and the hours of sleep on weekends and a negative correlation with the time of sleep on weekdays. Thus, analysing the variable difference in hours slept on holidays and working days, a significant correlation was observed with BMI (z-score) (r = 0.225, p < 0.01) and with the percentage of fat mass (r = 0.234, p < 0.05). By categorising this difference in the hours they slept on weekends and weekdays into three groups, group 1 being those subjects who sleep one hour more on weekends, group 2 those who slept between 1 and 2.5 h more, and group 3 those subjects who slept more than 2.5 h more on weekends compared to weekdays, it was observed that the children in group 3 had a BMI (z-score) and a percentage of fat mass greater than those in group 1 (Table 3).
Analysis of the anthropometric variables based on the difference in hours of sleep between working days and school days.
| Difference in hours of sleep between weekdays and school days | Group 1 | Group 2 | Group 3 | Degree of significance p | |
|---|---|---|---|---|---|
| (<1 h) | (1–2.5 h) | (>2.5 h) | ANOVA | Post hoc | |
| BMI (z-score) | 2.76 (2.51–3.02) | 3.24 (2.87–3.6) | 3.59 (3.01–4.17) | 0.009 | 1−3** |
| Fat mass (%) | 37.93 (36.12−39.74) | 39.23 (37.39−41.07) | 41.67 (38.78−44.57) | 0.58 | 1−3* |
The children and adolescents included in the study performed an average of 2.11 h (1.97–2.26) of physical exercise per week during school hours and 1.91 h (1.56–2.25) of physical exercise in extracurricular activities. Of the children included in the study, 46.7% did not do any extracurricular physical activity. Thus, a negative trend was observed between the hours of extracurricular exercise and the BMI (z-score), without showing statistically significant results.
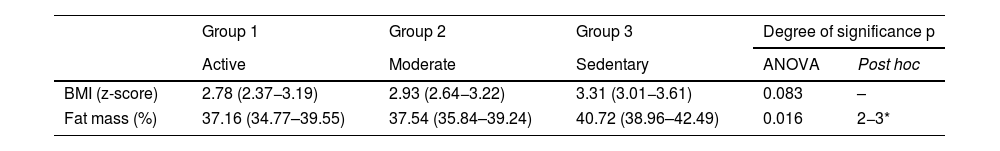
We categorised the children into three groups based on parental perception of the children’s lifestyle: sedentary, moderate and active. A significant difference was observed with the percentage of fat mass between the children who performed a moderate degree of physical activity and the most active children compared to the sedentary ones, and a downward trend was observed, but not significant with BMI (z-score) (Table 4).
Analysis of the anthropometric variables according to the category of physical activity of children with obesity.
| Group 1 | Group 2 | Group 3 | Degree of significance p | ||
|---|---|---|---|---|---|
| Active | Moderate | Sedentary | ANOVA | Post hoc | |
| BMI (z-score) | 2.78 (2.37−3.19) | 2.93 (2.64−3.22) | 3.31 (3.01−3.61) | 0.083 | – |
| Fat mass (%) | 37.16 (34.77–39.55) | 37.54 (35.84–39.24) | 40.72 (38.96–42.49) | 0.016 | 2−3* |
The data related to the hours of recreational screen time was 2.04 h (1.76–2.31) from Monday to Friday and 3.98 h (3.58–4.37) during weekends. We were able to verify a significant correlation between the hours recreational screen time on weekdays and the BMI (z-score) (r = 0.21, p < 0.05). On the other hand, an inverse correlation was observed between the hours of screen time and the hours dedicated to extracurricular exercise (r = −0.362; p < 0.05) and with the hours of sleep on weekdays (r = −0.305, p < 0.01).
DiscussionThe main finding of this study is the relationship between the degree of childhood obesity with patterns of eating, sleeping and physical exercise. In our opinion, not all these parameters are always routinely assessed in the follow-up of overweight children.
When globally evaluating the kcal ingested on a daily basis, no significant correlation was found with the anthropometric data, nor with the distribution by primary nutrients or with the highest intake of simple sugars or saturated fats. However, we did find a higher degree of obesity in those children who ingested a higher percentage of daily kcal at dinner and less at breakfast. In short, in those with caloric consumption later in the day. In line with these results, some authors also argue that consuming a greater amount of daily calories at night is associated with a greater risk of overweight and obesity, while ingesting a higher number of calories at breakfast or lunch seems to have a protective effect.20 In addition, regularly skipping breakfast can cause weight gain and is associated with a poorer quality of the total diet. An estimated 10%–30% of European children skip this intake, with this percentage increasing as they get older.21
On the other hand, our study demonstrated the correlation of the time of certain meals with the anthropometric data. In this sense, there is evidence that changes in the time of ingestion can influence not only the development of obesity but also the success of treatments aimed at losing weight, regardless of the total energy ingested, the composition of the diet and the estimated energy expenditure.22 In addition, it seems that the timing of meals has an impact on the metabolic state of the body. Thus, some articles relate the timing of meals with different patterns of insulin secretion and with changes in hunger and satiety signals.23 On the other hand, it has been found that some polymorphisms of genes related to metabolism, such as leptin or adiponectin, cause a different response to obesity treatment depending on the hours and the type of food eaten to promote weight loss.23 For all these reasons, it seems reasonable to implement recommendations on the timing of meals in the treatment of obesity and, consequently, in programmes for its prevention.
In our sample, we have observed that the variations in the number of hours slept throughout the days of the week in obese children is related to an increase in BMI. Preliminary studies found that large variations in children’s and adolescents’ sleep schedules, added to their sleep being of short duration, significantly influence the appearance of obesity and metabolic disorders.24 Along these lines, in 2014, a Danish study found that sleep variation between days of the week significantly increased food intake, favouring weight gain in children, regardless of other factors such as total sleep duration.25 Some studies have clarified the association between sleep deprivation and increased adipose tissue in children26 and adults.27 This association could be due to an increase in caloric intake, greater appetite for foods rich in sugar, or changes in the release of hormones dependent on biorhythms related to light/dark cycles, such as leptin, insulin and ghrelin, among others.28
In our research, a relationship between a lower degree of physical activity and the degree of obesity was also found. In addition, these behaviours are associated with more recreational screen time and with more altered sleep schedules. The percentage of children with obesity who do not do any sport outside school hours is much higher than that reported in studies of the Spanish general population, where the percentage of children who do not exercise outside school hours is between 11% and 26%.29,30 The lower physical activity observed in obese children may have a multifactorial origin: a) difficulties in playing sports as a result of being overweight, with subsequent frustration and shame; b) lack of rapid and conclusive results in weight loss when starting a sport so that they feel it is worth the effort; c) excessive competitiveness in school sports, which do not allow the participation of children with certain physical conditions and/or little ability; d) you have to pay to play many sports regularly and safely, a fact that has a notable effect on the possibility to play sport for families with a lower socioeconomic status.30 For all of the above, it is necessary to break stigmas and accept all children in sport training regardless of their physical condition and their ability to play sport. At the same time, we must encourage the continuity of playing sport by highlighting the objectives achieved after making the effort. Likewise, it would be advisable to have a greater number of sports facilities to be able to carry out physical activity. Continuing with this line, we have found a relationship between the number of hours of recreational screen time with the highest degree of obesity and the least number of hours of sleep on weekdays. However, we have not reflected in the survey at what times these devices are used. Thus, we cannot conclude, as we suspect, that they contribute directly to these changes in sleep schedules. It would be interesting in future studies to analyse this question.
The main limitation of this study is the absence of a control group made up of children with normal weight. On the other hand, most of the data was collected through questionnaires with the voluntary and subjective responses of those who answered the survey. It should be noted that the response rate was almost 77%.
ConclusionsThere is a close relationship between the degree of obesity and eating times and the time spent sleeping, as well as with physical exercise. Consequently, it would be of great interest to collect more in-depth information related to eating, exercise and sleep schedules of patients with excess weight to implement individualised strategies that provide guidance not only on the total number of daily calories that they should ingest but also on how to distribute them throughout the day. Additionally, these strategies should focus on the relevance of the regularity of the hours devoted to sleep throughout the week and on the importance of carrying out physical exercise on a regular basis.
FundingThis study was financed by the Fundación Familia Alonso [Alonso Family Foundation] (project no. PIC006-18).
Conflicts of interestThe authors declare that they have no conflict of interest.
The following is Supplementary data to this article: