


Patients with gastroenteropancreatic neuroendocrine tumors (GEPNET) can suffer from malnutrition. This is the first descriptive study of morfo-functional evaluation in GEPNET.
ObjetivesTo describe a morfo-functional evaluation, and to compare with reference population available, and to correlate different nutritional parameters. Moreover, to compare nutritional evaluation in our study with another same location non-neuroendocrine tumors.
Materials and methodsA retrospective observational study, 50 patients with GEPNET, medium age 61 years. It was collected clinico-pathological characteristics and nutritional status was assessed by anthropometric, laboratory test, bioelectrical impedance analysis, phase angle, hand grip strength, and rectus femoris ultrasound for the assessment of muscle mass.
We used SPSS statistics to describe and to analyze correlations of different variables.
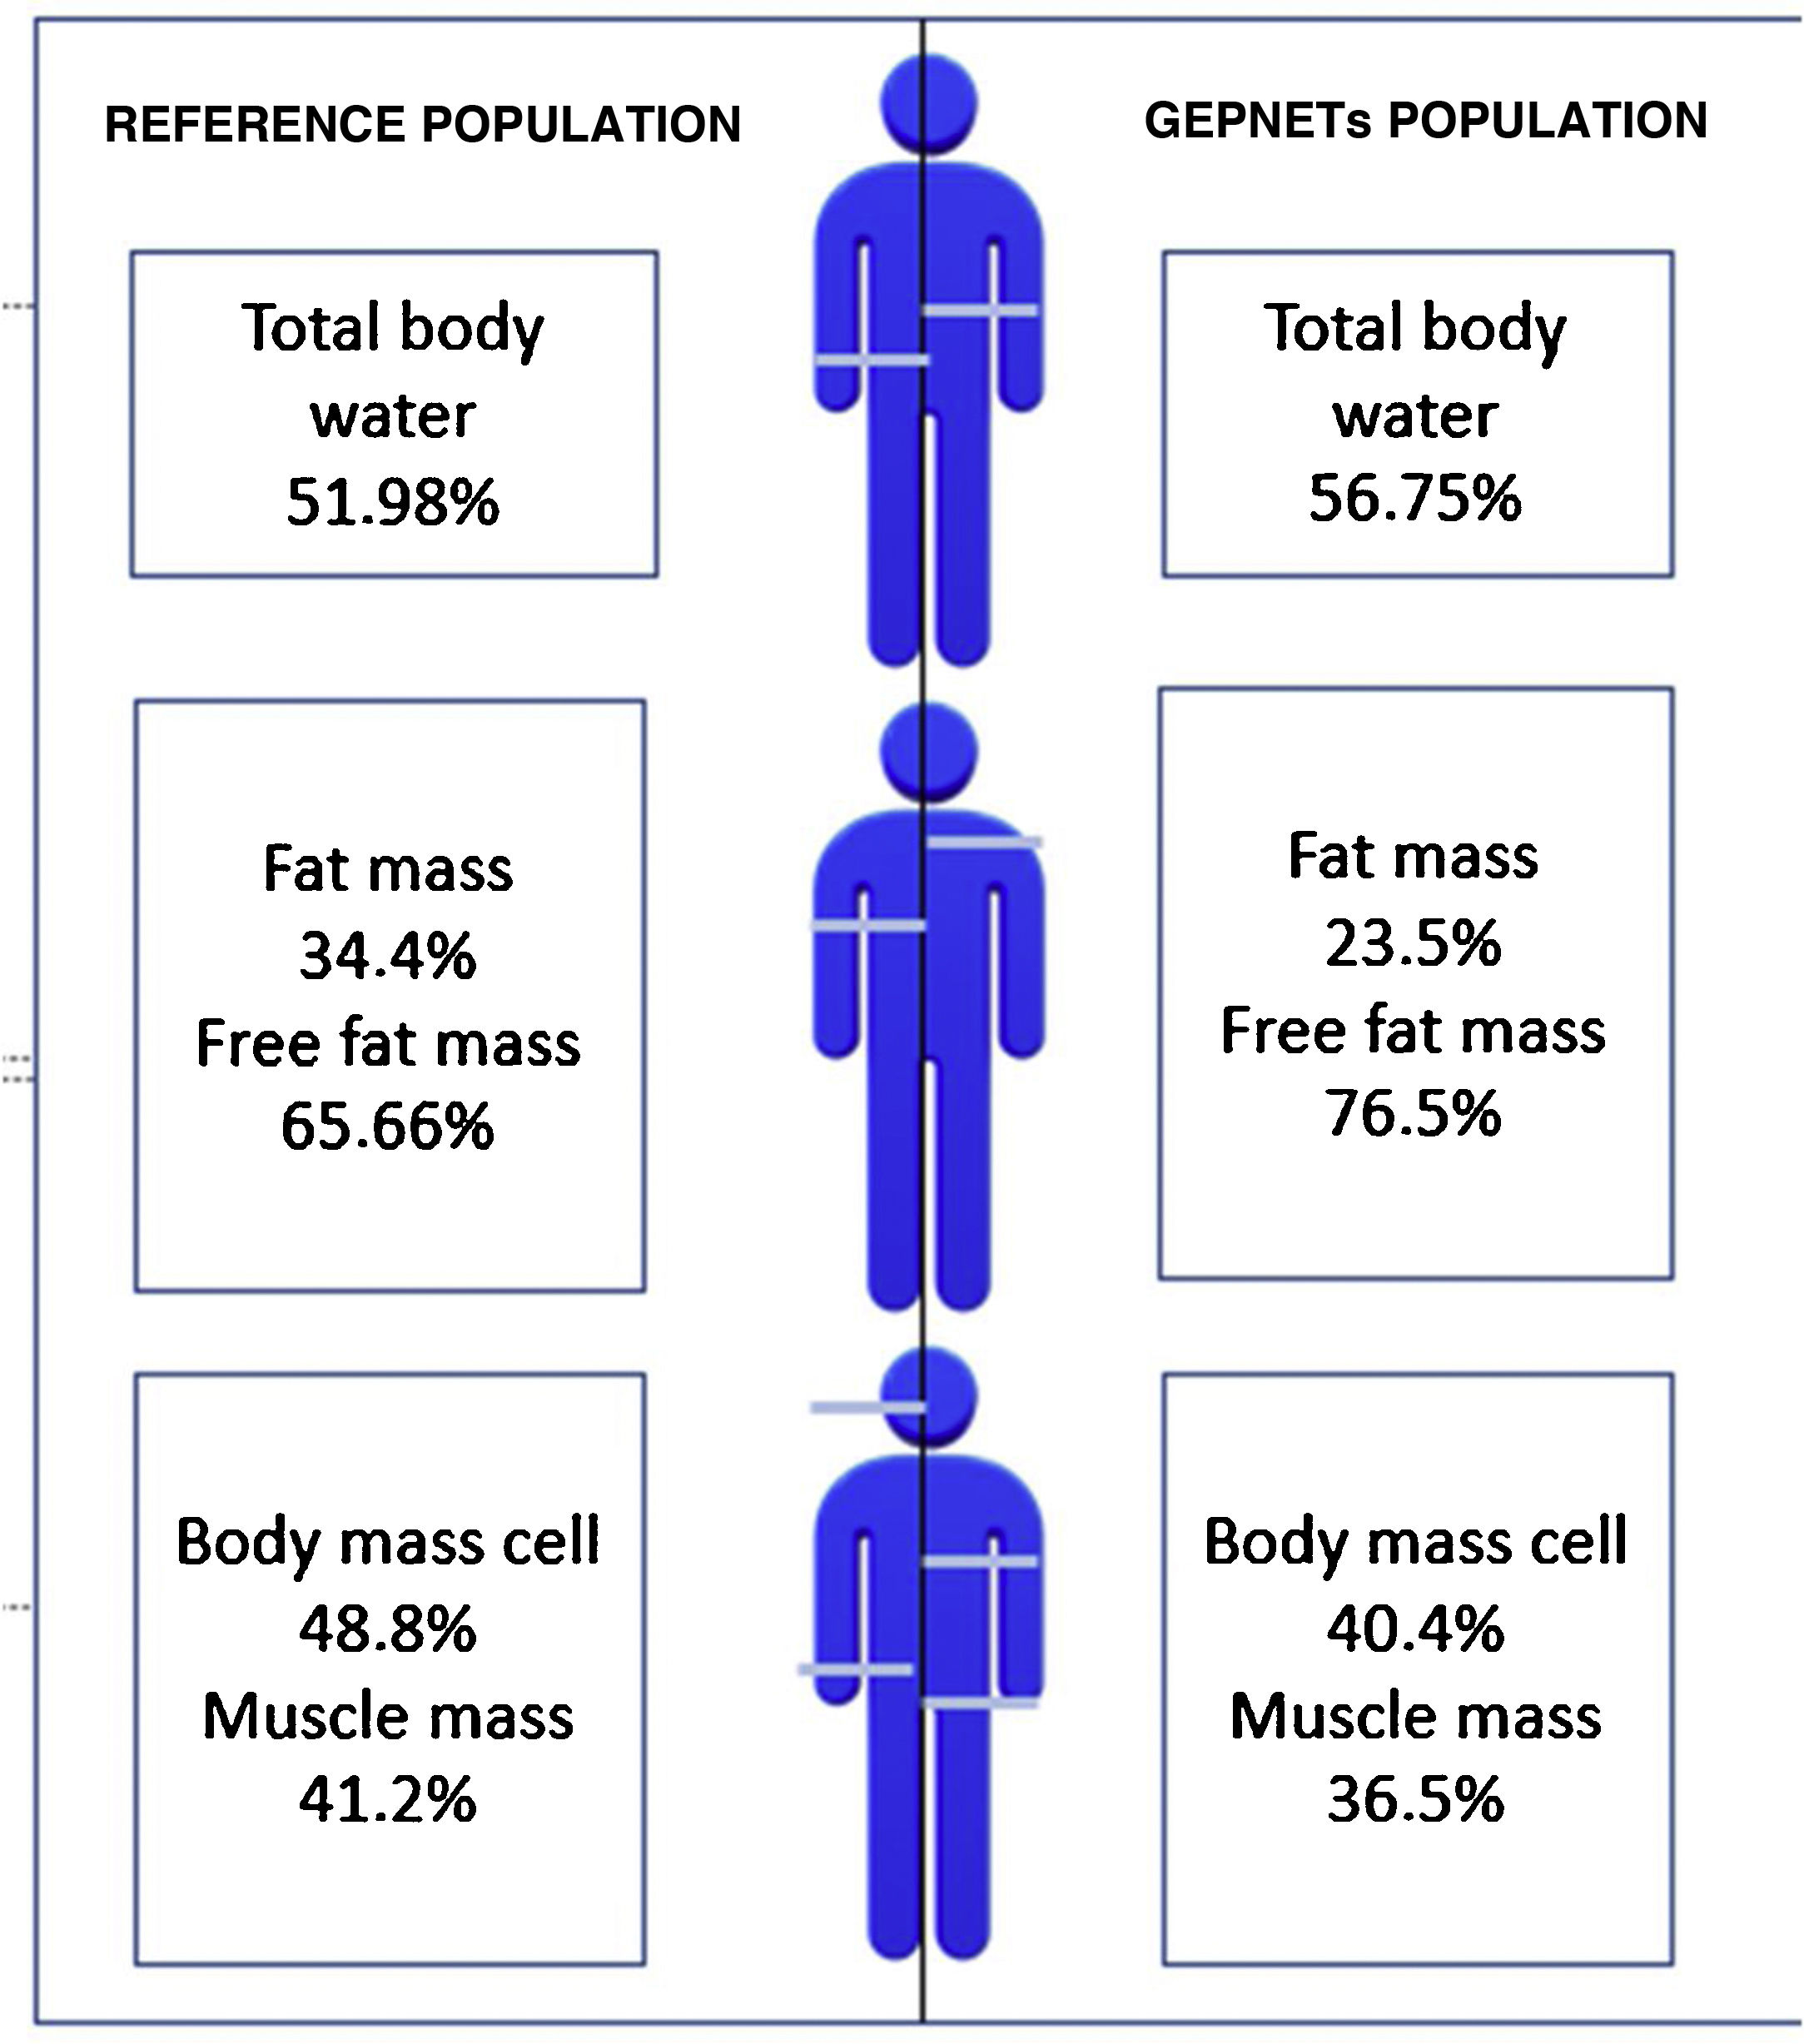
ResultsMost frequent location of tumor was pancreas and small bowel, tumor grade 1 and advance stage. In morfo-functional evaluation highlighted: a low fat mass percentage (23,5 vs 34,4%), low muscle mass percentage (36,5 vs 41,2%) and low body mass cell percentage (40,4 vs 48,8%) compared with reference population available by sex and age. Standarized phase angle by sex and age result as positive (+0,851). There was no difference in hand grip strength compared with reference population.
After a review of differents studies available, phase angle and hand grip strength of non neuroendocrine tumors in same location, could suggest a minor affection of nutritional state in our GEPNET sample.
A positive correlation was observed between non classic methods of nutritional evaluation such as bioelectrical impedance analysis, hand grip strength and rectus femoris ultrasound.
ConclusionPatients with gastroenteropancreatic neuroendocrine tumors (GEPNET) show a moderate affection of nutritional status in comparison to general population. Morphofunctional assessment provide us a precise knowledge about nutritional status.
Los pacientes con TNEGEP pueden sufrir un deterioro del estado nutricional. Este es el primer estudio de valoración morfofuncional en TNEGEP.
ObjetivosDescripción de la valoración nutricional morfofuncional, comparación con población de referencia en la literatura disponible, así como correlación entre sí de dichos parámetros. Además comparación mediante revisión de literatura de resultados con tumores digestivos de estirpe no neuroendocrina.
Material y métodosEstudio retrospectivo, 50 pacientes TNEGEP, edad mediana de 61 años. Se realizó descripción de características, valoración morfofuncional, bioimpedanciometría (composición corporal y ángulo de fase), ecografía del recto anterior del cuádriceps y dinamometría de mano.
Análisis estadístico con SPSS statistics para descripción y correlación de las distintas variables.
ResultadosLa mayoría de pacientes en nuestra muestra resultaron de localización pancreática e intestino delgado, grado tumoral 1 y estadio avanzado. En la valoración morfofuncional destacó: menor porcentaje de masa grasa (23,5 vs 34,4%), masa muscular (36,5 vs 41,2%) y masa celular (40,4 vs 48,8%) respecto a la población de referencia por edad y sexo. El ángulo de fase estandarizado por edad y sexo resultó positivo (+0,851). No hubo diferencias significativas en cuanto a la dinamometría comparando con población de referencia.
Tras revisión de la literatura, los datos en cuanto a ángulo de fase y dinamometría en comparación con tumores de estirpe no neuroendocrina, sugieren una menor afectación del estado nutricional en nuestra serie de TNEGEP.
Se observó correlación entre los diferentes métodos no clásicos de valoración nutricional en cuanto a la bioimpedanciometría, dinamometría y ecografía muscular.
ConclusiónLos pacientes con TNEGEP de nuestra serie presentan una afectación moderada del estado nutricional respecto a la población general. La valoración morfofuncional permite un conocimiento más preciso del estado nutricional.
Neuroendocrine tumours (NETs) are a heterogeneous group of neoplasms. To date, they have been uncommon, accounting for just 1% of gastrointestinal tumours,1 with differences in location and stage in different registries. However, a widespread increase in their incidence has been detected in recent years.2
Both the tumour itself and the surgical operations and systemic therapies to which the tumour is subjected can have a negative impact on these patients' nutritional status, and therefore on their overall prognosis, especially in those with gastroenteropancreatic neuroendocrine tumours (GEPNETs). Furthermore, metabolic signs caused by the production of hormones or biologically active peptides sometimes lead to clinical syndromes that interfere with suitable nutritional status. This increases requirements for macronutrients and micronutrients (carcinoid syndrome and hyperglycaemia) and hinders the absorption thereof (diarrhoea and vomiting).3
Today, in addition to nutritional assessment using classic parameters (anthropometrics and laboratory results), a “morphological and functional” assessment is used. The morphological part of the evaluation consists of bioelectrical impedance analysis, which collects data on body composition/phase angle, and muscle ultrasound. The functional part of the evaluation consists of dynamometry. This determines overall nutritional status in this group of patients.4
Bioelectrical impedance analysis is an indirect method for measuring body composition based on the capacity of the human body to transmit an electrical current. Such a current passes easily through fluids and electrolytes, whereas fat and bone are relatively non-conductive. Thus, impedance measures total body water (TBW) and, using predictive equations rooted in reference techniques, based on the estimated TBW value, fat-free mass (FFM) and fat mass (FM) are obtained. Phase angle (PA) can be calculated using crude impedance parameters, such as resistance and reactance (PA=tangent arc (Xc/R)×180°/n). By definition, PA is positively associated with tissue reactance (associated with cell mass, integrity and function and cell membrane composition) and negatively associated with resistance, which primarily depends on the degree of tissue hydration.5,6
PA has been linked to survival in various clinical situations (liver cirrhosis, breast cancer, colon cancer, pancreatic cancer, lung cancer, HIV/AIDS and surgery).7 It has also been independently linked to survival in patients with advanced-stage cancer.8
Muscle ultrasound constitutes a non-advanced, non-invasive examination technique for measuring body composition and correlating it with lean mass and strength measured using dynamometry.9 It has also been correlated with fat-free mass measured using dual-energy X-ray absorptiometry (DEXA).10
Dynamometry not only constitutes a criterion for malnutrition (American Society for Parenteral and Enteral Nutrition [ASPEN]), but also represents a prognostic factor for morbidity and mortality, as well as a nutritional marker in patient follow-up.11
To date, the sample presented represents a first as a morphological and functional description in patients with GEPNETs.
ObjectivesThe primary objective was to describe nutritional assessment using new methods in patients with GEPNETs. The secondary objective was to evaluate agreement between said nutritional parameters and, through a review of the current literature, to compare nutritional status in non-neuroendocrine tumours in the same location.
Material and methodsDesign and study populationWe present a retrospective observational study of patients diagnosed with GEPNETs assessed on an outpatient basis for nutritional follow-up at a tertiary hospital. Patients were referred from medical oncology once their diagnosis had been confirmed. Altogether, 50 patients with GEPNETs were collected: 25 males and 25 females, with a median age of 61 years (15–88).
Characteristics of gastroenteropancreatic neuroendocrine tumoursTumours were classified based on location (stomach, proximal small intestine, distal small intestine, appendix, colon or rectum, or pancreas), tumour grade according to the 2010 World Health Organization (WHO) classification (G1, G2 or G3), and staging according to the European Neuroendocrine Tumor Society (ENETS) for each location. Ki-67 was assessed in the histology study.
Clinically, tumours were classified as functioning or non-functioning, as well as based on Octreoscan® uptake, medical and surgical treatment, and presence of diabetes before and after surgery.
Morphological and functional nutritional assessmentImpedance measurement and phase angleThis was measured using the BIA 101/Nutrilab model from Akern®, and data downloaded from the Bodygram® program, yielding data on estimated baseline metabolism and body composition: hydration, “nutrition”, fat mass percentage (FM%), fat-free mass (FFM%) and muscle mass percentage (MM%).
To adjust for the subjects’ height, the following indices were used: fat mass index (FMI), lean mass index or fat-free mass index (FFMI), body cell mass index (BCMI) and skeletal muscle index (SMI).
The value called “nutrition” in this case was in relation to estimated 24-h creatinine excretion adjusted for the subject’s height in centimetres. The calculation was performed using an impedance meter based on estimated cell mass.
Data was also obtained on phase angle (PA) and standardised phase angle (SPA) by age and sex.
Muscle ultrasoundUltrasound was performed at the level of the lower third of the anterior rectus femoris muscle of the quadriceps, with measurement of adipose tissue thickness (mm) and muscle area in a transverse slice (cm2) at this level. For the exact location of the lower third of the anterior rectus femoris muscle of the quadriceps, the length of this muscle was measured from its origin at the superior anterior iliac spine to its insertion through the patellar tendon (the superior rim of the patella).
DynamometryMuscle strength (kg) was measured using a Jamar® hand dynamometer for the dominant hand and averaging three consecutive measurements.
Statistical analysisDescriptive statistics were performed for qualitative and quantitative variables using the SPSS Statistics® software program.
One-way analysis of variance (ANOVA) (with PA, SPA and dynamometry, area of the quadriceps muscle and adipose tissue thickness at the level of the quadriceps as dependent variables) was used to confirm whether there were differences by location, stage, grade, type of surgery, functionality, Octreoscan uptake, medical treatment or prior presence of diabetes.
Student's t test for independent samples was used to confirm differences in relation to sex in the morphological and functional assessment and classic parameters.
To confirm the correlation between the different quantitative variables, Pearson’s multiple correlation test (bilateral significance) was used.
ResultsDescription of the study population and characteristics of gastroenteropancreatic neuroendocrine tumours in the sampleThe study population and the characteristics of the tumours of the study population are summarised in Table 1. Notable in our sample were a pancreatic location, G1 tumour grade, advanced tumour stage and non-functioning nature. With respect to treatment, the vast majority underwent surgery and required medical treatment with somatostatin analogues or treatment with chemotherapy and/or radiotherapy.
Baseline and GEPNET characteristics.
| n | 50 |
|---|---|
| Age (years) | Median: 61; Range: 15–88 |
| Ki-67 | Mean: 9.25; SD: 11.67; Range: 1–60 |
| Sex | |
| Male | 25 (50%) |
| Female | 25 (50%) |
| Location | |
| Pancreas | 20 (40%) |
| I. Small intestine: distal jejunum/ileum | 13 (26%) |
| I. Small intestine: duodenum/prox. jejunum | 10 (20%) |
| Stomach | 3 (6%) |
| Colon or rectum | 2 (4%) |
| Appendix | 2 (4%) |
| Grade | |
| G1 | 17 (51.5%) |
| G2 | 15 (45.5%) |
| G3 | 1 (3%) |
| Stage | |
| Stage I | 12 (24.5%) |
| Stage II | 4 (8.2%) |
| Stage III | 5 (10.2%) |
| Stage IV | 28 (57.1%) |
| Functionality | |
| No | 29 (69%) |
| Yes | 13 (31%) |
| Octreoscan uptake | |
| No uptake | 10 (25%) |
| Focal uptake | 3 (7.5%) |
| Diffuse uptake | 17 (42.5%) |
| Type of surgery | |
| No surgery | 9 (18%) |
| Pancreatic surgery | 14 (28%) |
| Intestinal resection surgery | 25 (50%) |
| Stomach surgery | 2 (4%) |
| Medical cancer treatment | |
| No treatment | 13 (27.1%) |
| Somatostatin analogues | 20 (41.7%) |
| Conventional chemotherapy and/or radiotherapy treatment | 6 (12.5%) |
| Other treatments | 9 (18.8%) |
| Presence of diabetes before surgery | |
| No | 40 (80%) |
| Yes | 10 (20%) |
| Presence of diabetes after surgery | |
| No | 35 (70%) |
| Yes | 15 (30%) |
Table 2 shows the nutritional assessment results.
Summary of classic nutritional parameters and morphological and functional assessment in GEPNETs and significant differences by sex.
| Mean | SD | |
|---|---|---|
| Classic parameters | ||
| Weight (kg) | 61.68 | 10.75 |
| BMI (kg/m2) | 25.21 | 5.47 |
| Glucose (mg/dl) | 109.16 | 37.56 |
| Total cholesterol (mg/dl) | 179.08 | 44.22 |
| Triglycerides | 116.58 | 63.27 |
| Albumin (g/dl) | 3.77 | 0.48 |
| Prealbumin (mg/dl) | 24.21 | 6.32 |
| C-reactive protein | 11.09 | 20.20 |
| C-peptide | 1.75 | 1.30 |
| HbA1c % | 6.38 | 1.12 |
| Bioimpedance measurement | Males | Females |
|---|---|---|
| Baseline metabolism (kcal) | 1,544.88 | 1,274.42* |
| PA | 6.10 | 5.33 |
| SPA | 0.431 | 1.034 |
| Nutrition (24-h creatinine/height) | 953.40 | 653.64* |
| FM% | 19.21 | 27.44* |
| FMI | 5.58 | 7.14* |
| FFM% | 80.78 | 72.55* |
| FFMI | 20.44 | 16.65* |
| BCM% | 42.87 | 36.51* |
| MM% | 41.13 | 32.08* |
| SMI | 10.27 | 7.59* |
| Muscle ultrasound | Males | Females |
|---|---|---|
| Quadriceps area, anterior rectus femoris (cm2) | 3.92 | 1.14* |
| Adipose tissue (cm) | 0.93 | 0.46* |
| Dynamometry | Males | Females |
|---|---|---|
| Strength (kg) Jamar dynamometry | 31.45 | 15.3* |
Classic nutritional parameters, such as body mass index (BMI) and laboratory data, are set out. Notable data include average BMI, which in our sample strictly corresponded to grade 1 overweight according to the 2016 Sociedad Española para el Estudio de la Obesidad [Spanish Society for the Study of Obesity] (SEEDO) consensus. With respect to visceral proteins, both albumin and prealbumin were within normal limits, as was total cholesterol, according to the Sociedad Española de Nutrición Enteral y Parenteral [Spanish Society of Enteral and Parenteral Nutrition] (SENPE)-Sociedad Española de Documentación Médica [Spanish Society of Medical Documentation] (SEDOM) document.12
The average phase angle in our sample was 5.7 and the skeletal muscle index was 10.27 in men and 7.59 in women. Standardised phase angle by age and sex was +0.851. Apart from PA, bioimpedance parameters were significantly different for men and women.
In addition, Table 2 presents summary data for bioelectrical impedance analysis, muscle ultrasound and dynamometry in both sexes, as well as significant differences between men and women.
A comparison was made of the most important morphological and functional parameters, such as PA, BCM, FM, dynamometry and ultrasound data with respect to the functionality of the tumours in our sample; however, no significant differences were seen.
Impedance measurement and phase angle, compared to the reference population by age and sex13
A reference population was used consisting of 311 subjects from the Spanish population, with an average weight of 84.72kg for men and 66.3kg for women and an average height of 174cm for men and 162cm for women. Fig. 1 shows differences with respect to body composition for our sample with GEPNETs versus the reference population used. A new reference variable was created for each bioimpedance parameter according to the reference population by age and sex. Table 3 shows the bioimpedance and dynamometry data from our sample and its corresponding reference values by age and sex.13,14 Subsequently, a comparison of means was performed (mean for our sample and population mean) for each variable. When we paired each patient by reference population corresponding to age group and sex, we saw in our GEPNET patients a lower fat mass percentage (23.5% versus 34.4%), and therefore a higher fat-free mass percentage (76.5% versus 65.6%), a lower muscle mass percentage (36.5% versus 41.2%), a lower cell mass (40.4% versus 48.8%) and a higher total body water percentage (56.7% versus 51.9%), all with statistical significance (p<0.0001).

Graphic representation: differences with respect to body composition between the reference population13 and our sample of GEPNETs.
Bioimpedance and dynamometry values in our sample and reference values corresponding to age and sex.
| Patient | PA | PA r | TBW | TBW r | FM | FM r | FFM | FFM r | MM | MM r | BCM | BCM r | Dyn | Dyn r |
|---|---|---|---|---|---|---|---|---|---|---|---|---|---|---|
| 1 | 5.3 | 5.8 | 63.6 | 56.5 | 13.9 | 33.9 | 86.1 | 66.1 | 43.6 | 43 | 43 | 48.4 | 74 | 38 |
| 2 | 3.8 | 5.3 | 42.1 | 46.6 | 50.5 | 40.2 | 49.5 | 59.8 | 23.7 | 35.1 | 20 | 46.5 | 15 | 21.3 |
| 3 | 5 | 5.3 | 47.5 | 46.6 | 39.2 | 40.2 | 60.8 | 59.8 | 29.2 | 35.1 | 29 | 46.5 | 25 | 21.3 |
| 4 | 4.7 | 5.3 | 44.8 | 46.6 | 39.2 | 40.2 | 60.8 | 66.1 | 24.4 | 35.5 | 28 | 46.5 | 18 | 21.3 |
| 5 | 5.3 | 5.8 | 64.7 | 56.5 | 12.3 | 33.9 | 87.7 | 66.1 | 44.9 | 43.6 | 35 | 48.4 | 70 | 38 |
| 6 | 5 | 21.3 | ||||||||||||
| 7 | 6.4 | 7.1 | 57 | 55.9 | 22.5 | 22.8 | 77.5 | 77.2 | 39.7 | 50 | 44 | 53.3 | 37 | 46.7 |
| 8 | 6 | 5.3 | 56.8 | 46.6 | 22.7 | 40.2 | 77.3 | 59.8 | 34.9 | 35.1 | 43 | 46.5 | 21.3 | |
| 9 | 7.4 | 6.7 | 58.8 | 56.4 | 19.5 | 22.3 | 80.5 | 77.7 | 40.7 | 48.2 | 48 | 50.8 | 45 | 47.5 |
| 10 | 4.6 | 5.3 | 52.8 | 46.6 | 28.5 | 40.2 | 71.5 | 59.8 | 29.4 | 35.1 | 33 | 46.5 | 12 | 21.3 |
| 11 | 5.7 | 5.8 | 54.2 | 56.5 | 26.3 | 33.9 | 73.7 | 66.1 | 34.1 | 43.6 | 40 | 48.5 | 28 | 38 |
| 12 | 6.6 | 5.8 | 50.4 | 45.9 | 29.7 | 41.4 | 70.3 | 58.6 | 28.4 | 35.5 | 40 | 47.3 | 20 | 24.3 |
| 13 | 5.2 | 5.3 | 52.9 | 46.5 | 28.1 | 40.2 | 71.9 | 58.6 | 30.7 | 35.1 | 38 | 46.5 | 24.3 | |
| 14 | 6.4 | 5.8 | 65 | 56.5 | 11.5 | 33.9 | 88.5 | 66.1 | 45.2 | 43.6 | 46 | 48.4 | 40 | 38 |
| 15 | 3.4 | 5.8 | 64.6 | 56.5 | 23.1 | 33.9 | 76.9 | 66.1 | 42.8 | 43.6 | 27 | 48.4 | 38 | |
| 16 | 6.8 | 6.7 | 55.2 | 56.4 | 24.2 | 22.3 | 75.8 | 77.7 | 36.8 | 43.6 | 43 | 50.8 | 37 | 47.5 |
| 17 | 4.4 | 5.8 | 53.3 | 45.9 | 27.6 | 41.4 | 72.4 | 58.8 | 31 | 35.5 | 32 | 50.8 | 12 | 24.3 |
| 18 | 6.8 | 5.8 | 52.6 | 49.2 | 26.6 | 37.3 | 73.4 | 62.7 | 32.2 | 39.8 | 43 | 53.8 | 35 | 24 |
| 19 | 6.7 | 5.9 | 55.7 | 49.2 | 23.3 | 29.9 | 76.7 | 68.1 | 36.1 | 42.4 | 46 | 53.3 | 38 | 24 |
| 20 | 4.4 | 5.8 | 59.4 | 46.6 | 23.6 | 40.2 | 76.4 | 59.8 | 35.7 | 35.1 | 38 | 46.5 | 20 | 21.3 |
| 21 | 3.8 | 5.8 | 47.7 | 56.5 | 40.9 | 33.9 | 59.1 | 66.1 | 28.3 | 43.6 | 32 | 48.4 | 34 | 38 |
| 22 | 4.9 | 5.8 | 63.9 | 56.5 | 15.9 | 33.9 | 84.1 | 59.8 | 43.9 | 43.6 | 41 | 48.4 | 38 | 38 |
| 23 | 27 | 38 | ||||||||||||
| 24 | 7.1 | 5.3 | 54.7 | 46.5 | 23.7 | 40.2 | 76.3 | 59.8 | 31 | 35.1 | 48 | 46.5 | 24 | |
| 25 | 5.7 | 5.8 | 61.5 | 56.5 | 16.4 | 33.9 | 83.6 | 66.1 | 41.7 | 43.6 | 43 | 48.4 | 10 | 38 |
| 26 | 5.5 | 5.3 | 58.9 | 46.6 | 19.3 | 40.2 | 80.7 | 59.8 | 34.4 | 35.5 | 41 | 46.5 | 20 | 21.3 |
| 27 | 7.6 | 5.8 | 64.1 | 56.5 | 12 | 33.9 | 88 | 59.8 | 44.3 | 43.6 | 54 | 48.4 | 34 | 38 |
| 28 | 4 | 5.8 | 53.9 | 45.9 | 27 | 41.4 | 73 | 58.6 | 31.9 | 35.5 | 32 | 24.3 | ||
| 29 | 5.7 | 5.8 | 54.1 | 56.5 | 26.5 | 33.9 | 73.5 | 54.1 | 33.9 | 43.6 | 44 | 47.3 | 30 | 38 |
| 30 | 5.3 | 5.8 | 53 | 52.2 | 26.6 | 29.9 | 73.4 | 70.1 | 35 | 42.9 | 37 | 48.4 | 46.7 | |
| 31 | 7.8 | 5.8 | 62.5 | 56.5 | 11.4 | 33.9 | 88.6 | 66.1 | 44 | 43.6 | 55 | 48.4 | 45 | 38 |
| 32 | 4.2 | 5.8 | 57.6 | 56.5 | 21.7 | 33.9 | 78.3 | 66.1 | 37.8 | 43.6 | 38 | 48.4 | 35 | 38 |
| 33 | 4.8 | 5.8 | 62.5 | 49.2 | 15.1 | 37.3 | 84.9 | 62.7 | 40.7 | 39.8 | 40 | 48.9 | 22 | 24 |
| 34 | 5.9 | 5.8 | 69.1 | 45.9 | 5.5 | 41.4 | 94.5 | 58.6 | 44.4 | 35.5 | 50 | 47.3 | 30 | 24.3 |
| 35 | 3.5 | 5.3 | 58.5 | 46.6 | 28.7 | 40.2 | 71.3 | 59.8 | 32.7 | 35.1 | 23 | 46.5 | 15 | 21.3 |
| 36 | 6.9 | 7.1 | 72.5 | 55.9 | 2.7 | 22.8 | 97.3 | 77.2 | 56.7 | 50 | 56 | 50.6 | 35 | 46.7 |
| 37 | 5.2 | 7.2 | 49.6 | 57.3 | 32.1 | 19.9 | 67.9 | 80.1 | 34.2 | 50.4 | 48 | 51.9 | 46.7 | |
| 38 | 8.5 | 7.1 | 63.9 | 55.9 | 10 | 22.8 | 90 | 77.2 | 47.4 | 50 | 58 | 53.3 | 35 | 46.7 |
| 39 | 6.4 | 5.3 | 49.6 | 46.6 | 32 | 40.2 | 68 | 59.8 | 27.6 | 35.1 | 39 | 46.5 | 21.3 | |
| 40 | 8.3 | 5.8 | 62.5 | 56.5 | 14.3 | 33.9 | 85.7 | 66.1 | 41.9 | 43.6 | 55 | 48.4 | 32 | 38 |
| 41 | 4 | 5.3 | 55 | 46.6 | 27.5 | 40.2 | 72.5 | 59.8 | 33.3 | 35.5 | 30 | 46.5 | 18 | 21.3 |
| 42 | 7.4 | 7.3 | 54.3 | 56.4 | 26.4 | 22.2 | 73.6 | 77.8 | 36.3 | 50.9 | 44 | 53.3 | 38 | 46.7 |
| 43 | 8.4 | 7.2 | 63.7 | 57.3 | 7.8 | 19.9 | 92.2 | 80.1 | 49.1 | 50.4 | 57 | 51.9 | 34 | 46.7 |
| 44 | 5.8 | 5.3 | 45.6 | 46.6 | 37.8 | 40.2 | 62.2 | 59.8 | 24.6 | 35.5 | 33 | 46.6 | 20 | 21.3 |
| 45 | 5.4 | 7.1 | 66.5 | 55.9 | 9.7 | 22.8 | 90.3 | 77.2 | 50.4 | 50 | 46 | 53.3 | 40 | 46.7 |
| 46 | 6.9 | 5.3 | 49.1 | 46.6 | 31.9 | 40.2 | 68.1 | 59.8 | 26.4 | 35.1 | 38 | 46.5 | 21.3 | |
| 47 | 4 | 5.8 | 62.2 | 52.2 | 15.4 | 31.9 | 84.6 | 70.1 | 41 | 42.9 | 36 | 50.6 | 18 | 24 |
| 48 | 3.8 | 6.7 | 47.7 | 47.7 | 40.9 | 22.3 | 59.1 | 77.7 | 28.3 | 48.2 | 24 | 50.8 | 30 | 47.5 |
| 49 | 42 | 47.5 | ||||||||||||
| 50 | 6.7 | 5.8 | 51.7 | 56.4 | 29.2 | 22.3 | 70.8 | 58.6 | 31.4 | 35.5 | 41 | 47.3 | 20 | 24.3 |
BCM: body cell mass; Dyn: dynamometry; FM: fat mass; FFM: fat-free mass; MM: muscle mass; PA: phase angle; “r”: reference values by age and sex; TBW: total body water.13,14
PA was lower (5.71 versus 5.92), though not statistically significantly.
Muscle ultrasoundIn our sample, the muscle area in the lower third of the quadriceps had an average measurement of 3.92cm2, and the subcutaneous adipose tissue at that level had a thickness of 0.93cm. For the moment, there are no normal population values for these parameters.
A significant difference was seen between sexes, with a greater adipose tissue thickness in women and a larger muscle area in men.
DynamometryDynamometry in men yielded an average result of 40kg, corresponding to the 90th percentile for their age group; similarly, in women, it yielded an average result of 20.92kg, corresponding to the 90th–95th percentile for their age group.
When paired and compared for reference values by age group and sex,14 mean dynamometry proved lower in our sample (31.35 versus 33.6kg), though not significantly.
Agreement between the different nutritional parameters usedFig. 2 shows the most notable parameters.

Dynamometry showed a notably positive correlation with skeletal muscle index (SMI), r=0.529 (p=0.010), muscle mass percentage, r=0.520 (p=0.009) and quadriceps muscle area on ultrasound, r=0.852 (p=0.004).
Fat mass percentage was linked to adipose tissue thickness measured on ultrasound, r=0.864 (p=0.003).
BMI was positively correlated with fat mass percentage (FM%) r=0.717 (p=0.000) and negatively correlated with fat-free mass percentage (FFM%) r=–0.717 (p=0.000) and muscle mass percentage (MM%) −0.534 (p=0.000).
With respect to laboratory parameters, albumin was negatively correlated with C-reactive protein, r=−0.831 (p=0.000).
Comparison of morphological and functional assessment between patients with gastroenteropancreatic neuroendocrine tumours and patients with gastroenteropancreatic non-neuroendocrine tumoursWhen they were compared to other non-neuroendocrine tumours in the same location through the literature consulted (Table 4), a better score was seen in data for morphological and functional assessment (bioimpedance measurement and dynamometry), though not significantly in most parameters. Significant differences were seen in patients with pancreatic adenocarcinoma with respect to fat-free mass index (15.95 versus 18.61); significant differences were also seen in patients with gastric adenocarcinoma with respect to phase angle (4.7 versus 6.3).
Summary description of characteristics of our sample of GEPNETs and gastrointestinal non-neuroendocrine tumours, literature review. Comparison of different morphological and functional assessment parameters.
| Tumour | n | Age | Sex | Stage | Comments | Reference |
|---|---|---|---|---|---|---|
| Colorectal adenocarcinoma | 250 | 70.9 | 51.6 males | -Stage II: 36.4% | PA 4.94 (SD 1) | Barao et al.23 |
| -Stage III: 25.6% | ||||||
| -Stage IV: 22.4% | ||||||
| Pancreatic adenocarcinoma | 16 | Average 60.3 | 50% males | Locally advanced (IIA–III) | Dynamometry (kg) | Witvliet-van Nierop et al.25 |
| Average calculated, weighted by sex: 29.25 (SD 7) | ||||||
| FFMI (kg/m2) | ||||||
| Average calculated, both sexes: 15.95 (SD 1.3) | ||||||
| Gastric adenocarcinoma | 210 | 70 | 68.1 males | -Stage I: 64.2% | PA 4.7 (SD 0.72) | Yu et al.28 |
| -Stage II: 20% | ||||||
| Gastric adenocarcinoma | 470 | 65 | 77.4% males | -Stage I: 34.7% | Dynamometry | Huang et al.29 |
| -Stage II: 21.9% | 29.3 (SD 9.32) | |||||
| -Stage III: 43.3% |
Neuroendocrine tumours derive from neuroendocrine cells which can be found in any tissue, though they primarily affect the gastrointestinal and bronchopulmonary tracts.15 They show a high rate of long-term survival, even though most are diagnosed in advanced disease stages given their latent signs and symptoms which bring about a significant delay in their diagnosis. Age at diagnosis is highly variable, though the mean is around 60 years. In our sample, the median age was 61 years, the predominant tumour location was pancreatic (40%), most tumours were in an advanced stage (57.1% stage IV), and there were high rates of gastrointestinal surgery (82%) and medical cancer treatment (73%).
Nutritional status in GEPNETs is affected by the production of different secretions that can lead to malabsorption, diarrhoea, steatorrhoea and abnormal motility, as well as effects resulting from the various cytoreductive surgeries that are performed.16 Therefore, various strategies for a suitable diagnosis are needed to manage them and improve patient quality of life.
In general, patients with advanced cancer often have protein and fatty-acid deficiencies, leading to a decrease in muscle mass and weight.17 It is known that nutritional status can affect both tolerance to and effectiveness of chemotherapy treatments in solid tumours.18
A systematic review with 3,607 cancer patients19 accepted bioelectrical impedance analysis as a tool capable of detecting sarcopenia, comparable to other methods such as computed tomography and calf circumference, as well as the association between sarcopenia and adverse clinical outcomes.
PA is an indicator of cell membrane integrity, distribution of intracellular and extracellular fluid, and prediction of body cell mass, which is directly linked to nutritional status and survival rate. SPA was determined to be an independent prognostic factor in patients with various types of cancer being treated with chemotherapy.20
To date, correlations between data for bioelectrical impedance analysis, nutritional ultrasound and dynamometry had not been reported. In our case, a concordant correlation was observed with respect to fat mass and muscle mass on bioimpedance and ultrasound, as well as in muscle on dynamometry and bioimpedance measurement. As each examination technique has limitations in different scenarios, such as extreme BMIs, underhydration or overhydration, non-cooperative patients and patients with amputated limbs, it is useful to assess the different types of techniques to arrive at a complete nutritional assessment.
In our sample, when we compared bioelectrical impedance analysis data to the healthy reference population paired by age and sex, we saw a lower fat mass percentage in our patients with GEPNETs, revealing the caloric malnutrition shown by these patients. They also showed in this comparison a lower body cell mass percentage and muscle mass percentage, despite presenting a higher fat-free mass percentage. This may be explained by a larger total body water component in these patients. Both phase angle and dynamometry were lower than in the reference population, although not significantly; this might be attributed to the fact that neuroendocrine tumours generally have a better prognosis compared to tumours of other histological types, as shall be seen below.
SMI was acceptable in both sexes, being above the threshold for sarcopenia according to Global Leadership Initiative on Malnutrition (GLIM) criteria through bioimpedance analysis (<7 in men; 5.7 in women).
Comparison of nutritional parameters in other cancers in the same locationTo date, no publication has compared body composition in patients with gastrointestinal non-neuroendocrine tumours versus gastrointestinal neuroendocrine tumours.
To this end, a search was conducted in the MEDLINE database through the PubMed interface, using the following keywords: bioelectrical impedance analysis, phase angle and hand grip strength, along with the different locations of gastrointestinal tumours.
In general, a more impaired nutritional status was seen in the literature in gastrointestinal non-neuroendocrine tumours:
A prospective study21 that was controlled (for age and sex) with 38 patients with gastrointestinal cancer found an average PA of 4.05 in women and 4.81 in men (cancer) that differed from the control group (7.06 in women and 7.30 in men). BMI was 26.74 in women and 25.85 in men in the cancer group, and 28.44 in women and 27.01 in men in the control group.
Another study in a geriatric population22 featuring 153 patients with gastrointestinal cancer at diagnosis, mostly in a colorectal location, found prior to chemotherapy treatment a PA of 4.96 in men and 4.73 in women and an SMI of 8.82kg/m2. The average dynamometry between men and women was 27.5±8.6kg.
Another study23 of 250 patients of advanced age with colorectal cancer found an average phase angle of 4.94 (SD±1) and linked a phase angle greater than 5 to greater survival.
In patients who were to undergo surgery for pancreatic adenocarcinoma, sarcopenia was seen in 58.6% of patients on preoperative CT at an L3 level, with different cut-off points in the muscle area for men and women.24
Patients with locally advanced pancreatic cancer25 exhibited a fat-free mass index of 17 in men and 14.9 in women (below the average for our sample). The dynamometry data was 33.7kg in men and 24.8kg in women.
A meta-analysis26 of 39 studies on body composition in gastric cancer found a prevalence of sarcopenia of 7%–70%, measured using muscle area on CT at an L3 level, bioelectrical impedance analysis or DEXA. This data was linked to greater postoperative complications and lower survival.
In patients with gastric cancer 65 years of age, an average dynamometry of 26kg in men and 18 in women before surgery was detected.27 In patients who underwent gastric surgery for neoplastic reasons, with an average dynamometry of 29.32kg, severe impairment on dynamometry (16.28±5.82kg) was linked to surgical and non-surgical complications such as pneumonia.28
Another study, in patients with gastric adenocarcinoma, linked preoperative phase angle to postoperative complications, with an average value of 4.7.29
In small-intestine tumours, given the lower frequency of non-neuroendocrine neoplasms, no literature has been found to date with respect to comparison of body composition or dynamometry data.
This data suggests that although most patients in our sample had a tumour stage of IV, they might have presented a better nutritional status with respect to muscle parameters. This could be related to tumour grade, as in our sample just 3% had a tumour grade of 3, considered to carry a worse prognosis.
In the future, it would be interesting to compare GEPNETs to other non-neuroendocrine tumours in the same location paired by age and sex with respect to morphological and functional assessment data.
ConclusionsPatients with GEPNETs in our series had a moderately impaired nutritional status compared to the general population. Morphological and functional assessment centred on studies of body composition and functionality yield more sensitive and accurate knowledge of nutritional status, showing a notable drop in fat mass, cell mass and muscle mass, with the prognostic implications this entails. The results for phase angle were correlated with a good overall prognosis for this disease and represent a useful tool in the follow-up of these patients. Measures of functional capacity, such as dynamometry, reflect the functional situation of patients and its relationship to morbidity and mortality. Therefore, this tool should be included in the overall assessment of patients with neuroendocrine tumours.
More studies are needed to establish suitable reference values in nutritional ultrasound in order to conduct a more complete assessment of body composition and correlate it with standardised measures of impedance measurement and dynamometry.
Strengths and limitationsThis study was novel in two important ways: its morphological and functional nutritional assessment and its examination of neuroendocrine tumours, which are less prevalent and less commonly studied than other tumour types. The comparison to the healthy reference population by age and sex added value to the study.
The limitations of the study included those inherent to a retrospective observational study and the variety of locations in which gastroenteropancreatic tumours may be present.
It would be interesting to supplement it in forthcoming studies by adding information for patients with gastroenteropancreatic non-neuroendocrine tumours and performing a comparison thereof with pairing by age and sex.
Conflicts of interestThe authors declare that they have no conflicts of interest.