

Users are, by no means, an insignificant source of innovative and attractive products. 5% of our non-representative sample of consumers from Gipuzkoa innovates, which is quite similar to findings in other relevant studies on the subject. This would suggest that innovation management and policies that are exclusively manufacturer-oriented and fail to take the user into account will always be unsatisfactory and incomplete.
However, it is equally true that not all consumers innovate. The challenge, therefore, is for companies who wish to develop co-creation strategies with consumers to be able to identify those consumers who do.
To this end, the authors present a reliable and valid scale called “Consumers at the Cutting-Edge”. We offer a 31-item scale divided in three dimensions (“User leadership”, “Curiosity/creativity”, and “Availability of time and skills for product development”) designed specifically for the identification of lead users so that they can contribute to the innovation process.
Los usuarios son, sin lugar a dudas, una fuente nada despreciable de productos innovadores y atractivos. El 5% de nuestra muestra no representativa de consumidores de Guipúzcoa innova, lo cual es bastante similar a los hallazgos de otros estudios relevantes sobre la cuestión. Esto podría sugerir que la gestión y las políticas de innovación exclusivamente orientadas al fabricante, y que no tengan en cuenta al usuario, serán siempre insatisfactorias e incompletas.
Sin embargo, es igualmente cierto que no todos los consumidores innovan. Por tanto, la dificultad radica en las empresas que desean desarrollar estrategias de co-creación con los consumidores, para poder identificar a aquellos de entre ellos que sí innovan.
A tal fin, los autores presentan una escala fiable y válida denominada “Los consumidores en la vanguardia”. Ofrecemos una escala de 31 cuestiones dividida en tres dimensiones (“liderazgo del usuario”, “curiosidad/creatividad”, y “disponibilidad de tiempo y técnicas para el desarrollo del producto”) diseñada específicamente para identificar a los usuarios líderes que puedan contribuir al proceso de innovación.
Consumers are much more than passive agents who consume commercially available manufactured products. They are a valuable source of novel ideas and are often the creators of new products. Innovation is no longer the exclusive domain of manufacturers; indeed, nowadays it is common for innovative ideas to come from users. Using a term coined by Von Hippel (2005), we can talk about the “democratization of innovation”, in the sense that users become active participants in the development of the products they need for their own specific use. Thus, user-level innovation complements manufacturer-level innovation. Furthermore, Franke et al. (2006) empirical study reveals that many of the innovations developed by users (consumers at B2C level and firms at B2B level) have commercial attractiveness. Morrison et al. (2004) also concluded that innovations developed by these users are of considerable commercial worth. And in a study developed by Lilien et al. (2002) for 3M, results showed that advanced user-innovated products produce eight times greater sales than products resulting from in-house ideas. All this would suggest that the subject is clearly of interest.
The importance of market demand has been a constant theme in innovation-related literature on innovation since the early 60s (Schmookler, 1962, 1966). However, in recent years there has been a substantial increase in research into user-centered innovation,1 clearly indicating a growing interest in this topic in the marketing community.
According to the seminal work by Von Hippel (1986), users create and modify products in order to better serve their own needs. Furthermore, they often make these innovations available to other people. Not all consumers innovate, but the number of those who do is far from insignificant. He uses the term “lead user” to refer to the most advanced users, the ones who are able to identify specific needs ahead of other users. Von Hippel's paper in 1986 is the first study which explicitly articulated the role of users as active innovators. Since then, his work has focused on user-centered innovation, the whole concept of user innovation, and the profile of the innovative user. An important part of this research has been the dissemination of its findings.
It was observed in his later collective research (Flowers et al., 2010) that much work on user innovation had centered on a specific product or industry. In fact, there is a lack of cross-market and cross-industry studies in the existing literature. The report, in which “findings from a world-first survey of product innovation by consumers, and from the first cross-industry survey of user process innovation by UK firms” (Flowers et al., 2010, p. 4) attempts to address this gap.
This is what probably led Ogawa and Pongtanalert (2011) to partially replicate their study (focusing on consumer-level innovation, and not on firm-level innovation) in Japan and the United States. They invited the research community to conduct surveys both in developed and in developing countries similar to those already undertaken in the United Kingdom, Japan or the United States.
Furthermore, there is very little cross-market and cross-industry research which identifies who these innovative users are. Lüthje (2004) offers some help in describing the innovative user but recommended further research be carried out on the subject. Flowers and Henwood (2010) also identified a gap in the correct identification of innovative users.
Following the invitation and recommendation for further research by these authors, we focused on one key question: How best to identify consumers who are engaged in innovating? It is vital to know who these consumers are because they potentially represent an untapped source of commercially attractive products. So we centered our efforts on designing a measurement scale capable of identifying advanced users at consumer level, i.e. users who identify specific needs before other users see them and, who subsequently design or create new products to meet those needs. For this purpose we drew up a questionnaire and administered it to a sample of adult consumers in a developed European region, Gipuzkoa (Spain).2
Measuring user innovation will enable policymakers to appreciate its impact (Flowers and Henwood, 2010) on society and could potentially influence current innovation policies. Furthermore, the measurement tool designed by the researchers of this study to identify consumers engaged in innovation would allow companies to involve lead users in the creation of new products. Typically, innovation policies and innovation management are based on producer-centered models of innovation under the fairly general assumption that users play no part in the innovation process. This approach is clearly misguided when attempting to exploit all the innovative potential in society.
2Background of user-centered innovationIn recent years, the influence of demand on innovation has received a lot of attention. Perhaps Porter is one of the most prominent and well-known authors on the subject. He argues that demand characteristics have a considerable effect on achieving competitive advantage. More precisely, Porter (2007) considers that firms gain competitive advantage if domestic buyers are sophisticated and demanding. According to this author, informed and exigent buyers lead companies to create new products to meet their customers’ needs and desires, as they are under pressure to continue to offer high quality products, which ultimately stimulates them to improve and innovate.
Guerzoni (2007), perhaps less well known, also presents some interesting findings in his empirical study. According to this author, consumers who are fully aware of their needs can provide firms with very useful information (feedback) leading to radical innovations. In a separate study (Fontana and Guerzoni, 2008), companies that consider consumers to be the most important source of information were found more likely to act on this information and introduce product innovations.
Although studies focusing on demand have flourished in recent years, the earliest studies referring to the effect of demand on innovation date back to the 60s. In fact, early references can be found in studies such as Schmookler (1962, 1966) or Myers and Marquis (1969). These authors believe that strong demand acts as a driving force for innovation.3
This said, more recent studies have been severely criticized by authors such as Mowery and Rosenberg (1979) and Dosi (1982) for failing to provide a specific definition of “demand”. They believe that the concept of demand should be clearly distinguished from a general set of perceived needs.
In order to address this need for a clear and specific definition of the concept of demand, Von Hippel (1986) focuses on a set of specific needs identified by the most advanced users, instead of an unlimited set of human needs. These users, who are ahead of market trends, are aware of a specific need. They have more advanced needs than the general user in at least one of the dimensions of the product, and they are able to develop completely new solutions to solve their problems. The author refers to these individuals as “lead users”. These users hope to benefit from the new products as they are able to meet their needs. Simply put, they are aware of a need and can develop a completely new solution to address it.4
3Empirical studies on user-centered innovationAccording to von Hippel's definition, an innovation is a manufacturer innovation when the developer expects to benefit by selling it, while an innovation is a user innovation when the user expects to benefit by using it. The author argues that users are increasingly able to innovate for themselves due to the democratization of innovation. They are developing many new products and, interestingly, they behave differently when it comes to sharing their innovation. While manufacturers tend to protect their innovations drawing upon intellectual property rights, users generally share their innovations freely.
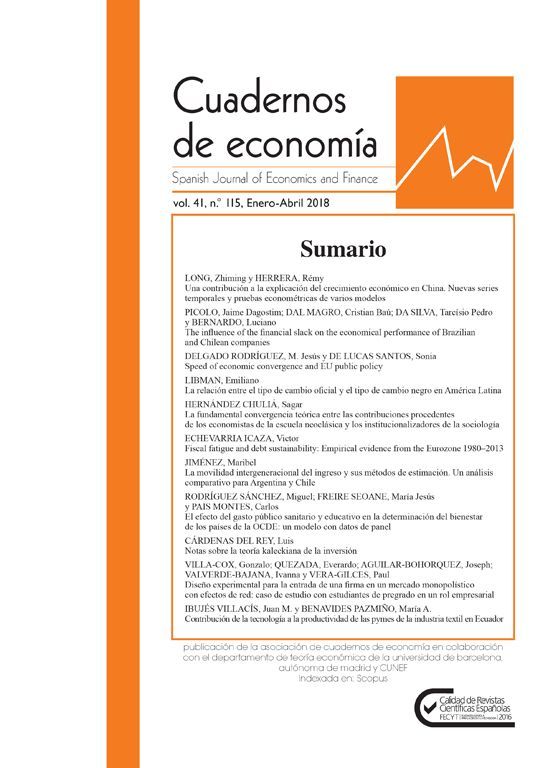
According to Riggs and von Hippel (1994), the type of improvement provided by users and manufacturers also differs. Table 1 shows that while user innovation focuses on new functional capabilities, manufacturer innovation focuses on enhancing convenience or reliability.
Type of improvement provided by innovation. Total sample size of innovations studied: n=64.
| Type of improvement | % Developed by users | % Developed by manufacturers |
|---|---|---|
| New functional capability | 82 | 13 |
| Convenience or reliability improvements (The authors call them Dimension of Merit improvements, or DOMs) | 18 | 87 |
But, how common is user innovation in real terms? The IBM Global CEO Study (2006) carried out some research on different sources of innovative ideas. According to their findings, the most common source of innovative ideas are, in this order, employees (just over 40% of those surveyed chose this answer), business partners (almost 40%), customers (slightly over 35%), consultants (over 20%), competitors (20%) and in-house R&D (near 20%).5 So when we refer to user innovation, we are talking about a very significant source of innovation.
Different studies concerning the incidence of user innovation in a wide range of product categories also exist. Although this research generally focuses on the consumer market, it is interesting to note studies conducted in the B2B market. In fact, Conway (1993) cites several studies at the firm level where the examples of user innovation are quite common. For example, he refers to the Pultrusion Manufacturing Process, where 85% of users innovate while only 15% of manufacturers do so; or Scientific Instruments where 82% of users innovate while 18% of manufacturers become involved in innovation for major improvements; in the case of Semicon PC Card Processing, user innovation stood at 63% while manufacturer innovation accounted for 21% for major improvements (16% innovations developments are in another category).
In another study on the B2B market, DeMonaco et al. (2005) pointed out that, for example, in industrial products such as Pipe Hanger Hardware, the percentage of user innovators is 36%, and that 24% of users tend to innovate Printed Circuit CAD. In the consumer product categories, in Extreme Sporting Equipment or Mountain Biking Equipment user innovation is also quite common: 38% of users innovate equipment for extreme sports while 19% of users innovate their mountain bike equipment.
Despite evidence that user innovation plays an important role in specific consumer and industrial product categories, there are very few cross-industry studies that measure how much user innovation is actually being undertaken.
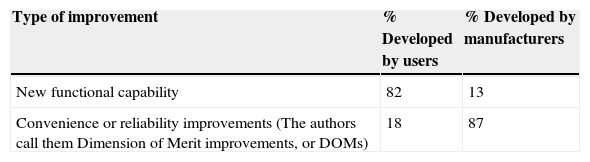
The study carried out by Flowers et al. (2010) is the first one that analyzes the phenomenon of user innovation across a range of sectors. “It presents findings from a world-first survey of product innovation by consumers, and from the first cross-industry survey of user process innovation by UK firms” (Flowers et al., 2010, p. 4). Focusing on their consumer omnibus survey, they found that 8% of consumers in the United Kingdom create or modify one or more consumer products that they use in order to better satisfy their needs. Moreover, 3.4% say their new or modified products are, to their knowledge, original innovations and, approximately, 2% indicate that their innovations have been taken up by other users or even adopted and manufactured commercially by producers. Table 2 shows the diffusion of user innovations by the United Kingdom consumers.
Novelty and diffusion of user innovations by the United Kingdom consumers.
| United Kingdom consumers aged 15+ with a user innovation in the past three years | |||
|---|---|---|---|
| User innovation (overall) | Modification | Creation | |
| Total (n=2109) | 8.0% | 5.9% | 4.4% |
| • Consumer perceives self to be the first to develop the innovation | 3.4% | 1.9% | 1.7% |
| • Consumer knows others that have adopted the innovation | 2.0% | 1.8% | .5% |
Ogawa and Pongtanalert (2011) partially replicated the study of Flowers et al. (2010) in Japan and the United States (they only focused on consumer level innovation, not on firm level innovation). These authors compare the results of the three countries. The results indicated that 3.7% of consumers in Japan and 5.2% of consumers in the United States had been involved in user innovation. These levels of innovation are by no means insignificant. Indeed these findings suggest that if organizations were able to identify their advanced users, they may well stand to benefit from this additional and extraordinary source of innovation.
4The lead user's profileUser-innovators, lead users, or early adopters are some of the terms used in the literature to name this advanced consumer. Some authors use the terms “lead user” and “user-innovator” interchangeably. According to Lettl et al. (2006), user-innovators can be considered lead users, even though user-innovators do not meet all the criteria of a lead user. Meanwhile, Gault and von Hippel (2009) underline the difference between user-innovators and lead users. While user-innovators benefit from using the product they develop, lead users are at the leading edge of important market trends and they identify new emerging needs that have not been previously detected by most of the rest of the market.
The early adopters are identified at the initial stages of the popular Roger's Innovation Curve. However, according to Von Hippel (1986, 1988), lead users act before commercial solutions become available, which is why we decided to use the term “lead user” in our study.
Once we selected this term and given the importance of the identification of lead users, how can we go about it? There are different studies that suggest different ways of doing so. While other methods exist, we have identified three. For example, Belz and Baumbach (2010) use netnography to identify “lead users”. This method may be useful for studying communities on the Internet, but it is not useful for our purpose and thus we ruled it out. Churchill et al. (2009) propose an alternative. They established a qualitative method to identify “lead users” but due to the complexity of its practical application we also ruled it out. A third way to identify them is by using a method called self-designation according to self-perception. It involves creating a questionnaire and inserting a measurement scale into it. Franke and von Hippel (2003) proposed a continuous measure for identifying “lead users” for server security. In particular, they operationalized two variables, both measured using a 7-point rating scale. Becheur and Gollety (2006) also developed a 6-item measurement scale to measure the use of Internet. And Molenmaker et al. (2008) suggested a 6-item scale for toys. All three studies focused on a specific product category while what we are looking for a cross-industrial approach.
Once the right measurement tool is found, its implementation is quite straightforward. So we decided to investigate further measuring instruments. Among the studies reviewed, the most noteworthy is the measurement scale designed by Morrison et al. (2004). They analyzed a closely-related construct, the Leading Edge Status (LES). They proposed an 8-item measurement scale applied to the library sector. They established the validity and reliability of the LES scale and examined the characteristics of users with high levels of LES. They also offered some insight into how LES is related to traditional measures in diffusion theory such as innate innovativeness and time of adoption. They found a strong relationship and explained how users with high LES can contribute to both predicting and accelerating early product adoption. But, as in the previous case, these authors focused on a specific product category (libraries) while we are looking for a cross-industrial approach.
On reviewing different editions of Marketing Scales Handbook: A Compilation of Multi-Item measures (Bruner and Hensel, 1992, 1996; Bruner et al., 2001), we identified other scales related to several dimensions of user-innovator (such as innovativeness scales, opinion leadership scales or market maven scales). We were particularly interested in the scale developed by Price and Ridgway (1983). They developed a scale to measure the use innovativeness of the general population. They offered a 44-item scale divided into 5 dimensions that measures use innovativeness. The authors contrasted the reliability and validity of this measurement instrument.
This instrument is not focused on “lead users” per se, but there are some dimensions like “Creativity/Curiosity” or “Creative Use” and some items that are closely related to concept of lead user. Furthermore, the scale is a cross-market centered scale and it is not focused on a specific product category.
In summary, we note that there is a gap in the literature concerning the identification of “lead users” through measurement scales. There is clearly no existing cross-market and cross-industrial scale to measure the profile of the consumer who is at the forefront of market trends.
5Main objective and methodologyIn order to address this shortcoming (survey to measure user innovation and scale to identify “lead users”) and having reviewed the relevant literature on user innovation, “lead users” and a variety of scales, this study aims to create an instrument to identify “lead users”. In addition, our assumption is that “lead users” are leaders in new markets; they are curious, creative and have the necessary time and skills for product development. We have called this new scale “Consumers at the Cutting-Edge”, i.e. consumers who are at the cutting-edge of market trends. We developed a questionnaire for this purpose consisting of relevant items used in previous research on the subject as well as several ad hoc items.
The structure of the 3-part questionnaire is as follows:
- (1)
The first part seeks to identify consumers who either created a new product, substantially modified an existing one or developed an idea for a new product in a given period of time.
- (2)
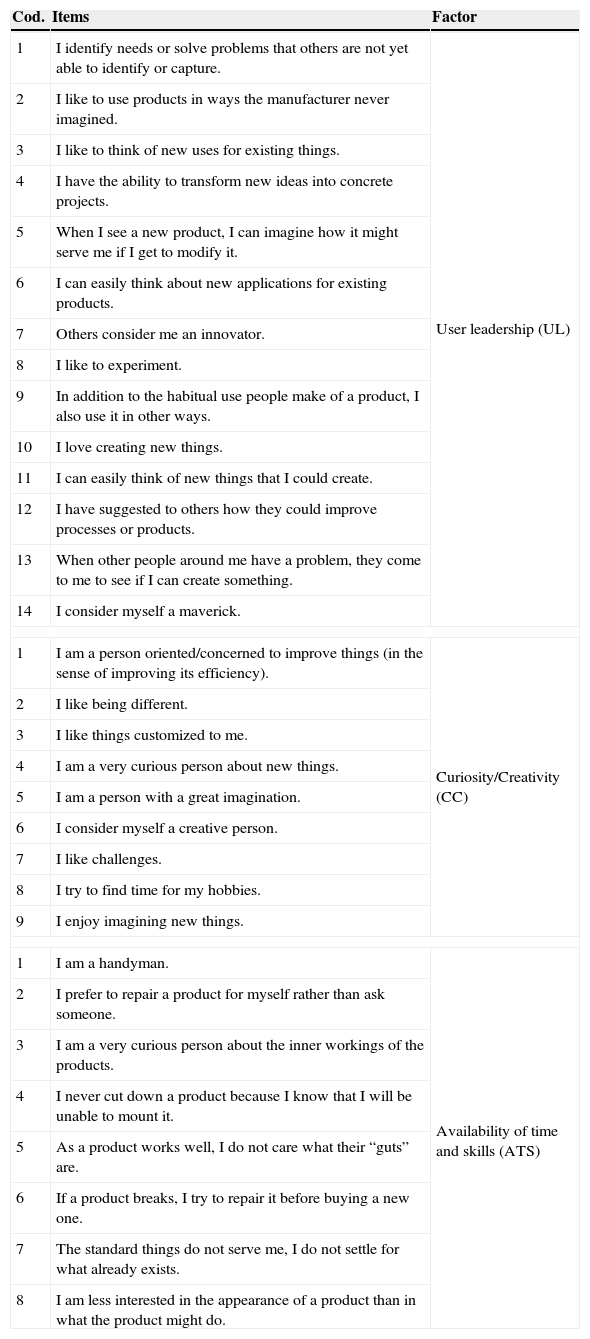
A second part attempts to characterize these advanced users according to their behavioral characteristics. This constitutes a new measurement scale for identifying “lead users”. We have called it “Consumers at the Cutting-Edge”, it contains 31 items divided into three factors or dimensions, and each item is measured on a 5-point Likert type scale. The dimensions or factors are: “User leadership”, “Curiosity/creativity” and “Availability of time and skills for product development”, based mainly on Price and Ridgway's study (1983).
- (3)
Finally, the third part of the questionnaire characterizes the respondents sociodemographically.
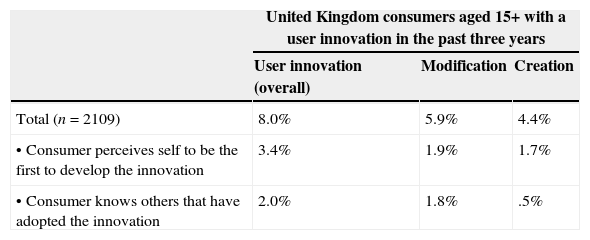
The questionnaire was administered in Gipuzkoa to a non-representative sample of adults. A convenience sampling method was used due to financial constraints. The researchers gave three copies of the questionnaire to a convenience sample of students undertaking Business Administration and Communication degrees. They were asked to answer one of the questionnaires themselves, and to give another to an adult (“a person from his/her parents’ generation”), and the third one to a 55-year-old consumer or older (“a person from his/her grandparents’ generation”).
Finally, the sample size was 508 valid respondents. In the coding process, individuals under 18 and individuals with incoherent answers were removed from the sample. The technical specification for the survey is detailed in the following Table 3.
Technical specification for the survey.
| Head of the field work | Research team |
| Date of the field work | November 2011 to February 2012 |
| Geographical scope of the research | Gipuzkoa (Basque Country, Spain) |
| Survey method | Self-administered questionnaire |
| Statistical unit | Gipuzkoa citizens aged 18 or over |
| Sample size | 508 valid respondents |
| Sample method | Convenience sampling |
A first screening process was carried out in order to avoid false positives of creation or modification of products. First, we explicitly asked for new products, so “home-made” products considered the equivalent of those already available on the market were rejected. And second, we asked only for innovation developed during leisure time; thus, innovations developed on-the-job were also rejected. The data obtained in the field have been processed with PASW Statistics 18.
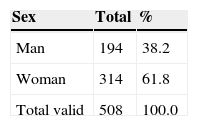
Table 4 shows the distribution of the sample. It is characterized by a large percentage of women: 61.8% of the respondents were women. Just over a third of the respondents were aged 30 or younger; almost 20% were aged between 31 and 50; about 22% were between 51 and 60; and approximately 24% were over 60 years old. Regarding their level of education, more than half respondents possess university degrees; just over 25% completed secondary education; roughly 12% completed primary education; and only 5% have no qualifications whatsoever. We also asked about technical qualifications. Just over 10% of the sample had technical qualifications.
Distribution of the sample (n=508).
| Sex | Total | % |
|---|---|---|
| Man | 194 | 38.2 |
| Woman | 314 | 61.8 |
| Total valid | 508 | 100.0 |
| Age | Total | % |
|---|---|---|
| ≤30 | 176 | 34.9 |
| 31–50 | 100 | 19.8 |
| 51–60 | 109 | 21.6 |
| ≤60 | 120 | 23.8 |
| Total valid | 505 | 100.0 |
| Not valid | 3 | – |
| Qualifications | Total | % |
|---|---|---|
| No studies/No qualifications | 25 | 5.1 |
| Primary education | 61 | 12.3 |
| Secondary education | 125 | 25.3 |
| Intermediate graduate studies | 15 | 27.3 |
| Graduate studies | 148 | 30.0 |
| Total valid | 494 | 100.0 |
| Not valid | 14 | – |
| Technical qualifications | Total | % |
|---|---|---|
| No | 416 | 88.9 |
| Yes | 52 | 11.1 |
| Total valid | 468 | 100.0 |
| Not valid | 40 | – |
The results are presented in two separate sections: (1) extent of user innovation: number of individuals who have created a new product, substantially modified an existing one, and/or developed an idea for a new product; and (2) the measurement scale.
6.1Extent of user innovationAs far as the preliminary results are concerned, in total, out of a total of 508 valid respondents, 49 individuals answered ‘yes’ to whether they had ever created a new product, substantially modified an existing one, or developed an idea for a new product.
In a second screening process, these ‘positive’ questionnaires were checked in detail to identify false positives. The novelty of the products (or the modifications of the products) developed by these users was assessed by the three authors. As a result, 47% of these favorable answers were removed. They were instances where the ‘innovation’ was not considered to significantly improve an existing product.
After the screening process, we identified 25 individuals out of 508 (5.0%) who were able to describe their own user innovation and who could be identified as “a new product creator”, “a customizer of an existing product” or “an idea developer”. We found that over the last 3 years, 1.6% of the respondents (8 individuals) in the sample had created a new product (3 of them described more than one self-created innovative product, while 5 referred to a unique innovation), another 1.4% (7 individuals) substantially modified an existing product, and another 2.0% (10 individuals) developed an idea for a new product.6
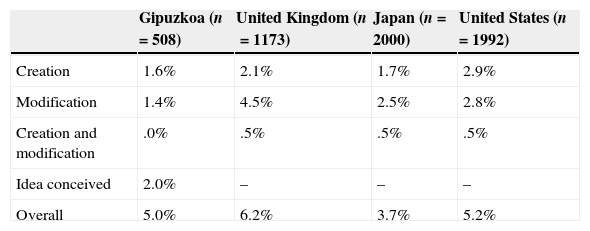
In Table 5 we compare our results with those from similar studies conducted in the United Kingdom, Japan and the United States. Our results are similar to the ones found in the Japanese study, but the percentage of innovative users in Gipuzkoa is somewhat lower than in the United Kingdom or the United States. The modality “user innovation” which refers to individuals who conceive new ideas is not present in these other studies, therefore we were unable to draw any comparison in this regard.
User innovation performed by consumers in Gipuzkoa, the United Kingdom, Japan and the United States.
| Gipuzkoa (n=508) | United Kingdom (n=1173) | Japan (n=2000) | United States (n=1992) | |
|---|---|---|---|---|
| Creation | 1.6% | 2.1% | 1.7% | 2.9% |
| Modification | 1.4% | 4.5% | 2.5% | 2.8% |
| Creation and modification | .0% | .5% | .5% | .5% |
| Idea conceived | 2.0% | – | – | – |
| Overall | 5.0% | 6.2% | 3.7% | 5.2% |
The rate of user innovation in these cross-market studies is lower than in specific product category studies. When the user innovation study is focused on a product category related to sports (mountain biking equipment or extreme sporting equipment) or hobbies (outdoor consumer products, gardening or car tuning) the amount of user innovation increases. Ogawa and Pongtanalert (2011) offered an explanation for this. They maintain the hypothesis that “consumers belonging to communities sharing a common interest in the product to be created or modified tend to be helped by others in product innovation more than people who did not belong to such communities” (Ogawa and Pongtanalert, 2011, p. 9). So, they assume that “previous research reported higher percentages of users collaborating on innovation because it studied consumers belonging to specific communities, for example sports and hobbies” (Ogawa and Pongtanalert, 2011, p. 9).
6.2The measurement scaleBefore we deal with the real object of this study, the measuring instrument, we need to offer a tentative definition of who the “lead user” is, in other words, what kind of person creates a new product, modifies an existing one or develops ideas for new ones.
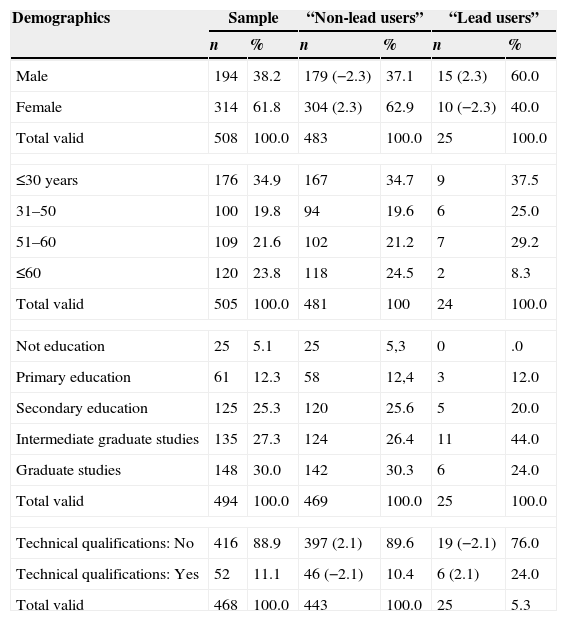
6.2.1DemographicsDue to the sampling method used, it is not correct to speak in terms of inference, but the exercise of contrasting some data does suggest some trends. In this case we refer to the 25 individuals who reported having created a new product or having modified a new one or having developed an idea for a new product.
By gender, we note that there were more men than women who said that they had created or modified a new product or who came up with an idea for a new product. We observed a relation between gender and having created, modified or developed an idea for a new product. The adjusted standardized residuals shown in Table 6 (±2.3) indicate that men have done so at significantly higher rates than women. According to age, in relative terms of the sample, young adults (31–50 years old) and adults (51–60 years old) seem to be the most “lead user”-like. These two groups exhibit a higher propensity to innovate than other groups, but the differences are not significant (there are no extreme values in the adjusted standardized residuals). Regarding education, these individuals have intermediate graduate qualifications in a higher proportion than the rest of consumers, but the differences are not significant (there are no extreme values in the adjusted standardized residuals). The distribution of consumers according to their technical qualifications is also displayed. There are more “lead users” with technical qualifications than “non-lead users”. We observed an association between technical qualifications and the propensity to innovate. The adjusted standardized residuals (±2.1) indicate that individuals with technical qualifications show significantly higher innovation activity than the total sample.
Incidence of user innovation in the sample (Gipuzkoa) (significant adjusted standardized residuals are shown in parentheses).
| Demographics | Sample | “Non-lead users” | “Lead users” | |||
|---|---|---|---|---|---|---|
| n | % | n | % | n | % | |
| Male | 194 | 38.2 | 179 (−2.3) | 37.1 | 15 (2.3) | 60.0 |
| Female | 314 | 61.8 | 304 (2.3) | 62.9 | 10 (−2.3) | 40.0 |
| Total valid | 508 | 100.0 | 483 | 100.0 | 25 | 100.0 |
| ≤30 years | 176 | 34.9 | 167 | 34.7 | 9 | 37.5 |
| 31–50 | 100 | 19.8 | 94 | 19.6 | 6 | 25.0 |
| 51–60 | 109 | 21.6 | 102 | 21.2 | 7 | 29.2 |
| ≤60 | 120 | 23.8 | 118 | 24.5 | 2 | 8.3 |
| Total valid | 505 | 100.0 | 481 | 100 | 24 | 100.0 |
| Not education | 25 | 5.1 | 25 | 5,3 | 0 | .0 |
| Primary education | 61 | 12.3 | 58 | 12,4 | 3 | 12.0 |
| Secondary education | 125 | 25.3 | 120 | 25.6 | 5 | 20.0 |
| Intermediate graduate studies | 135 | 27.3 | 124 | 26.4 | 11 | 44.0 |
| Graduate studies | 148 | 30.0 | 142 | 30.3 | 6 | 24.0 |
| Total valid | 494 | 100.0 | 469 | 100.0 | 25 | 100.0 |
| Technical qualifications: No | 416 | 88.9 | 397 (2.1) | 89.6 | 19 (−2.1) | 76.0 |
| Technical qualifications: Yes | 52 | 11.1 | 46 (−2.1) | 10.4 | 6 (2.1) | 24.0 |
| Total valid | 468 | 100.0 | 443 | 100.0 | 25 | 5.3 |
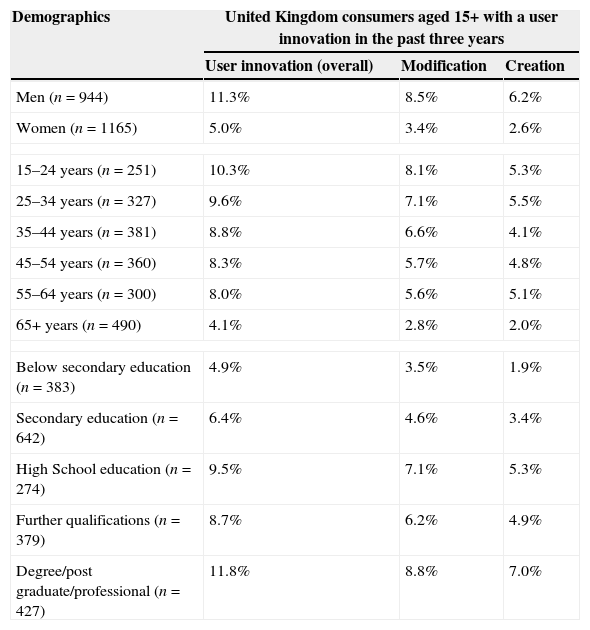
Flowers et al. (2010) also reported on the profile of “lead users”. According to their study they are mainly male, young, employed, and with a high academic level. Table 7 shows the incidence of user innovations broken down according to gender, age and education.
“Lead users”’ profile by gender, age and educational attainment.
| Demographics | United Kingdom consumers aged 15+ with a user innovation in the past three years | ||
|---|---|---|---|
| User innovation (overall) | Modification | Creation | |
| Men (n=944) | 11.3% | 8.5% | 6.2% |
| Women (n=1165) | 5.0% | 3.4% | 2.6% |
| 15–24 years (n=251) | 10.3% | 8.1% | 5.3% |
| 25–34 years (n=327) | 9.6% | 7.1% | 5.5% |
| 35–44 years (n=381) | 8.8% | 6.6% | 4.1% |
| 45–54 years (n=360) | 8.3% | 5.7% | 4.8% |
| 55–64 years (n=300) | 8.0% | 5.6% | 5.1% |
| 65+ years (n=490) | 4.1% | 2.8% | 2.0% |
| Below secondary education (n=383) | 4.9% | 3.5% | 1.9% |
| Secondary education (n=642) | 6.4% | 4.6% | 3.4% |
| High School education (n=274) | 9.5% | 7.1% | 5.3% |
| Further qualifications (n=379) | 8.7% | 6.2% | 4.9% |
| Degree/post graduate/professional (n=427) | 11.8% | 8.8% | 7.0% |
Ogawa and Pongtanalert (2011) compare the results of the United Kingdom, Japan and the United States. Regarding the profile of innovative users, the authors concluded that “…in the United States the tendency for innovation was more pronounced in people aged 55–64, executives and independent professionals (lawyers, consultants, and the like), people with undergraduate degrees or higher and people having technical education. In Japan, the tendency to innovation was more pronounced among retired people, people self-employed in commercial, industrial, and services, people aged 60–64, people with PhD degree, and men” (Ogawa and Pongtanalert, 2011, p. 9).
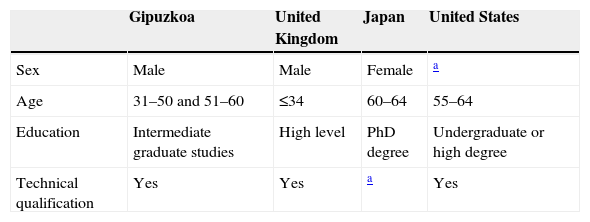
Table 8 summarizes the profile of “lead users” for these regions. Despite the lack of information, we can observe some similarities and differences. In Gipuzkoa, as in the United Kingdom, there are more men than women “lead users”; while in Japan there are more women who innovate than men. Regarding age, in Gipuzkoa these consumers tend to be young adults and adults. This result is more similar to Japan and the United States – where individuals who innovate are adults – than to the United Kingdom – where “lead users” are younger –. In all cases, these consumers are highly educated. And, finally, these individuals have technical qualifications.
Comparison of “lead users”’ profile by countries.
| Gipuzkoa | United Kingdom | Japan | United States | |
|---|---|---|---|---|
| Sex | Male | Male | Female | a |
| Age | 31–50 and 51–60 | ≤34 | 60–64 | 55–64 |
| Education | Intermediate graduate studies | High level | PhD degree | Undergraduate or high degree |
| Technical qualification | Yes | Yes | a | Yes |
In this section we are going to test the goodness of the ad hoc scale we have created. The scale is configured according to three theoretical dimensions: “User leadership”, “Curiosity/Creativity” and “Availability of time and skills” for product development. Table 9 identifies the items and the dimensions or factors.
Consumers at the cutting-edge scale.
| Cod. | Items | Factor |
|---|---|---|
| 1 | I identify needs or solve problems that others are not yet able to identify or capture. | User leadership (UL) |
| 2 | I like to use products in ways the manufacturer never imagined. | |
| 3 | I like to think of new uses for existing things. | |
| 4 | I have the ability to transform new ideas into concrete projects. | |
| 5 | When I see a new product, I can imagine how it might serve me if I get to modify it. | |
| 6 | I can easily think about new applications for existing products. | |
| 7 | Others consider me an innovator. | |
| 8 | I like to experiment. | |
| 9 | In addition to the habitual use people make of a product, I also use it in other ways. | |
| 10 | I love creating new things. | |
| 11 | I can easily think of new things that I could create. | |
| 12 | I have suggested to others how they could improve processes or products. | |
| 13 | When other people around me have a problem, they come to me to see if I can create something. | |
| 14 | I consider myself a maverick. | |
| 1 | I am a person oriented/concerned to improve things (in the sense of improving its efficiency). | Curiosity/Creativity (CC) |
| 2 | I like being different. | |
| 3 | I like things customized to me. | |
| 4 | I am a very curious person about new things. | |
| 5 | I am a person with a great imagination. | |
| 6 | I consider myself a creative person. | |
| 7 | I like challenges. | |
| 8 | I try to find time for my hobbies. | |
| 9 | I enjoy imagining new things. | |
| 1 | I am a handyman. | Availability of time and skills (ATS) |
| 2 | I prefer to repair a product for myself rather than ask someone. | |
| 3 | I am a very curious person about the inner workings of the products. | |
| 4 | I never cut down a product because I know that I will be unable to mount it. | |
| 5 | As a product works well, I do not care what their “guts” are. | |
| 6 | If a product breaks, I try to repair it before buying a new one. | |
| 7 | The standard things do not serve me, I do not settle for what already exists. | |
| 8 | I am less interested in the appearance of a product than in what the product might do. | |
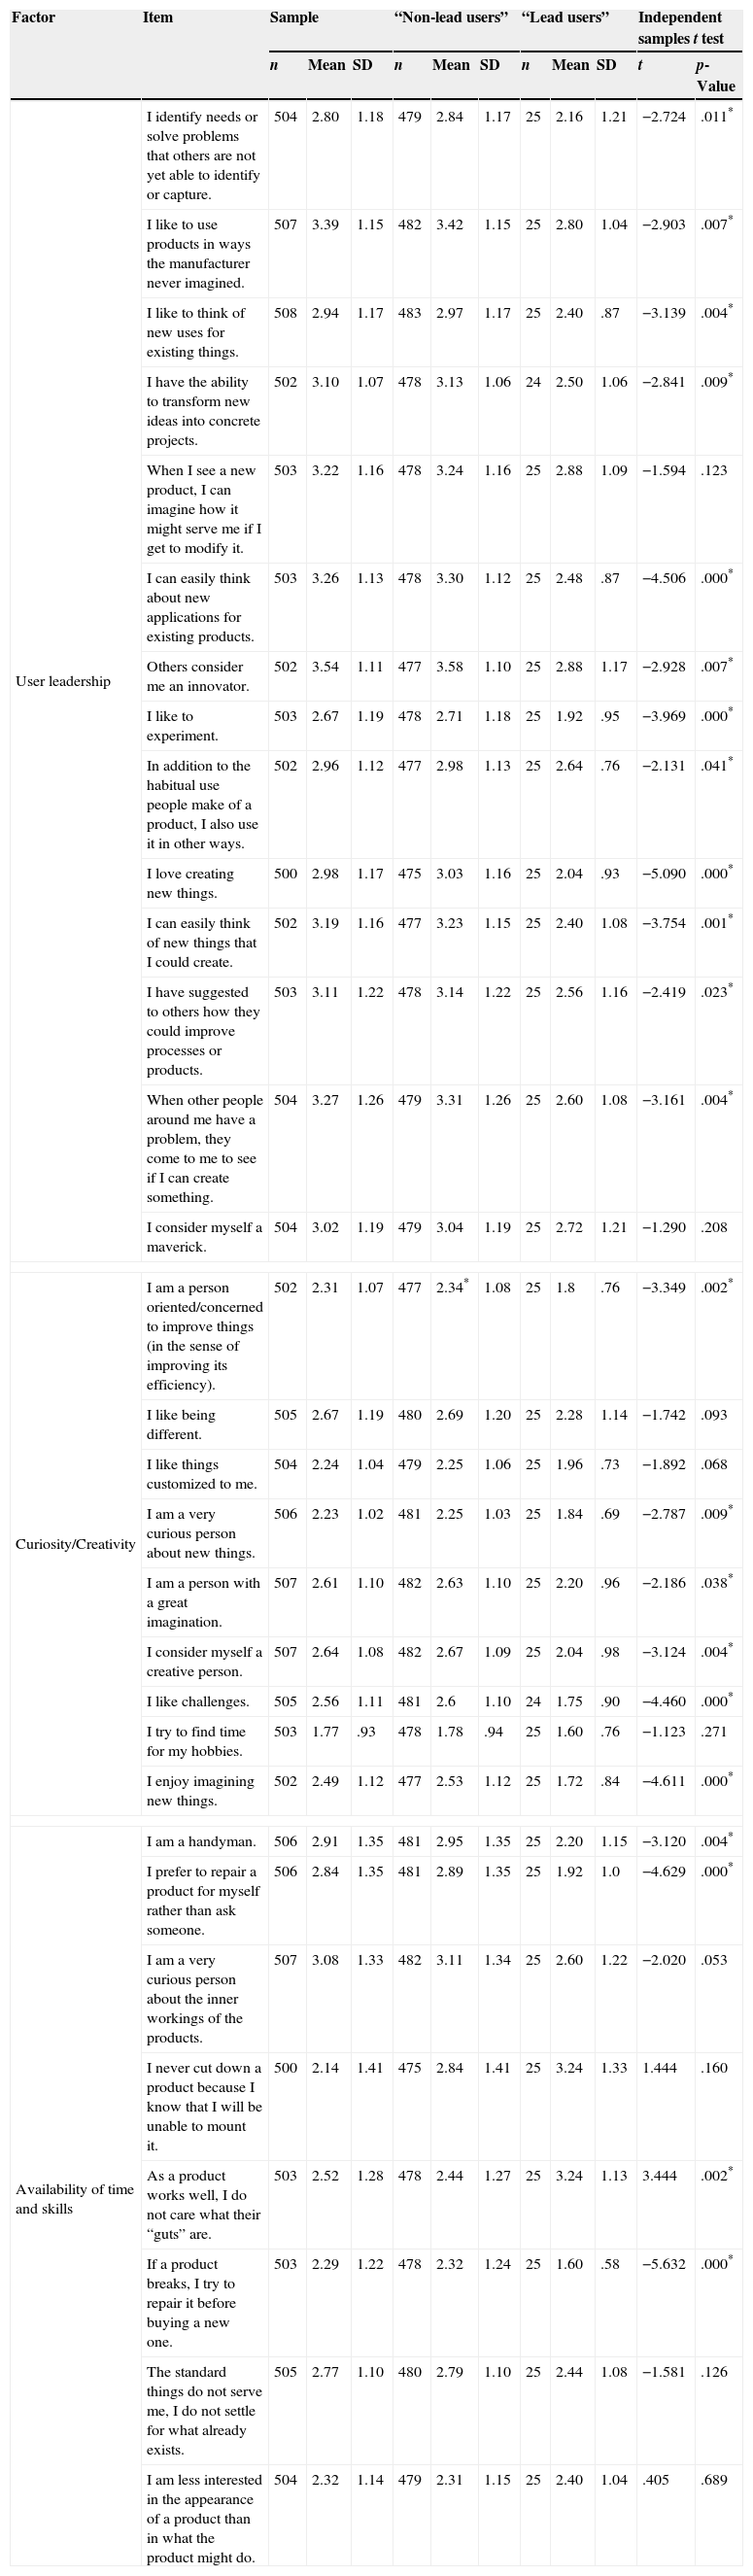
Table 10 shows means and standard deviations for the overall sample, and for individuals who have created or modified a new product or have developed an idea. The mean for the whole sample is 2.77, for “lead users” the score is 2.22 and for the “non-lead users” is 2.80 (within the range of 1–5, where values close to 1 mean that the individual has an innovative profile and scores close to 5 indicate that the subject has little or no innovative profile). In the table we have marked the items that show significant differences (*p<.05) between “lead users” and “non-lead users” with an asterisk.
Means and standard deviations for the overall sample, “lead users” and “non-lead users”.
| Factor | Item | Sample | “Non-lead users” | “Lead users” | Independent samples t test | |||||||
|---|---|---|---|---|---|---|---|---|---|---|---|---|
| n | Mean | SD | n | Mean | SD | n | Mean | SD | t | p-Value | ||
| User leadership | I identify needs or solve problems that others are not yet able to identify or capture. | 504 | 2.80 | 1.18 | 479 | 2.84 | 1.17 | 25 | 2.16 | 1.21 | −2.724 | .011* |
| I like to use products in ways the manufacturer never imagined. | 507 | 3.39 | 1.15 | 482 | 3.42 | 1.15 | 25 | 2.80 | 1.04 | −2.903 | .007* | |
| I like to think of new uses for existing things. | 508 | 2.94 | 1.17 | 483 | 2.97 | 1.17 | 25 | 2.40 | .87 | −3.139 | .004* | |
| I have the ability to transform new ideas into concrete projects. | 502 | 3.10 | 1.07 | 478 | 3.13 | 1.06 | 24 | 2.50 | 1.06 | −2.841 | .009* | |
| When I see a new product, I can imagine how it might serve me if I get to modify it. | 503 | 3.22 | 1.16 | 478 | 3.24 | 1.16 | 25 | 2.88 | 1.09 | −1.594 | .123 | |
| I can easily think about new applications for existing products. | 503 | 3.26 | 1.13 | 478 | 3.30 | 1.12 | 25 | 2.48 | .87 | −4.506 | .000* | |
| Others consider me an innovator. | 502 | 3.54 | 1.11 | 477 | 3.58 | 1.10 | 25 | 2.88 | 1.17 | −2.928 | .007* | |
| I like to experiment. | 503 | 2.67 | 1.19 | 478 | 2.71 | 1.18 | 25 | 1.92 | .95 | −3.969 | .000* | |
| In addition to the habitual use people make of a product, I also use it in other ways. | 502 | 2.96 | 1.12 | 477 | 2.98 | 1.13 | 25 | 2.64 | .76 | −2.131 | .041* | |
| I love creating new things. | 500 | 2.98 | 1.17 | 475 | 3.03 | 1.16 | 25 | 2.04 | .93 | −5.090 | .000* | |
| I can easily think of new things that I could create. | 502 | 3.19 | 1.16 | 477 | 3.23 | 1.15 | 25 | 2.40 | 1.08 | −3.754 | .001* | |
| I have suggested to others how they could improve processes or products. | 503 | 3.11 | 1.22 | 478 | 3.14 | 1.22 | 25 | 2.56 | 1.16 | −2.419 | .023* | |
| When other people around me have a problem, they come to me to see if I can create something. | 504 | 3.27 | 1.26 | 479 | 3.31 | 1.26 | 25 | 2.60 | 1.08 | −3.161 | .004* | |
| I consider myself a maverick. | 504 | 3.02 | 1.19 | 479 | 3.04 | 1.19 | 25 | 2.72 | 1.21 | −1.290 | .208 | |
| Curiosity/Creativity | I am a person oriented/concerned to improve things (in the sense of improving its efficiency). | 502 | 2.31 | 1.07 | 477 | 2.34* | 1.08 | 25 | 1.8 | .76 | −3.349 | .002* |
| I like being different. | 505 | 2.67 | 1.19 | 480 | 2.69 | 1.20 | 25 | 2.28 | 1.14 | −1.742 | .093 | |
| I like things customized to me. | 504 | 2.24 | 1.04 | 479 | 2.25 | 1.06 | 25 | 1.96 | .73 | −1.892 | .068 | |
| I am a very curious person about new things. | 506 | 2.23 | 1.02 | 481 | 2.25 | 1.03 | 25 | 1.84 | .69 | −2.787 | .009* | |
| I am a person with a great imagination. | 507 | 2.61 | 1.10 | 482 | 2.63 | 1.10 | 25 | 2.20 | .96 | −2.186 | .038* | |
| I consider myself a creative person. | 507 | 2.64 | 1.08 | 482 | 2.67 | 1.09 | 25 | 2.04 | .98 | −3.124 | .004* | |
| I like challenges. | 505 | 2.56 | 1.11 | 481 | 2.6 | 1.10 | 24 | 1.75 | .90 | −4.460 | .000* | |
| I try to find time for my hobbies. | 503 | 1.77 | .93 | 478 | 1.78 | .94 | 25 | 1.60 | .76 | −1.123 | .271 | |
| I enjoy imagining new things. | 502 | 2.49 | 1.12 | 477 | 2.53 | 1.12 | 25 | 1.72 | .84 | −4.611 | .000* | |
| Availability of time and skills | I am a handyman. | 506 | 2.91 | 1.35 | 481 | 2.95 | 1.35 | 25 | 2.20 | 1.15 | −3.120 | .004* |
| I prefer to repair a product for myself rather than ask someone. | 506 | 2.84 | 1.35 | 481 | 2.89 | 1.35 | 25 | 1.92 | 1.0 | −4.629 | .000* | |
| I am a very curious person about the inner workings of the products. | 507 | 3.08 | 1.33 | 482 | 3.11 | 1.34 | 25 | 2.60 | 1.22 | −2.020 | .053 | |
| I never cut down a product because I know that I will be unable to mount it. | 500 | 2.14 | 1.41 | 475 | 2.84 | 1.41 | 25 | 3.24 | 1.33 | 1.444 | .160 | |
| As a product works well, I do not care what their “guts” are. | 503 | 2.52 | 1.28 | 478 | 2.44 | 1.27 | 25 | 3.24 | 1.13 | 3.444 | .002* | |
| If a product breaks, I try to repair it before buying a new one. | 503 | 2.29 | 1.22 | 478 | 2.32 | 1.24 | 25 | 1.60 | .58 | −5.632 | .000* | |
| The standard things do not serve me, I do not settle for what already exists. | 505 | 2.77 | 1.10 | 480 | 2.79 | 1.10 | 25 | 2.44 | 1.08 | −1.581 | .126 | |
| I am less interested in the appearance of a product than in what the product might do. | 504 | 2.32 | 1.14 | 479 | 2.31 | 1.15 | 25 | 2.40 | 1.04 | .405 | .689 | |
* p <0.05.
In order to check the number of factors conceptualized in the theoretical model, an exploratory factorial analysis was performed. Then, a reliability analysis was carried out. Cronbach's alpha coefficient was calculated. The factor analysis in conjunction with the reliability analysis made it possible to purify the measurement scale. Items that did not reach generally accepted thresholds were eliminated.
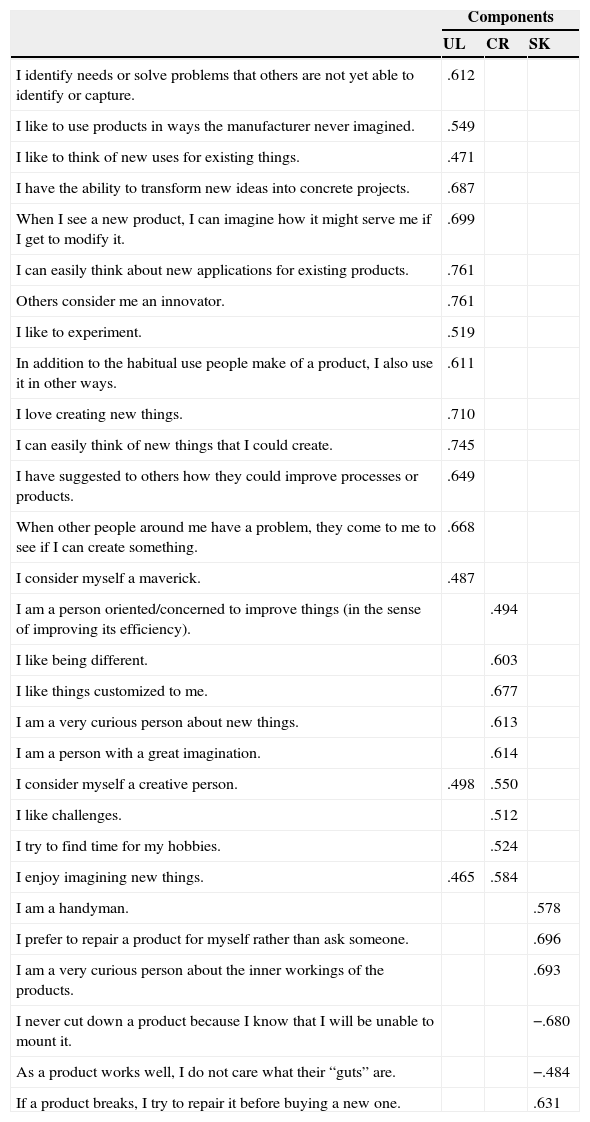
Table 11 shows the factor loadings after once principal component analysis with varimax rotation had been applied. Items were loaded in three factors, which explain 51.20% of the total variability of the data. We decided to eliminate items with loadings below .45:
- -
I am less interested in the appearance of a product than in what the product might do (Creativity/Curiosity).
- -
The standard things do not serve me, I do not settle for what already exists (Creativity/Curiosity).
Rotated component matrix.a
| Components | |||
|---|---|---|---|
| UL | CR | SK | |
| I identify needs or solve problems that others are not yet able to identify or capture. | .612 | ||
| I like to use products in ways the manufacturer never imagined. | .549 | ||
| I like to think of new uses for existing things. | .471 | ||
| I have the ability to transform new ideas into concrete projects. | .687 | ||
| When I see a new product, I can imagine how it might serve me if I get to modify it. | .699 | ||
| I can easily think about new applications for existing products. | .761 | ||
| Others consider me an innovator. | .761 | ||
| I like to experiment. | .519 | ||
| In addition to the habitual use people make of a product, I also use it in other ways. | .611 | ||
| I love creating new things. | .710 | ||
| I can easily think of new things that I could create. | .745 | ||
| I have suggested to others how they could improve processes or products. | .649 | ||
| When other people around me have a problem, they come to me to see if I can create something. | .668 | ||
| I consider myself a maverick. | .487 | ||
| I am a person oriented/concerned to improve things (in the sense of improving its efficiency). | .494 | ||
| I like being different. | .603 | ||
| I like things customized to me. | .677 | ||
| I am a very curious person about new things. | .613 | ||
| I am a person with a great imagination. | .614 | ||
| I consider myself a creative person. | .498 | .550 | |
| I like challenges. | .512 | ||
| I try to find time for my hobbies. | .524 | ||
| I enjoy imagining new things. | .465 | .584 | |
| I am a handyman. | .578 | ||
| I prefer to repair a product for myself rather than ask someone. | .696 | ||
| I am a very curious person about the inner workings of the products. | .693 | ||
| I never cut down a product because I know that I will be unable to mount it. | −.680 | ||
| As a product works well, I do not care what their “guts” are. | −.484 | ||
| If a product breaks, I try to repair it before buying a new one. | .631 | ||
Extraction method: principal component analysis.
Rotation method: Varimax with Kaiser normalization.
All items show relatively strong factor loadings (above .45) on the theoretical dimensions assigned. It is necessary to point out that two items showed high loadings in two dimensions. However, the highest score is in the theoretical dimension assigned to the item. Based on these results, we can assert that our scale satisfies the requirement of construct validity.
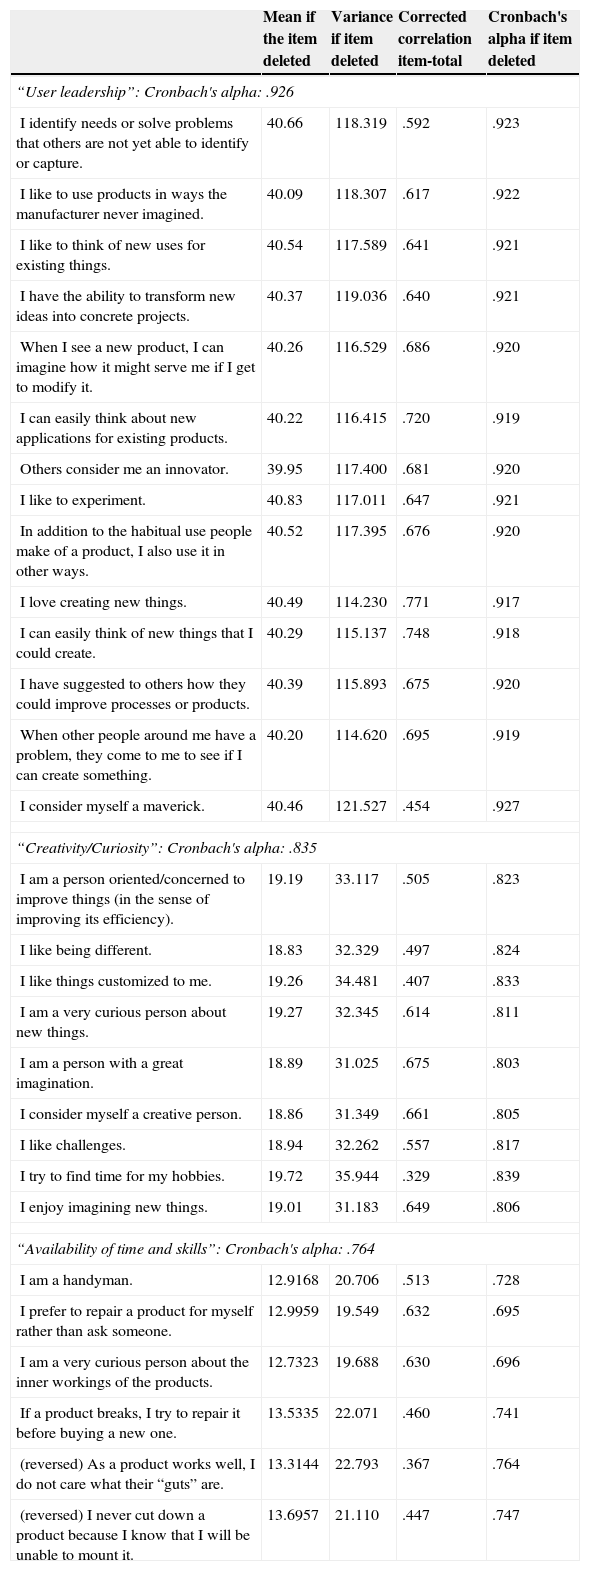
Next, we proceeded to test the reliability of the scale. Table 12 shows the reliability indexes. The results can be regarded as very satisfactory. In all cases the possible elimination of an item does not significantly improve the reliability of the scale, while it would restrict the information provided. Here is a detailed account for each dimension:
- -
“User leadership”: Cronbach's alpha improves from .926 to .927 eliminating “I consider myself a maverick”. The loss of information resulting from its removal makes it not worthwhile to do so.
- -
“Creativity/Curiosity”: Cronbach's alpha improves from .835 to .839 eliminating “I try to find time for my hobbies”. The loss of information resulting from its removal makes it not worthwhile to do so.
- -
“Availability of time and skills”: deleting an item does not improve Cronbach's alpha.
Statistics total-item for each dimension.
| Mean if the item deleted | Variance if item deleted | Corrected correlation item-total | Cronbach's alpha if item deleted | |
|---|---|---|---|---|
| “User leadership”: Cronbach's alpha: .926 | ||||
| I identify needs or solve problems that others are not yet able to identify or capture. | 40.66 | 118.319 | .592 | .923 |
| I like to use products in ways the manufacturer never imagined. | 40.09 | 118.307 | .617 | .922 |
| I like to think of new uses for existing things. | 40.54 | 117.589 | .641 | .921 |
| I have the ability to transform new ideas into concrete projects. | 40.37 | 119.036 | .640 | .921 |
| When I see a new product, I can imagine how it might serve me if I get to modify it. | 40.26 | 116.529 | .686 | .920 |
| I can easily think about new applications for existing products. | 40.22 | 116.415 | .720 | .919 |
| Others consider me an innovator. | 39.95 | 117.400 | .681 | .920 |
| I like to experiment. | 40.83 | 117.011 | .647 | .921 |
| In addition to the habitual use people make of a product, I also use it in other ways. | 40.52 | 117.395 | .676 | .920 |
| I love creating new things. | 40.49 | 114.230 | .771 | .917 |
| I can easily think of new things that I could create. | 40.29 | 115.137 | .748 | .918 |
| I have suggested to others how they could improve processes or products. | 40.39 | 115.893 | .675 | .920 |
| When other people around me have a problem, they come to me to see if I can create something. | 40.20 | 114.620 | .695 | .919 |
| I consider myself a maverick. | 40.46 | 121.527 | .454 | .927 |
| “Creativity/Curiosity”: Cronbach's alpha: .835 | ||||
| I am a person oriented/concerned to improve things (in the sense of improving its efficiency). | 19.19 | 33.117 | .505 | .823 |
| I like being different. | 18.83 | 32.329 | .497 | .824 |
| I like things customized to me. | 19.26 | 34.481 | .407 | .833 |
| I am a very curious person about new things. | 19.27 | 32.345 | .614 | .811 |
| I am a person with a great imagination. | 18.89 | 31.025 | .675 | .803 |
| I consider myself a creative person. | 18.86 | 31.349 | .661 | .805 |
| I like challenges. | 18.94 | 32.262 | .557 | .817 |
| I try to find time for my hobbies. | 19.72 | 35.944 | .329 | .839 |
| I enjoy imagining new things. | 19.01 | 31.183 | .649 | .806 |
| “Availability of time and skills”: Cronbach's alpha: .764 | ||||
| I am a handyman. | 12.9168 | 20.706 | .513 | .728 |
| I prefer to repair a product for myself rather than ask someone. | 12.9959 | 19.549 | .632 | .695 |
| I am a very curious person about the inner workings of the products. | 12.7323 | 19.688 | .630 | .696 |
| If a product breaks, I try to repair it before buying a new one. | 13.5335 | 22.071 | .460 | .741 |
| (reversed) As a product works well, I do not care what their “guts” are. | 13.3144 | 22.793 | .367 | .764 |
| (reversed) I never cut down a product because I know that I will be unable to mount it. | 13.6957 | 21.110 | .447 | .747 |
In short, it can be stated that the proposed measuring instrument is reliable.
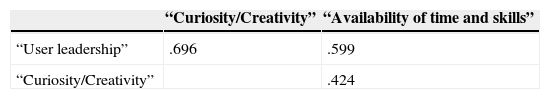
In addition, Table 13 shows the Pearson correlations among the three dimensions of the global scale. Since every dimension shows a considerably higher Cronbach's alpha than its correlation with any of the other dimensions, discriminant validity is upheld.
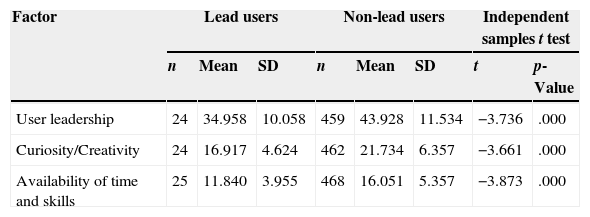
Furthermore, Table 14 presents the descriptive results of the three scales for innovative consumers and non-innovative consumers. In this table, we observe that “lead users” have a higher cutting-edge profile in each dimension of the scale (significant lower means) than “non-lead users”. These results evidence the criterion validity of the composed measure, as the scale scores can clearly differentiate the positions of both groups.
Cutting-edge consumers profile: “lead users” vs. “non-lead users”.
| Factor | Lead users | Non-lead users | Independent samples t test | |||||
|---|---|---|---|---|---|---|---|---|
| n | Mean | SD | n | Mean | SD | t | p-Value | |
| User leadership | 24 | 34.958 | 10.058 | 459 | 43.928 | 11.534 | −3.736 | .000 |
| Curiosity/Creativity | 24 | 16.917 | 4.624 | 462 | 21.734 | 6.357 | −3.661 | .000 |
| Availability of time and skills | 25 | 11.840 | 3.955 | 468 | 16.051 | 5.357 | −3.873 | .000 |
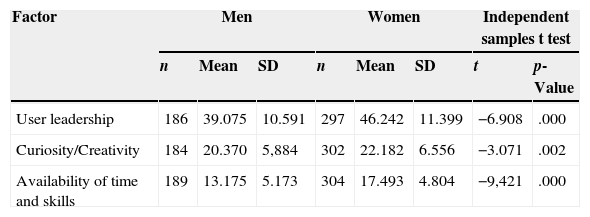
Having verified the quality of the scale, we endeavored to study the profile of the consumers at the cutting-edge in greater depth. We have also computed the average score for each of the three dimensions of the scale for women and men. Table 15 indicates that men show a higher cutting-edge profile in each dimension of the scale (significant lower means) than women.
Cutting-edge consumers profile: men vs. women.
| Factor | Men | Women | Independent samples t test | |||||
|---|---|---|---|---|---|---|---|---|
| n | Mean | SD | n | Mean | SD | t | p-Value | |
| User leadership | 186 | 39.075 | 10.591 | 297 | 46.242 | 11.399 | −6.908 | .000 |
| Curiosity/Creativity | 184 | 20.370 | 5,884 | 302 | 22.182 | 6.556 | −3.071 | .002 |
| Availability of time and skills | 189 | 13.175 | 5.173 | 304 | 17.493 | 4.804 | −9,421 | .000 |
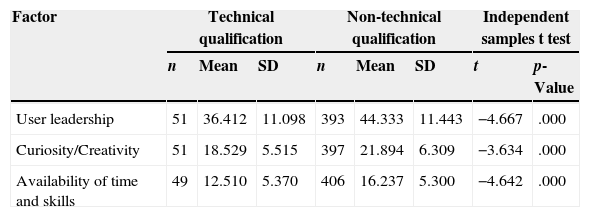
Concerning technical qualifications (see Table 16), technically qualified consumers show a higher cutting-edge profile in each dimension of the scale (significant lower means) than non-technically qualified ones.
Cutting-edge consumers profile by level of technical qualification.
| Factor | Technical qualification | Non-technical qualification | Independent samples t test | |||||
|---|---|---|---|---|---|---|---|---|
| n | Mean | SD | n | Mean | SD | t | p-Value | |
| User leadership | 51 | 36.412 | 11.098 | 393 | 44.333 | 11.443 | −4.667 | .000 |
| Curiosity/Creativity | 51 | 18.529 | 5.515 | 397 | 21.894 | 6.309 | −3.634 | .000 |
| Availability of time and skills | 49 | 12.510 | 5.370 | 406 | 16.237 | 5.300 | −4.642 | .000 |
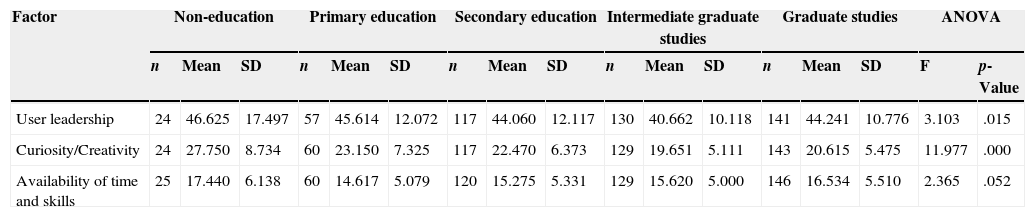
Finally, we calculated the average scores by level of education for each dimension of the cutting-edge scale. We observed significant differences in “User leadership” and “Curiosity/Creativity” dimensions. Consumers with the higher levels of education show a higher cutting-edge profile in these two dimensions of the scale (significant lower means) than consumers with lower levels of education. In the “Availability of time and skills” dimension, consumers with primary education have the higher cutting-edge profile (see Table 17).
Cutting-edge consumers profile by level of education.
| Factor | Non-education | Primary education | Secondary education | Intermediate graduate studies | Graduate studies | ANOVA | |||||||||||
|---|---|---|---|---|---|---|---|---|---|---|---|---|---|---|---|---|---|
| n | Mean | SD | n | Mean | SD | n | Mean | SD | n | Mean | SD | n | Mean | SD | F | p-Value | |
| User leadership | 24 | 46.625 | 17.497 | 57 | 45.614 | 12.072 | 117 | 44.060 | 12.117 | 130 | 40.662 | 10.118 | 141 | 44.241 | 10.776 | 3.103 | .015 |
| Curiosity/Creativity | 24 | 27.750 | 8.734 | 60 | 23.150 | 7.325 | 117 | 22.470 | 6.373 | 129 | 19.651 | 5.111 | 143 | 20.615 | 5.475 | 11.977 | .000 |
| Availability of time and skills | 25 | 17.440 | 6.138 | 60 | 14.617 | 5.079 | 120 | 15.275 | 5.331 | 129 | 15.620 | 5.000 | 146 | 16.534 | 5.510 | 2.365 | .052 |
In summary, we propose using the scale “Consumers at the Cutting-Edge” to identify “lead users” on the market. All those who wish to undertake co-creation strategies have available, henceforth, this simple, but reliable and valid, tool.
7Conclusions and implicationsUser-developed innovation completes manufacturer innovation. According to Flowers et al. (2010), 8% of United Kingdom consumers develop user innovation. A similar study maintains that 3.7% of consumers in Japan and 5.2% of consumers in the United States have been involved in user innovation (Ogawa and Pongtanalert, 2011). The results of our study, which is partially a replication of these studies, are similar. 5% of our non-representative sample in Gipuzkoa innovates. This figure cannot be dismissed as insignificant. Thus, it seems reasonable to take users (in this case consumers) into consideration when studying innovation. Users are in fact a non-negligible source of innovative and attractive products.
But who are the users involved in innovating? What are they like? What is their profile? How can they be identified? The literature refers to “user-innovators”, “lead users”, and “consumers with a leading edge status”. The differences between these concepts are slight. While user-innovators benefit from using a product they develop, lead users are at the leading edge of important market trends and they identify new emerging needs that have not been previously detected by most of the market. We decided to use the term “lead users”.
We are aware of the different methods for identifying these consumers, but we opted instead to develop a measurement scale because of its simplicity and practicality. Furthermore, we observed a gap in the development of cross-market scales for the identification of “lead users”.
In order to fill this information gap, we developed a cross-market scale which identifies consumers who innovate and who are at the leading edge of the market. This new measurement scale is called “Consumers at the Cutting-Edge”. It contains 31 items classified under three dimensions: user leadership, curiosity/creativity, and availability of time and skills for product development. The scale meets psychometric requirements of reliability and validity.
Given the quality of the measurement scale, we carried out an exploratory exercise to characterize consumers at the cutting-edge of market trends. These individuals are educated men with technical training. Men present higher scores in factors such as “User leadership” and “Availability of time and skills”. In the “Curiosity/Creativity” factor, there are no relevant differences between men and women. These findings suggest that possessing technical qualifications is a good indicator for identifying consumers at the cutting-edge. Individuals with technical qualifications have higher scores in each factor. And finally, the level of education of the respondents proved to be quite revealing. Consumers with more advanced studies scored higher in “Curiosity/Creativity”. So, men who are technically trained and well educated are potentially more likely to be at the leading edge of the market than other candidates. These results are quite consistent with other similar international studies previously referred to in this article.
These results suggest that the proposed measurement scale could be used by companies seeking to develop user-centered innovation by identifying “lead users”. But the study also drew another important conclusion, namely, that if we want to encourage user-centered innovation, we must promote user-leadership, creativity and curiosity. We must also empower citizens technically and guide them in their spare time to develop their capacity for innovation.
We would ask the academic and research community to consider this measurement scale when embarking on further research. It would be interesting to apply it to communities and regions with varied levels of development, especially in emerging markets. We also encourage the academic community to conduct psychometric contrasts applying confirmatory analysis on a representative sample.
It is important to mention the limitations of this research project. Although the sample size is large enough for the region under study, the method used for selection is not a probabilistic one. Due to considerable economic constraints, it was not possible to select a representative sample.
To conclude, the findings in this study suggest that innovation policies and management innovation based on a model of innovation which only focuses on the manufacturer will always be incomplete. And even though users are not being invited to participate in innovation processes, they carry on innovating by themselves anyway. If we want to exploit all the innovative potential in society we need to involve users in the innovation system and facilitate co-working with manufacturers. For this to happen, we need to be able to identify the most innovative consumers. We wish to make our measuring instrument, “Consumers at the cutting-edge” available to this community to assist them in this task. By involving these “lead users” in innovation processes we are affording them a different status from ordinary consumers. We are turning consumers into agents of innovation within the system.
e.g. Von Hippel (1986, 2001), Urban and von Hippel (1988), Von Hippel (1988), Morrison et al. (2000), Thomke and von Hippel (2002), Ulwick (2002), Lilien et al. (2002), Morrison et al. (2004), Henkel and von Hippel (2005), Tietz et al. (2005), Von Hippel (2005), Baldwin et al. (2006), Franke et al. (2006), Schreier and Prügl (2008), Schaan and Uhrbach (2009), Gault and von Hippel (2009), Røtnes and Staalesen (2009), Ministry of Employment and the Economy (2010), Von Hippel et al. (2010), Gault (2011), Kim and Kim (2011) and Mujika-Alberdi et al. (2013).
To learn more about Gipuzkoa you can visit http://www.gipuzkoa.eus/es/hasiera/.
Other interesting contributions referenced in Guerzoni (2007) are National Science Foundation (1959), Freeman (1968), Ienson (1969), Langrish et al. (1972), Rothwell et al. (1974), Berger (1975), Boyden (1976), Lionetta (1977) or Gardiner and Rothwell (1985). The main finding of these studies is the empirical evidence that firms perceive demand as an important source of ideas for innovation.
For further details, see Von Hippel (2005), Leadbeater (2006), and Flowers et al. (2008).
Survey participants could select up to three choices.
For example, some of the products created, modified or designed by these consumers are a chair for diaper changing for the elderly, probiotics to treat infection in people with short bowel syndrome, and triangular tin cans, so they can be stored in less space.