


The within-breath analysis of respiratory mechanics by the monofrequency Forced Oscillation Technique (mFOT) is of great interest in both physiopathology studies and the diagnosis of respiratory diseases. However, there are limited data on the use of this technique in the analysis of asthma. This study evaluates within-breath mechanics of asthmatic individuals and the contribution of the mFOT in the asthma diagnosis.
METHODS:Twenty-two healthy and twenty-two asthmatic subjects, including patients with mild (n=8), moderate (n=8), and severe (n=6) obstruction, were studied. Forced Oscillation Technique data were interpreted using the mean respiratory impedance (Zt), the impedance during inspiration (Zi), expiration (Ze), at the beginning of inspiration (Zii), and at expiration (Zie). The peak-to-peak impedance (Zpp) was also calculated by the subtraction of Zii from Zie. Receiver operating characteristic curves were used to determine the sensitivity (Se) and specificity (Sp) of m Forced Oscillation Technique parameters in identifying asthma.
RESULTS:Respiratory impedance values were significantly higher in asthmatics: Zt (p<0.001), Zi (p<0.001), Ze (p<0.001), Zii (p<0.001), Zie (p<0.001), and Zpp (p<0.003). The best parameters for detecting asthma were Zi, Zii, and Zie (Se=90.9%, Sp=90.9%), followed by Zt and Ze. These results are in close agreement with recently published theories and pathophysiological fundamentals.
CONCLUSIONS:mFOT permits a non-invasive and detailed analysis in different phases of the respiratory cycle, providing parameters that are adequate for the diagnosis of asthma with high accuracy. These results confirm the high clinical and scientific potential of this methodology in the evaluation of asthmatic patients.
The real-time identification of alterations in respiratory mechanics is of great interest in both physiopathology studies and in the diagnosis of breathing diseases.1,2 This analysis allows a detailed evaluation of the different phases of the breathing cycle, and it can be made using the interruption technique. However, this method still has technical difficulties, such as underestimation of the measured resistance due to the slow balance between the alveolar pressure and the pressure present in the mouth.3 Another alternative refers to the measurement of pulmonary resistance. The clinical application of this methodology, however, is limited due to the use of an esophageal catheter.3 The method of the least squares, on the other hand, may overestimate the inspiratory resistance and underestimate the expiratory resistance.4 In practice, we still do not have a simple, low-cost technique that monitors mechanical alterations during the respiratory cycle.
Studies using the Forced Oscillations Technique (FOT) often use several excitation frequencies (multifrequency) to obtain an average result from several breathing cycles.5 Recently, a version of the FOT that uses a single excitation frequency (monofrequency) was developed and allows real-time analysis of the respiratory mechanics.6 For this purpose, the system evaluates, in real time, the module of the respiratory impedance (Zrs), a variable that represents the total mechanical load offered by the respiratory system. This instrument was successfully used to study the fast events associated with sleep apnea6,7 and swallowing.8 Recently, other research groups have obtained promising results using this methodology for the detection of expiratory flow limitations in COPD patients,1,9 investigating physiological recovery from an exacerbation of COPD,10 and analyzing the response to deep inhalation in asthmatic children11 and adults.12 A detailed evaluation of the short-term variability of airway caliber in asthma was also recently obtained using this technique.13,14 However, there are limited data on the use of monofrequency FOT in the analysis of different phases of the breathing cycle and in the diagnosis of asthma in adult subjects. In this context, the objectives of the present study were: (1) to compare the respiratory mechanics of normal and asthmatic individuals, with an emphasis on the differences between the phases of the respiratory cycle, and (2) to evaluate the contribution of the monofrequency FOT in the diagnosis of asthma.
METHODSThe present work is a transverse study developed at the Biomedical Instrumentation Laboratory and Pulmonary Function Laboratory at the State University of Rio de Janeiro. The Research Ethics Committee of this institution approved this study. The objectives of the study were explained to all individuals, and their written consent was obtained before inclusion in the study.
The system used for the analysis of respiratory mechanics represents the evolution of equipment described previously that was dedicated to the study of respiratory diseases during sleep.6,7 The instrument applies a single frequency (5Hz), low pressure (2.0 cmH2O), sinusoidal signal to the individual’s respiratory system, which remains under spontaneous ventilation. Pressure (P) and flow (Q) transducers are used to measure these variables, and the resulting signals are used to calculate the Zrs (Zrs=P/Q). The developed program permits control of the beginning and end of the exam, as well as visualization of respiratory impedance alterations along several phases of the breathing cycle.
Respiratory impedance was measured in four exams of 20 s each. These exams were accomplished with the individual seated, breathing spontaneously, using a nasal clip, and holding their cheeks and mouth floor with their hands to avoid the shunt effect of the upper airways. In order to characterize the mechanical alterations along the breathing cycle, the following secondary parameters to the Zrs were calculated:
- •
The mean respiratory impedance (Zt) was calculated for the whole exam;
- •
The mean of the impedance during the inspiration cycles (Zi);
- •
The mean of the impedance during the expiration cycles (Ze);
- •
The mean impedance observed at the beginning of inspiration (Zii);
- •
The mean of the impedance at the beginning of expiration (Zie);
- •
The peak-to-peak impedance (Zpp), subtraction of Zii from Zie.
The results are presented as the means±SD. The characteristics of the distributions were initially verified by the Shapiro-Wilk test. An independent t-test was used when the data presented a statistically normal distribution. In all other cases, a non-parametric test (Mann-Whitney) was applied. The associations between FOT and spirometric parameters were analyzed using Pearson’s correlation coefficient for the entire group of studied volunteers. These tests were assumed to be statistically significant at a level of p<0.05 and were conducted using a commercial software package (Origin for Windows, version 8.0).
The clinical potential of the cited indices in detection of the respiratory alterations in asthmatic patients was also evaluated. For this purpose, the sensitivity and specificity of the mentioned parameters were obtained through Receiver Operating Characteristic (ROC) analyses. These graphs describe the probability of a true positive occurrence (sensitivity) as a function of the probability of a false positive occurrence (1-specificity) for several cut-off points. Thus, a larger area under the curve (AUC) represents greater validity of the test. Tests with AUCs above 0.8 are considered appropriate for clinical use,15 and those with values above 0.9 reflect high diagnostic accuracy.16 This analysis was performed using MedCalc 7.3 software. The cut-off point was selected in order to balance the values of sensitivity and specificity.
The estimate of the sample’s size was based on the criterion of identifying an appropriate AUC for clinical practice (0.80)15 and not merely one that simply permits a random evaluation (0.50).15,16 This estimate was made by considering errors of type I and type II of 10% and 20%, respectively, and using MedCalc 7.3 software. This estimate resulted in a minimum number of 22 individuals in each group. A total of 44 individuals (22 with a clinical diagnosis of asthma17 and 22 normal subjects) were studied.
Using a flow spirometer (Micro Loop; Micro Medical, Rochester, England), measurements for the Forced Vital Capacity (FVC), Forced Expiratory Volume for the first second (FEV1), FEV1/FVC, and ratio of Forced Expiratory Flow (FEF) between 25% and 75% of the FVC to FVC (FEF/FVC) were obtained for patients in a seated position. These parameters were presented as raw data and percentiles of the predicted values (% pred). Predicted values for spirometry were obtained from Knudson et al.18 and Pereira et al.19 Forced expiratory maneuvers were repeated until three sequential measurements were obtained. The indices studied were those obtained from the best curve, which was selected as the curve with the highest value of FEV1 plus FVC. FOT exams were carried out first, and the delay between FOT and spirometric exams was less than thirty minutes.
The airway obstruction classification used in the present work20–23 was based on the FEF25–75/FVC and FEV1/FVC relationships. These parameters are considered a precocious indicator of airway obstruction,24 and they are associated with diffuse airway obstruction, respectively.25,26 Thus, FEF25–75/FVC was used to classify obstruction in the initial phases, and FEV1/FVC in the classification in most advanced phases21,22.
Patients were ambulatory subjects referred by physicians to the laboratory for routine pulmonary function testing. The studied group was composed of patients presenting mild (n=8), moderate (n=8), and severe (n=6) airway obstruction. The diagnosis of asthma was based on the presence of dyspnea, chronic cough, chest tightness, or thoracic discomfort. Spontaneous improvement of these symptoms after bronchodilator use was also indicative of asthma (>12% improvement of the FEV1-predicted baseline after β2-agonist inhalation). Exclusion criteria for this study were the inability to perform technically adequate spirometry or FOT measurements, smoking history, evidence of current airway infection, acute exacerbation, or any cardio-respiratory disease other than asthma. All patients were in stable clinical condition. The control group was comprised of 22 healthy subjects with normal spirometry and without any history of pulmonary or cardiac disease or tobacco use. Baseline data, including age, sex, and height, were obtained for each patient at the time of the procedures.
RESULTSThe anthropometric and spirometric characteristics of the studied groups are described in Table 1. All spirometric parameters showed significant reductions in the asthmatic group.
Anthropometric and spirometric characteristics of the study group
| FEV1 (L) | FVC (L) | FEV1/FVC (%) | FEF/FVC (%) | ||
|---|---|---|---|---|---|
| Zt | r | − 0.69 | − 0.45 | − 0.84 | − 0.8 |
| (cmH2O/L/s) | r2 | 0.48 | 0.2 | 0.7 | 0.64 |
| p | <0.0001 | <0.002 | <0.0001 | <0.0001 | |
| Zi | r | − 0.68 | − 0.45 | − 0.82 | − 0.79 |
| (cmH2O/L/s) | r2 | 0.47 | 0.2 | 0.68 | 0.63 |
| p | <0.0001 | <0.002 | <0.0001 | <0.0001 | |
| Ze | r | − 0.7 | − 0.46 | − 0.84 | − 0.8 |
| (cmH2O/L/s) | r2 | 0.49 | 0.21 | 0.7 | 0.64 |
| p | <0.0001 | <0.002 | <0.0001 | <0.0001 | |
| Zii | r | − 0.68 | − 0.46 | − 0.82 | − 0.79 |
| (cmH2O/L/s) | r2 | 0.47 | 0.21 | 0.67 | 0.62 |
| p | <0.0001 | <0.002 | <0.0001 | <0.0001 | |
| Zie | r | − 0.7 | − 0.46 | − 0.84 | − 0.79 |
| (cmH2O/L/s) | r2 | 0.49 | 0.21 | 0.7 | 0.63 |
| p | <0.0001 | <0.002 | <0.0001 | <0.0001 | |
| Zpp | r | − 0.36 | − 0.24 | − 0.42 | − 0.42 |
| (cmH2O/L/s) | r2 | 0.13 | 0.06 | 0.18 | 0.18 |
| p | <0.01 | ns | <0.003 | <0.003 |
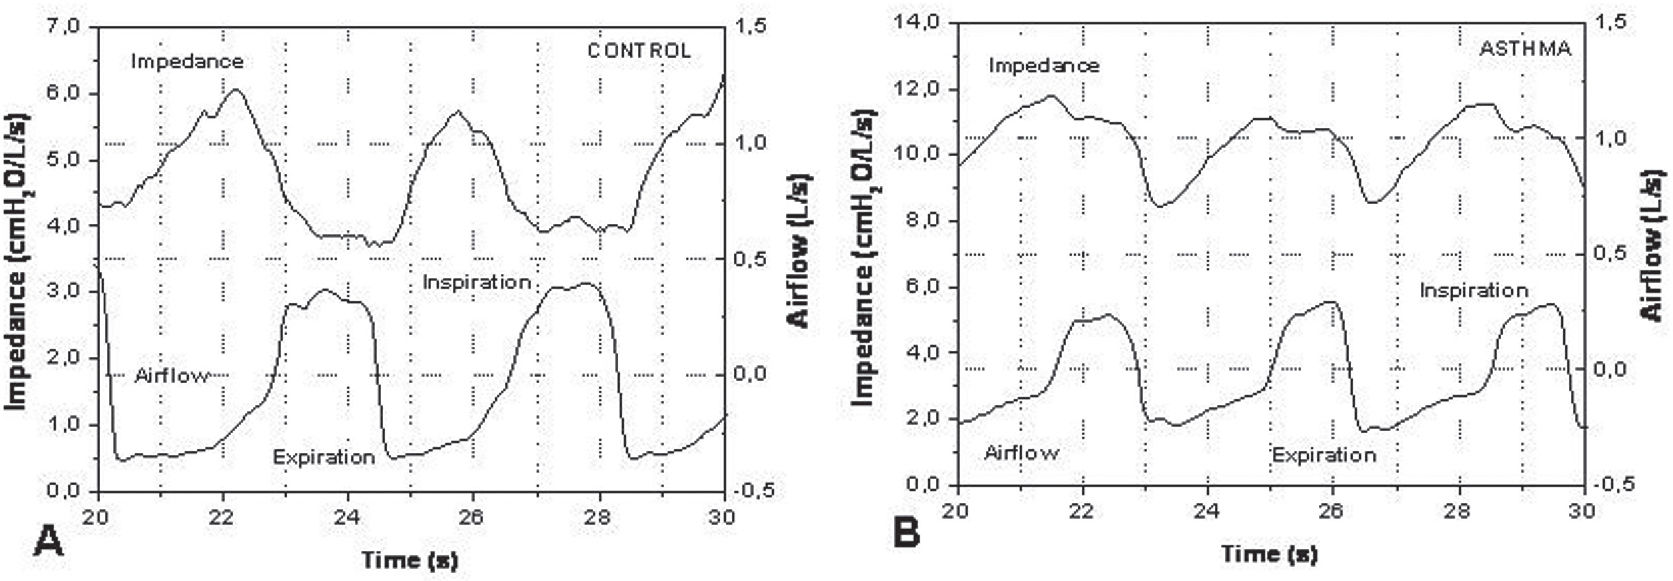
A representative example of the typical morphology of the airflow and impedance signals obtained in a control (A) and asthmatic (B) individual is presented in Figure 1. Notice the difference in the impedance scales.
 and asthmatic (B) individuals. Notice the difference in the impedance scales.")
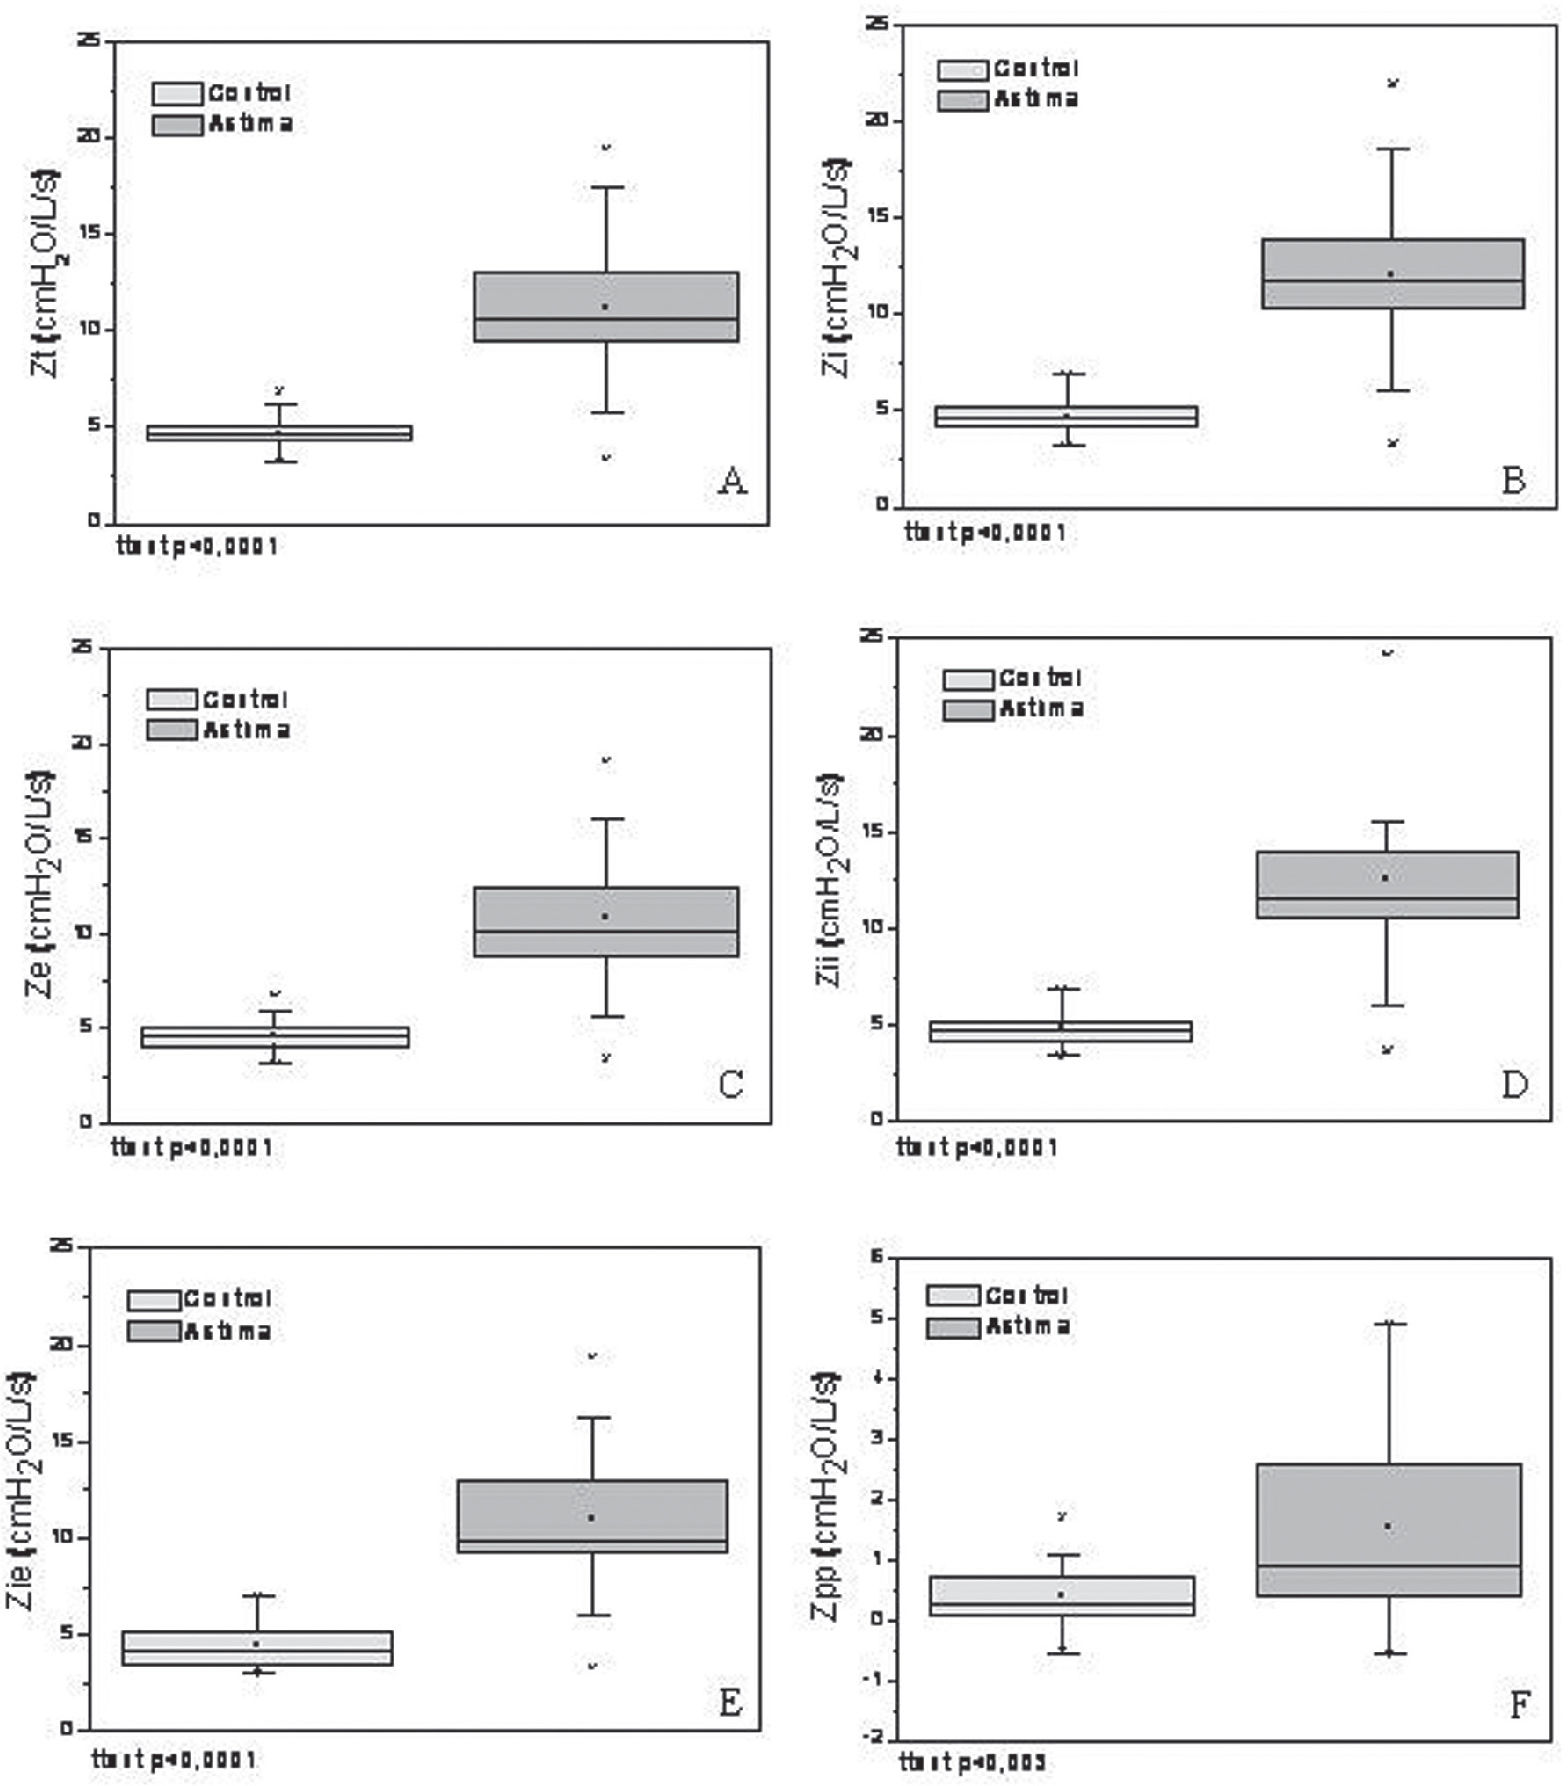
The derived results of the real-time analysis are presented in Figure 2. These secondary variables were significantly higher in asthmatics: Zt (p<0.001), Zi (p<0.001), Ze (p<0.001), Zii (p<0.001), Zie (p<0.001), and Zpp (p<0.003).
, mean impedance during the inspiratory (Zi, B) and expiratory (Ze, C) phases, impedance at the beginning of inspiration (Zii, D) and of expiration (Zie, E), and peak-to-peak variation of the impedance (Zpp, F) in the studied groups. The top and bottom of the box plot represent the 25th- to 75th-percentile values, while the circle represents the mean value and the bar across the box the median. The whiskers outside the box represent the 5th- to 95th-percentile values. Data presented a statistically normal distribution.")
Comparison among the total impedance (Zt, figure A), mean impedance during the inspiratory (Zi, B) and expiratory (Ze, C) phases, impedance at the beginning of inspiration (Zii, D) and of expiration (Zie, E), and peak-to-peak variation of the impedance (Zpp, F) in the studied groups. The top and bottom of the box plot represent the 25th- to 75th-percentile values, while the circle represents the mean value and the bar across the box the median. The whiskers outside the box represent the 5th- to 95th-percentile values. Data presented a statistically normal distribution.
Correlations between FOT and spirometric parameters are presented in Table 2. All FOT parameters presented statistically significant inverse correlations with all spirometric parameters, excluding Zpp and FVC.
Pearson correlation coefficient (r), coefficient of determination (r2), and p-value (p) between FOT and spirometry.
| Control (n=22) | Asthma (n=22) | p | |
|---|---|---|---|
| Age (years) | 56.5±15.3 | 54.6±15.2 | ns |
| Weight (kg) | 70.1±13.2 | 73.8±15.2 | ns |
| Height (cm) | 159.9±6.8 | 156.4±5.3 | ns |
| IMC | 27.4±4.7 | 30.1±5.7 | ns |
| Gender (M/F) | 5/17 | 4/18 | – |
| FEV1 (L) | 2.3±0.6 | 1.4±0.8 | <0.001 |
| FVC (L) | 2.9±0.7 | 2.4±0.9 | <0.05 |
| FEV1/FVC (%) | 80.6±5.3 | 53.0±15.2 | <0.001 |
| FEF/FVC (%) | 79.2±20.4 | 26.6±16.6 | <0.001 |
The values obtained for the AUC, sensitivity, and specificity describing the clinical potential of the studied indices are described in Table 3.
Values of the area under the ROC curve (AUC), sensitivity (Se), specificity (Sp), and respective cut-off points for the FOT parameters.
| AUC | Se (%) | Sp (%) | Cut-off point | |
|---|---|---|---|---|
| Zt (cmH2O/L/s) | 0.95 | 90.9 | 100 | 6.82 |
| Zpp (cmH2O/L/s) | 0.74 | 72.7 | 68.2 | 0.59 |
| Zi (cmH2O/L/s) | 0.96 | 90.9 | 100 | 6.90 |
| Ze (cmH2O/L/s) | 0.95 | 90.9 | 100 | 6.78 |
| Zii (cmH2O/L/s) | 0.96 | 90.9 | 100 | 6.85 |
| Zie (cmH2O/L/s) | 0.96 | 95.5 | 90.9 | 5.25 |
The anthropometric characteristics of the two studied groups were well matched, and there were no significant differences between the groups (Table 1). The reductions in volumes and flows observed in asthmatic individuals were coherent with the physiopathology involved.17,27
The impedance module represents the total mechanical load of the respiratory system, describing the work necessary to promote the movement of air into the respiratory system. At the frequency used (5Hz), this parameter mainly describes the resulting effect of the total resistance and respiratory system compliance.6Figure 1A demonstrates the flow and impedance behavior with time in a healthy individual. A reduction in the impedance values during inspiration can be observed. On the other hand, a gradual increase of the impedance values is apparent during expiration. This behavior is in agreement with Poiseuille’s law; there is an increase in the internal diameter of the airways during inspiration, whereas expiration results in a reduction in airway diameter. In asthma (Figure 1B), we can observe a similar behavior with higher impedance values. These values can be explained by the obstructive nature of this disease. Additionally, there is a delay between the impedance and flow curves. The impedance begins its decreasing phase some time after initiation of the increase in flow; in other words, this occurs some time after the initiation of inspiration. In the expiratory phase, there is a delay in the impedance increase relative to the beginning of the flow decrease. In asthma, the delay in the impedance signal relative to the flow signal may be associated with reductions in respiratory system compliance. This can be explained, at least in part, by modifications in the airways, including bronchoconstriction as well as thickening and remodeling of the airway wall. The combination of these factors can result in bronchial rigidity, leading to difficulty of the bronchial structure to respond quickly to variations in airflow.
The asthmatic group presented significantly higher impedances in all of the analyzed parameters (Figure 2). The physiopathological processes related to asthma include inflammation of the airways and bronchial hyper-reactivity, resulting in the obstruction of airflow with consequent alterations of the resistive and elastic properties of the respiratory system.21 These alterations are consistent with the observed increase in the Zt of asthmatic subjects (Figure 2A), and with the significant inverse correlations between Zt and spirometric parameters (Table 2). The respiratory impedance module is associated with resistive and reactive properties of the respiratory system.5 Dellacà et al.1 pointed out that indices related to the respiratory system reactance are able to detect flow limitations, which are dependent on the mechanical properties of the airway walls and the “choke point” location. The concept of a “choke point” was introduced by these authors and describes the difficulty that the oscillatory signals emitted by the FOT present when crossing segments of the bronchial tree; this difficulty is responsible for the flow limitation. This event produces a fall in the dynamic compliance, and consequently an increase in the impedance module. In agreement with this theory, all of the analyzed parameters presented a significant increase in asthmatic subjects (Figure 2), and were significantly associated with airway obstruction (Table 2). It is also interesting to note that the highest coefficients of determination were observed between FEV1/FVC and FOT parameters, which link the studied FOT parameters to diffuse airway obstruction. LaPrad and Lutchen28 pointed out that asthmatics present a decreased ability to distend their airways in comparison with healthy individuals due to the rigidification and thickening of the airway walls. This factor, associated with other typical physiopathological events in asthma (e.g. bronchial hyper-reactivity and hyperinflation), causes displacement of ventilation for higher volumes and increases the work associated with breathing.27 It can thus explain the increase observed in the Zi value of asthmatics (Figure 2B). In these patients, there is a tendency toward larger Zi in comparison to Ze values (Figure 2B and C; t-test = ns). This tendency indicates that the increase in respiratory impedance in asthmatics does not necessarily describe limitations in expiratory flow.21 The small elevation in the Zi value can be related to the increase in the resistive and elastic work of breathing, and may also reflect a combination of differences in airway caliber, glottic caliber, and effects of muscular activation in the thoracic wall.
A recent study29 demonstrated that asthmatic individuals present an initial limitation of dilation during a maneuver of deep inspiration; this is followed in the expiratory phase by a faster return of the airways to their initial diameter. This fact could be explained at least in part by remodeling and the presence of hypertrophied musculature, which could determine the fast reduction observed in the airway caliber after the end of the inspiratory phase. Consequently, at the end of expiration, this phenomenon would result in a higher value of impedance (Zii) in that group relative to the control group. The results presented in Figure 2D are in agreement with these principles.
In asthmatics, Zii showed a tendency to increase in comparison to Zie (Figure 2D and E, t-test = ns). These results are consistent with those presented by Cauberghs and Van de Woestijne30 for patients with chronic obstructive pulmonary disease. This tendency can be explained at least in part by Poiseuille’s law. At the beginning of inspiration (i.e., when the pulmonary volume and airway diameter are reduced), the impedance is larger. On the other hand, at the beginning of expiration (i.e., when the pulmonary volume and airway diameter are higher), the impedance is reduced.
Considering the contribution of the respiratory muscles to the results presented in Figure 2, we initially observe that the respiratory system of asthmatic patients is generally subjected to a high mechanical load (Figure 2A). This usually results in the maintenance of post-inspiratory activity of the diaphragm and thoracic wall inspiratory muscles. These muscles act as a restraining factor in expiratory flow, and their activity results in hyperinflation. In this condition, the time constant of the respiratory system exceeds the time necessary for normal basal expiration. Consequently, a loss of elastic recoil occurs, resulting in an increase in the elastic work of breathing in addition to the increment of the resistive work described previously.31 These changes result in the increased expiratory load shown in Figure 2C. Additionally, hyperinflation requires muscles to increase their work during inspiration, and this contributes to the results described in Figure 2B. We observed higher Zpp values in asthmatics (Figure 2F). Hyperinflation is associated with a deficit in inspiratory muscle force in asthma; this deficit is usually the predominant factor that determines dyspnea in those patients.32 Therefore, although the total mechanical load of the breathing system is increased during the whole cycle (Figure 2A), it is likely that such a phenomenon is more evident during the inspiratory phase. This finding, associated with that described by McConnell and Alison33 that the sensation most clearly related to exercise intolerance in asthmatics is respiratory effort, emphasizes the relevance of muscular therapeutic interventions in these patients.
Table 3 describes the analysis of the contribution of the monofrequency FOT to the diagnosis of asthma. The parameters Zt, Zi, Ze, Zii, and Zee presented AUCs above 0.9, indicating high diagnostic accuracy.16 Guo and collaborators 34 investigated the identification of DPOC in elderly subjects through multifrequency FOT and obtained maximum AUC values of 0.85. Previous studies from our group using the multifrequency FOT in asthmatic patients revealed maximum AUCs of 0.88.21 Similar analyses in patients with sarcoidosis showed maximum AUCs of 0.84.23 The values found in the present work are superior to those obtained in previous work, indicating that monofrequency FOT can present higher diagnostic accuracy than its corresponding multifrequency version. Based on these promising results, further large-scale studies to confirm these findings in well-defined groups of asthmatic patients with mild, moderate, and severe airflow obstruction are being undertaken. Studies including bronchodilator tests are also in progress.
In conclusion, the current study shows that monofrequency FOT permits a non-invasive and detailed analysis of the changes in respiratory mechanics in asthmatic patients. This analysis provides new parameters associated with different phases of the respiratory cycle. Several of these parameters are adequate for the diagnosis of asthma with high accuracy. These results confirm the high clinical and scientific potential of this methodology in the evaluation of asthmatic patients.
The authors wish to thank Mesquita Jr. J.A., Santos, J.G., Faria A.C., Costa G.M., and Miranda I.A. for their technical assistance. This study was supported by the Brazilian Council for Scientific and Technological Development (CNPq) and Rio de Janeiro State Research Supporting Foundation (FAPERJ).