


APOE gene encoded a multifunctional protein in lipid metabolism, also associated with inflammatory markers. Type 2 diabetes (T2D) is a complex metabolic disease related to increased blood glucose, triglycerides and VLDL and associated with different dyslipidaemias. The aim of this study was to analyze whether the APOE genotype could determining the risk of developing T2D in a large cohort of workers.
Material and methodsData from the Aragon Workers Health Study (AWHS) (n=4895) were used to investigate the relationship between glycemic levels and APOE genotype. All patients in the AWHS cohort had their blood drawn after an overnight fast and laboratory tests were performed on the same day as the blood drawn. Dietary and physical assessment was assessed by face-to-face interview. APOE genotype was determined by the Sanger sequencing method.
ResultsThe relationship between APOE genotype and glycemic profile showed that glucose, Hb1Ac, insulin and HOMA levels did not seem to be associated with the APOE genotype (p=0.563, p=0.605, p=0.333 and p=0.276, respectively). In addition, the T2D prevalence did not show an association with the APOE genotype (p=0.354). Along the same lines, blood glucose levels and T2D prevalence did not show association with the APOE allele. Shift work had some effect on the glycaemic profile, showing that night shift workers have significantly lower levels of glucose, insulin and HOMA (p<0.001). However, the APOE genotype did not show difference in the concentration of glycaemic parameters adjusting by sex, age and BMI, work shift and dietary parameters.
ConclusionGlycemic profile and T2D prevalence did not show any significant association with the APOE genotype. Besides, individuals, who worked in non-rotating night shift showed significantly lower glycemic levels, while workers in the morning-afternoon-night shift showed significantly higher values.
El gen APOE codifica una proteína multifuncional en el metabolismo de los lípidos y asociada con marcadores inflamatorios. La diabetes tipo 2 (T2D) es una enfermedad metabólica compleja relacionada con aumento de glucosa en sangre, triglicéridos y VLDL y asociado a diferentes dislipidemias. El objetivo de este estudio fue analizar si el genotipo APOE podría determinar el riesgo de desarrollar T2D en una gran cohorte de trabajadores.
Material y métodosSe utilizaron datos de la cohorte Aragon Workers Health Study (AWHS) (n = 4895) para investigar la relación entre los niveles glucémicos y el genotipo APOE. Se extrajo una muestra de sangre tras ayuno a todos los trabajadores de la AWHS y se realizaron pruebas de laboratorio el mismo día de la extracción de sangre. La evaluación dietética y física se evaluó mediante una entrevista presencial. El genotipo APOE se determinó por el método de secuenciación Sanger.
ResultadosLa glucosa, los niveles de Hb1Ac, insulina y HOMA no parecen estar asociados con el genotipo APOE (p = 0.563, p = 0,605, p = 0,333 y p = 0,276, respectivamente). Además, la prevalencia de T2D no mostró una asociación con el genotipo APOE (p = 0,354). Del mismo modo, los niveles de glucosa en sangre y la prevalencia de T2D no mostró asociación con ningún alelo de APOE. El trabajo por turnos tuvo algún efecto en el perfil glucídico, mostrando que los trabajadores del turno de noche tienen niveles significativamente más bajos de glucosa, insulina y HOMA (p < 0,001). Sin embargo, el genotipo APOE no mostró diferencia en la concentración de parámetros glucídicos ajustando por sexo, edad e IMC, jornada laboral y parámetros dietéticos.
ConclusiónEl perfil glucídico y la prevalencia de T2D no mostraron una asociación significativa con el genotipo APOE. Además, los individuos que trabajaban en turno de noche no rotativo mostraron significativamente niveles glucídicos más bajos, mientras que los trabajadores del turno mañana-tarde noche mostraron valores significativamente más altos.
Diabetes is one of the most common complex diseases, affecting approximately 460 million adults worldwide. Furthermore, this prevalence is projected to double by 2045. Type 2 diabetes (T2D) accounts for more than 90% of diabetes,1 with variable contributions of insulin resistance and beta cell dysfunction, and influenced by multiple risk factors, including genetics.2 Hundreds of loci associated with T2D have been identified in large-scale genetic studies, including genome-wide association studies (GWAS), accounting for approximately 20% of the variance in individual predisposition to T2D.3–5 However, the limited effect of each of these variants means that they have little weight in daily clinical practice. On the other hand, elevated serum triglyceride (TG) levels are strongly correlated with insulin resistance, elevated glucose levels, and TD2, however the association between the two components is not fully defined.6 Epidemiological data support a possible etiological role of elevated TG levels in insulin resistance and TD2. Elevated serum TG predict incident TD2 independently of body mass index (BMI), and elevated TG can be observed up to 10 years before T2D diagnosis.7,8 In fact, different dyslipidaemias such as hypertriglyceridemia and familial combined hyperlipidemia, characterized by high very-low density lipoprotein (VLDL) particles and TG, are associated with a high risk of TD2.9
Apolipoprotein E (ApoE) is a multifunctional protein with central function in lipid and neurobiological metabolism, that in plasma mediates the clearance of remnant lipoproteins and at the endothelial level it is secreted by macrophages participating in the flow of cholesterol toward the atherosclerotic plaque.10,11 ApoE has high affinity for the low-density lipoprotein (LDL) receptor, facilities plasmatic lipoprotein hepatic and extrahepatic uptake and modulates the generation of new HDL particles.10 ApoE is codified by the APOE gene, located in the chromosome 19, q13.32, which contains three common alleles (E2, E3, E4), producing three homozygous and three heterozygous genotypes. These polymorphisms determine different isoforms that differ in ApoE primary structure at residues 112 and 158.12 In the human population ApoE3 is the most common (78%) followed by ApoE4 (14%) and ApoE2 (7%).13 The receptor-binding function and lipid affinity of ApoE is remarkably specific to each isoform. Individuals carrying the ApoE4 allele have higher low-density lipoprotein cholesterol (LDLc) than those carrying the ApoE2 allele.14 They are also associated with different disorders; while ApoE3 is consider the wild type isoform, ApoE2 may participate in the development of dysbetalipoproteinaemia and ApoE4 in Alzheimer disease.11,13
Variants at the APOE locus are one of the strongest signals for LDLc, as confirmed by recent GWAS,15 showing that E4 carriers reported not only have significantly higher levels of LDLc but also increased cardiovascular risk.16 Also, APOE genotype has a relation with lipoprotein(a) (Lp(a)) and different inflammatory biomarkers, such as C-reactive protein.17 On the other hand, the size of VLDL particle,18 which are associated with a higher risk of developing T2D, could also be related with APOE locus.19 Different studies have reported conflicting results between APOE genotype and T2D development.20,21
Lifestyle factors related to T2D incidence include physical activity level, dietary habits and, adiposity, among others.22 In the last years, several studies have pointed out how circadian rhythms disruption could influence glycemic profile by increasing T2D risk.23,24 To increase the knowledge of the influence of APOE genotype on glucose metabolism and if lifestyle patterns, as work shift, could affect that association would contribute to improve glycemic control and T2D prevention. Therefore, the objective of this study was to analyze how the APOE genotype could affect glycemic profile and the risk of T2D development in a large cohort of shift workers.
Material and methodsSubjectsThe Aragon Workers Health Study (AWHS) is a longitudinal cohort study, started in 2009 based on the Spain automobile assembly plant (Zaragoza, Spain) and involves workers’ annual medical examinations and biological samples.25 All workers were offered to participate in the study, and the response rate was 94.5%. The sample is predominantly male (>95%). Exclusion criteria include a history of cardiovascular disease or the presence of clinical conditions that limit survival to less than 3 years. The study was approved by the central Institutional Review Board of Aragón (Comité Ético de Investigación Clínica de Aragón, CEICA). All study participants provided written informed consent.
TD2 subjects were defined following the standards of medical care in diabetes from American Diabetes Association (ADA),26 as those individuals who meet any of the following criteria: fasting blood glucose levels greater than 125mg/dL, a glycosylated hemoglobin (HbA1c) greater than 6.4% or have been prescribed with any antidiabetic medication.
Biochemical analyticalAll patients from AWHS cohort were drawn blood after overnight fasting. Laboratory tests were performed on the same day of blood sampling. Fasting serum glucose, TG, total cholesterol and high-density lipoprotein cholesterol (HDLc) were measured by spectrophotometry (AU5800 Beckman Coulter Inc.) serum Apo AI and B by kinetic nephelometry (Immunochemistry Analyzer IMMAGE 800, Beckman Coulter). Lp(a) concentration was measured by rate nephelometry using LPAX reagent in conjunction with IMMAGE Immunochemistry Systems and Lp(a) Calibrator (OMS/IFCC SRM 2 B) (Beckman Coulter), following manufacturer instructions. LDLc was calculated using Friedewald equation. Whole blood HbA1c was measured by reverse-phase cationic exchange chromatography and quantification by double wave-length colorimetric quantification (Analyzer ADAMS A1c HA-810, Arkray Factory). The HOMA-IR index is estimated with the product of fasting glucose (mg/dL) and fasting insulin (μU/mL) divided by 405.27
Dietary and physical activity assessmentAs previously published,28,29 diet was assessed by a face-to-face interview through a 137 items semi-quantitative food frequency questionnaire that was previously validated in Spanish population.30 Participants were asked about the average frequency of consumption and the serving size over the previous year. Food and nutrient intakes were calculated as frequency×nutrient composition of specified portion sizes, where frequencies were measured in 9 categories (never, 1–3 times a month, 1 time a week, 2–4 times a week, 5–6 times a week, 1 time a day, 2–3 times a day, 4–6 times a day and >6 times a day) for each food item. The total energy and nutrients intakes were derived from Spanish food composition Tables.31
Genetic analysisGenomic DNA from whole blood samples was isolated using standard methods. Exon 4 of APOE gene was amplified by polymerase chain reaction and purified by ExoSap-IT (USB), as previously described.32 Amplified fragments were sequenced by the Sanger method using the BigDye 3.1 sequencing kit (Applied Biosystems) in an automated ABI 3500xL sequencer (Applied Biosystems). DNA sequences were analyzed using Variant Reporter software (Applied Biosystems).
Statistical analysisContinuous variables are expressed as mean±SD or median [25th percentile−75th percentile] as applicable and categorical (nominal) variables are reported as percentages of the total sample. The p value was calculated by ANOVA test or Kruskal–Wallis and Chi-square, as appropriate. The relationship between glucose profile and APOE genotype was studied by age, sex and body mass adjusted regression models. All statistical analyses were performed with R version 3.5.0 and significance was set at p<0.05.33
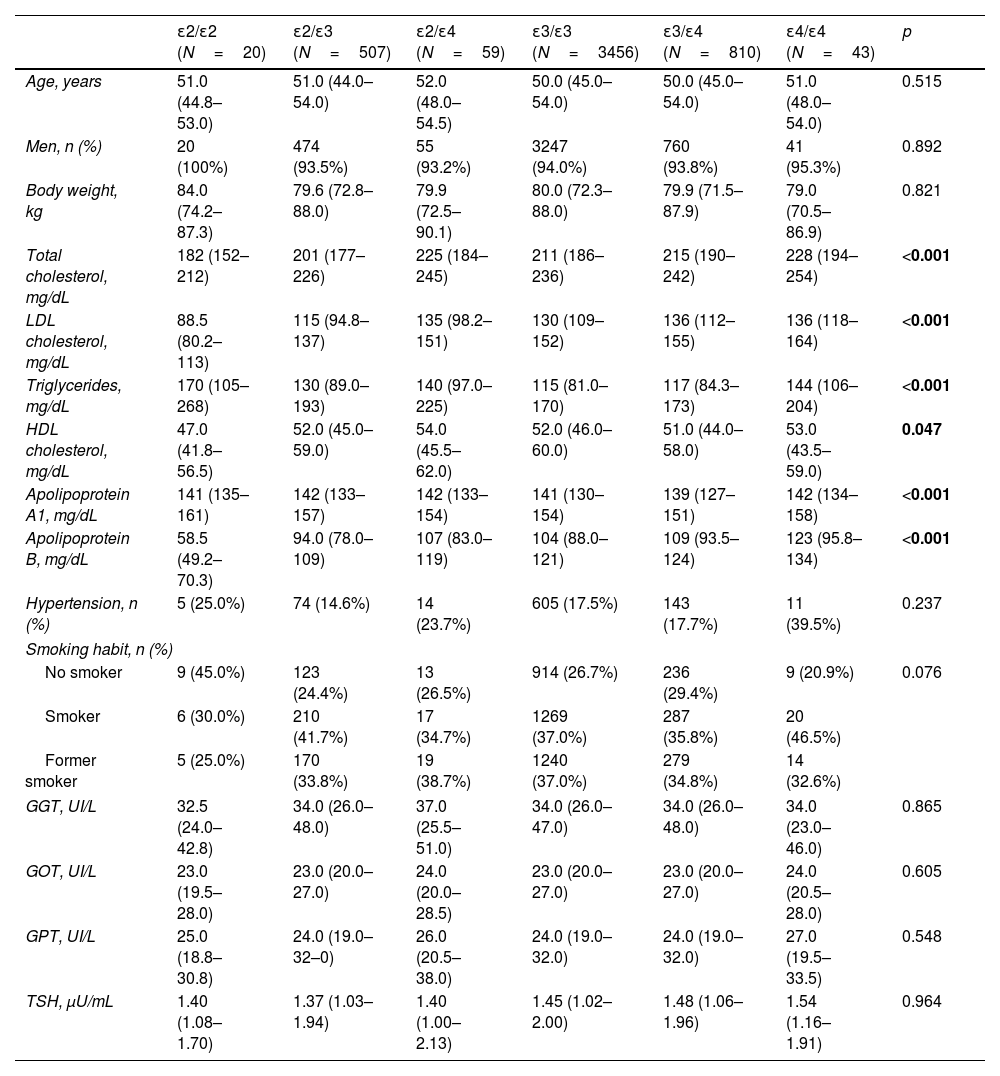
ResultsTable 1 shows clinical and biochemical characteristics according to APOE genotype of 4895 subjects from AWHS cohort. As we expected, total, LDL and HDL cholesterol and TG levels were significantly different according to APOE genotype (p<0.001, p<0.001, p=0.047 and p<0.001 respectively, Table 1). Total and LDLc and apo B were significantly higher in ApoE4 carriers than ApoE3 carriers and ApoE2, and the lowest total and LDL cholesterol and apo B were in ApoE2/E2 subjects. However, ApoE2E2 subjects had higher values of TG. Hypertension, smoking habit, liver enzymes and thyroid stimulating hormone were not associated with the APOE genotype (Table 1).
Clinical and biochemical characteristics according to APOE genotype.
| ɛ2/ɛ2 (N=20) | ɛ2/ɛ3 (N=507) | ɛ2/ɛ4 (N=59) | ɛ3/ɛ3 (N=3456) | ɛ3/ɛ4 (N=810) | ɛ4/ɛ4 (N=43) | p | |
|---|---|---|---|---|---|---|---|
| Age, years | 51.0 (44.8–53.0) | 51.0 (44.0–54.0) | 52.0 (48.0–54.5) | 50.0 (45.0–54.0) | 50.0 (45.0–54.0) | 51.0 (48.0–54.0) | 0.515 |
| Men, n (%) | 20 (100%) | 474 (93.5%) | 55 (93.2%) | 3247 (94.0%) | 760 (93.8%) | 41 (95.3%) | 0.892 |
| Body weight, kg | 84.0 (74.2–87.3) | 79.6 (72.8–88.0) | 79.9 (72.5–90.1) | 80.0 (72.3–88.0) | 79.9 (71.5–87.9) | 79.0 (70.5–86.9) | 0.821 |
| Total cholesterol, mg/dL | 182 (152–212) | 201 (177–226) | 225 (184–245) | 211 (186–236) | 215 (190–242) | 228 (194–254) | <0.001 |
| LDL cholesterol, mg/dL | 88.5 (80.2–113) | 115 (94.8–137) | 135 (98.2–151) | 130 (109–152) | 136 (112–155) | 136 (118–164) | <0.001 |
| Triglycerides, mg/dL | 170 (105–268) | 130 (89.0–193) | 140 (97.0–225) | 115 (81.0–170) | 117 (84.3–173) | 144 (106–204) | <0.001 |
| HDL cholesterol, mg/dL | 47.0 (41.8–56.5) | 52.0 (45.0–59.0) | 54.0 (45.5–62.0) | 52.0 (46.0–60.0) | 51.0 (44.0–58.0) | 53.0 (43.5–59.0) | 0.047 |
| Apolipoprotein A1, mg/dL | 141 (135–161) | 142 (133–157) | 142 (133–154) | 141 (130–154) | 139 (127–151) | 142 (134–158) | <0.001 |
| Apolipoprotein B, mg/dL | 58.5 (49.2–70.3) | 94.0 (78.0–109) | 107 (83.0–119) | 104 (88.0–121) | 109 (93.5–124) | 123 (95.8–134) | <0.001 |
| Hypertension, n (%) | 5 (25.0%) | 74 (14.6%) | 14 (23.7%) | 605 (17.5%) | 143 (17.7%) | 11 (39.5%) | 0.237 |
| Smoking habit, n (%) | |||||||
| No smoker | 9 (45.0%) | 123 (24.4%) | 13 (26.5%) | 914 (26.7%) | 236 (29.4%) | 9 (20.9%) | 0.076 |
| Smoker | 6 (30.0%) | 210 (41.7%) | 17 (34.7%) | 1269 (37.0%) | 287 (35.8%) | 20 (46.5%) | |
| Former smoker | 5 (25.0%) | 170 (33.8%) | 19 (38.7%) | 1240 (37.0%) | 279 (34.8%) | 14 (32.6%) | |
| GGT, UI/L | 32.5 (24.0–42.8) | 34.0 (26.0–48.0) | 37.0 (25.5–51.0) | 34.0 (26.0–47.0) | 34.0 (26.0–48.0) | 34.0 (23.0–46.0) | 0.865 |
| GOT, UI/L | 23.0 (19.5–28.0) | 23.0 (20.0–27.0) | 24.0 (20.0–28.5) | 23.0 (20.0–27.0) | 23.0 (20.0–27.0) | 24.0 (20.5–28.0) | 0.605 |
| GPT, UI/L | 25.0 (18.8–30.8) | 24.0 (19.0–32–0) | 26.0 (20.5–38.0) | 24.0 (19.0–32.0) | 24.0 (19.0–32.0) | 27.0 (19.5–33.5) | 0.548 |
| TSH, μU/mL | 1.40 (1.08–1.70) | 1.37 (1.03–1.94) | 1.40 (1.00–2.13) | 1.45 (1.02–2.00) | 1.48 (1.06–1.96) | 1.54 (1.16–1.91) | 0.964 |
Quantitative variables are expressed as means±standard deviation, except for variables not following normal distribution that are expressed as medians (interquartile ranges). Qualitative variables are expressed as percentage. The p value was calculated by ANOVA test or Kruskal–Wallis and Chi-square, as appropriate. LDL: low density lipoprotein; HDL: high density lipoprotein; GGT: gamma-glutamy ltransferase; GOT: aspartate aminotransferase; GPT: alanine aminotransferase; TSH: thyroid stimulating hormone.
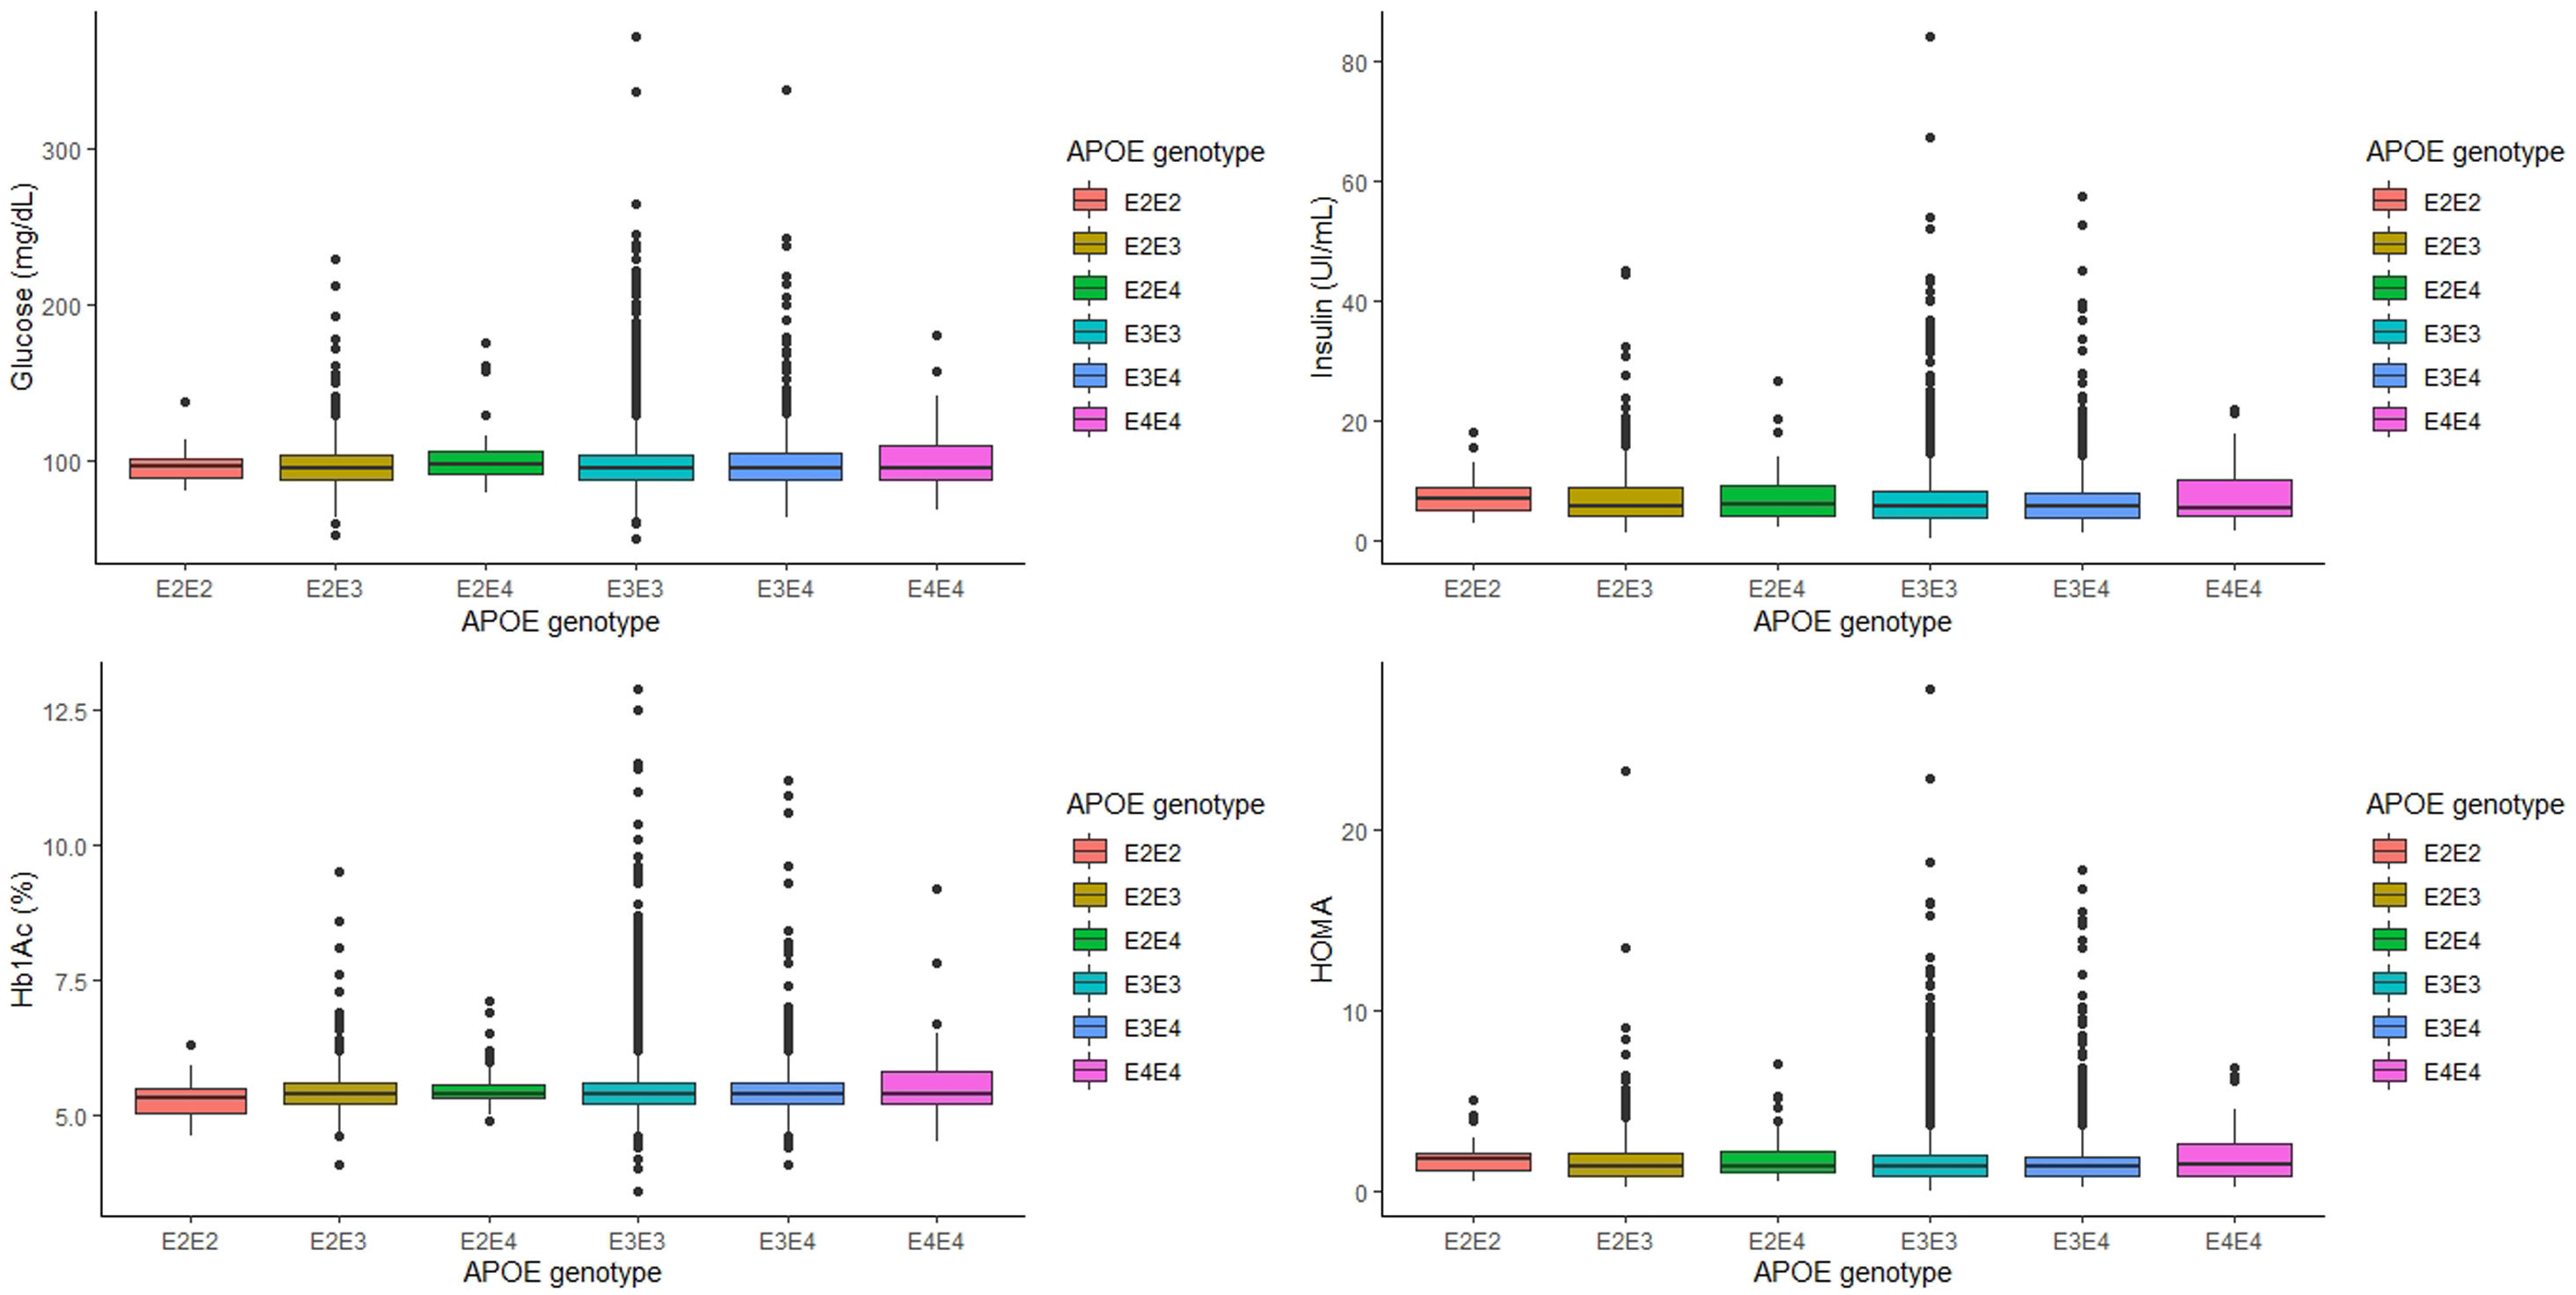
The relationship between APOE genotype and glycemic profile, showed that neither glucose, Hb1Ac, insulin levels and HOMA seem to be associated with the APOE genotype (p=0.563, p=0.605, p=0.333 and p=0.276, respectively, Fig. 1). However, analyzing the relationship between the APOE genotype and glycemic profile in each sex, we found that only Hb1Ac levels are significantly associated with ApoE4E4 genotype in men (p=0.031). Following the ADA criteria, 332 subjects were diagnosed as T2D, that represents a prevalence of 7.90% in our cohort. Of the 332 subjects with a diagnosis of T2D, 168 (50.8%) received a hypoglycemic medication. The prevalence of T2D did not show any association with the APOE genotype (p=0.354).

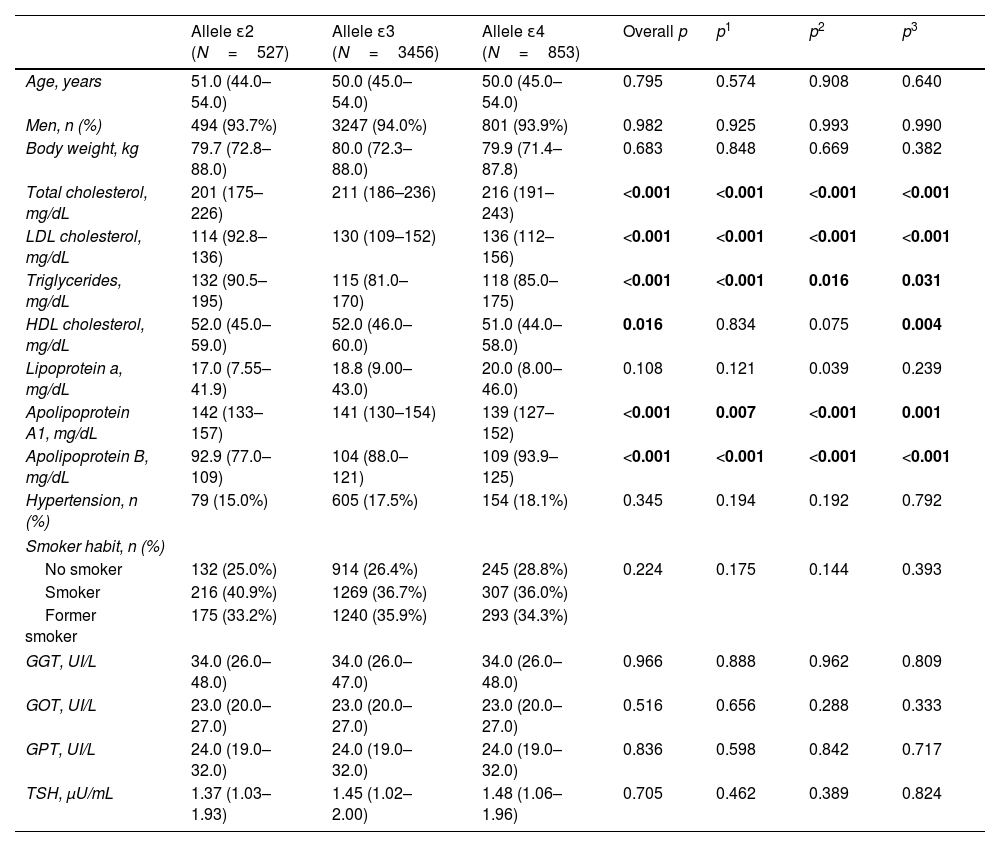
When we categorized the APOE genotype in three groups, ApoE2 carriers, that included subjects with ApoE2/E2 and ApoE2/E3 genotypes, ApoE3 carriers, which included only subjects with ApoE3/E3 genotype, and ApoE4 carriers, which included subjects with ApoE3/E4, and ApoE4/E4 genotype, similar associations were found (Table 2). As expected, ApoE4 carriers had significantly higher values of LDL cholesterol and apo B and lower values of apo A1 than ApoE3 carriers and ApoE2 carriers (p<0.001 for all cases, Table 2).
Clinical and biochemical characteristics according to APOE allele.
| Allele ɛ2 (N=527) | Allele ɛ3 (N=3456) | Allele ɛ4 (N=853) | Overall p | p1 | p2 | p3 | |
|---|---|---|---|---|---|---|---|
| Age, years | 51.0 (44.0–54.0) | 50.0 (45.0–54.0) | 50.0 (45.0–54.0) | 0.795 | 0.574 | 0.908 | 0.640 |
| Men, n (%) | 494 (93.7%) | 3247 (94.0%) | 801 (93.9%) | 0.982 | 0.925 | 0.993 | 0.990 |
| Body weight, kg | 79.7 (72.8–88.0) | 80.0 (72.3–88.0) | 79.9 (71.4–87.8) | 0.683 | 0.848 | 0.669 | 0.382 |
| Total cholesterol, mg/dL | 201 (175–226) | 211 (186–236) | 216 (191–243) | <0.001 | <0.001 | <0.001 | <0.001 |
| LDL cholesterol, mg/dL | 114 (92.8–136) | 130 (109–152) | 136 (112–156) | <0.001 | <0.001 | <0.001 | <0.001 |
| Triglycerides, mg/dL | 132 (90.5–195) | 115 (81.0–170) | 118 (85.0–175) | <0.001 | <0.001 | 0.016 | 0.031 |
| HDL cholesterol, mg/dL | 52.0 (45.0–59.0) | 52.0 (46.0–60.0) | 51.0 (44.0–58.0) | 0.016 | 0.834 | 0.075 | 0.004 |
| Lipoprotein a, mg/dL | 17.0 (7.55–41.9) | 18.8 (9.00–43.0) | 20.0 (8.00–46.0) | 0.108 | 0.121 | 0.039 | 0.239 |
| Apolipoprotein A1, mg/dL | 142 (133–157) | 141 (130–154) | 139 (127–152) | <0.001 | 0.007 | <0.001 | 0.001 |
| Apolipoprotein B, mg/dL | 92.9 (77.0–109) | 104 (88.0–121) | 109 (93.9–125) | <0.001 | <0.001 | <0.001 | <0.001 |
| Hypertension, n (%) | 79 (15.0%) | 605 (17.5%) | 154 (18.1%) | 0.345 | 0.194 | 0.192 | 0.792 |
| Smoker habit, n (%) | |||||||
| No smoker | 132 (25.0%) | 914 (26.4%) | 245 (28.8%) | 0.224 | 0.175 | 0.144 | 0.393 |
| Smoker | 216 (40.9%) | 1269 (36.7%) | 307 (36.0%) | ||||
| Former smoker | 175 (33.2%) | 1240 (35.9%) | 293 (34.3%) | ||||
| GGT, UI/L | 34.0 (26.0–48.0) | 34.0 (26.0–47.0) | 34.0 (26.0–48.0) | 0.966 | 0.888 | 0.962 | 0.809 |
| GOT, UI/L | 23.0 (20.0–27.0) | 23.0 (20.0–27.0) | 23.0 (20.0–27.0) | 0.516 | 0.656 | 0.288 | 0.333 |
| GPT, UI/L | 24.0 (19.0–32.0) | 24.0 (19.0–32.0) | 24.0 (19.0–32.0) | 0.836 | 0.598 | 0.842 | 0.717 |
| TSH, μU/mL | 1.37 (1.03–1.93) | 1.45 (1.02–2.00) | 1.48 (1.06–1.96) | 0.705 | 0.462 | 0.389 | 0.824 |
Quantitative variable was expressed as mean±standard deviation, except for variables not following normal distribution that are expressed as medians (interquartile ranges). The overall p value was calculated by ANOVA test or Kruskal–Wallis and Chi-square, as appropriate. p1, p2, and p3 values were calculated by T-Student test, U Mann–Whitney and Chi-square as appropriate, comparing ɛ2 vs ɛ3 carriers, ɛ2 vs ɛ4 carriers and ɛ3 vs ɛ4 carriers, respectively. 2E2 allele included subjects with E2/2 and E2/3 APOE genotype. 3E3 allele included only subjects with E3/3 APOE genotype. 3E4 allele included subjects with E3/4 and E4/4 APOE genotype. LDL: low density lipoprotein; HDL: high density lipoprotein; GGT: gamma-glutamyl transferase; GOT: aspartate aminotransferase; GPT: alanine aminotransferase; TSH: thyroid stimulating hormone.
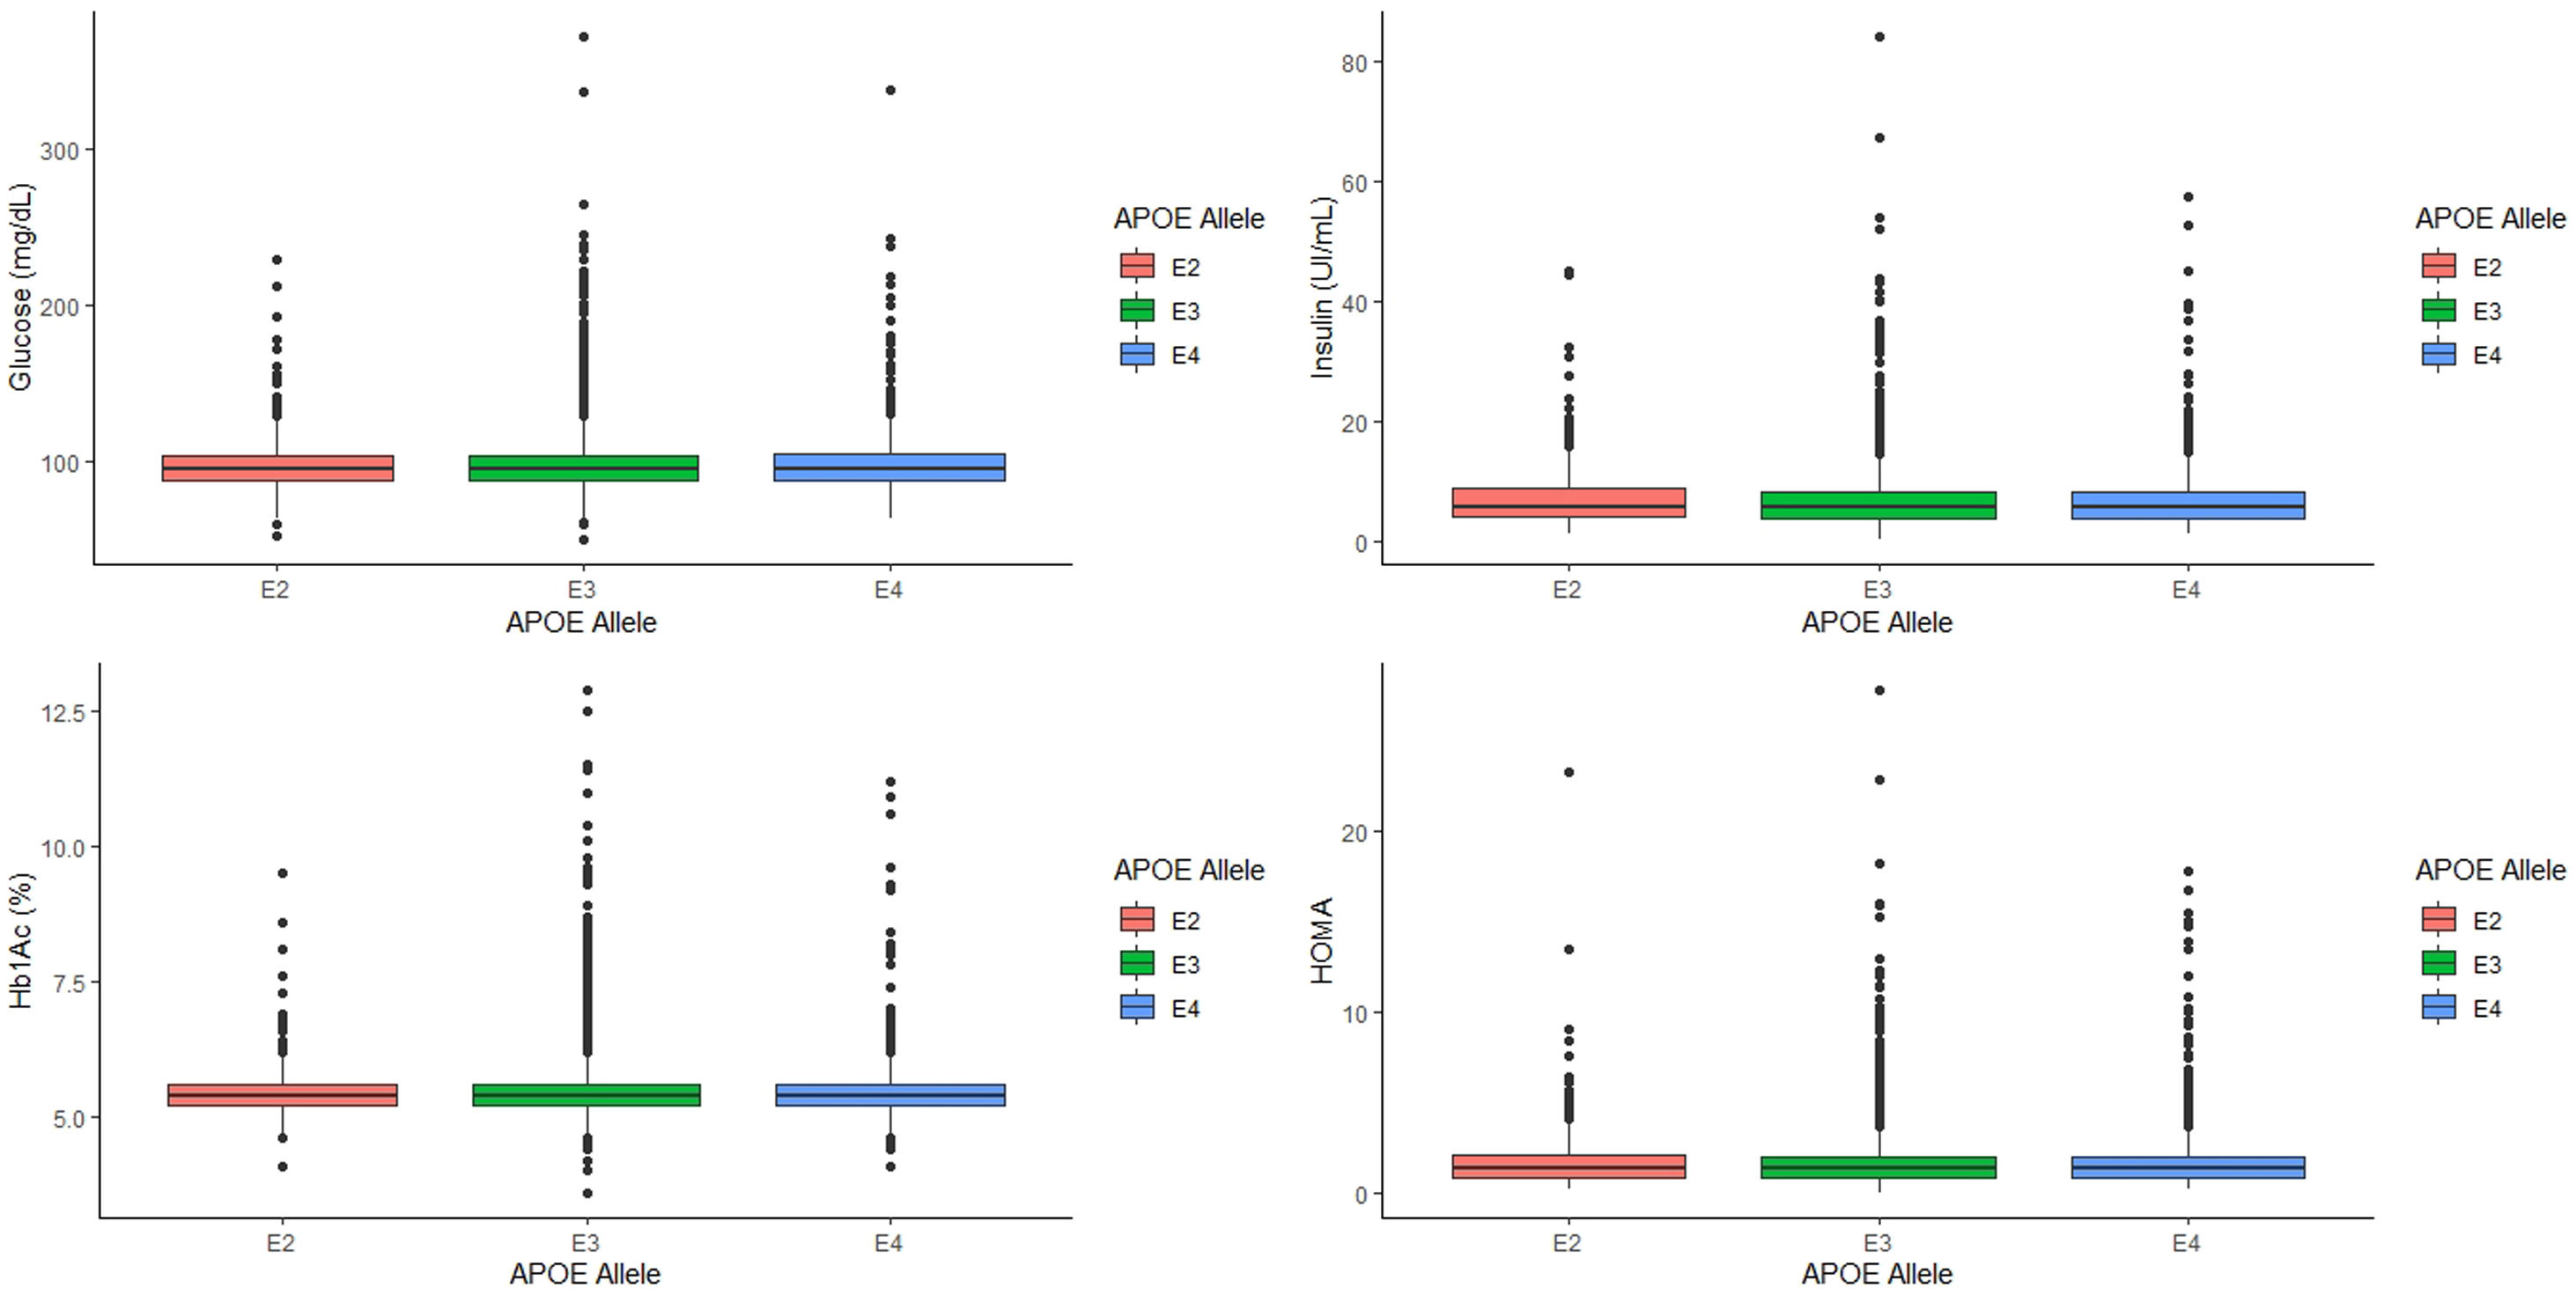
Analyzing the relationship between APOE alleles and glycemic profile, we found that neither glucose, Hb1Ac, insulin levels and HOMA seem to have any association with the APOE alleles (p=0.745, p=0.808, p=0.389 and p=0.497, respectively, Fig. 2) nor the prevalence of T2D (p=0.978).

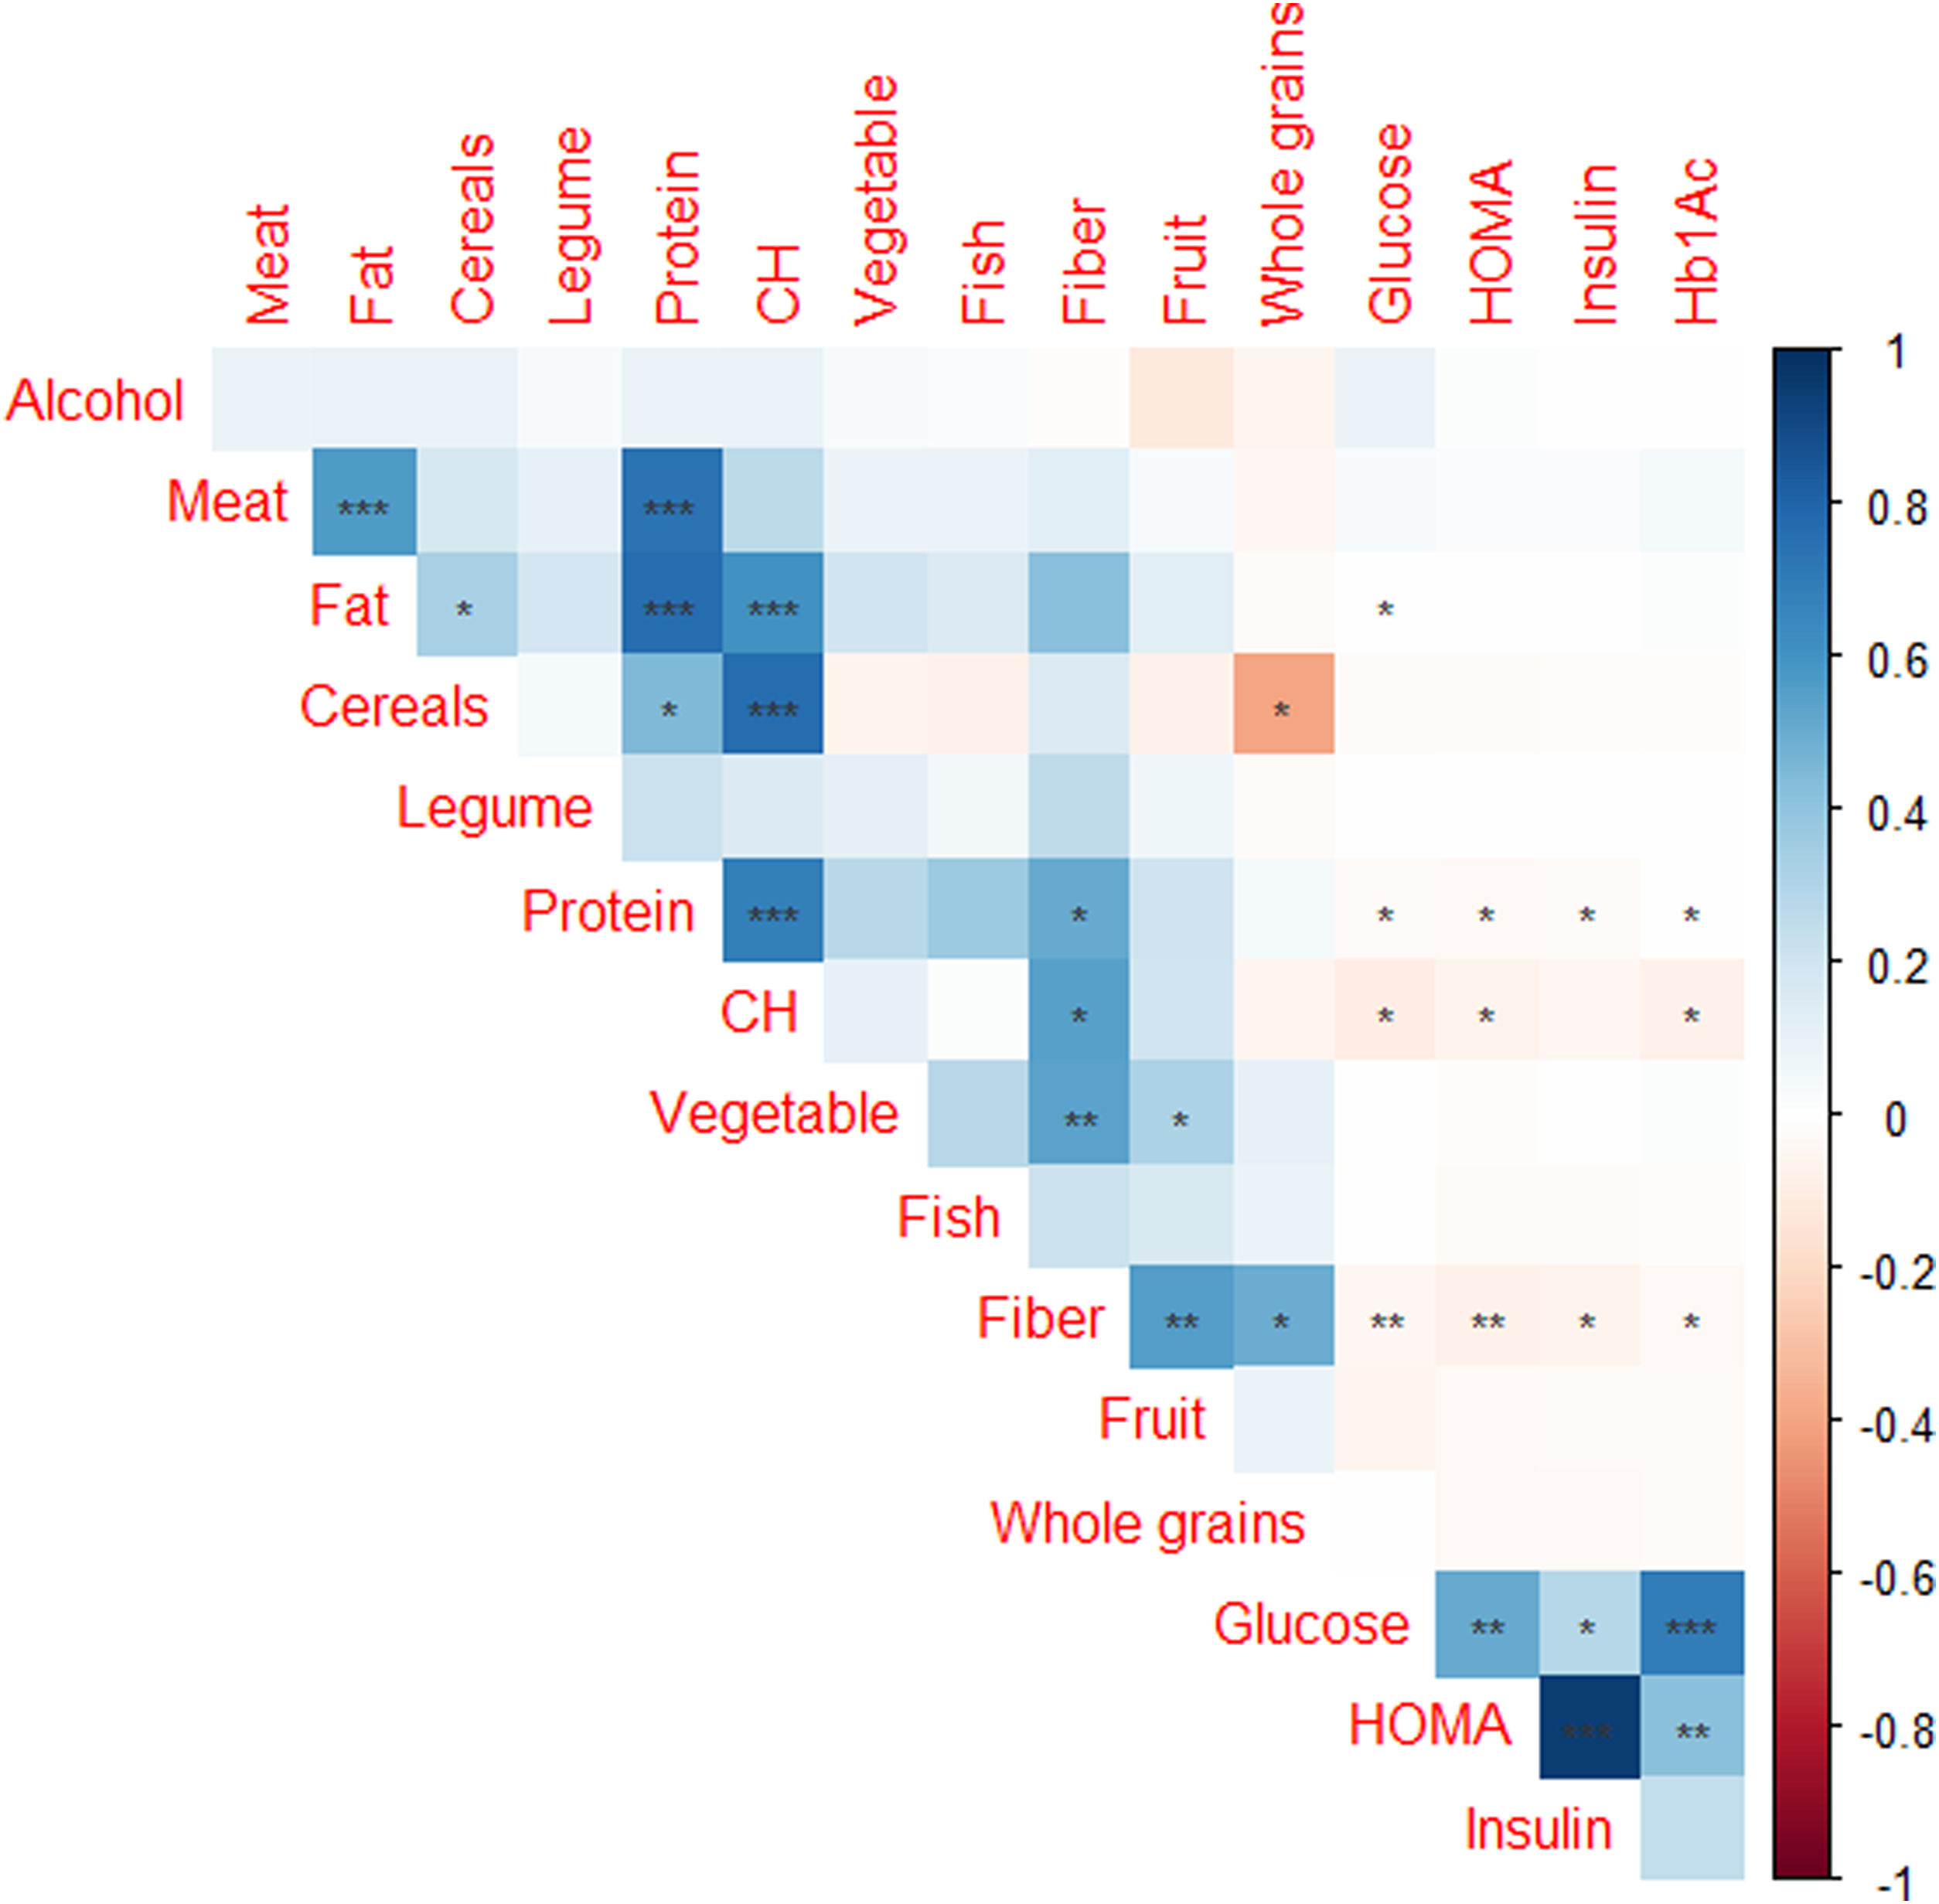
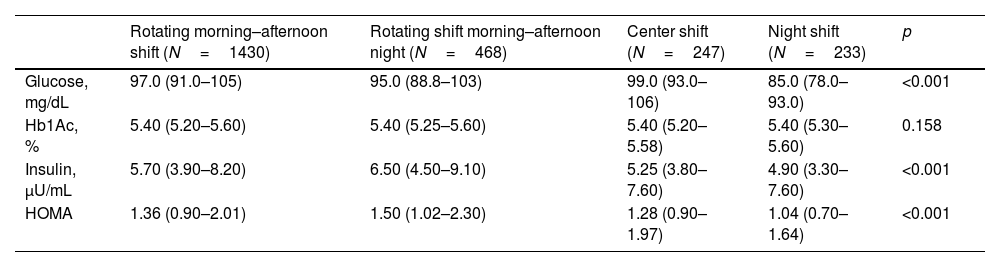
Of the 4895 subjects from AWHS, 2378 subjects (48.6%) had available data of work shift and dietary habits assessment. Table 3 shows the effect of shift work on the glycaemic profile, showing that glucose, insulin and HOMA levels are significantly different depending on the shift work. Night shift workers have significantly lower levels of glucose, insulin and HOMA (p<0.001 in all cases, Table 3). Fig. 3 shows correlations between glycaemic parameters and food items consumption, reporting that glucose and HOMA levels had negative significant association with fiber, carbohydrates and protein consumption and positive significant association with fat intake (p<0.01, with fiber and p<0.05 with carbohydrate, protein and fat intake). However, when we analyzed if the APOE genotype could influence in the glycaemic profile adjusted by work shift and dietary parameters, we found that there were not differences in the concentration of glucose, insulin, Hb1Ac and HOMA depending on the APOE genotype (p=0.372, p=0.681, p=0.813 and p=0.574, adjusted for age, weight, work shift and total consumption of carbohydrates, proteins and lipids, respectively, Supplemental Table 1). In the same line, there were not differences in the concentration of glucose, insulin, Hb1Ac and HOMA depending on the APOE allele (p=0.356, p=0.255, p=0.956 and p=0.167, respectively, adjusted for age, weight, work shift and total consumption of carbohydrates, proteins and lipids, Supplemental Table 2).
Effect of shift work on the glycaemic profile.
| Rotating morning–afternoon shift (N=1430) | Rotating shift morning–afternoon night (N=468) | Center shift (N=247) | Night shift (N=233) | p | |
|---|---|---|---|---|---|
| Glucose, mg/dL | 97.0 (91.0–105) | 95.0 (88.8–103) | 99.0 (93.0–106) | 85.0 (78.0–93.0) | <0.001 |
| Hb1Ac, % | 5.40 (5.20–5.60) | 5.40 (5.25–5.60) | 5.40 (5.20–5.58) | 5.40 (5.30–5.60) | 0.158 |
| Insulin, μU/mL | 5.70 (3.90–8.20) | 6.50 (4.50–9.10) | 5.25 (3.80–7.60) | 4.90 (3.30–7.60) | <0.001 |
| HOMA | 1.36 (0.90–2.01) | 1.50 (1.02–2.30) | 1.28 (0.90–1.97) | 1.04 (0.70–1.64) | <0.001 |
Quantitative variable was expressed as median (interquartile ranges). The p value was calculated by Kruskal–Wallis test.

This study shows that the development of T2D appears to be unrelated to the APOE gene after analysing the association between the APOE genotype and glucose, insulin, Hb1Ac, and HOMA values in a large cohort of workers from Zaragoza, Spain. However, those results suggest the existence of a relationship between glucose metabolism and work shifts.
Some previous studies have analyzed the relationship between APOE genotypes and the development of T2D, showing contradictory results. In the case of the meta-analysis, carried out by Chen et al.,21 authors concluded that ApoE4 allele and ApoE2/E2, ApoE3/E4, and ApoE4/E4 genotypes are associated with the increased risk of the development of T2D. However, the meta-analysis carried out by Anthopoulos et al.,34 concluded that only APOE2 carriers seem to have a higher risk of developing T2D, indicating that this higher risk of the ApoE2 allele could be mediated by the alteration of lipid levels. However, in the case of our study, although we found that the serum concentration of TG is lower in individuals with the ApoE3/E4 and ApoE4/E4 genotypes, we did not find that ApoE2 carriers present significantly higher values of glucose, Hb1Ac, insulin or HOMA levels. In one recently study carried out by Gao et al.,20 authors showed that T2D patients have significantly higher frequencies of ApoE3/E4 genotype and allele ApoE4. Besides, these authors reported that APOE allele is not only a risk factor to T2D development, but also its complications, indicating that E4 allele may be a risk factor for CVD in T2D, and cerebral infraction in T2D subjects, while the APOE2 allele may be a risk factor for diabetic nephropathy. Another article with Chinese population showed that E4 allele was associated with a significantly increased risk of metabolomic syndrome, which often includes diabetes, only in men. Similar results we have found in our cohort, where only the Hb1Ac levels are significantly associated with E4 allele in men. Finally, one study carried out with 284 subjects categorized in three groups: T2D subjects, T2D subjects with complications and subjects with CVD, showed that only the frequency of ApoE3/E4 genotype and ApoE4 allele were significantly increased in CVD patients and not in T2D subjects. Besides, these authors concluded that after adjustment for other established risk factors, ApoE3/E4 genotype was an independent risk factor for CVD but not for T2D.35
Regarding work shifts, this study directly relates glucose, Hb1Ac and insulin levels with work shifts, by showing higher levels in individuals with morning-afternoon and morning-afternoon-night rotating shifts. Evidence has been found that shift work significantly raises blood glucose concentration and decreases insulin sensitivity.36,37 In addition, another study carried out in the United Kingdom points in the same way, and also adds that rotating night shifts increase the possibility of suffering from T2D, which is consistent with the findings of this study, since workers with rotating schedules that include night shifts have the worst insulin levels.38 Rotating shifts have previously been associated with circadian rhythm disorders39,40 and more with pancreatic beta cell dysfunction and peripheral insulin resistance,41 facts that are confirmed by our results. This would explain why changing shifts is worse than always going at night, due to the alteration of circadian rhythms, among other factors. According to another study conducted in the AWHS cohort by Peñalvo et al.,42 the foregoing can be explained by the demanding schedules of rotating shift workers, which would be an important cause of the less healthy eating behaviors of these individuals, consisting of a higher intake of trans-saturated fats, coffee and soft drinks, in addition to less physical activity. The combination of all these factors could also be found behind the greater appearance of T2D and the parameters associated with it, despite the fact that in this study it is associated with atherosclerosis.
Regarding diet, a negative correlation was observed between the consumption of carbohydrates, fiber and protein and glucose concentration. However, we found a positive correlation between fat and blood glucose levels. The negative correlation between the consumption of carbohydrates and fiber with blood glucose, as well as the positive correlation with the consumption of fats, could be explained by the insulin resistance that appears in cases of obesity. Insulin resistance would be caused by the consumption of foods rich in fat and very low in fiber, as is often the case with ultra-processed foods. There are studies that support that evaluating the total content of fats and carbohydrates in the diet may not yield significant information, so it is necessary to categorize the type of fat consumed. Since the consumption of monounsaturated fats and carbohydrates with a lower glycemic index and more fiber are associated with improvements in insulin resistance.43–45
Our study has some limitations that deserve comment. First of all, it is necessary to take into account the storage conditions that can especially affect the determination of glucose in samples from the night shift. This is due to the fact that if the centrifugation of the samples is not immediate, the erythrocytes present in the sample continue to consume glucose, which may partly explain the somewhat lower glucose values of the individuals on the night shift. However, glycosylated hemoglobin and insulin have the same trend, showing lower values in the night shift group, which seems to indicate that the storage conditions were ideal and did not affect glucose levels excessively. Secondly, the vast majority of the AWHS cohort is male. This prevalence of male patients could have important drawbacks on the reported conclusions of the same. Since, as the ANIBES study has shown, men have a higher average consumption of processed food, sauces and condiments than women, who usually consume more fruit and vegetables.46 However, despite the fact that obesity, which is the main conditioning factor of T2D, is more frequent among women, the prevalence of T2D is relatively higher in men, due to the greater accumulation of visceral fat that these individuals present.47 Finally, having all the data on dietary habits for the entire AWHS cohort would allow us to include this variable and job shift in the regression models and further adjust the analysis prepared.
In summary, our study has reported that T2D prevalence in a large cohort of workers from a factory did not show any significant correlation with APOE genotype or allele. Glucose, insulin and HbA1c levels also did not show a significant correlation with APOE genotype. Besides, individuals working in non-rotating night shift showed significantly lower levels of glucose, insulin and HbA1c, while rotating morning-afternoon-night shift workers showed significantly higher levels of glucose, insulin and HbA1c.
FundingThis work was supported by grants from Spanish Atherosclerosis Society (“Manuel de Oya” grant), from Aragon Government, B14-7R, Spain, and the Spanish Ministry of Economy and competitiveness PI18/01777, PI19/0694, and CIBERCV. These projects are co-financed by Instituto de Salud Carlos III and the European Regional Development Fund (ERDF) of the European Union “A way to make Europe”. CIBERCV is a project of Instituto de Salud Carlos III.
Conflict of interestThe authors declare no conflict of interest
All authors have read and approved the final manuscript. The authors thank Cecilia Bennett for her English editorial assistance.
The following are the supplementary data to this article: