


The use of natural zeolites as precursors offers a valuable alternative in the search for new materials applied to zeolite synthesis. Each study focused on the interzeolitic conversion method plays a fundamental role in understanding the evolution from one zeolite to another. In this study, a natural zeolite containing the crystalline phases of clinoptilolite and mordenite, with HEU and MOR topologies, respectively, as per the coding assigned by the IZA, was employed as a precursor. Combined with potassium–aluminum hydroxide solutions at two different concentrations, followed by a conventional hydrothermal process with durations of 50 and 90h, characterization of both the precursor and resulting zeolite was performed. A conversion mechanism was proposed based on the structural similarity between the initial and target zeolites. To support these conclusions, characterization techniques such as X-ray diffraction, scanning electron microscopy, energy-dispersive X-ray spectrometry, Fourier-transform infrared spectroscopy, inductively coupled plasma optical emission spectroscopy, and nitrogen adsorption were utilized. This process represents a potential pathway for the synthesis of merlinoite-type zeolites, MER.
El uso de zeolitas naturales como precursores ofrece una valiosa alternativa en la búsqueda de nuevos materiales aplicados a la síntesis de zeolitas. Cada estudio centrado en el método de conversión interzeolítica juega un papel fundamental en la comprensión de la evolución de una zeolita a otra. En este estudio, se empleó como precursor una zeolita natural que presenta las fases cristalinas de clinoptilolita y mordenita, con topologías HEU y MOR, respectivamente, según la codificación asignada por la IZA. Combinada con soluciones de hidróxido de potasio-aluminio con dos concentraciones diferentes, seguido de un proceso hidrotermal convencional con duraciones de 50 y 90 horas, se realizó una caracterización tanto de la zeolita precursora como de la zeolita resultante. Se propuso un mecanismo de conversión basado en la similitud estructural entre la zeolita inicial y la zeolita objetivo. Para respaldar estas conclusiones, se utilizaron técnicas de caracterización como la difracción de rayos X, microscopia electrónica de barrido, espectrometría de rayos X por dispersión de energía, espectroscopia infrarroja por transformada de Fourier, espectrometría de emisión óptica con plasma acoplado inductivamente y adsorción por nitrógeno. Este proceso representa una vía potencial para la síntesis de zeolitas tipo merlinoita, MER.
The merlinoite-type zeolite, also known as MER according to the code assigned by the Structure Commission of the International Zeolite Association (IZA) [1], is classified as a small-pore zeolite with an 8MR topology. This means that although its structure is composed of tetrahedral rings of 4 and 8 members, it features a three-dimensional channel system formed by rings of eight oxygen atoms [2]. Furthermore, this zeolite is characterized by having two primary building blocks and three secondary units. This specific configuration gives it structural and physicochemical properties that make it relevant for various applications [3]. According to recent studies [4–8], its efficiency has been demonstrated primarily in gas separation processes and cation adsorption, where it has proven to be a successful adsorbent, achieving removal efficiencies of up to 97.6% for Pb2+[9], and 90% for Cs2+ and 65% for Sr2+[10].
Given that the dominant structural cation in MER is the potassium ion (K+), it positions it as a promising material for agricultural applications, such as an efficient fertilizer to enhance plant growth in low-fertility soils by providing a slow release of K+[11]. Furthermore, its capacity as a potassium extractor from seawater has been investigated [12], expanding its range of practical applications.
This versatility highlights the importance of synthetic zeolites, including merlinoite, in addressing sustainability challenges in both scientific and industrial fields [13]. Therefore, the synthesis of merlinoite zeolite has been the subject of extensive research, employing conventional hydrothermal methods with various preparations in its precursors. These investigations include the fusion of potassium feldspars with potassium hydroxide followed by a hydrothermal process at temperatures between 140 and 180°C [14]; the hydrolysis of tetraethyl orthosilicate (TEOS) with KOH–H2O and alkaline aluminate mixtures, followed by a 48-h hydrothermal treatment at 170°C [15], and the addition of potassium hydroxide, soluble silicate, and sodium aluminate in deionized water, stirred for 10h, and subjected to a 22-h hydrothermal process at 170°C [16]. Additionally, Meenu's approach [17] utilized KOH and basic aluminum in a pre-stirred mixture, followed by a 48-h hydrothermal treatment at 150°C.
Recent advancements in zeolite synthesis have sparked considerable interest in the method of interzeolite conversion, an approach that differs significantly from conventional hydrothermal methods. This technique, emphasized in several studies [18–21], focuses on the use of pre-existing zeolites instead of employing solid precursors or traditional chemical reagents [22]. This paradigm shift responds to a growing trend over the past decade toward the utilization of low-cost and more environmentally friendly starting materials, reflecting increased sustainability awareness in zeolite research and development [23]. This renewed approach is based on a mechanism involving the decomposition of the structure of an initial zeolite, utilizing its fundamental building units as nuclei or seeds for the development of new zeolite structures.
A prominent example of a precursor is the use of natural zeolite such as clinoptilolite, belonging to the heulandite group and also known as HEU, according to IZA nomenclature [1]. In its genesis process, this zeolite may occur solely as an authigenic mineral [24–26]. Recent studies have demonstrated that this crystalline phase can be successfully transformed into GIS zeolite within a period of four days and into LTA zeolite in just 4h [27]. However, the literature supports the occasional presence of the MOR crystalline phase [1] (mordenite) alongside HEU zeolite [28,29]. To date, no interzeolitic conversions from natural zeolites containing both HEU and MOR to merlinoite have been documented.
In this study, both the precursor and the resulting zeolite were characterized, focusing on understanding the mechanism of interzeolitic conversion. A mechanism based on the structural similarity between the initial and target zeolites is proposed. To support our conclusions, characterization techniques such as X-ray diffraction (XRD), X-ray fluorescence (XRF), scanning electron microscopy (SEM), energy-dispersive X-ray spectrometry (EDX), Fourier-transform infrared spectroscopy (FTIR), nitrogen adsorption at 77K, and inductively coupled plasma optical emission spectrometry (ICP-OES) were applied. The results obtained demonstrate that this process represents a promising route for the synthesis of small-pore zeolites such as MER.
MethodologyMaterials and methodsThe starting materials used in this study were natural zeolite (NZ), analytical-grade potassium hydroxide (KOH) with a purity of 98%, metallic aluminum residues from the food industry with a purity of 95.89%, and deionized water. The natural zeolite, employed as a mineral source of alumina and silica, was extracted from an open-pit mine located in Teximalpa, Huayacocotla, in the state of Veracruz, Mexico, with UTM (Universal Transverse Mercator) coordinates of 550,380.52m E and 2,257,714.98m N. The soils in this region have a surface layer rich in organic matter and nutrients, prone to erosion and accumulation of clay in the subsurface. Prior to hydrothermal treatment, the natural zeolite underwent a grinding and homogenization process to achieve a particle size below 147 microns.
Interzeolitic conversionStructural conversion was started with the preparation of two different solutions of potassium hydroxide and deionized water, with concentrations detailed in Table 1. To these solutions, aluminum metal powder was added in specific proportions, followed by continuous stirring for 24h to enable aluminum dissolution. The resulting KOH–Al solutions were filtered to remove undissolved residues.
Quantities of reagents used for reactive mixtures M1 and M4.
| Mixture | Natural zeolite (g) | KOH–Al solution | ||
|---|---|---|---|---|
| KOH (g) | Aluminum (g) | H2O (ml) | ||
| M1 | 3.0 | 1.120 | 0.054 | 30.0 |
| M4 | 12.0 | 4.48 | 0.216 | 30.0 |
The net amount of each reagent in mixture M4 was increased by approximately 4 times compared to mixture M1, while keeping the volume of water constant.
Subsequently, a specific amount of zeolite powder was introduced into each solution, thus forming the reactive mixtures M1 and M4 (details in Table 1). These mixtures were subjected to a hydrothermal reaction process in a Teflon-lined steel autoclave at a constant temperature of 145°C, for periods between 15 and 90h, without a previous aging process.
At the end of the hydrothermal process, the solid and liquid products were separated by filtration. To remove KOH residues, the recovered solid was washed with deionized water to get a neutral pH and then dried at 90°C before analysis.
CharacterizationThe identification of crystalline phases in the zeolite samples, both in their natural state and after interzeolitic conversion, was performed using the ICDD PDF-4+ 2019 software, version 4.19.0.1, with the database version 4.1903. X-ray diffraction (XRD) analyses were conducted using an Inel diffractometer, Equinox 2000 model, operating with CoKα radiation (20mA, 30kV). The deconvolution of these experimental peaks from natural zeolite and processed samples was performed to obtain semi-quantification of present phases. The analysis was conducted using Pseudo-Voigt functions in combination with the Levenberg–Marquardt algorithm. The mass fraction (wt%) of each phase was calculated using Eq. (1).
The characterization of the chemical composition of the natural zeolite precursor, focused on quantifying major elements, was carried out using X-ray fluorescence spectroscopy (XRF) technique. This analysis was conducted using a RIGAKU ZSX Primus II instrument. Additionally, the loss on ignition (LOI) of the samples was determined. For this, 1g of dry basis sample was heated to a temperature of 950°C for 1h. Subsequently, the resulting mass loss percentage was measured.
Morphological characterization and recognition of characteristic zeolite crystals in the samples, both in their initial state and after conversion, were carried out using scanning electron microscopy (SEM) technique. This analysis was conducted using a JEOL electron microscope, IT 300 model. Additionally, for a more detailed assessment of the elemental composition of the crystals of interest, microanalytical analyses were performed using energy-dispersive X-ray spectrometry (EDX). These EDX analyses were conducted using an Oxford Instruments X-MAX detector.
Nitrogen adsorption-desorption isotherms at 77K were measured using a Nova series physisorption analyzer from Quantachrome. The samples under study were subjected to a degassing process at 300°C for 12h prior to measurements, following Lowell's recommendations [30]. Through the adsorption branch of the isotherms, equivalent surface areas were calculated using the Langmuir and Brunauer–Emmet–Teller (BET) methods, as well as the surface area of mesopores using the t-method. Additionally, the volume and size distribution of meso-macropores were determined using the Barret–Joyner–Halenda (BJH) method, based on the desorption branch of the isotherms. Finally, the total pore volume was estimated from the volume of liquid nitrogen adsorbed at a relative pressure P/P0 of 0.99.
The vibrational spectra positions of the zeolites from both source and destination were obtained through Fourier-transform infrared spectroscopy (FTIR), thus complementing the previous identification carried out by X-ray diffraction (XRD). For vibrational characterization, a PerkinElmer Spectrum GX FT-IR spectrophotometer was used, operating in transmittance mode. Spectra were recorded in the range of 4000–400cm−1. The sample preparation for analysis involved forming pellets by homogeneously mixing the solid zeolite with KBr in a mass ratio of 1:100.
Quantification of the major soluble elements, specifically silicon (Si), aluminum (Al), and potassium (K), in both the initial reactive solution and the resulting solution from zeolitic conversion, was carried out using inductively coupled plasma optical emission spectroscopy (ICP-OES). For this purpose, a Perkin Elmer Optima 8300 spectrometer was utilized.
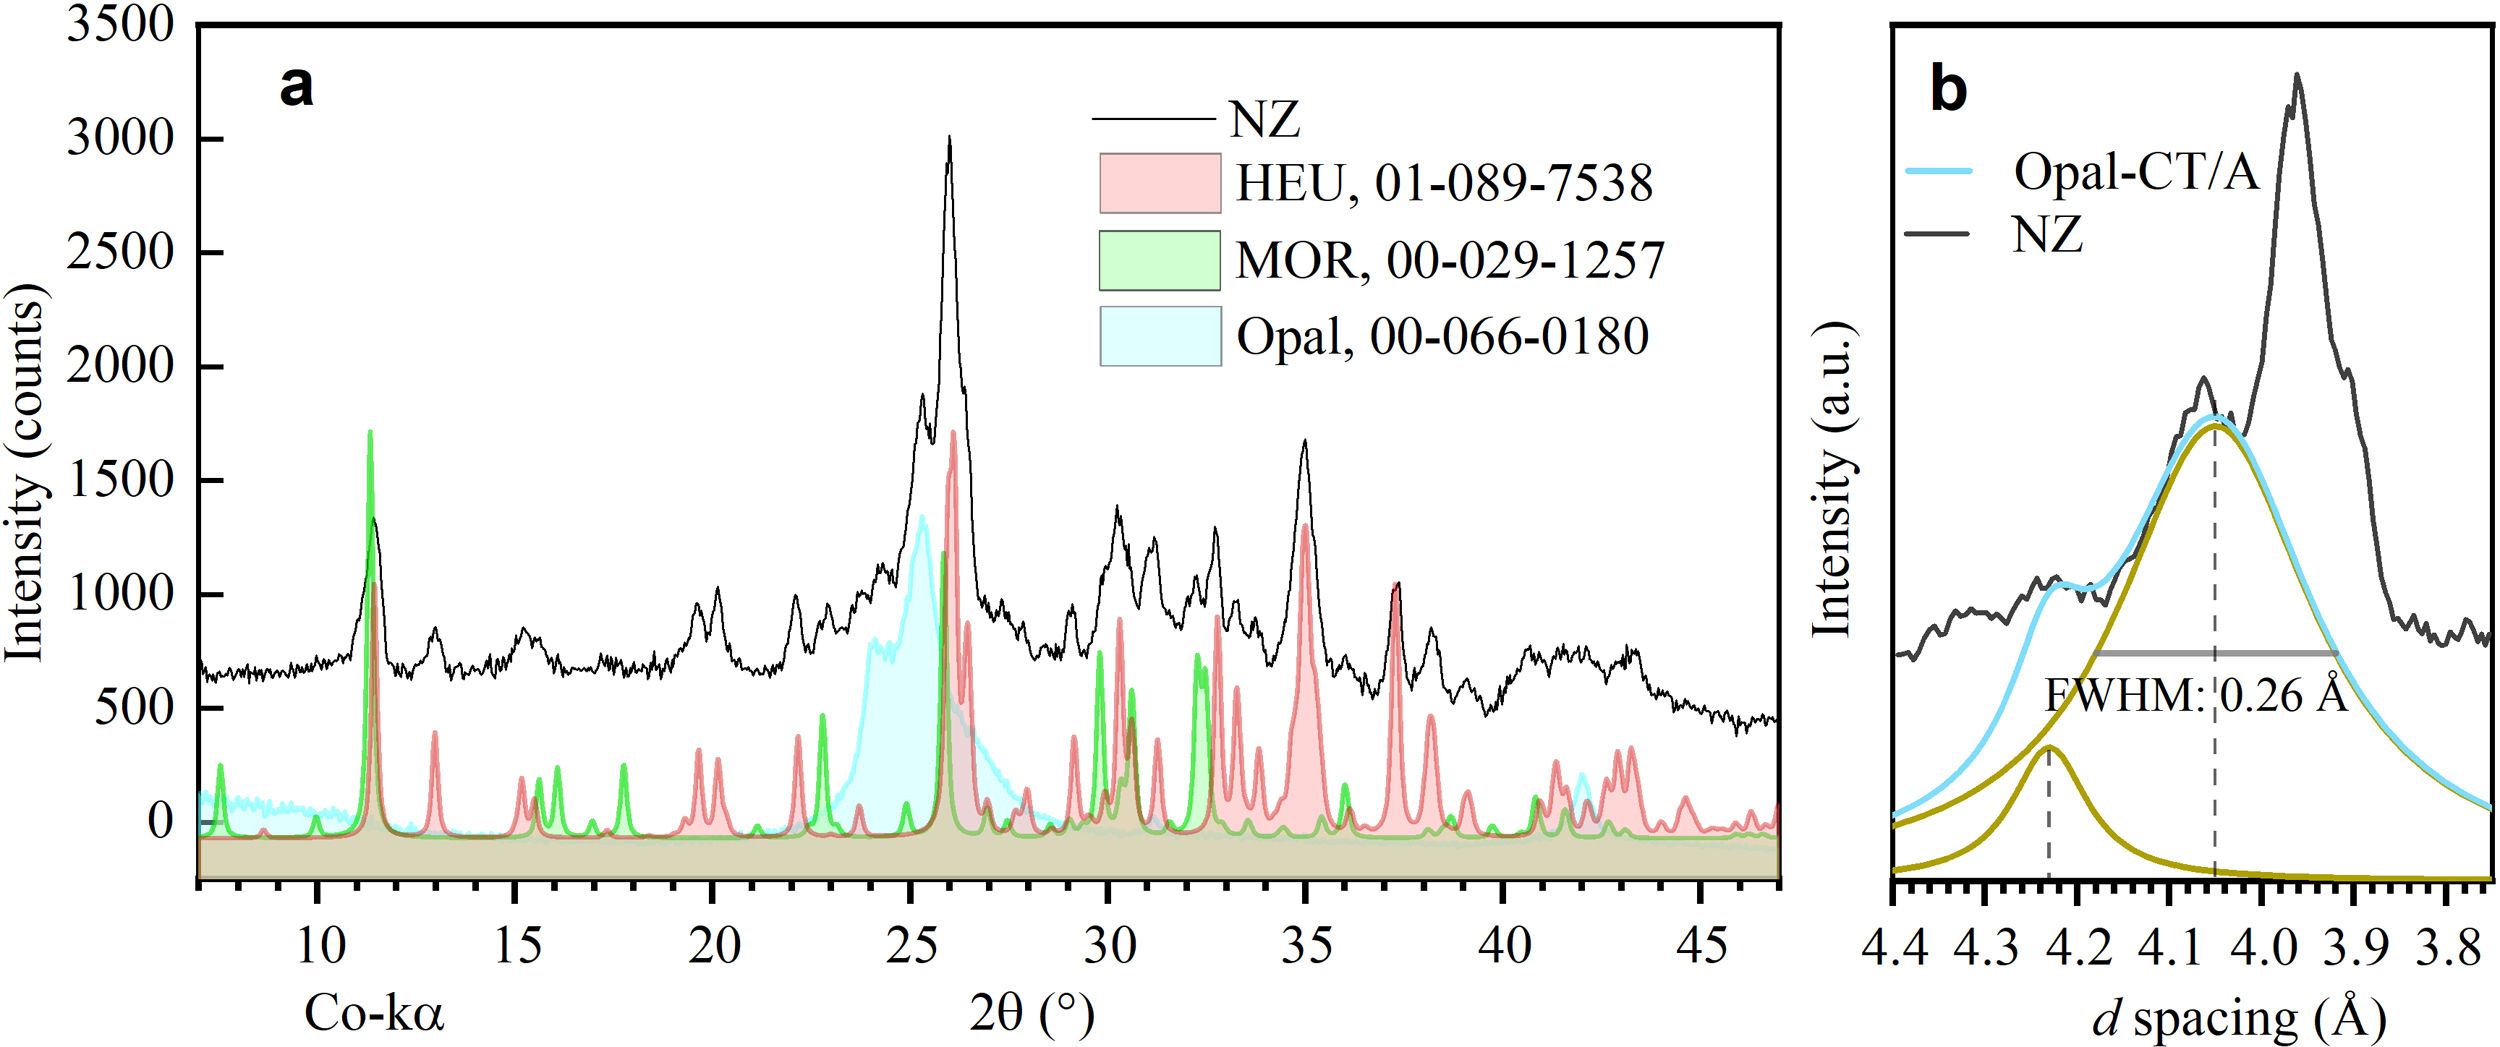
Results and discussionPhase identificationThrough X-ray diffraction (XRD), detailed analyses were conducted on the phases present in natural zeolite (NZ), used as a precursor material in the conversion process. Two main crystalline phases were identified (Fig. 1a): clinoptilolite and mordenite, compared to those reported by Cappelletti and coll. [31] and Passaglia [32]. In addition, the presence of a paracrystalline phase of opal [33] was detected. These findings are consistent with the literature on natural zeolite deposits, where these three phases commonly coexist [29]. Chipera and Apps [34] discuss the importance of silica concentration in the formation of clinoptilolite and its coexistence with opal. Similarly, Passaglia and Sheppard [34] indicate the usual association of mordenite with clinoptilolite and silica minerals such as opal.
 X-ray diffraction pattern of natural zeolite (NZ) showing the phases of heulandite (HEU), mordenite (MOR), and opal. (b) Profile of the opal-CT/A transition, where opal-CT is the predominant phase.")
Regarding the characterization of opal (Fig. 1b), a distinctive peak at 4.05Å was observed, characteristic of opal-C and opal-CT [33]. These paracrystalline phases share structural similarities with cristobalite (opal-C) or with cristobalite and tridymite (opal-CT). On the other hand, opal-A, known for its less ordered structure and its appearance of lepispheres, differs from these phases [35]. The peak at 4.05Å, with a full width at half maximum intensity (FWHM) of 0.26Å, and a small shoulder at 4.23Å, suggests the mineralogical transition of opal-CT/A, with a predominance of opal-CT [36]. Additionally, background noise was detected throughout the spectrum, indicative of an amorphous phase common in natural zeolites, related to their formation process [37].
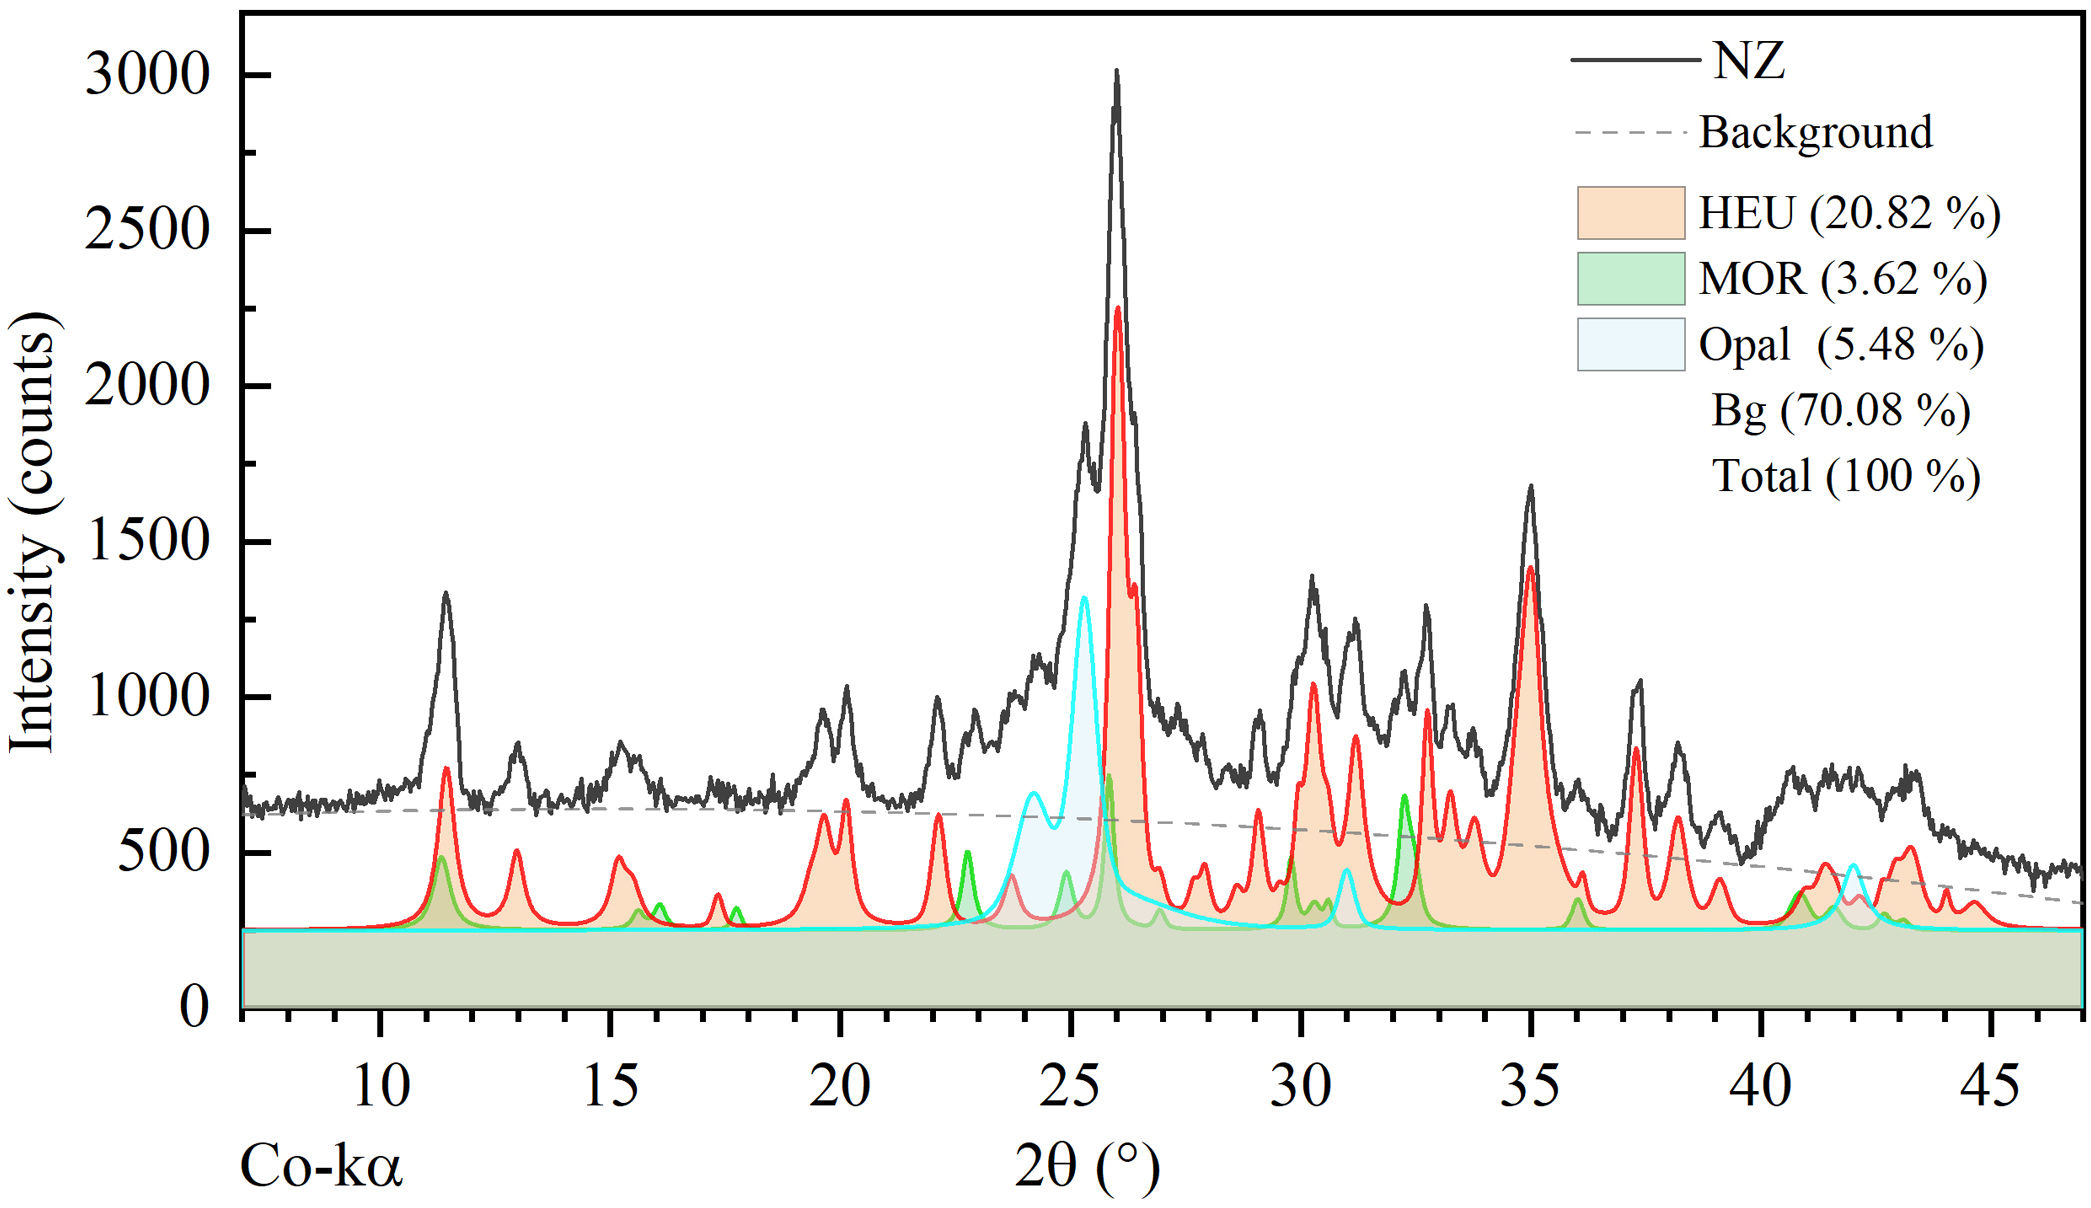
According to the semi-quantitative analysis conducted by deconvolution of peaks from the experimental pattern, the mass fraction (wt%) corresponding to the phases HEU, MOR, and opal is 20.82, 3.62, and 5.48wt%, respectively. The background (70.08wt%) corresponds to unidentified non-crystalline material (see Fig. 2).

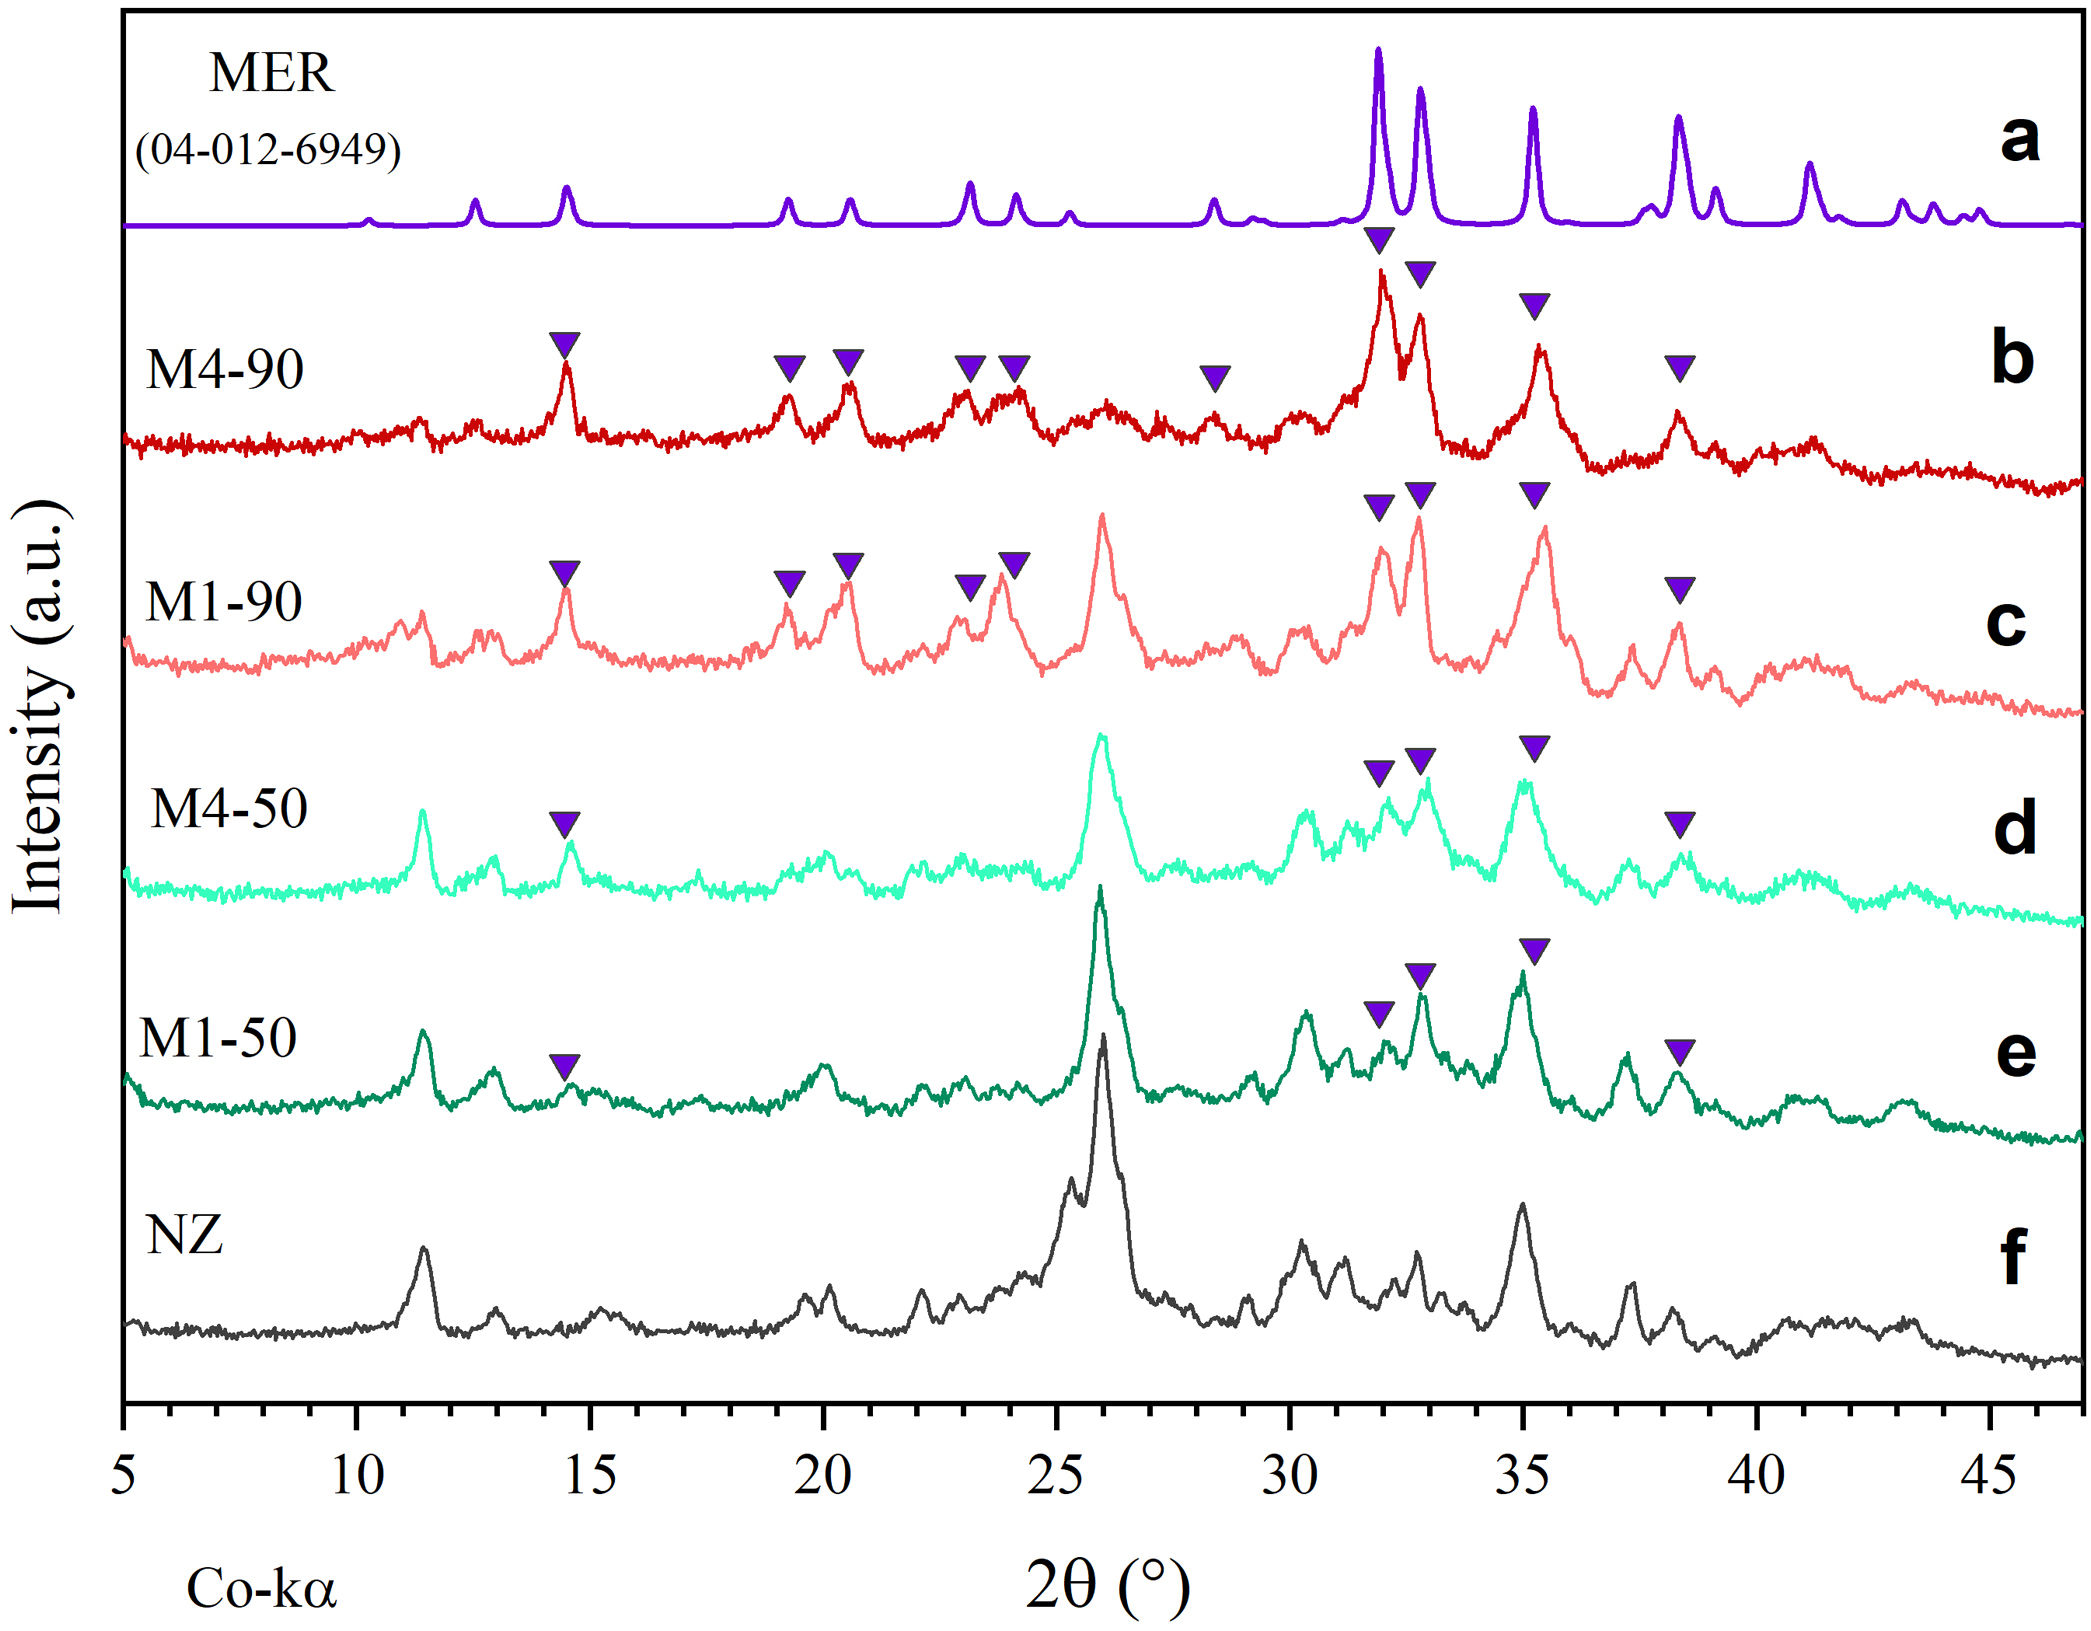
Fig. 3 presents comparative diffractograms of natural zeolite before and after undergoing hydrothermal treatments for periods of 50 and 90h, using reactive mixtures M1 and M4. Particularly, the diffractogram in Fig. 3a serves as a reference, displaying the diffraction pattern of merlinoite zeolite (MER), as reported by Bieniok et al. [38].
 MER diffraction pattern. Interzeolitic conversion over 90h using precursor mixtures, (b) M4 and (c) M1. Interzeolitic conversion over 50h with mixtures (d) M4 and (e) M1. (f) Precursor natural zeolite.")
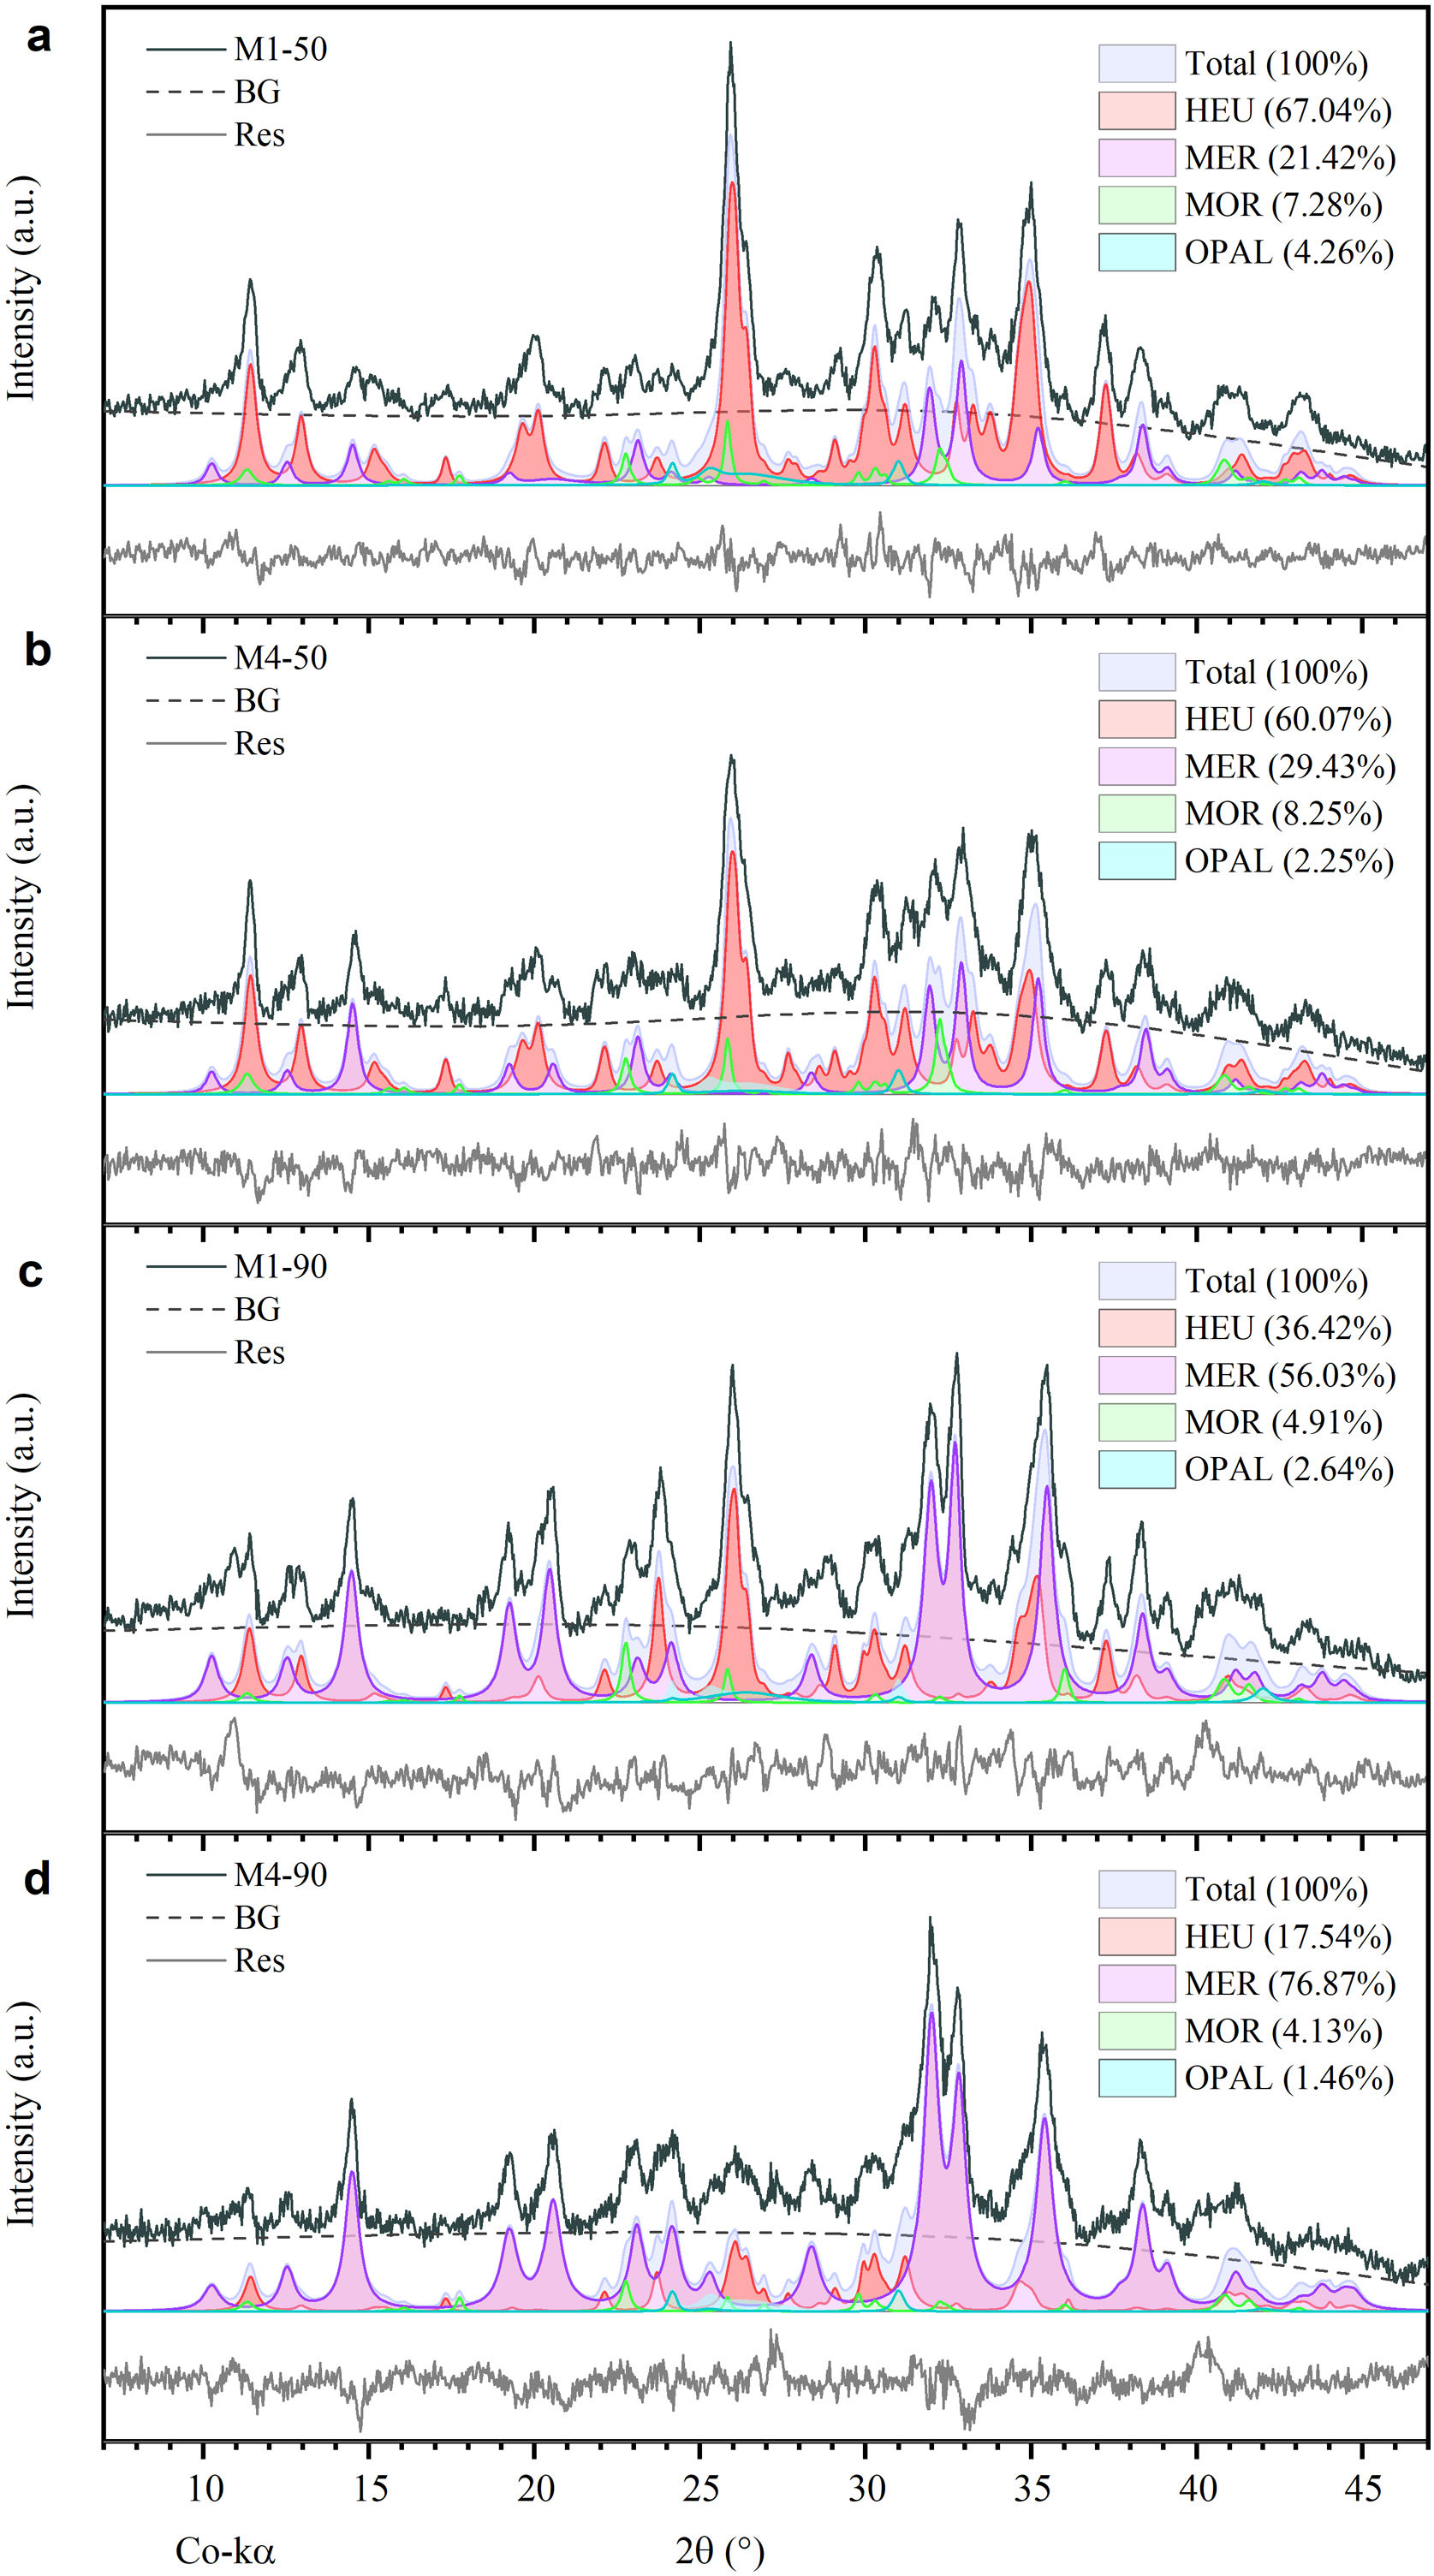
On the other hand, Fig. 3b–e shows the presence of some peaks corresponding to MER zeolite, as well as the progressive decrease of peaks associated with opal and the crystalline phases HEU and MOR after 50 and 90h of reaction. These results indicate a degradation of the mineral phases of the natural zeolite, attributable to exposure to a highly alkaline environment. Moreover, the mass fraction (wt%) of each phase present after each treatment was determined semi-quantitatively. The findings demonstrate that the most substantial conversion of natural zeolite to MER zeolite occurred after 90h of reaction, yielding 76.87wt% with the M4 mixture and 60.07wt% with the M1 mixture (Fig. 4c and d). These results exhibit notable improvement over the 50-h treatments, where the MER conversion rates were 21.42wt% for M1 and 29.43wt% for M4 (see Fig. 4a and b).
Morphology and composition in the recrystallized samples through experimental pattern deconvolution.")
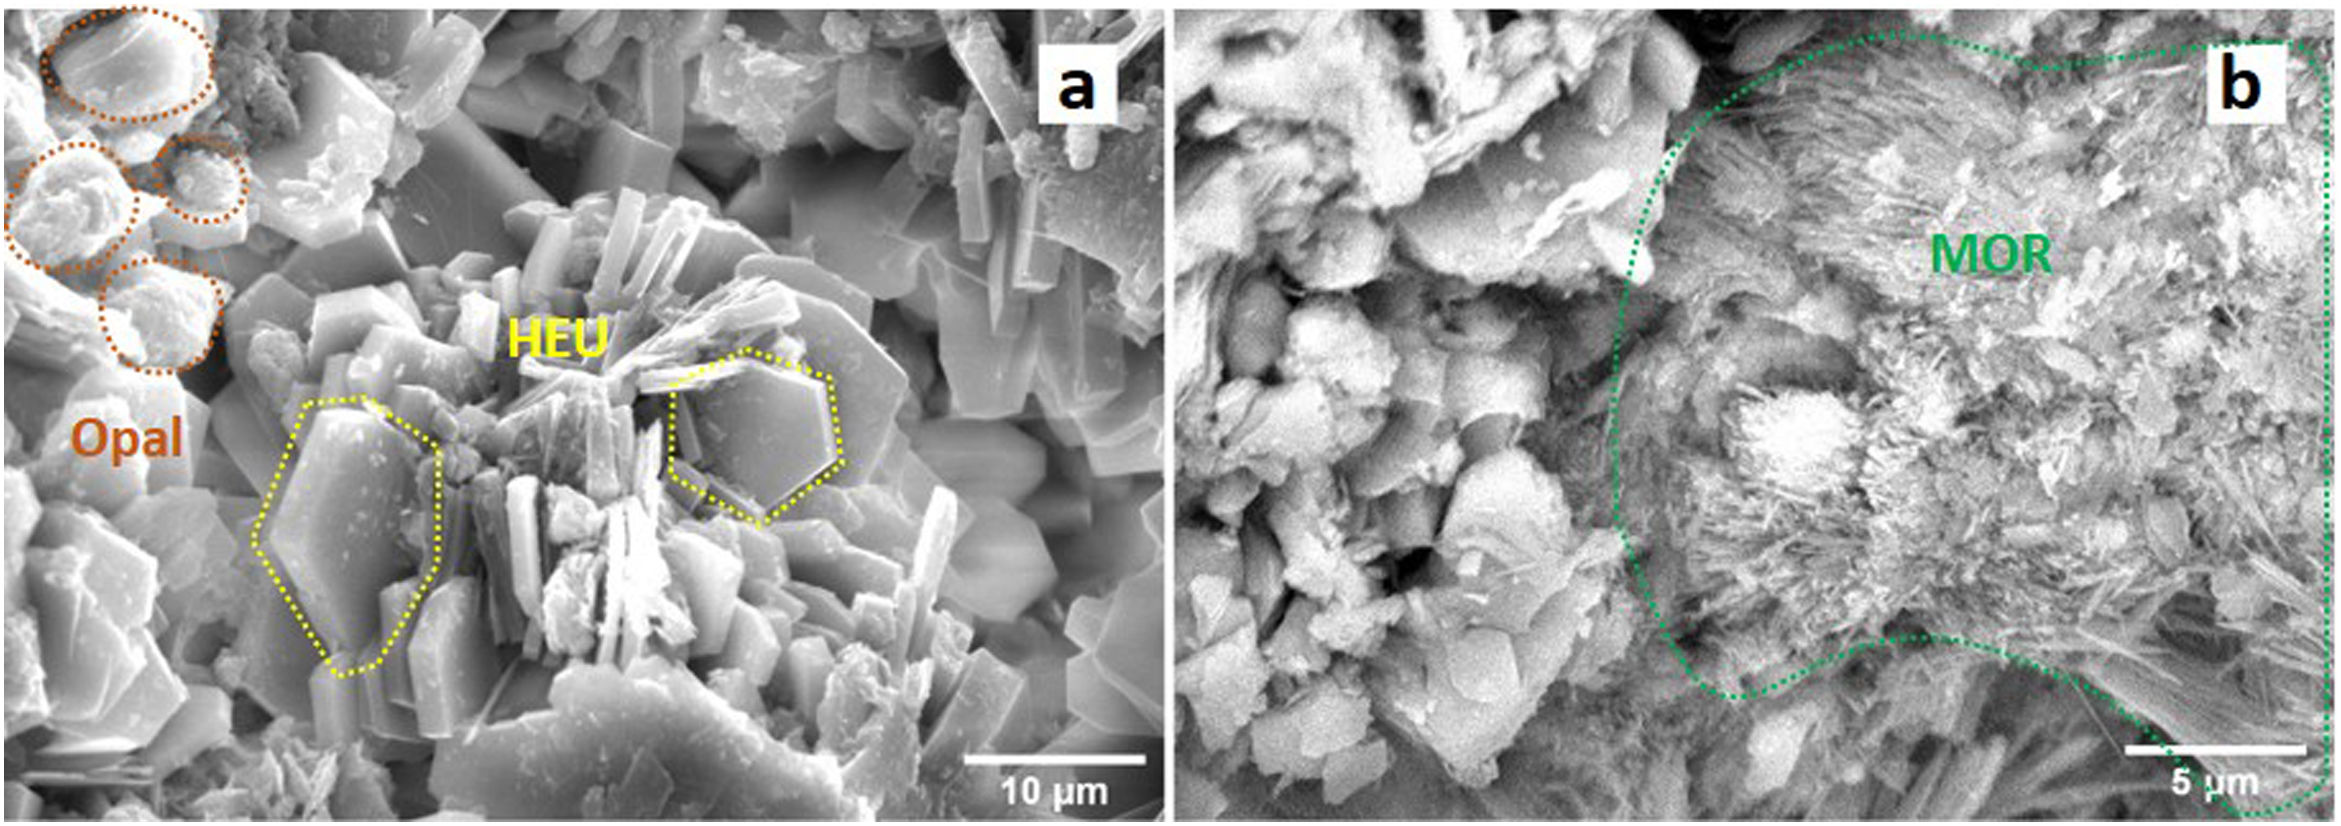
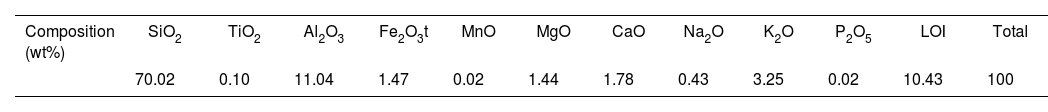
In accordance with the images obtained by SEM (Fig. 5a), clinoptilolite crystals exhibit a distinct tabular plate-like shape, which is a characteristic feature of well-developed crystal habits [29]. The diameter and thickness of observable crystals range between 2.5–12 and 0.5–2.5μm, respectively. Additionally, clusters of thin fibers, typical of mordenite morphology, are observed (Fig. 5b) [29] with an approximate thickness of ∼0.05μm. Furthermore, in Fig. 5a, the existence of spherulitic formations composed of opal-CT or opal-CT/A [36,39] is observed, with sizes ranging from 1 to 5μm. These structures often develop as a result of high silica concentration in the environment [40], as evidenced in this natural zeolite according to the XRF data (Table 2). Based on this data, the chemical composition of natural zeolite predominantly comprises silica (SiO2) and aluminum (Al2O3) oxides, with an estimated Si/Al molar ratio of 5.38. Natural clinoptilolites exhibit composition ranges varying from 66.7% to 71.45% by weight of SiO2, along with an Al2O3 content ranging from 11.48% to 13.9% by weight [41–44]. In addition to these main components, other elements typical of natural zeolites were detected, such as potassium (K), calcium (Ca), iron (Fe), magnesium (Mg), and sodium (Na), with K and Ca being the predominant compensating structural cations in this sample.
 clinoptilolite (HEU), opal and (B) mordenite (MOR) crystals.")
Additionally, Fig. 6 shows scanning electron microscopy (SEM) images of the zeolites synthesized from the M1 and M4 mixtures, showcasing variations in reaction times of 50 and 90h.
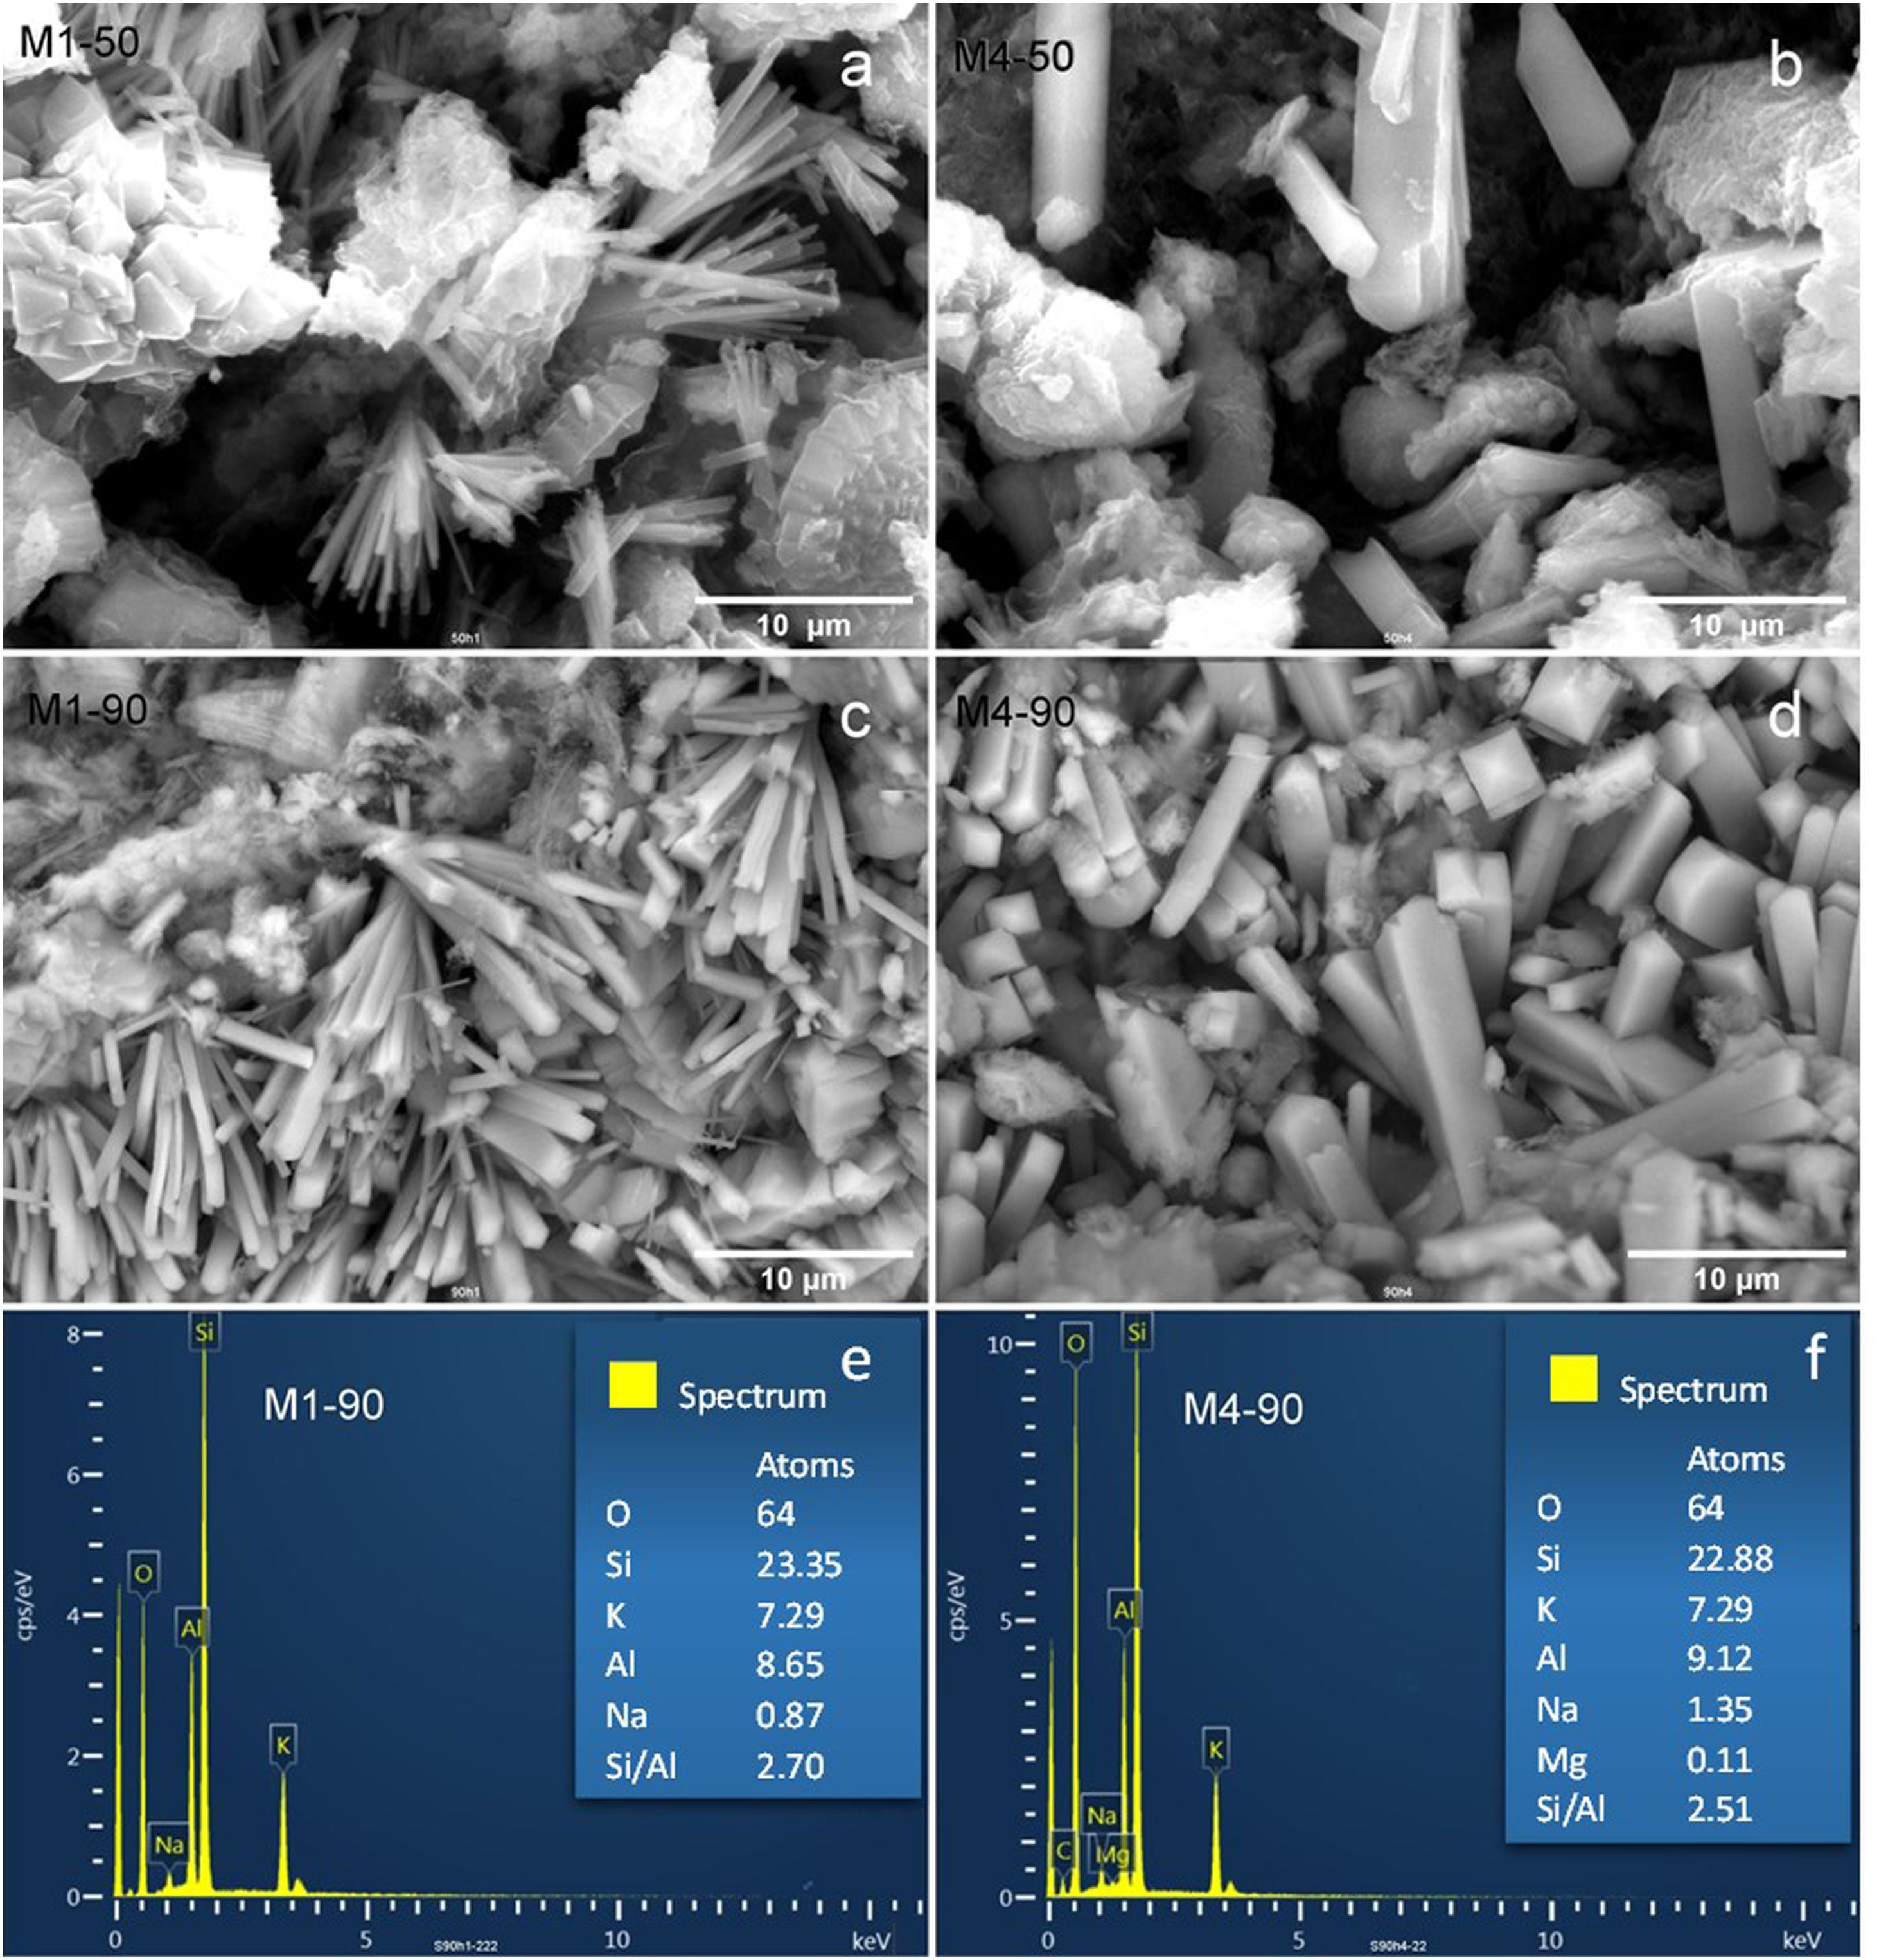
 M1-50, (b) M4-50, (c) M1-90, and (d) M4-90. EDX analysis of (e) M1-90 and (f) M4-90.")
When the M1 mixture with a 50-h reaction time is employed, it is observed that the zeolite MER crystals exhibit a needle-like prismatic morphology, organizing into bouquet-like structures with a thickness of less than 1μm (Fig. 6a). This morphology is common and has been previously documented in other studies [14,15,45,46]. The main difference when extending the reaction time to 90h is an increase in the quantity and size of crystals, which can reach up to 2μm in diameter (Fig. 6b).
Furthermore, when utilizing the precursor mixture M4, there is an increase in the concentration of reactants compared to M1. Fig. 6c and d depicts SEM images of zeolites synthesized from the M4 mixture with reaction times of 50 and 90h. For 50h of reaction with M4, some larger prismatic crystals are observed compared to those obtained from M1. In the case of 90h of reaction using M4, there is an increase in the crystal population, with some reaching a thickness of up to 5μm in diameter.
Based on the aforementioned observations, it can be concluded that reaction time tends to increase the crystal population, while an increase in reactant concentration results in larger crystals.
Subsequently, in Fig. 6e and f, the microanalysis results obtained through energy-dispersive X-ray spectroscopy (EDX) on MER crystals obtained from the M1 and M4 mixtures after a 90-h reaction are presented. The tabulated data reflect the number of atoms per unit cell, with the oxygen content in zeolite MER used as the reference. It is observed that the crystal composition is similar in both samples, with potassium being the predominant compensating structural cation. Furthermore, it is noteworthy that the Si/Al molar ratio falls within the range of 2.51–2.70, indicating the aluminum-rich nature of the merlinoite structure compared to the starting natural zeolite, which has a higher Si/Al ratio (5.38).
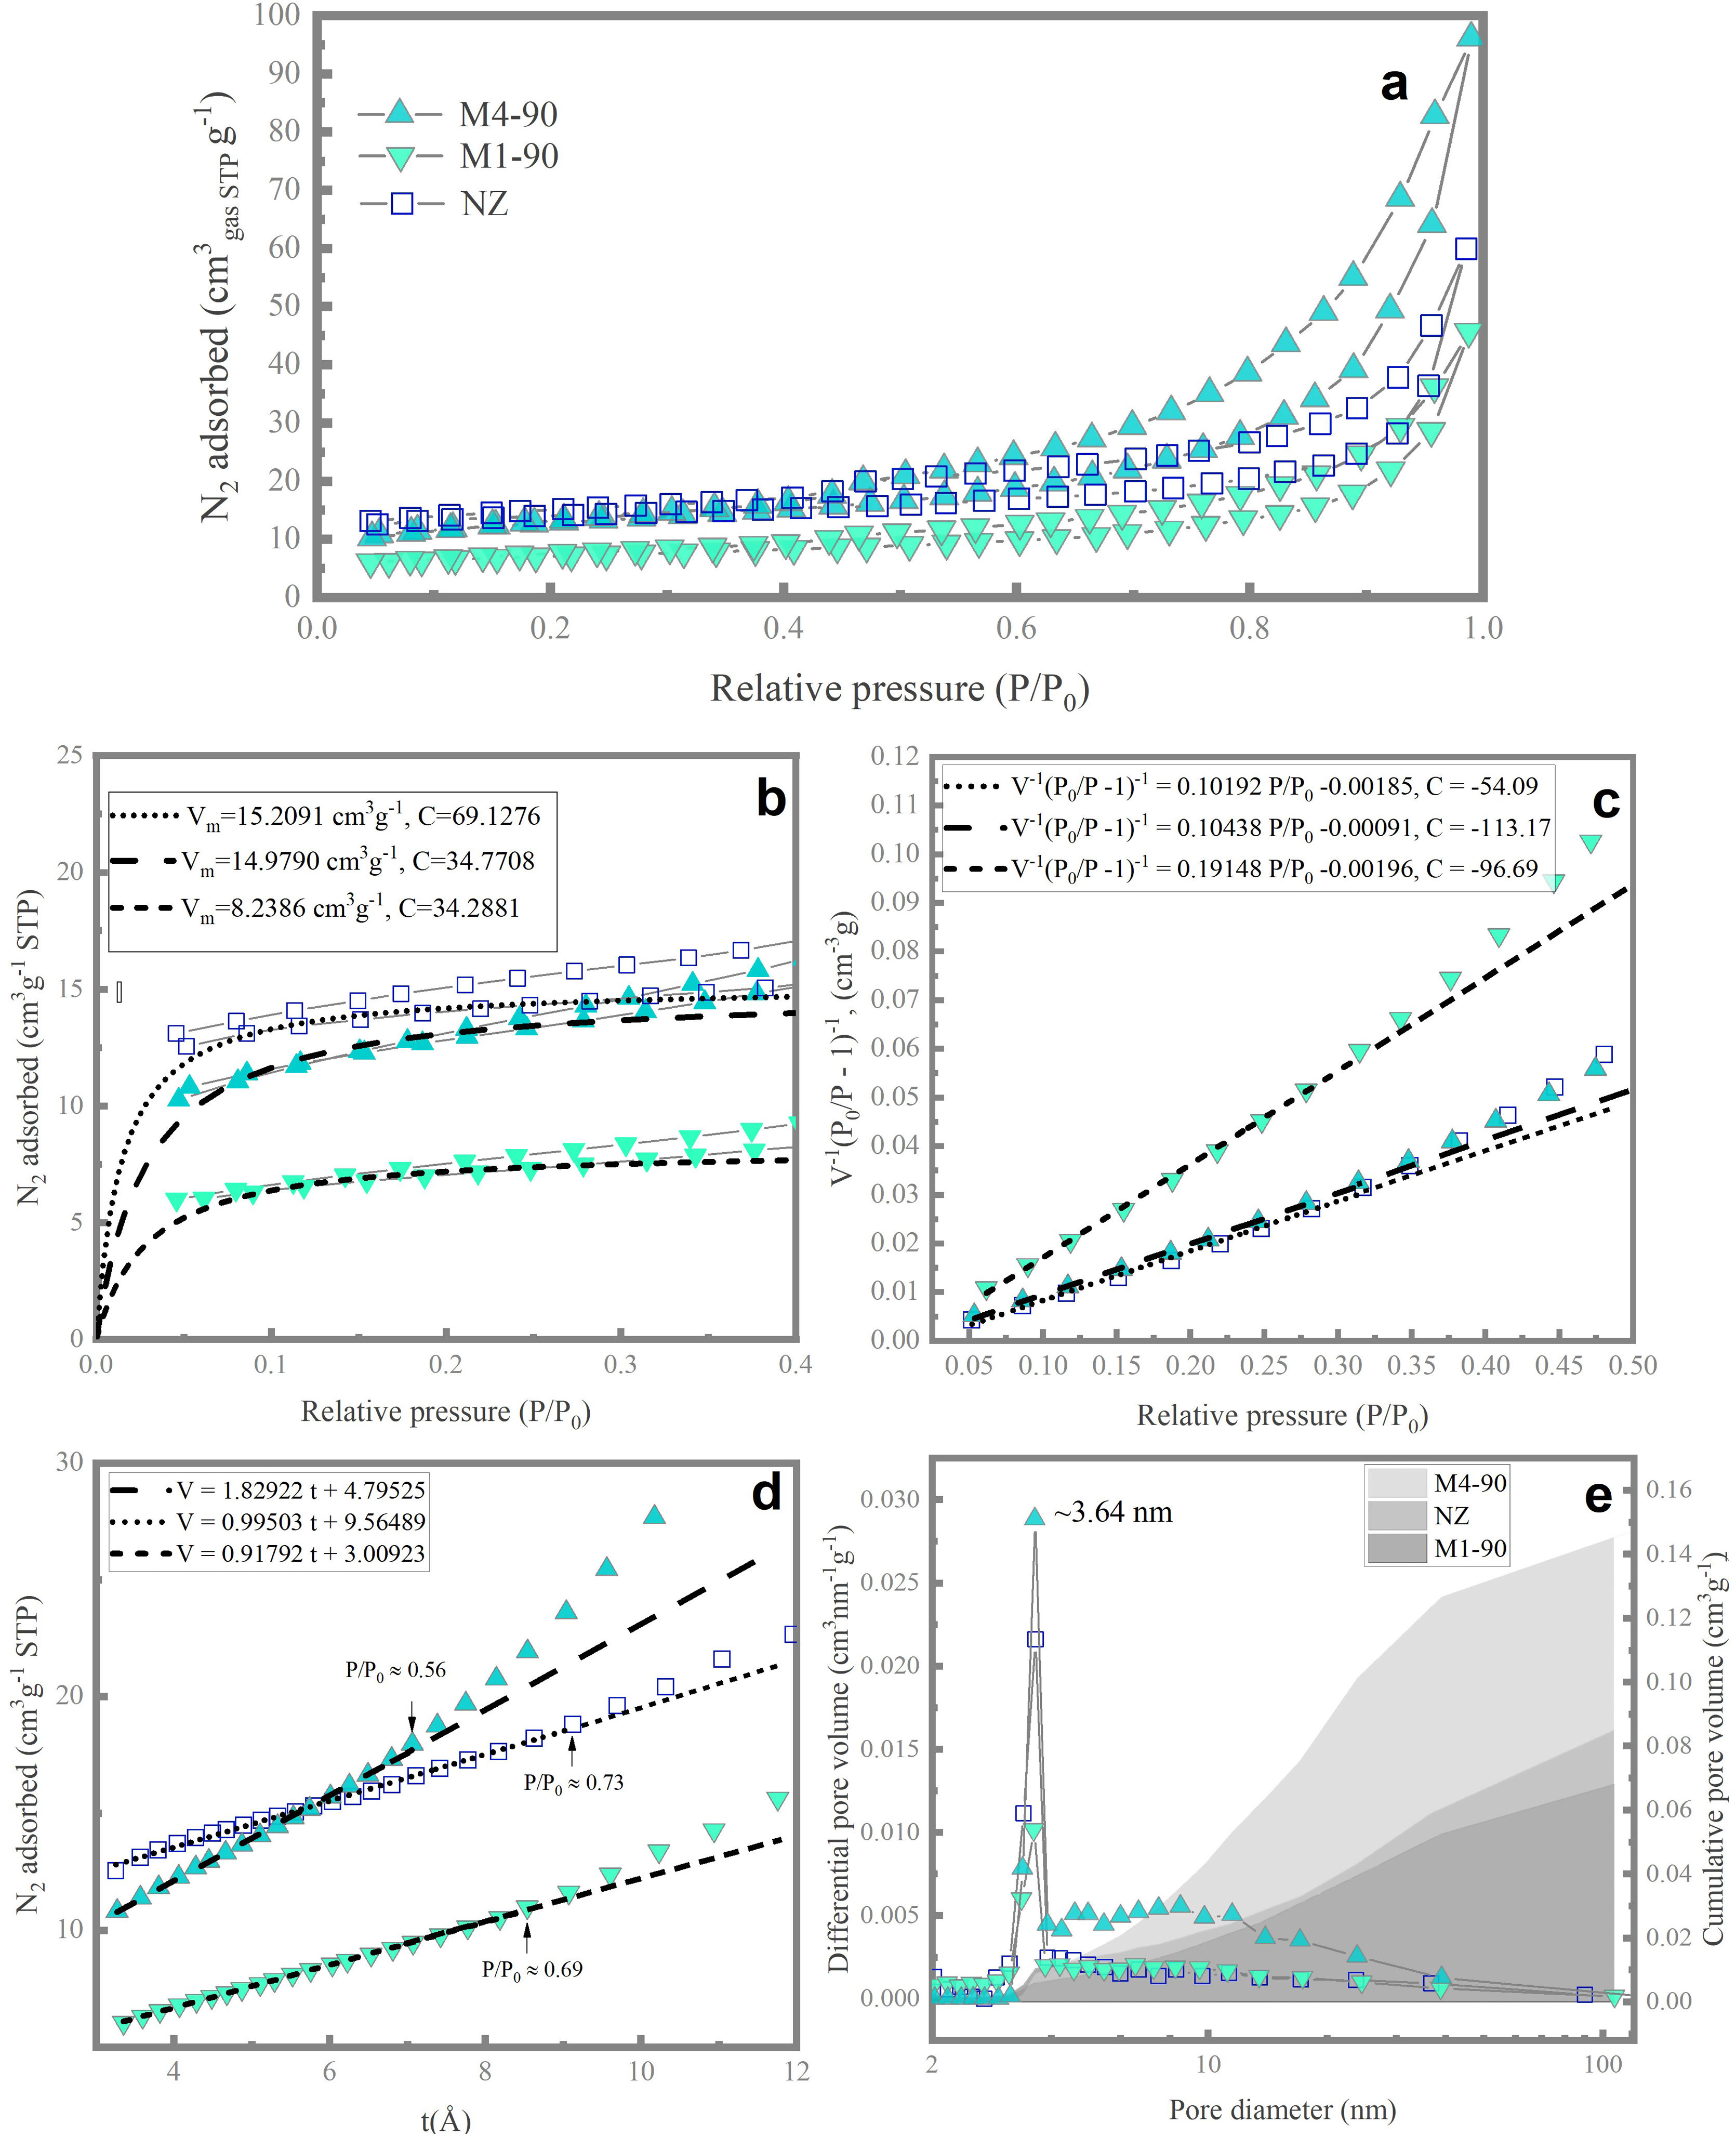
Pore space propertiesThe nitrogen adsorption/desorption isotherms at 77K for the NZ, M1-90, and M4-90 samples (Fig. 7a) exhibit a profile that combines features of Type-I and Type-II isotherms, as per the classification by the International Union of Pure and Applied Chemistry (IUPAC) [47]. Initially, the isotherms are concave toward the P/P0 axis, indicative of microporous materials (Type I). In the P/P0 region between 0.35 and 1, they display characteristics of Type-II isotherms, typical of macroporous or non-porous adsorbents, where unrestricted multilayer adsorption or capillary condensation can occur at high relative pressures.
 Nitrogen isotherms at 77K of samples NZ, M1-90 and M4-90 and study of their textural properties using (b) Langmuir equation, (c) BET equation, (d) t-method and (e) BJH pore size distribution.")
The isotherms of all three samples exhibit a hysteresis loop combining features of Type H3 and Type H4 [47]. The H3 hysteresis cycle suggests the presence of aggregated plate-like particles, giving rise to slit-shaped pores, while Type H4 is associated with narrow pores of this shape [48]. This phenomenon has been observed in amorphous aluminosilicates [49], natural zeolites [50], and synthetic zeolites [51]. The shape of the hysteresis cycle in the experimental isotherms indicates the presence of amorphous material, forming aggregated particles that create intercrystalline spaces acting as mesopores and macropores, resulting in nitrogen condensation.
The Langmuir theory was employed to determine the Langmuir equivalent surface area (SL) [52], expressed in square meters per gram of adsorbent (m2g−1), which is associated with microporous materials. Experimental adsorption data in the P/P0 range of 0.04–0.032 were analyzed. Using the Langmuir equation, the monolayer volume (Vm) and the constant C associated with the adsorption energy were calculated (Fig. 6b). The Langmuir equivalent surface area (SL) was calculated from the value of Vm[53]. It is important to note that the interpretation of the Langmuir surface area is more related to the experimental saturation capacity than to the wall area of the micropores [48]. According to the results (Table 3), NZ exhibits a higher surface area of 66.24m2g−1, which is comparable to M4-90 (65.22m2g−1). In comparison, M4-90 demonstrates a greater micropore volume than M1-90, indicating superior crystallization.
Textural parameters of the parent material (NZ) and the synthesized zeolites M1-90 and M4-90.
| Surface area (m2g−1) | Pore volume (cm3g−1×10⁻³) | |||||
|---|---|---|---|---|---|---|
| Sample | SL | SBET | Smeso | Smicro | VBJH | VT |
| NZ | 66.24 | 43.50 | 15.39 | 28.11 | 84.78 | 92.69 |
| M1-90 | 35.87 | 22.97 | 14.20 | 8.77 | 67.95 | 70.63 |
| M4-90 | 65.22 | 41.95 | 28.29 | 13.77 | 145.11 | 148.87 |
The BET equation [54] was employed to estimate the BET equivalent surface area (SBET) [48], which is related to the physical adsorption of monolayers in mesopores and the filling of micropores. Data conforming to the linear form of the BET equation were found in the P/P0 range between 0.4 and 0.32 (Fig. 7c). For this dataset, the parameters of the BET equation, including the BET adsorption constant and the volume of adsorbed monolayer, were determined, from which SBET was calculated [53]. The data indicate that NZ exhibits the highest surface area (43.50m2g−1), followed by M4-90 and M1-90 with 41.95 and 22.97m2g−1, respectively. It is noteworthy that SBET surpasses SL, primarily due to the limited physical significance of the surface area concept derived from the Langmuir equation [48].
The method-t[55] was employed to calculate the total mesopore area (Smeso). Utilizing the Harkins and Jura equation [56], the thickness of the adsorbed nitrogen multilayer, t, was determined as a function of P/P0 (Fig. 7d). The y-intercept and slope of the volume of nitrogen adsorbed vs. t graph were obtained from points exhibiting linear behavior. Values of Smeso, obtained from the de Boer equation, and slope values [55], are presented in Table 3. The micropore area was calculated using the relationship Smicro=SBET−Sext[30]. The results indicate an increase in the mesopore area in M4-90 compared to M1-90 and NZ. Furthermore, the M4-90 sample exhibits a microporous area of 13.77m2g−1, surpassing that of M1-90. These findings support the formation of a greater quantity of mesoporous material and suggest a higher presence of micropores in the new structure of zeolite MER in the M4-90 sample, indicating a higher degree of crystallinity.
The BJH model [57] was utilized to calculate the pore volume distribution curves over a range of 2–100nm (Fig. 7e). All samples exhibit a sharp peak at ∼3.64nm, with this peak being more pronounced in M4-90. Additionally, M4-90 displays a broad mound in the range of 4–40nm, indicating a prevalence of medium-sized mesopores. In the same figure, the cumulative pore volume plot reflects that the total volume of meso-macropores (VBJH) varies with reactant concentration and alkalinity of the medium. In M4-90, the VBJH was calculated to be 145.11×10⁻³ cubic centimeters per gram of adsorbent (cm3g−1), surpassing the value for M1-90 (Table 3). In all samples, meso–macropores are attributed to agglomerations of amorphous material. Although the BJH model is primarily employed to describe cylindrical geometries, it provides a lower bound for the size of irregular slit-shaped mesopores [58].
Finally, the total pore volume (VT) was determined based on the equivalent volume of adsorbed liquid nitrogen at a relative pressure P/P0=0.99 [48]. The results confirm that the M4-90 sample has a higher total pore volume due to the increased presence of meso–macropores, which significantly contributes to this augmentation.
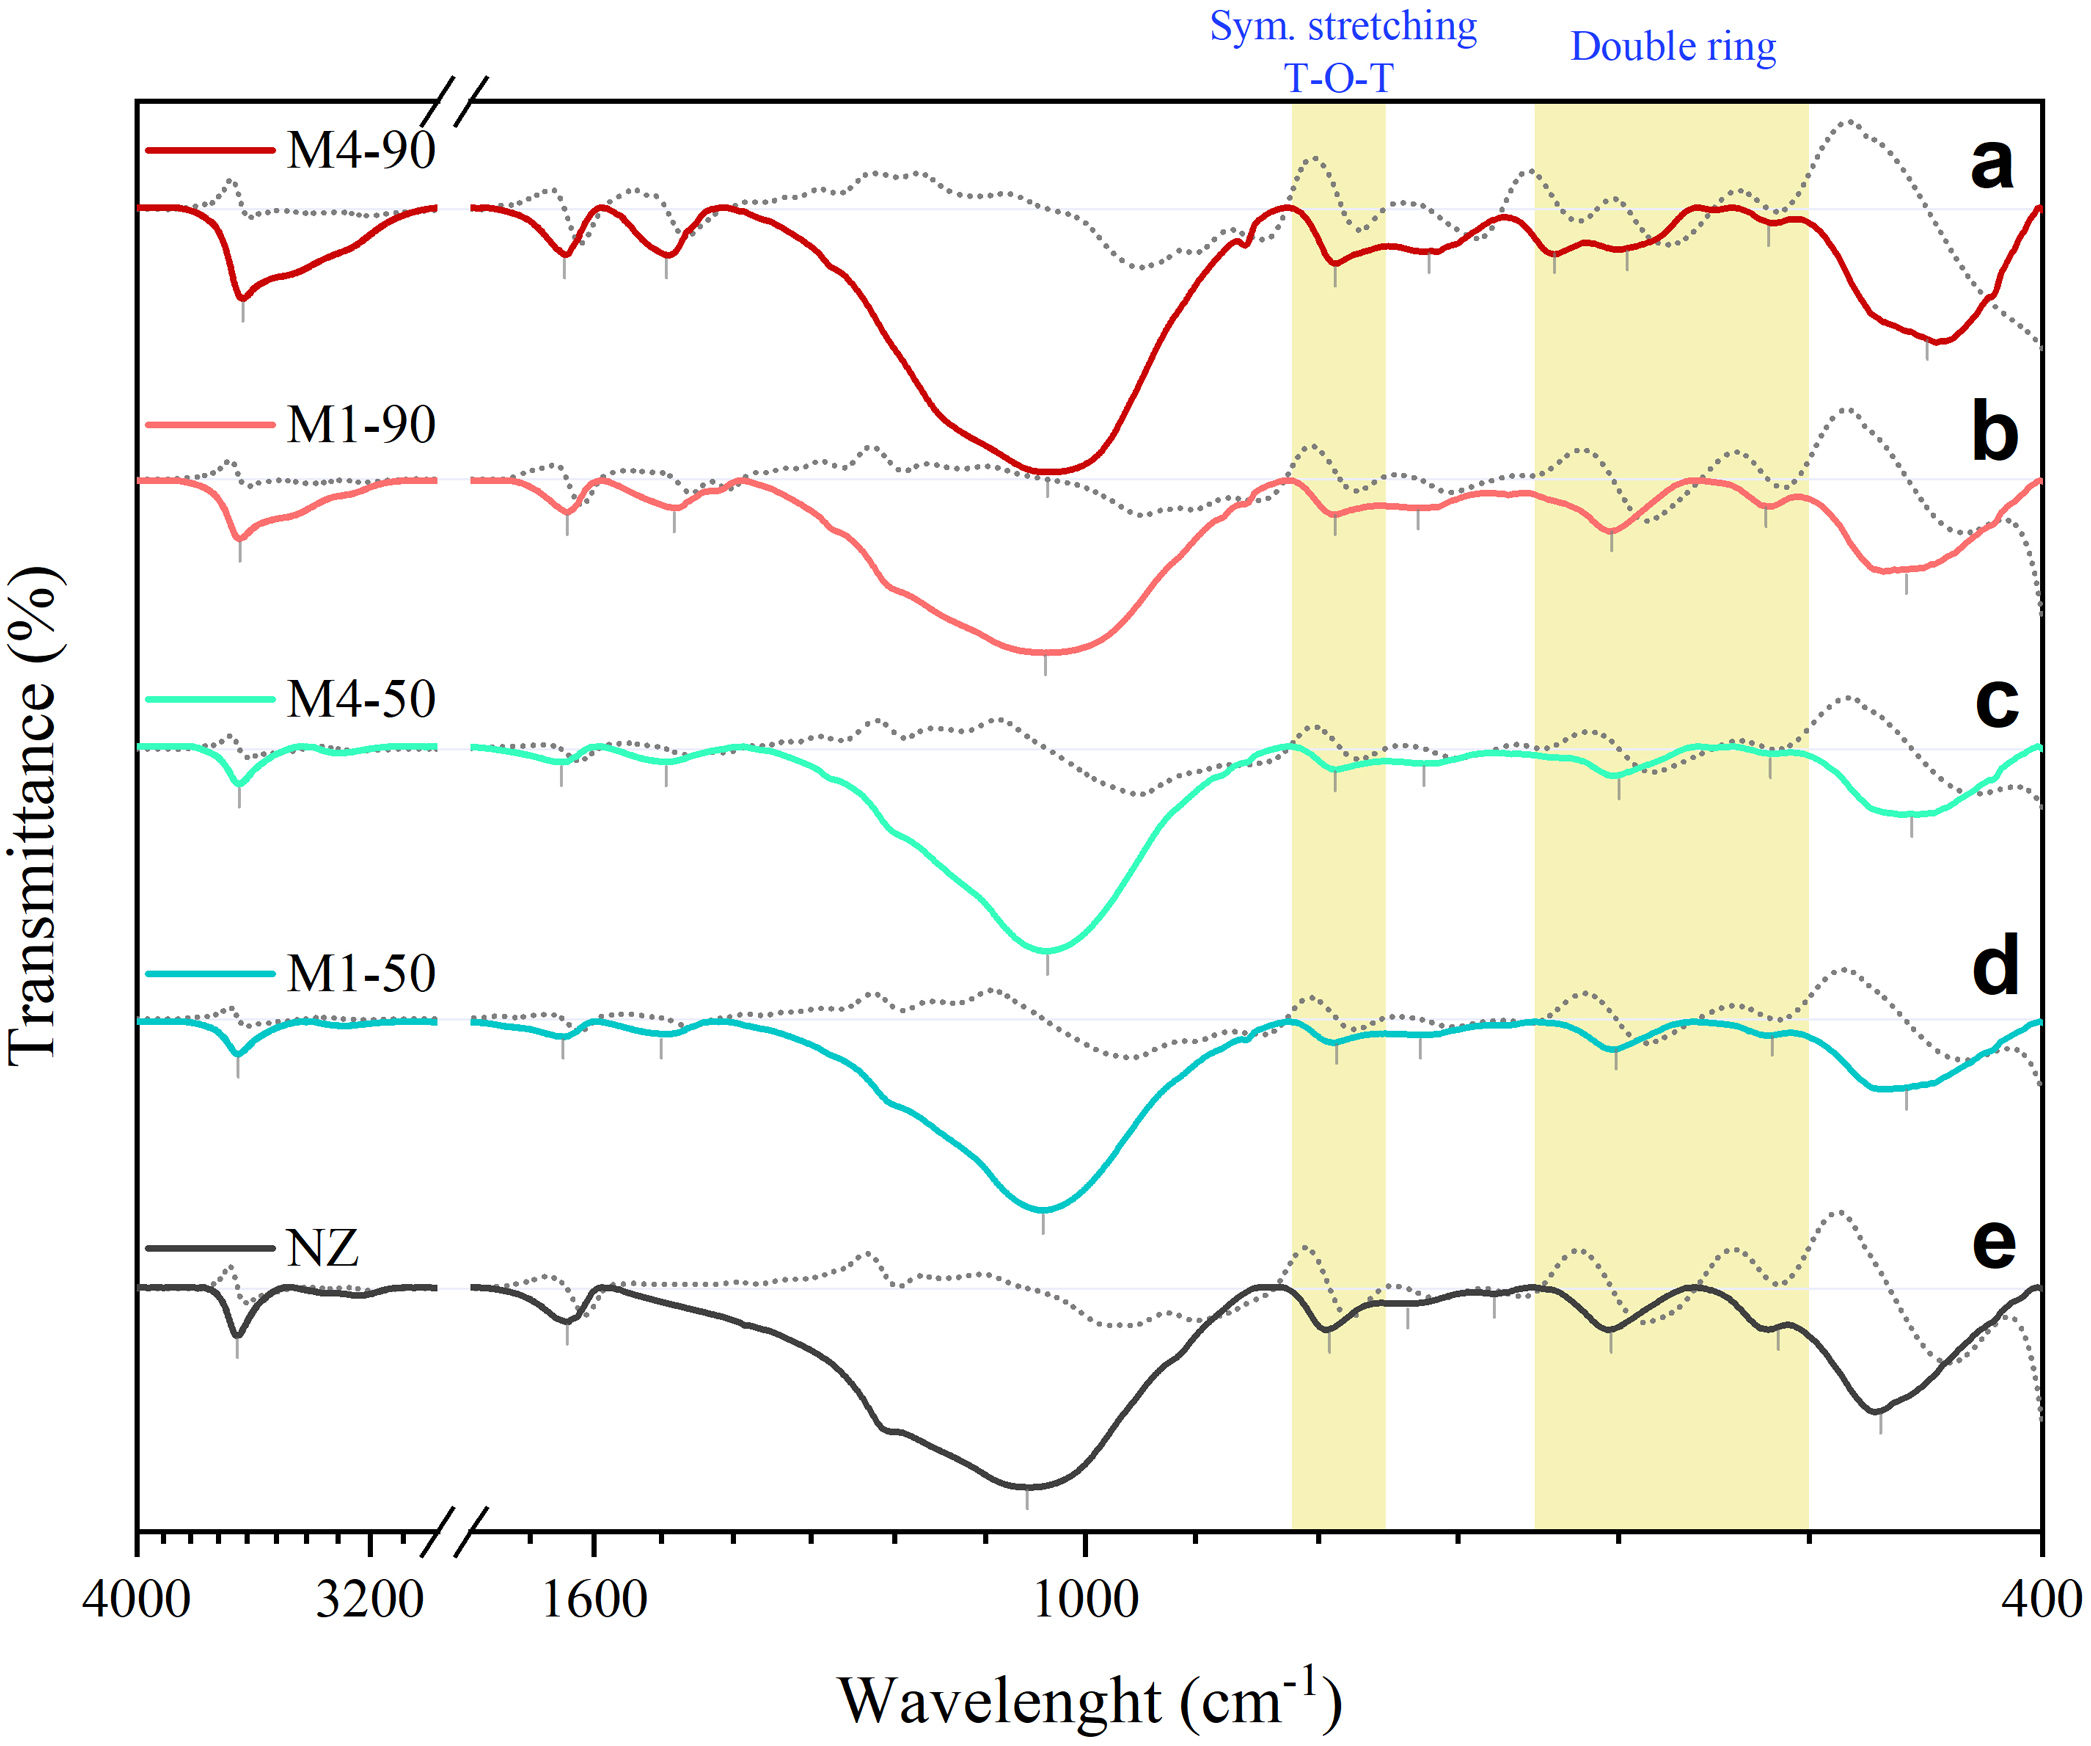
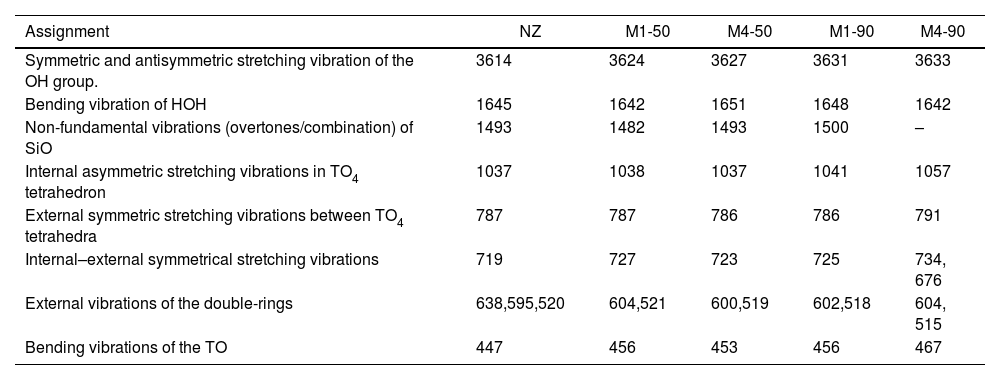
FTIR vibrational spectraFig. 8 shows the FTIR spectra of the NZ samples together with the samples obtained with the interzeolitic conversion process. Their first derivatives were calculated for the identification of the vibrational peaks. The interpretation of these peaks was based on wavenumber (cm−1). A summary of the assignments and positions of the vibrational peaks is given in Table 4.
 and the samples obtained from the conversion process with their corresponding first derivative spectra (gray dashed line). The peaks and shoulders have been marked with a vertical bar. The yellow stripes represent the vibrations of the TO4 tetrahedron external bonds that are characteristic of each zeolite.")
FTIR transmittance spectra of natural zeolite (NZ) and the samples obtained from the conversion process with their corresponding first derivative spectra (gray dashed line). The peaks and shoulders have been marked with a vertical bar. The yellow stripes represent the vibrations of the TO4 tetrahedron external bonds that are characteristic of each zeolite.
Summary of the position of vibrational peaks (wavenumber in cm−1) and their respective assignments in the FTIR spectra of the synthesized zeolites and the precursor zeolite NZ.
| Assignment | NZ | M1-50 | M4-50 | M1-90 | M4-90 |
|---|---|---|---|---|---|
| Symmetric and antisymmetric stretching vibration of the OH group. | 3614 | 3624 | 3627 | 3631 | 3633 |
| Bending vibration of HOH | 1645 | 1642 | 1651 | 1648 | 1642 |
| Non-fundamental vibrations (overtones/combination) of SiO | 1493 | 1482 | 1493 | 1500 | – |
| Internal asymmetric stretching vibrations in TO4 tetrahedron | 1037 | 1038 | 1037 | 1041 | 1057 |
| External symmetric stretching vibrations between TO4 tetrahedra | 787 | 787 | 786 | 786 | 791 |
| Internal–external symmetrical stretching vibrations | 719 | 727 | 723 | 725 | 734, 676 |
| External vibrations of the double-rings | 638,595,520 | 604,521 | 600,519 | 602,518 | 604, 515 |
| Bending vibrations of the TO | 447 | 456 | 453 | 456 | 467 |
Firstly, in the broad region of 3800–3100cm−1, infrared vibrational spectra are typically associated with the presence of adsorbed water and the stretching vibration of hydroxyl (OH) groups linked to the surface, which constitute silanol SiOH groups. The amplitude of this region is directly related to the quantity and diversity of these groups [59,60]. In the experimental infrared spectra shown in Fig. 8, a significant increase in the amplitude of this band is observed when extending the reaction times from 50 to 90h, indicating the formation of silanol SiOH groups. The presence of these groups suggests an enhancement in the surface reactivity of the synthesized samples.
The band around 1630–1640cm−1 is typically associated with the deformation vibrations of water molecules [59]. Both in the NZ sample and in the samples obtained through the conversion process, a shift of this band toward higher wavenumbers is observed.
In the range of 1600–1400cm−1, an infrared spectrum is found to be associated with non-fundamental vibrational frequencies (overtones/combinations) of the SiO bond. These spectra have been previously observed in silica minerals with three-dimensional structures, such as quartz [61,62], and in amorphous silicates [63]. The presence of this vibrational peak is observed exclusively in the synthesized samples, with a center in the range of 1482–1500cm−1.
In the 1300–400cm−1 region, infrared spectra of zeolites are generally divided into two distinct categories of vibrations [64]. The first is related to the internal vibrations of the TO4 tetrahedron, present in all zeolite structures. Assigned infrared bands include asymmetric stretching (1250–920cm−1), symmetric stretching (720–650cm−1), and bending of the TO bond (500–420cm−1). The second category corresponds to the external vibrations of the bonds between tetrahedra, which are sensitive to the type of framework, the presence of structural polyhedra, and double rings. Assigned bands include asymmetric stretching (1150–1050cm−1), symmetric stretching (820–750cm−1), and double-ring vibrations (650–500cm−1).
In this case, the studied samples exhibit a broad and prominent band centered in the range of 1037–1057cm−1, which is common in all zeolites and is related to the internal asymmetric vibrations of tetrahedra. It has been observed that a shift of this band to higher wavenumbers indicates a higher Si/Al ratio in the structure [65]. This is reflected in the NZ sample, which has a higher Si/Al ratio than the synthesized samples and exhibits this vibrational band at a higher wavenumber.
The bands of weak intensity in the range of 791–787cm−1 correspond to symmetric vibrational stretching of the external structural bonds between tetrahedra. These bands are characteristic of MER-type, MOR-type and HEU-type zeolites. It is important to note that the position of these bands may shift toward lower wavenumbers as the amount of Al in the structure increases. For example, in the case of heulandites and clinoptilolites, the band positioned at 800cm−1 can experience changes in its position or even disappear when the structural composition varies [66].
The bands of very weak intensity observed between 737 and 676cm−1 may be due to the overlap of usually weak internal and external symmetric stretching bands that occur between 720 and 750cm−1. Next, there are bands related to the vibrations of double rings. In the NZ sample, a medium-intensity band is observed around 604cm−1, and a weak shoulder near 515cm−1, attributed to the double 4-rings, which are the periodic building units of HEU and MOR zeolites. In the recrystallized samples, zeolite MER is present, composed of double rings of 4 and 8 units. Except for M4-90, all samples exhibit a medium-intensity band centered around ∼602cm−1. In contrast, the M4-90 sample shows two peaks, one at 595cm−1 and another at 638cm−1. This latter peak is characteristic of zeolite MER and is used as a reference to distinguish it from PHI, which has a similar structure [67].
Finally, a bending vibration band centered at 467cm−1 for NZ and between 456–447cm−1 for the rest of the samples is observed. This strongly intense band is related to the internal bending vibrations of the TO bond and appears to respond to the Si/Al composition of each zeolite.
In summary, the FTIR spectra of the analyzed samples reveal similarities both in the region of external vibrations and throughout the spectrum. These similarities are partially explained by the common structure shared by MER, MOR and HEU zeolites, composed of 4 and 8-membered rings. In addition, the overall profile of the spectra is comparable due to the interzeolitic conversion process of the MER zeolite from a natural zeolite of HEU and MOR type.
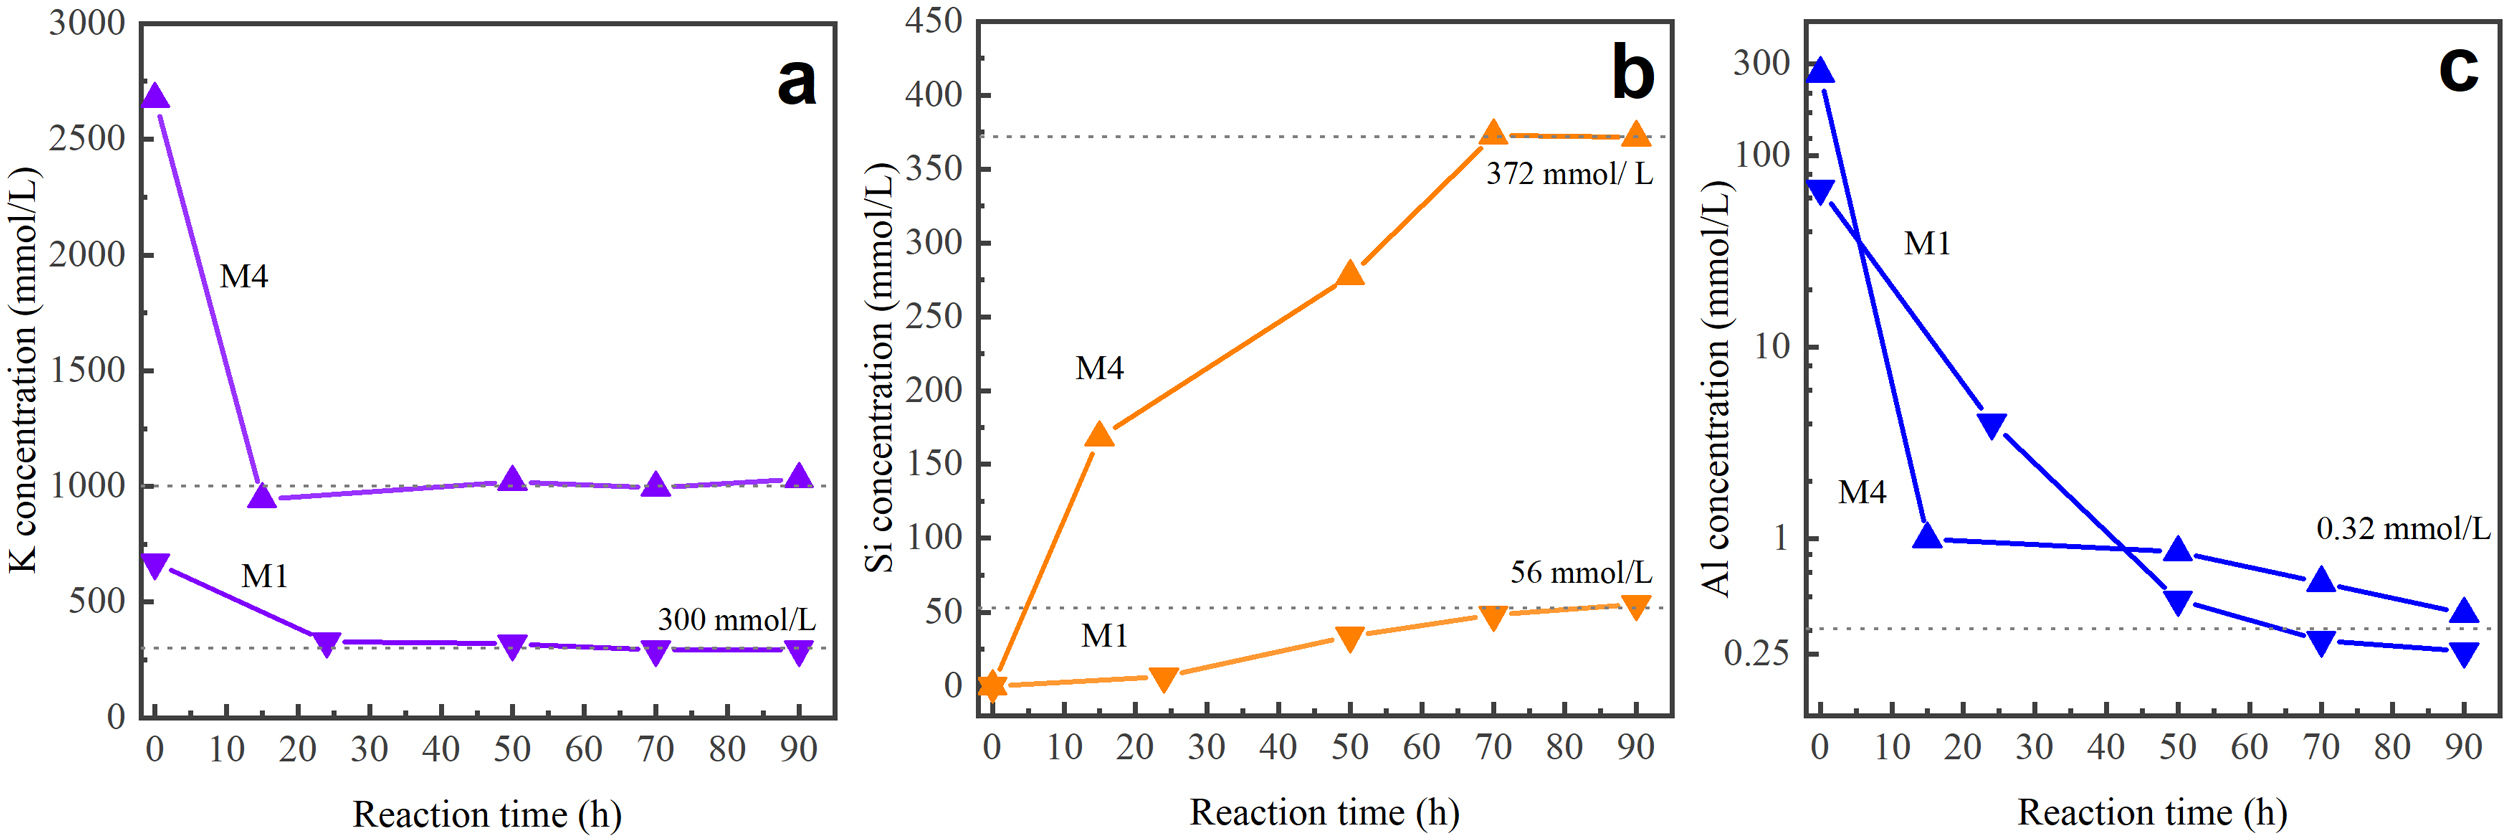
Species in solution in liquid product post-synthesisThe analysis of the concentration of aqueous silicon (Si), aluminum (Al), and potassium (K) in the liquid products after synthesis was performed using the ICP-OES technique. These solutions were obtained from the precursor mixtures M1 and M4 after reaction times ranging from 15 to 90h. Research indicates that during the synthesis stage, due to the action of OH ions, aluminum remains in the ionic form Al(OH)4−. Regarding silicon, it can be found as silicic acid Si(OH)4, anionic species such as Si(OH)3O−, Si(OH)2O2−2, Si(OH)O3−3, or other more complex forms may form [68,69].
Fig. 9 presents the concentration (mmol/L) of the elements K, Si, and Al for different reaction times (h). According to the graph, in both cases, initially dissolved potassium from KOH undergoes a sharp decrease within the first 24h of the reaction. After this period, it remains at a relatively stable level. On the other hand, silicon, originating from the mineral, is affected by the action of the OH− ion, which dissolves silicon-containing components, leading to the formation of various species. As observed in Fig. 9, with the M1 mixture, the concentration of silicon in the solution increases and stabilizes after 70h of reaction. This is similar to what happens with M4, where the final concentration of silicon is approximately 6.6 times higher than when M1 is used. Regarding aluminum, initially present in both the mother solution and the zeolite mineral, its concentration decreases in both cases, ultimately approaching zero after 90h of reaction. This phenomenon can be attributed to the higher aluminum content within the structure of the final product obtained, the MER zeolite.
Interzeolitic conversion mechanism of natural zeolite into MER at different reaction times: (a) potassium, (b) silicon, and (c) aluminum.")
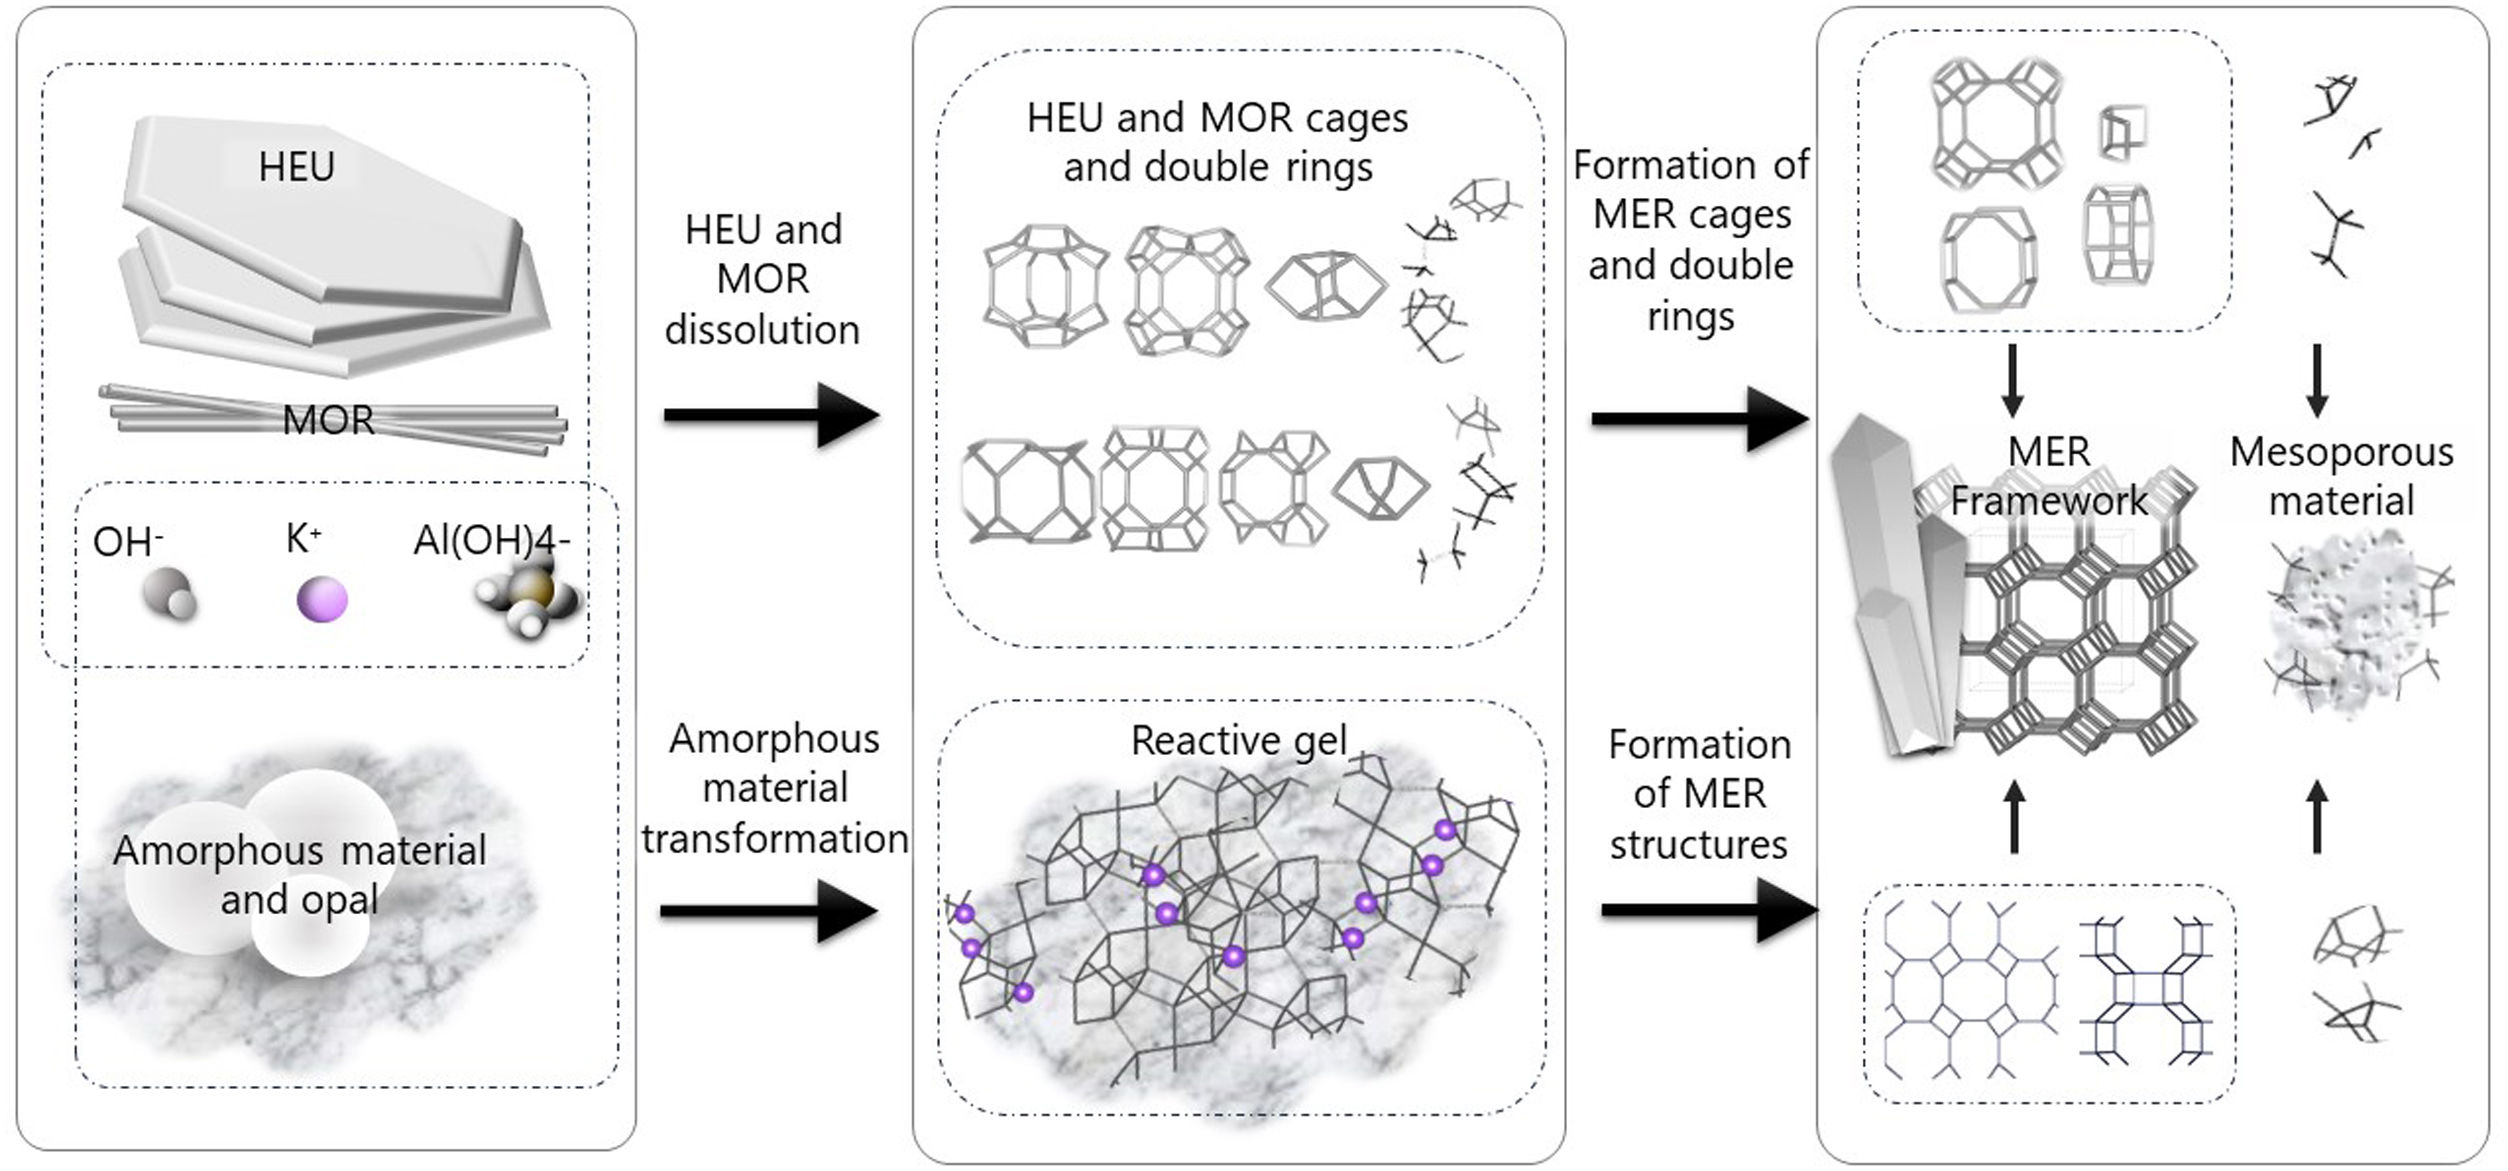
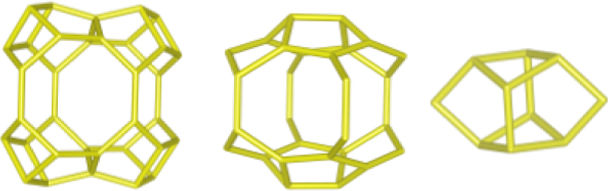
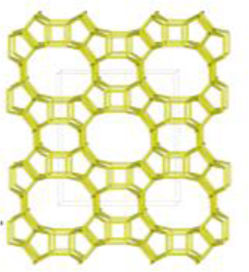
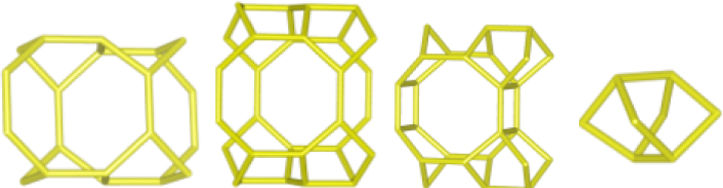
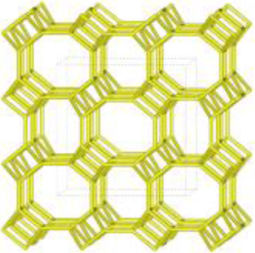
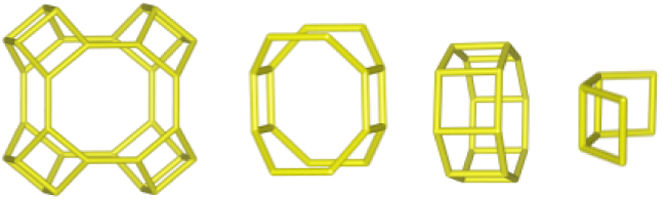
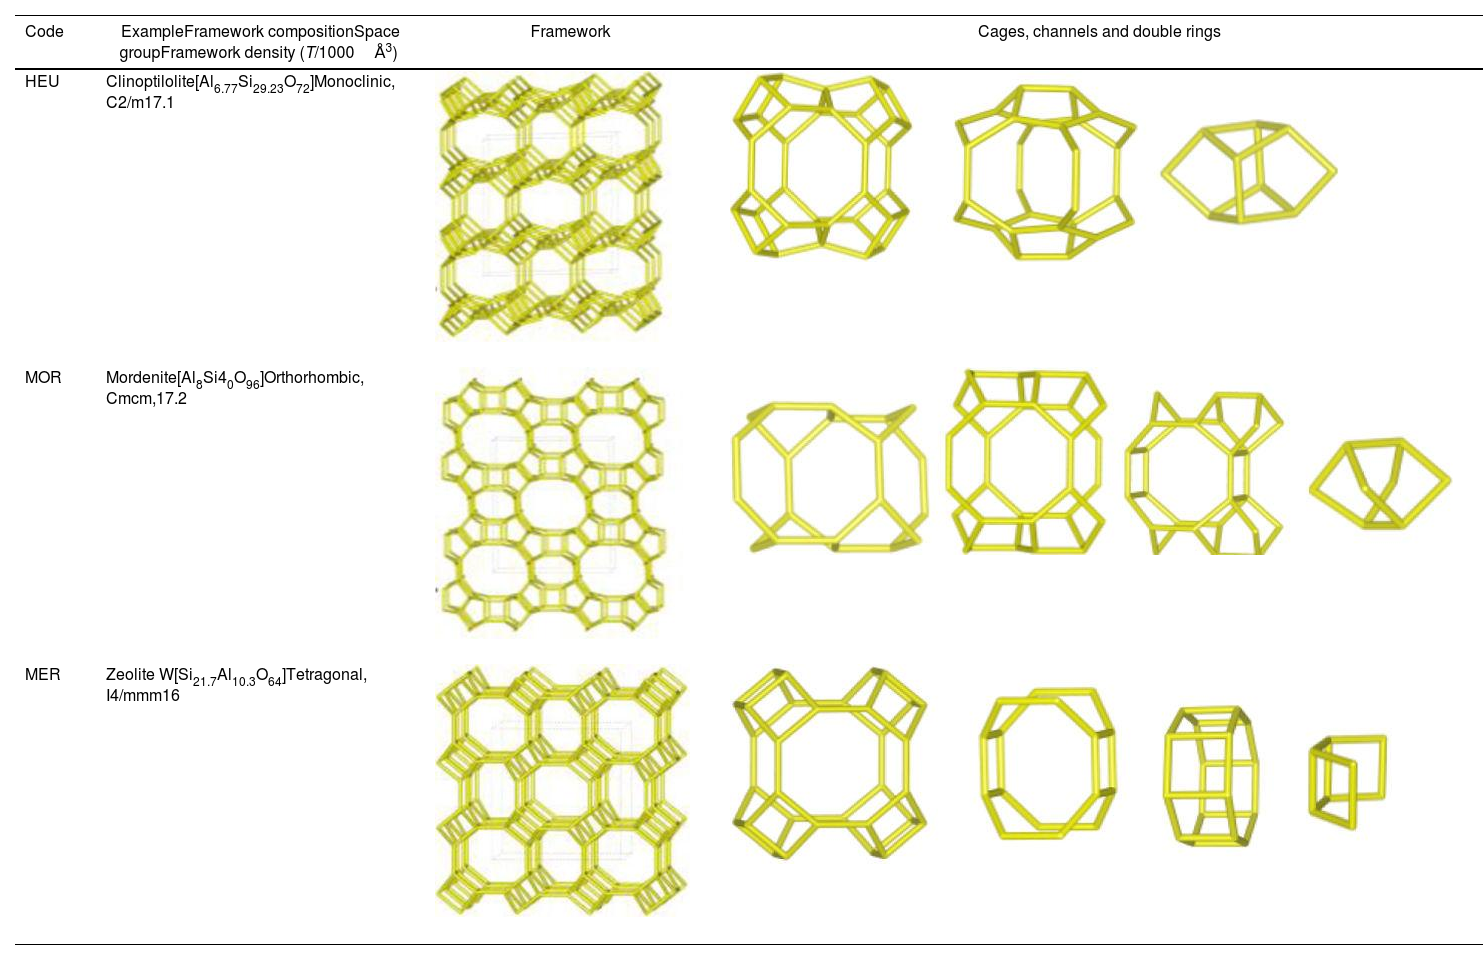
Despite differences in framework composition, space group, and framework density among HEU, MOR, and MER zeolites, structural similarities are evident in their channels and cages formed by their intersections. Table 5 illustrates the channels and types of cages present in HEU, MOR, and MER zeolites, which are primarily constituted by the intersection of 8-member ring channels with 8-, 10-, or 12-member ring channels. These structural resemblances, coupled with the analyses conducted on both solid and liquid products, enable speculation regarding the interzeolitic conversion process described in this study (see Fig. 10).


Given that certain components of the reactive mixture initially exist in a solid state, a preconditioning process of the solid material becomes imperative [70], facilitating the formation of the reactive gel and the subsequent building blocks or polyhedra that constitute the MER zeolite.
Initially, we propose that the formation of the reactive gel initiates through a series of steps involving the amorphization, dissolution, and rearrangement of aluminum and silicon structures originating from both opal and amorphous material. This decomposition process is facilitated by the presence of hydroxide ions (OH−). During this stage, silicates and aluminates dissolve and undergo rearrangement in conjunction with ions present in solution (K+ and Al(OH)4−) to generate a reactive gel, serving as the precursor from which new zeolite crystals will grow.
Similar to the behavior observed with amorphous matter, the dissolution of HEU zeolite crystals takes place within a highly alkaline environment, albeit at a slower rate, as evidenced by XRD results (Fig. 3). We hypothesize that the crystalline structure of HEU and MOR zeolites, which shares similarities with MER zeolite, may undergo transformation into the MER type when dissolving in a potassium alkaline medium.
Eventually, the ordered polygonal structures such as rings and polyhedral structures like cages, as well as larger ordered structures derived from the reactive gel and natural HEU and MOR zeolite crystals, undergo condensation to form the nuclei of MER zeolite. Subsequently, these nuclei, transitioning into small crystals, gradually increase in size owing to the progressive dissolution of both the reactive gel and the parent zeolite crystals, which serve as reservoirs of reactants. Nonetheless, as evidenced by the elemental analysis of solution components (Fig. 9a), aluminum in solution may become a limiting reagent after an extended reaction period. This limitation impedes the condensation of silica into crystalline structures, resulting in the formation of amorphous mesoporous material.
ConclusionsIn this study, the recrystallization of zeolite merlinoite (MER) from a natural zeolite composed of clinoptilolite (HEU), mordenite (MOR), and opal phases was achieved. The raw natural zeolite was characterized by having a high concentration of silica. Recrystallization was carried out in a highly alkaline environment using KOH and aluminum, with natural zeolite powder serving as a silicon source. Experiments were conducted at different temperatures and reaction times, varying the initial concentration of reactants, which affected the total amount of water present in the precursor mixtures.
XRD results indicated that the crystallization of MER zeolite is favored by prolonged reaction times rather than high initial concentrations of reactants. It was also observed that reaction time increases the population of crystals, and that crystals formed in environments with high concentrations tend to be larger in size. The study of textural properties revealed that the volume and area corresponding to micropores increase when high initial concentrations of reactants are used, and more mesopores are formed under these conditions.
Through FTIR analysis, vibrational similarities were identified between the precursor material and the conversion product, especially in the bands of symmetric stretching and the vibrations of double rings. These structural similarities suggest that they may favor the process of reconverting HEU and MOR zeolites into a MER-type zeolite. Overall, these results provide a detailed understanding of the recrystallization process of MER zeolite from a natural zeolite and suggest the influence of factors such as reaction time and reactant concentration on the formation and properties of the resulting crystals.
FundingThe authors express their deepest gratitude to the Consejo Nacional de Humanidades, Ciencias y Tecnologías (CONAHCyT) for the financial support provided through project CF2019-39216, and for the assistance offered through the doctoral scholarships 2021-000001-01NACF-09298 andÒ021-000001-01NACF-07936.
The authors express their deepest gratitude to the Consejo Nacional de Humanidades, Ciencias y Tecnologías (CONAHCyT) for the financial support provided through project CF2019-39216, and for the assistance offered through the doctoral scholarships 2021-000001-01NACF-09298 andÒ021-000001-01NACF-07936. We also extend our thanks to the technical team of the LFRX at the National Laboratory of Geochemistry and Mineralogy of the Institute of Geology, Universidad Nacional Autónoma de México (UNAM).

