


Superficial cracks are one of the common defects in the manufacturing of traditional ceramic tiles. Such defects do not only damage the appearance of the product, but also affect their mechanical behavior. Understanding the correlation between superficial cracks and deflection is key for the traditional ceramic tile industry. However, the related bibliography is very rare, and its importance is systematically ignored during design and manufacturing. In this work, we investigate the impact of the location and size of superficial cracks over the deflection of traditional ceramic tiles. A technique based on FEA (finite element analysis) is validated through experimental data and used to undertake a statistical, parametric research. The study shows that location and depth of the defect have an exponential cross-correlation over deflection and could be characterized together through a single surface. On the contrary, the width and sharpening of the defect barely interfere.
Las grietas superficiales son uno de los defectos más comunes en la fabricación de baldosas cerámicas tradicionales. Estos defectos no solo perjudican la apariencia del producto, sino que también afectan a su comportamiento mecánico. Entender la correlación entre las grietas superficiales y la deflexión es clave para la industria de las baldosas cerámicas tradicionales. Sin embargo, la bibliografía relacionada es muy escasa, y su importancia se ignora sistemáticamente durante el diseño y la fabricación. En este trabajo, investigamos el impacto de la localización y el tamaño de las grietas superficiales sobre la deflexión de las baldosas cerámicas tradicionales. Se valida una técnica basada en el análisis de elementos finitos (AEF) mediante datos experimentales y se utiliza para realizar una investigación estadística y paramétrica. El estudio muestra que la localización y la profundidad del defecto tienen una correlación cruzada exponencial sobre la deflexión y podrían caracterizarse conjuntamente a través de una única superficie. Por el contrario, la anchura y la agudeza del defecto apenas interfieren.
Ceramic materials are essentially constituted by a glassy matrix in which particles of gas are confined and various crystalline phases (quartz, feldspar, mullite, etc.) are embedded. They demonstrate excellent mechanical properties (flexural strength, fracture toughness) with a clear dependence of these properties on porosity and phase composition [1–4]. However, they are brittle materials too, which could break abruptly under unexpected circumstances. Taking aside the geometry of a given ceramic product and its particular material properties, the presence of critical flaws (cracks, bumps, depressions, pinholes, dirt, drops and color or texture defects) anywhere in the ceramic volume is the main cause of failure.
In the case of advanced ceramics, the study of the critical flaws has essentially focused in understanding and improving the statistical approach initially made by Weibull [5–14], detect and correct the presence the flaws through its chemical formulation.
In the case of traditional ceramics, most efforts have been led to detect and classify the superficial defects of the tiles by means of computer vision in order to design automatic tools of quality control [15–20]. A deep analysis of the superficial and volumetric cracks; and more important, the development of a correlation between the location and size of these cracks over the bending strength to prevent the catastrophic rupture of the parts remains pending. Actually, such an analysis in not easy to undertake with experimental means. On one side, it is nearly impossible to impose a set of defects, with a series of given locations and sizes, to a ceramic lot. On the other side, the bending strength is a destructive test. Thus, any critical defect responsible for the eventual rupture of the part could not been observed after its breakdown. Griffin and Irving principles could be used to calculate the intensivity factor (fracture toughness) of a pre-cracked ceramic sample, based on the applied stress and the shape of both sample and crack. However, the formulation is focused on the most disadvantageous case almost exclusively [21–23]. Thus, only one location of the crack is considered.
Fortunately, simulations could solve this problematic. As long as a simulation could prove to be reliable, an infinite number of simulated tests could be performed, evaluating as many crack locations and sizes as necessary, providing enough data to be statistically meaningful. Such techniques have been previously used in the study of advanced ceramics [24–27] with different purposes, but not in the field of traditional ceramics.
In this work, we investigate the impact of the location and size of superficial cracks over the mechanical behavior of traditional ceramic tiles in the 3-points bending test [28,29]. A technique based in FEA (finite element analysis) is validated through experimental data and used to undertake a statistical, parametric research.
The maximum deflection is selected as the control and analysis parameter instead of the bending strength. The bending strength is a characteristic strength, calculated after the break of the tile, and does not have any simple correlation with any of the stress results FEA could provide. However, the maximum deflection is a basic displacement which could easily be measured in both experimental and FEA environments.
Materials and methodsExperimental setup, material values and resultsA commercial lot of 80 extruded ceramic tiles of white porcelain was used in this research. All experimental specimens were inspected and only those with no visible defects were selected.
The chemical mixture was done by means of atomic absorption. Nominal dimensions of the tiles were 310mm×310mm×10mm in parallelepiped shape (geometric variables L, b and h respectively). The composition of the material was SiO2 51.0wt%; Al2O3 19.0wt%; CaO 7.0wt%; MgO 5.2wt%; K2O 3.7wt%; TiO2 0.7wt%; Fe2O3 0.5w.%; NaO2 0.4wt%; and chamotte 12.5%. Density was measured by immersion in mercury and fixed at the value of 2256kg/m3. The standard deviation of the density was 26kg/m3.
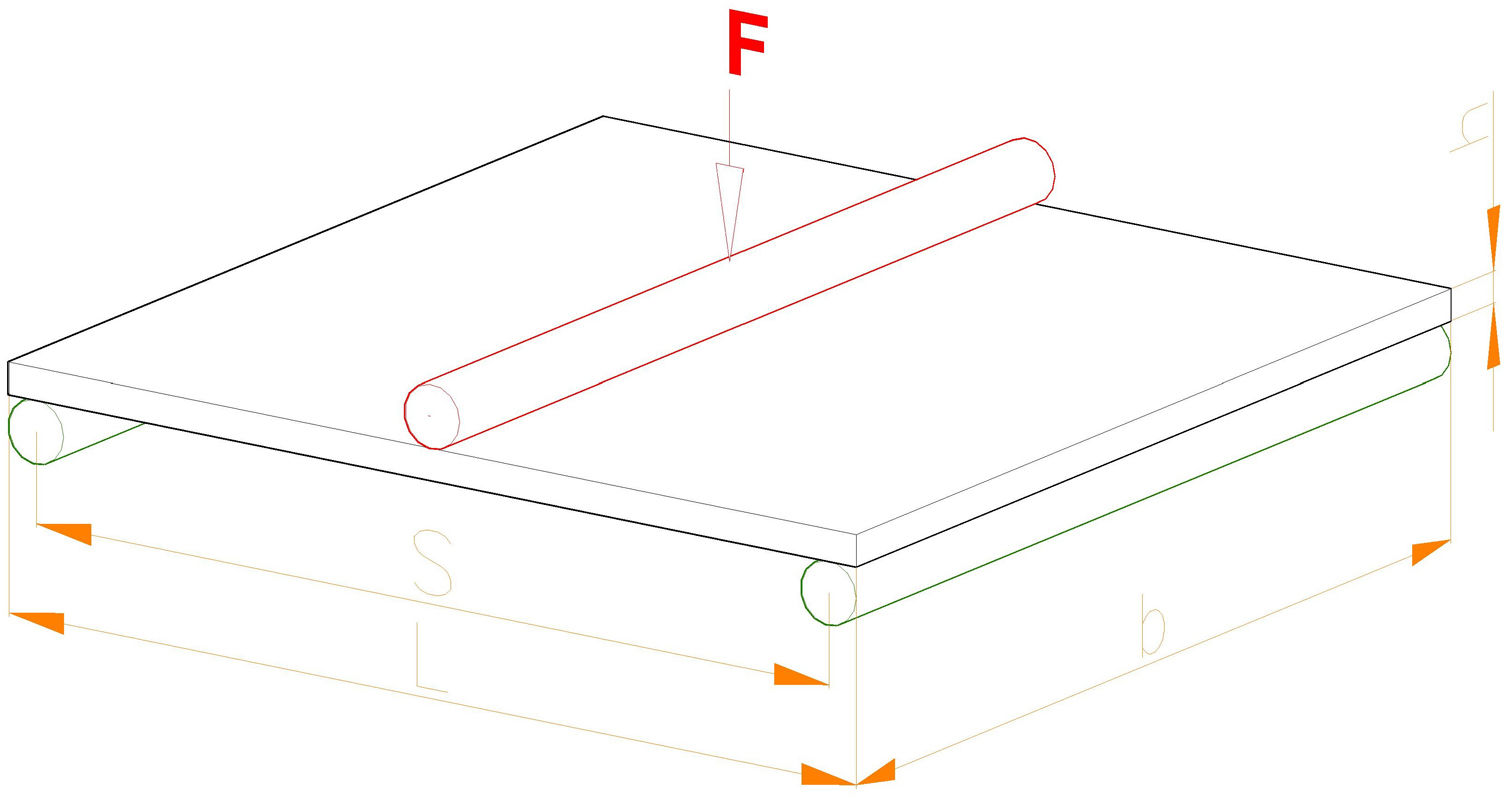
A universal testing machine model MEM-101/SDC (V1.1) equipped with a three-points bending device was used to perform the mechanical strength tests as specified by ISO 10545-4 [1,2]. The bending tests were conducted with the parts set on two support rods. The 80 parts of the lot were tested in its original shape, so sample size and the part size matched. This is recommended by the standard in the case of traditional ceramic tiles. The force was applied over the middle section of the tile, through a single upper rod, up to the fracture point. Fig. 1 represents the setup previously described.

The average velocity of the force application was 195N/s, and the average rate of strain was 1%/s (0.01mm/mms).
At the fracture moment, the applied force and the maximum deflection could be directly read from the display of the testing machine. The bending strength of the part could be calculated as shown by Eq. (1):
where σB is the bending strength, F is the fracture force, S is the distance between supports, and b and h are the width and height of the tile respectively.
On the other hand, the flexural modulus could be calculated as shown by Eq. (2):
where E is the flexural modulus, and F′ and y′ represent the applied force and the subsequent deflection of the tile along the first tram of the bending test, before breakage, where the behavior of the tile is still elastic, and the tilt of the force-deflection graph is constant. Finally, I is the moment of inertia of the transversal section on the tile and corresponds to value I=bh^3/12, due to pure flexion.
The coefficient of Poisson, which correlates longitudinal and shear deformation of materials, was directly taken from the bibliography and inferred from the composition of the tiles of the research [30–32]. The later validation of the FEA model proves that the selection was adequate.
Table 1 summarizes the material values and results of the experimental tests, considering the 80 parts of the lot. As indicated by Table 1, force and deflection values correspond to the ultimate applied force and the resulting measure of final deflection, which take place at the moment of fracture.
These values were used to feed the input variables required to run the FEA simulations and validate them.
FEA model and simulationsThe FEA model was built using Ansys Mechanical APDL 2021 R1 under the license of the Universitat Politècnica de València. The real setup was represented by a two-dimensional system to reduce in the number of elements and the complexity of the underlying equations, with the consequent save of computational resources and time. This is a feasible and very popular simplification in the simulation of the bending test of all kinds of materials, since all important stress and strain results take place along the transversal section of the part.
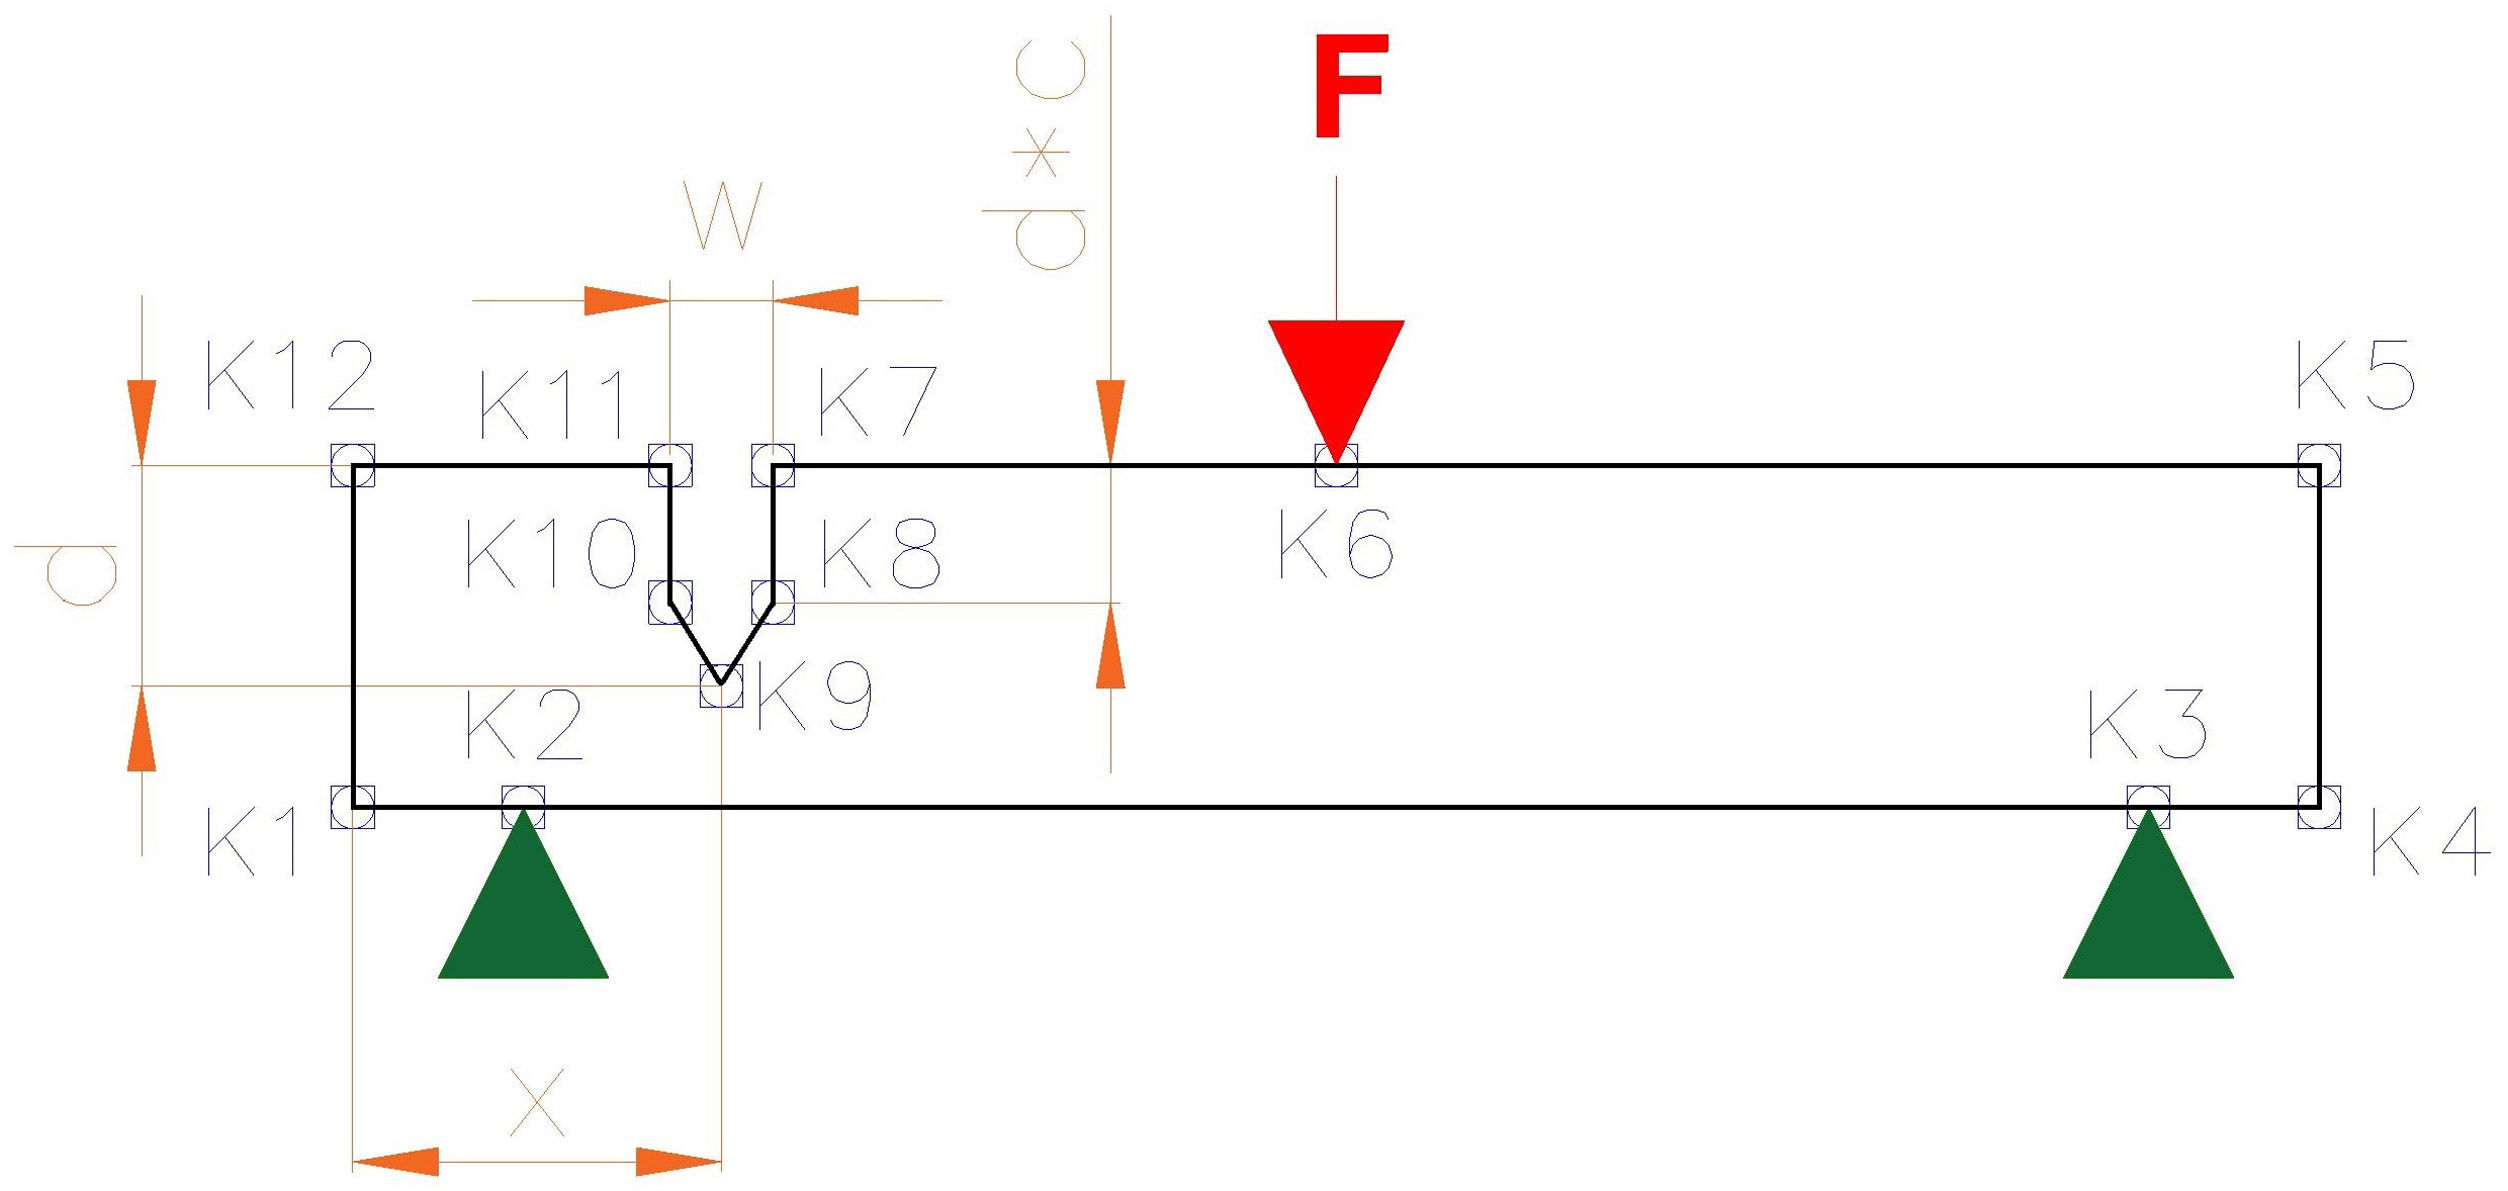
The geometry of the tile was built through several keypoints, as shown by Fig. 2. Keypoints K2 and K3 had their vertical displacement restricted to zero to simulate the supports. On the other side, keypoint K6 was loaded with the vertical, negative force that emulated the load used in the bending test.

A higher order, two-dimensional, triangular, 6-node element (nodes at each end- and mid-point) was selected. This element had quadratic displacement behavior and is well suited to model irregular meshes, such those necessary to model the defects. Plane stress-strain was activated, assuming that the relevant changes of the magnitudes of the tile took place in its transversal section. The mesh used to discretize the problem was free in all cases, fluctuating arbitrarily from one simulation test to the following, thus representing the different internal microstructure of every specimen. General element size was set to 2.00mm (element side). However, the mesh was refined for the top and bottom edges of the tile and the crack outlines (if any) with elements of sides 0.50 and 0.05mm respectively. The total number of elements was around 1600. Small variations took place depending on the geometry of each crack under study.
Three FEA models were built with the previous characteristics:
- •
FEA-1 used a non-defective tile geometry and so simulated the conditions of the experimental setup. Geometry, material properties, constraints and loads were copied from the real system. The aim of this first simulation was to validate the FEA model, comparing the maximum of experimental and simulated deflections. A total number of 80 tests were conducted under the previous premises, the same quantity as experimental tests.
- •
FEA-2 incorporated a superficial crack as shown by Fig. 2, which represents a tile in frontal projection, where the defect (out of scale) has been inserted. The x-coordinate of the center of the crack (x) changed along the width of the tile from 0 to 155mm (center). Due to the symmetry of the model, x coordinates beyond this middle point of the part could be omitted. The depth of the crack (d) varied from 0.5 to 5mm, whereas its width (w) varied from 0.2 to 1mm. The crack sharpening (c) was designed to represent the grinding of the crack bottom and varied from 0.2 to 1mm as well. The length of the crack matched the length of the part, to become a longitudinal crack. The superficial crack had the typical shape and size expected for these defects and extracted from literature [33–39]. The mesh was refined all around the outline of the imposed defect to gain accuracy of the results. In FEA-2 simulations, the parametric research was undertaken for a range of preestablished forces between 1200 and 2000N, overpassing all possible experimental values. These tests of varying force, focused on providing data for a comparison between experimental, non-defective and defective FEA models. A total number of 1125 tests were conducted under the previous premises.
- •
Finally, in FEA-3, simulations were executed for a constant value of the applied force (F), equal to the average experimental force (Fe). More research values were incorporated to deeply analyze the influence of x, d, w and c over the deflection. These tests of constant force, aimed at revealing the influence of the crack parameters on the deflection, with no interference of any other agent. A total of 2000 tests were conducted under the aforementioned premises.
Table 2 summarizes the main characteristics of the 3 simulations.
Main characteristics of the FEA simulations.
| Simulation title | Description | Variying parameter | Unit | Research values | N° tests |
|---|---|---|---|---|---|
| FEA-1 | Non-defective tile, experimental breaking force | F | N | Fe | 80 |
| FEA-2 | Defective tile (superficial crack), variable force in the range of the experimental breaking force | F | N | 1200, 1400, 1600, 1800, 2000 | 1125 |
| x | mm | 15, 50, 85, 120, 155 | |||
| d | mm | 1.0, 2.0, 3.0, 4.0, 5.0 | |||
| w | mm | 0.2, 0.6, 1.0 | |||
| c | – | 0.2, 0.6, 1.0 | |||
| FEA-3 | Defective tile (superficial crack), constant force equal to mean experimental breaking force | F | N | Average of Fe | 2000 |
| x | mm | 15, 35, 55, 75, 95, 115, 135, 155 | |||
| d | mm | 0.5, 1.0, 1.5, 2.0, 2.5, 3.0, 3.5, 4.0, 4.5, 5.0 | |||
| w | mm | 0.2, 0.4, 0.6, 0.8, 1.0 | |||
| c | – | 0.2, 0.4, 0.6, 0.8, 1.0 | |||
After conducting the experimental tests and simulations FEA-1 and FEA-2 (see Table 2 for all details), the resulting fracture deflections are plotted together against the fracture force by Fig. 3.

Since the experimental samples presented no defects, FEA-1 non-defective results are used to calibrate and validate the methodology. According to Fig. 3, the FEA-1 non-defective model slightly underestimates the experimental deflection. This underestimation, which is 8% as an average, decreases linearly as fracture force achieves higher values and could be neglected for the highest forces in range. However, the model is accurate when it comes to represent the linear correlation between fracture force and deflection.
When a single superficial crack is inserted in the part (FEA-2 model), there is a constant average increment of the deflection along the force, due to the concentration of stress around the defect. This average increment, represented in Fig. 3 as the difference between the red asterisks (FEA-1) and the blue dashed line (FEA-2 average results), is around a 6%, which is not worrying for more employments of tiles. However, the dispersion of the results, represented by means of the blue dots (individual FEA-2 results), is significant in all the range of preestablished forces achieving punctual increases of deflection up to a 65% higher than the average. These extremely high values would never be achieved by the ceramic product under consideration in the real 3-points bending test. In such circumstances the part would break well before instead. However, these values provide a good order of the magnitude of the stresses undertook by the tiles, and so their probability of a sudden break.
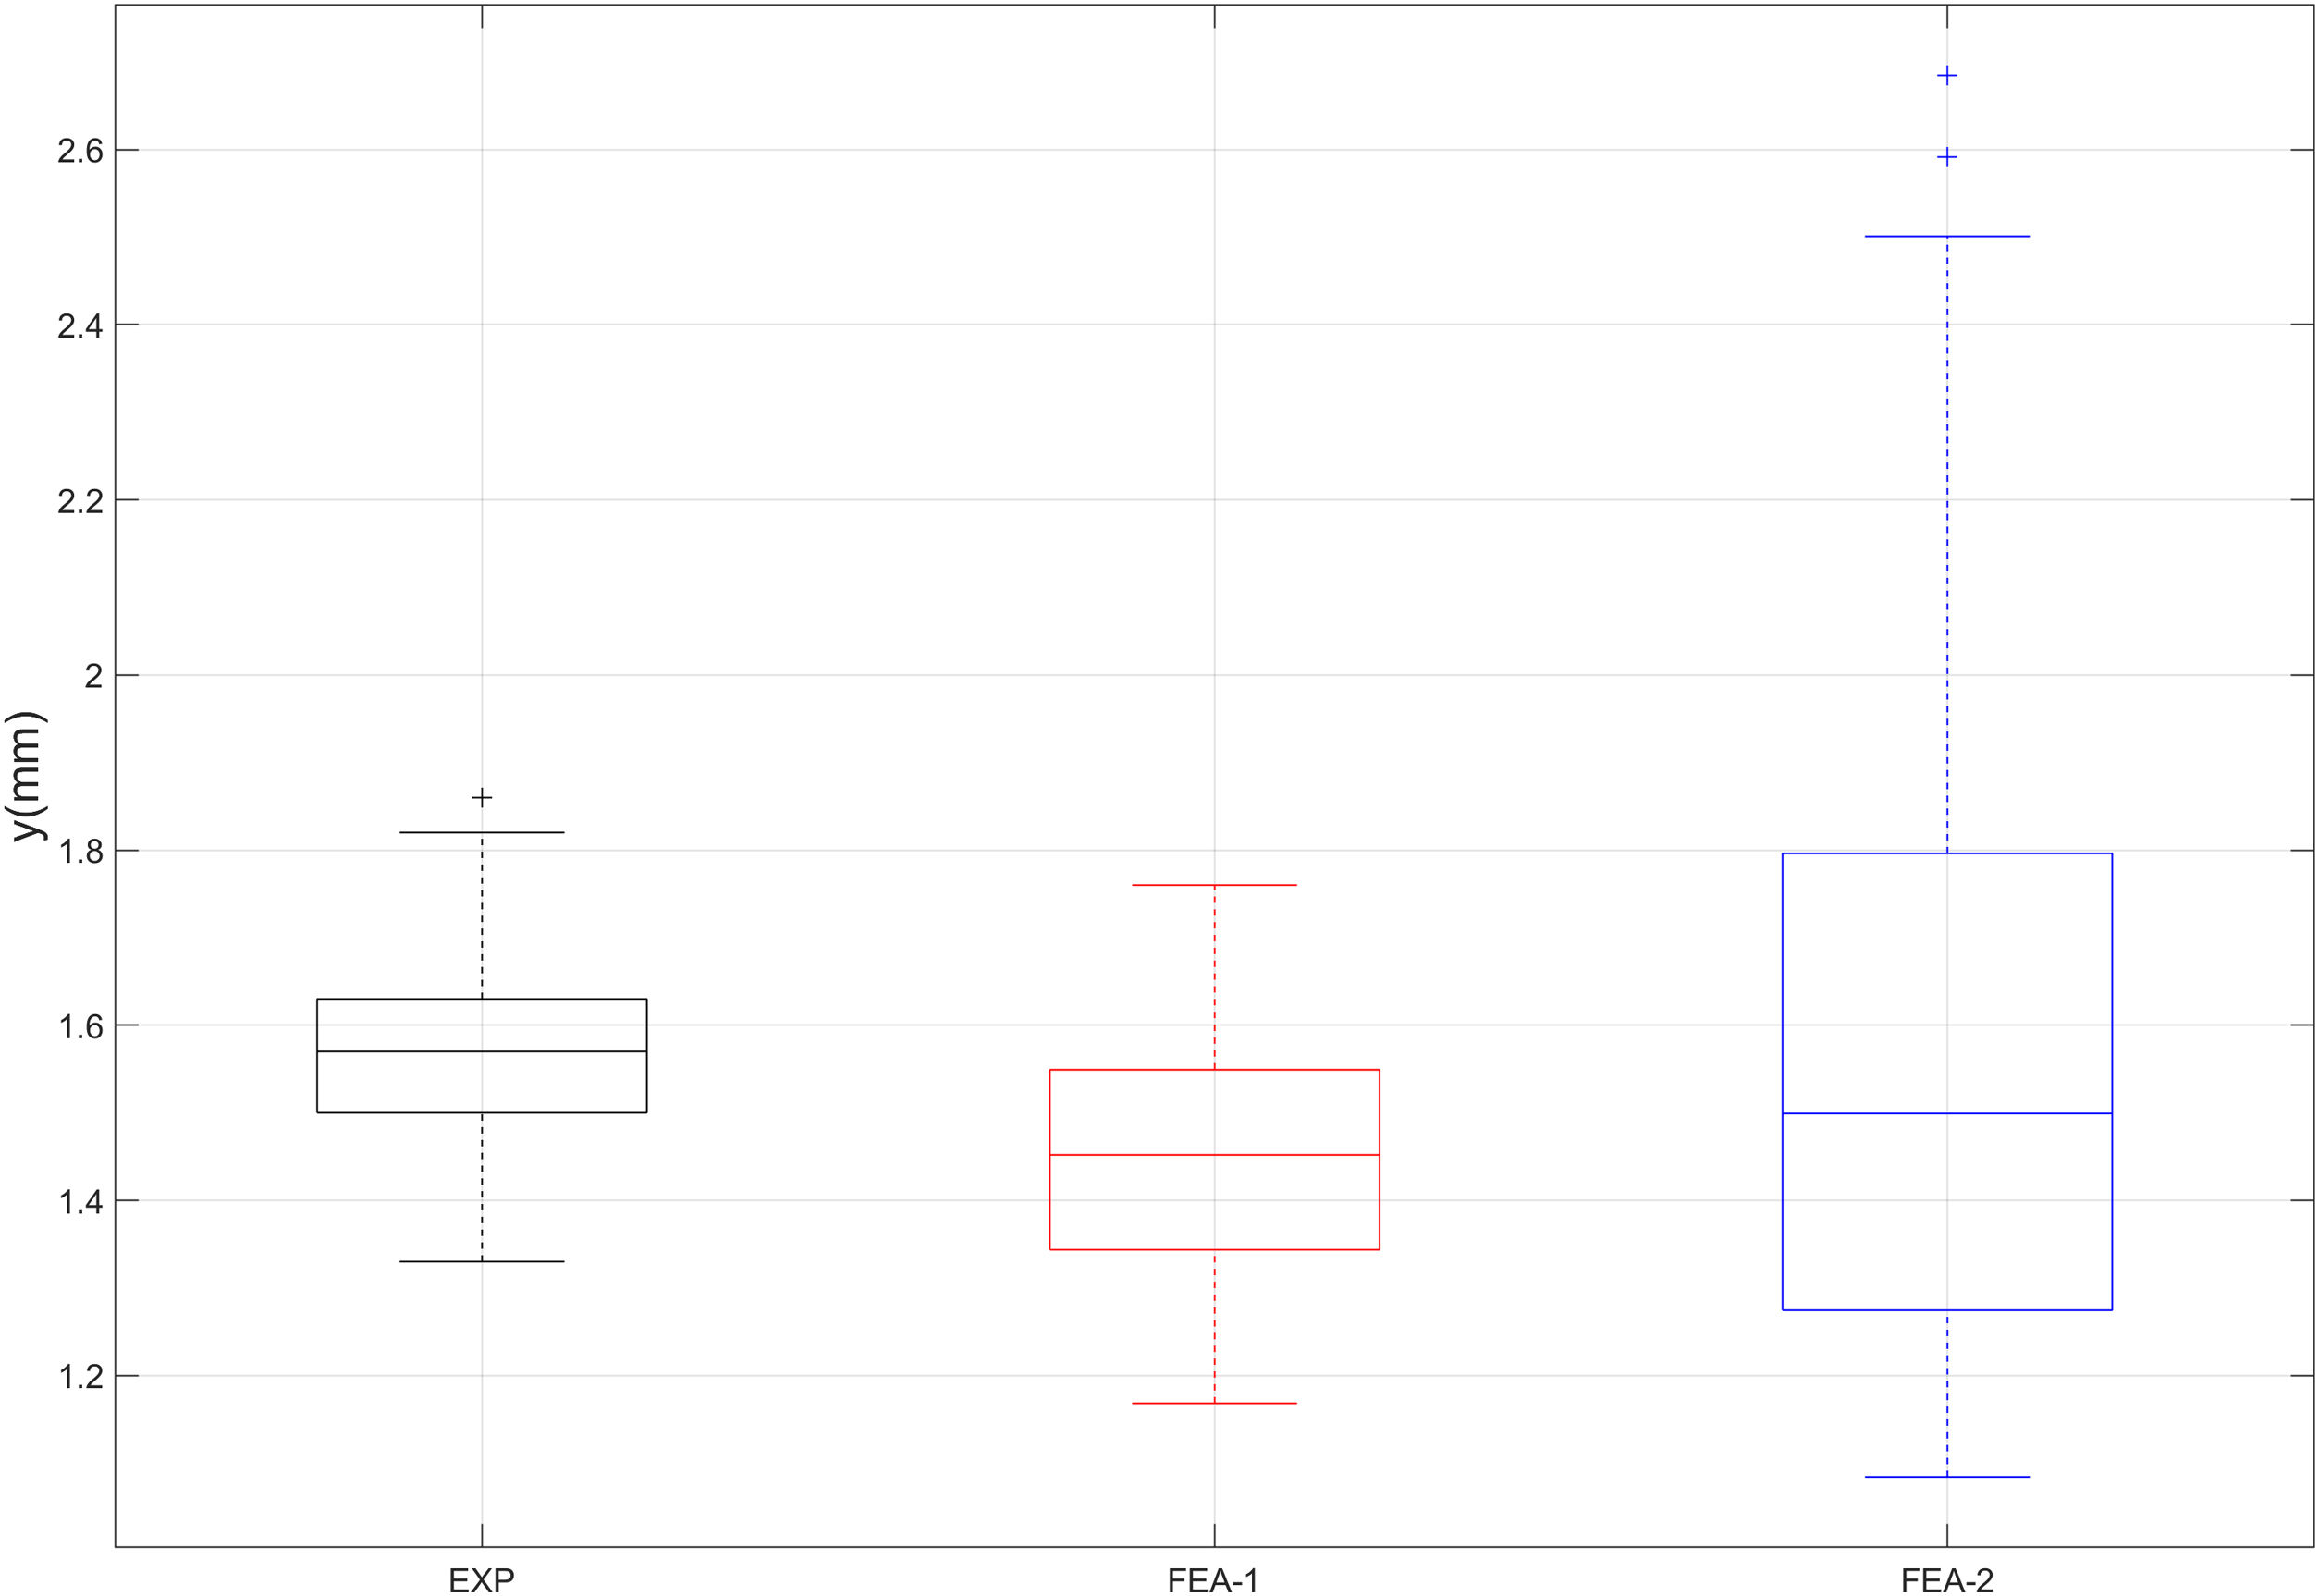
A boxplot is a graphical representation of a set of data by means of a box. Such plot allows a quick understanding of the nature of the set and the effective comparison between different sets by presenting some of their most important statistical values graphically. More into detail, every set of data is represented by means of a box in a plot. The horizontal axis represents the category (or type) of the set, and the vertical axis represents the values of the set. The central mark of the box indicates the median, and the bottom and top edges of the box indicate the 25th and 75th percentiles, respectively. The height of the box is directly related to the data scatter, whereas the width is arbitrary. The whiskers extend to the most extreme data points and the outliers are individually plotted using a marker. The boxplot of experimental, FEM-1 and FEM-2 ultimate deflection results is presented by Fig. 4. It confirms the observations made for the previous Fig. 3: the FEA model slightly underestimates the real deflection. However, the variability of the results is similar. On the other side, when a superficial crack is introduced, the average deflection increases timidly (comparing FEA-2 with FEA-1 results), whereas the variability of the results grows dramatically. Eventually, the presence of some outliers in the FEA-2 results is limited and therefore not a concern from the statistical point of view. Nevertheless, those are values to be considered in the case of tiles with specific high performances.
Influence of the crack location and size on deflection: parametric results
The FEA model has been validated through the comparison between the experimental, FEA-1 and FEA-2 results. Moreover, the global impact of the single crack over the deflection of the tile has been justified. Now, the parametric results for a constant force offered by FEA-3 are analyzed to better understand the influence of the characteristics of the crack over the performance of the tile. The deflection results are properly grouped and plotted against the different parameters of the study, namely x, d, w and c.
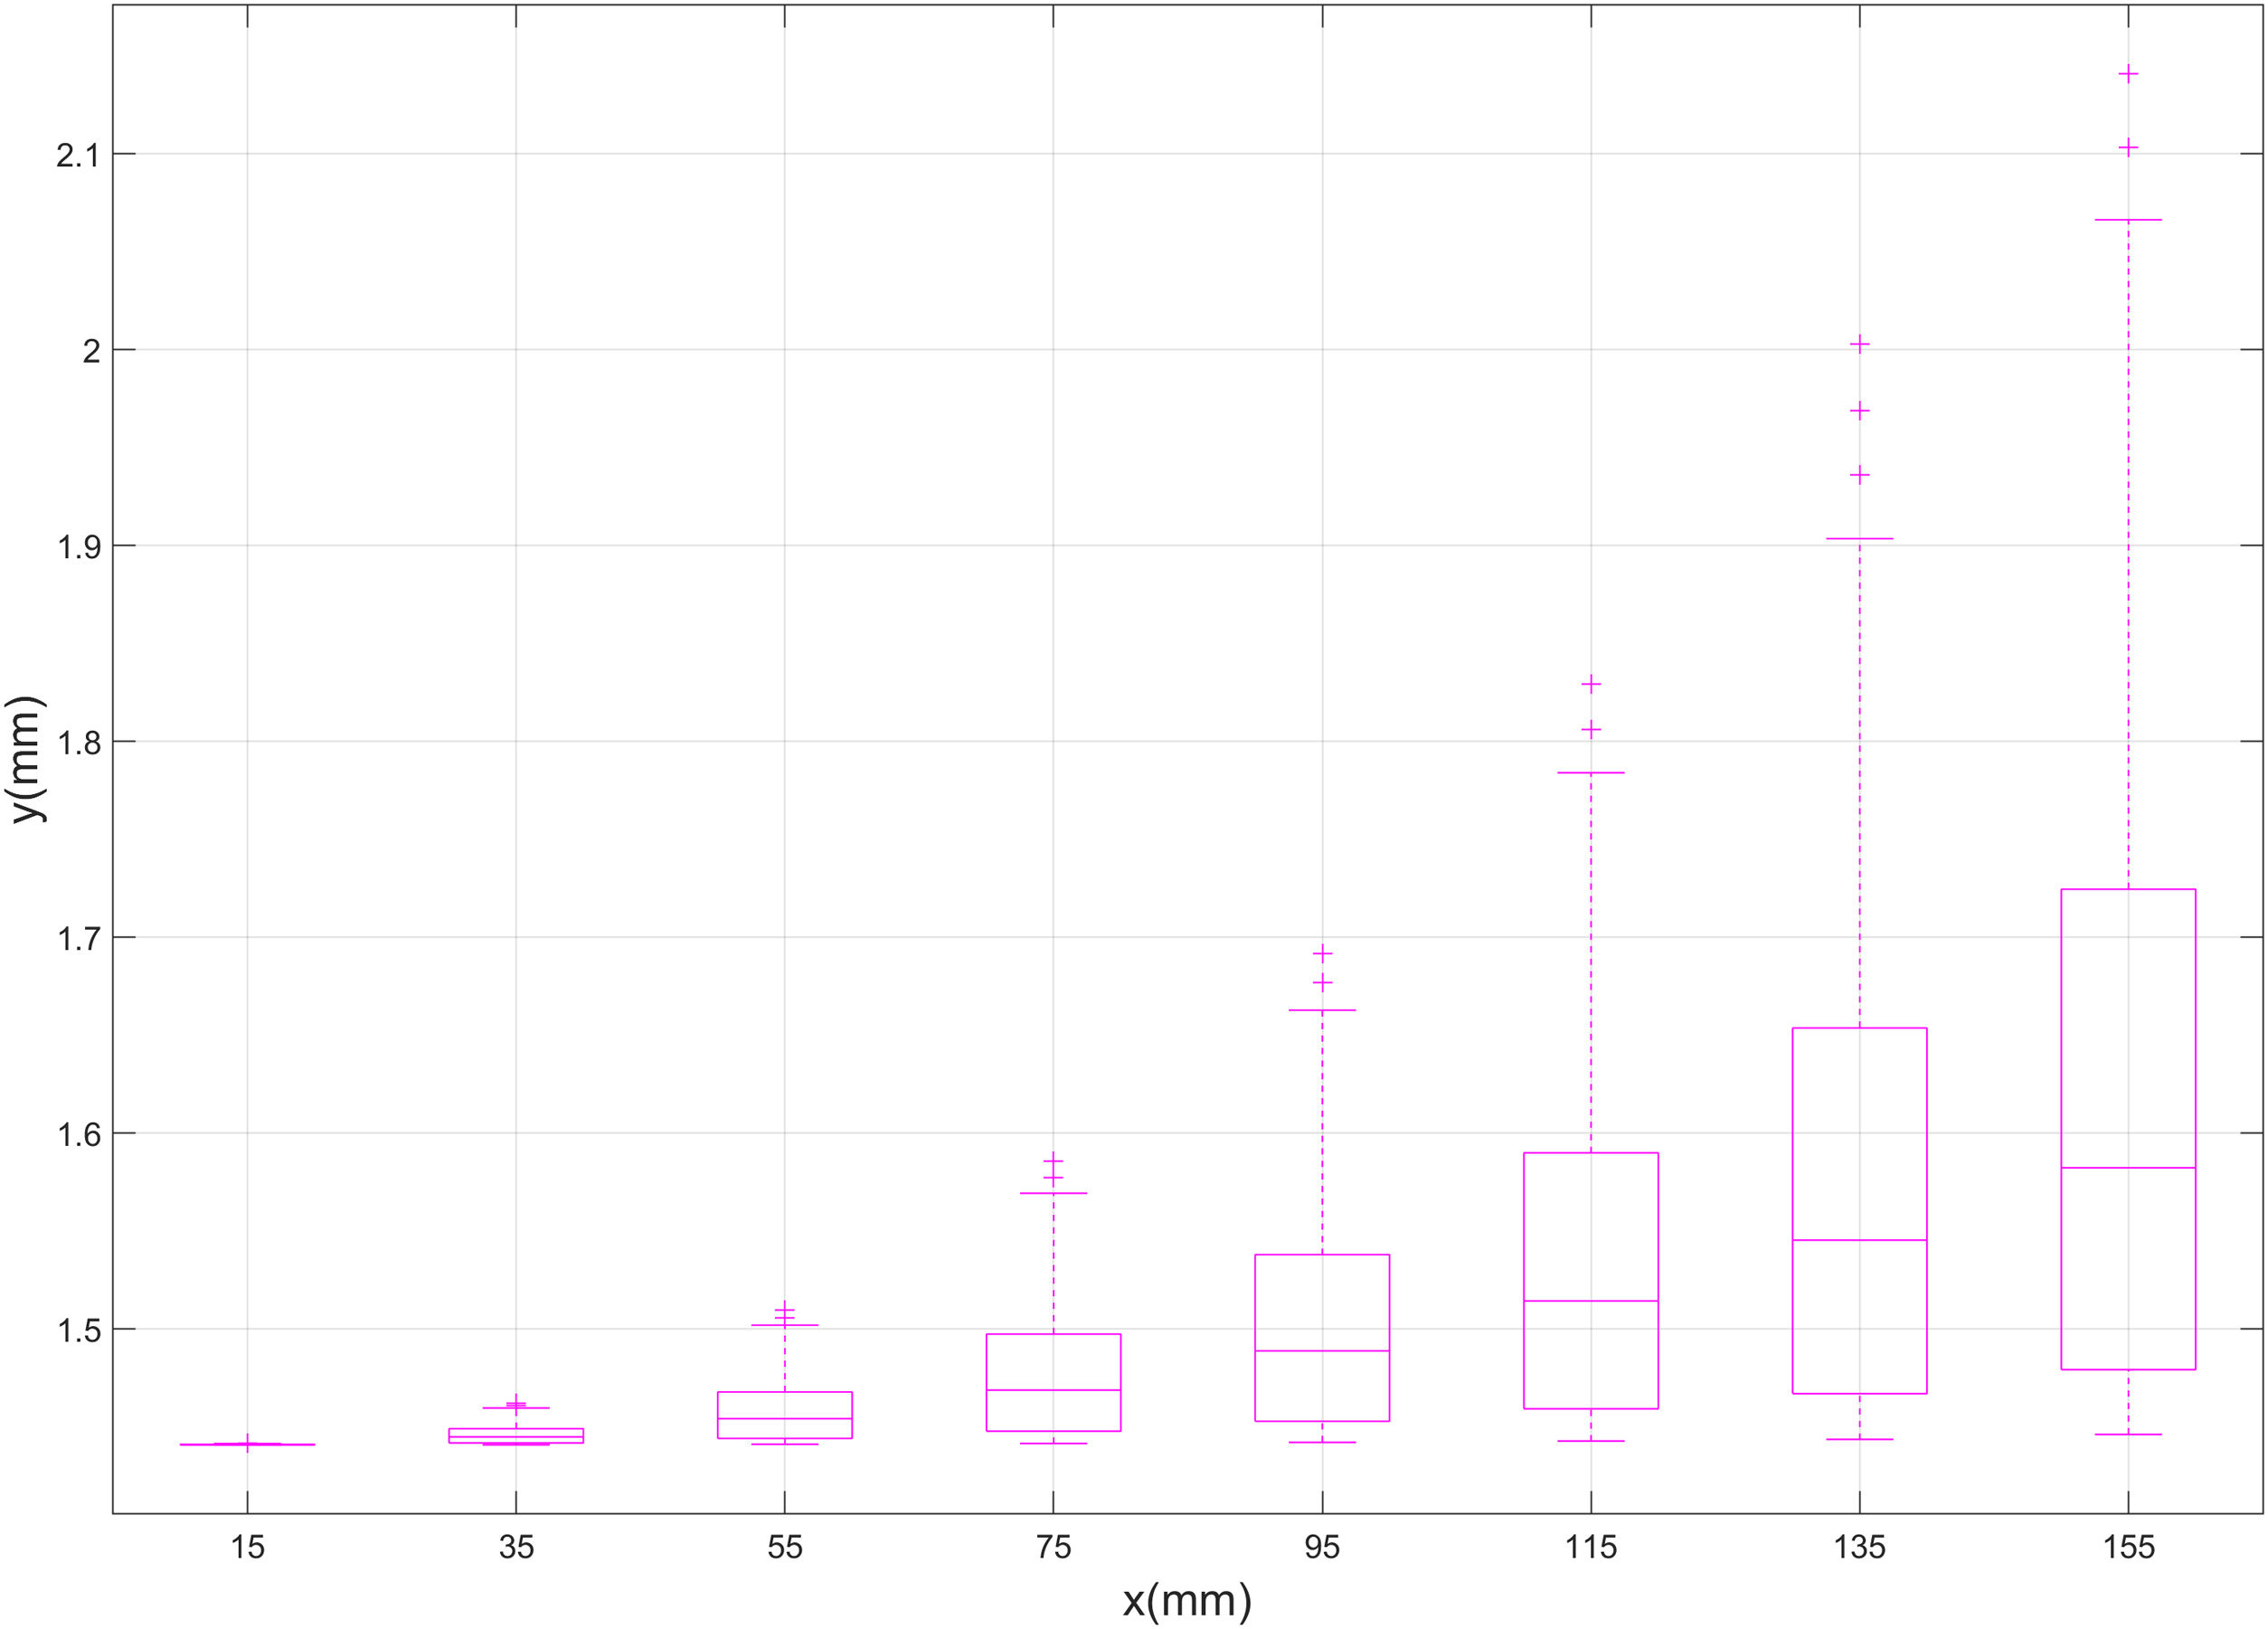
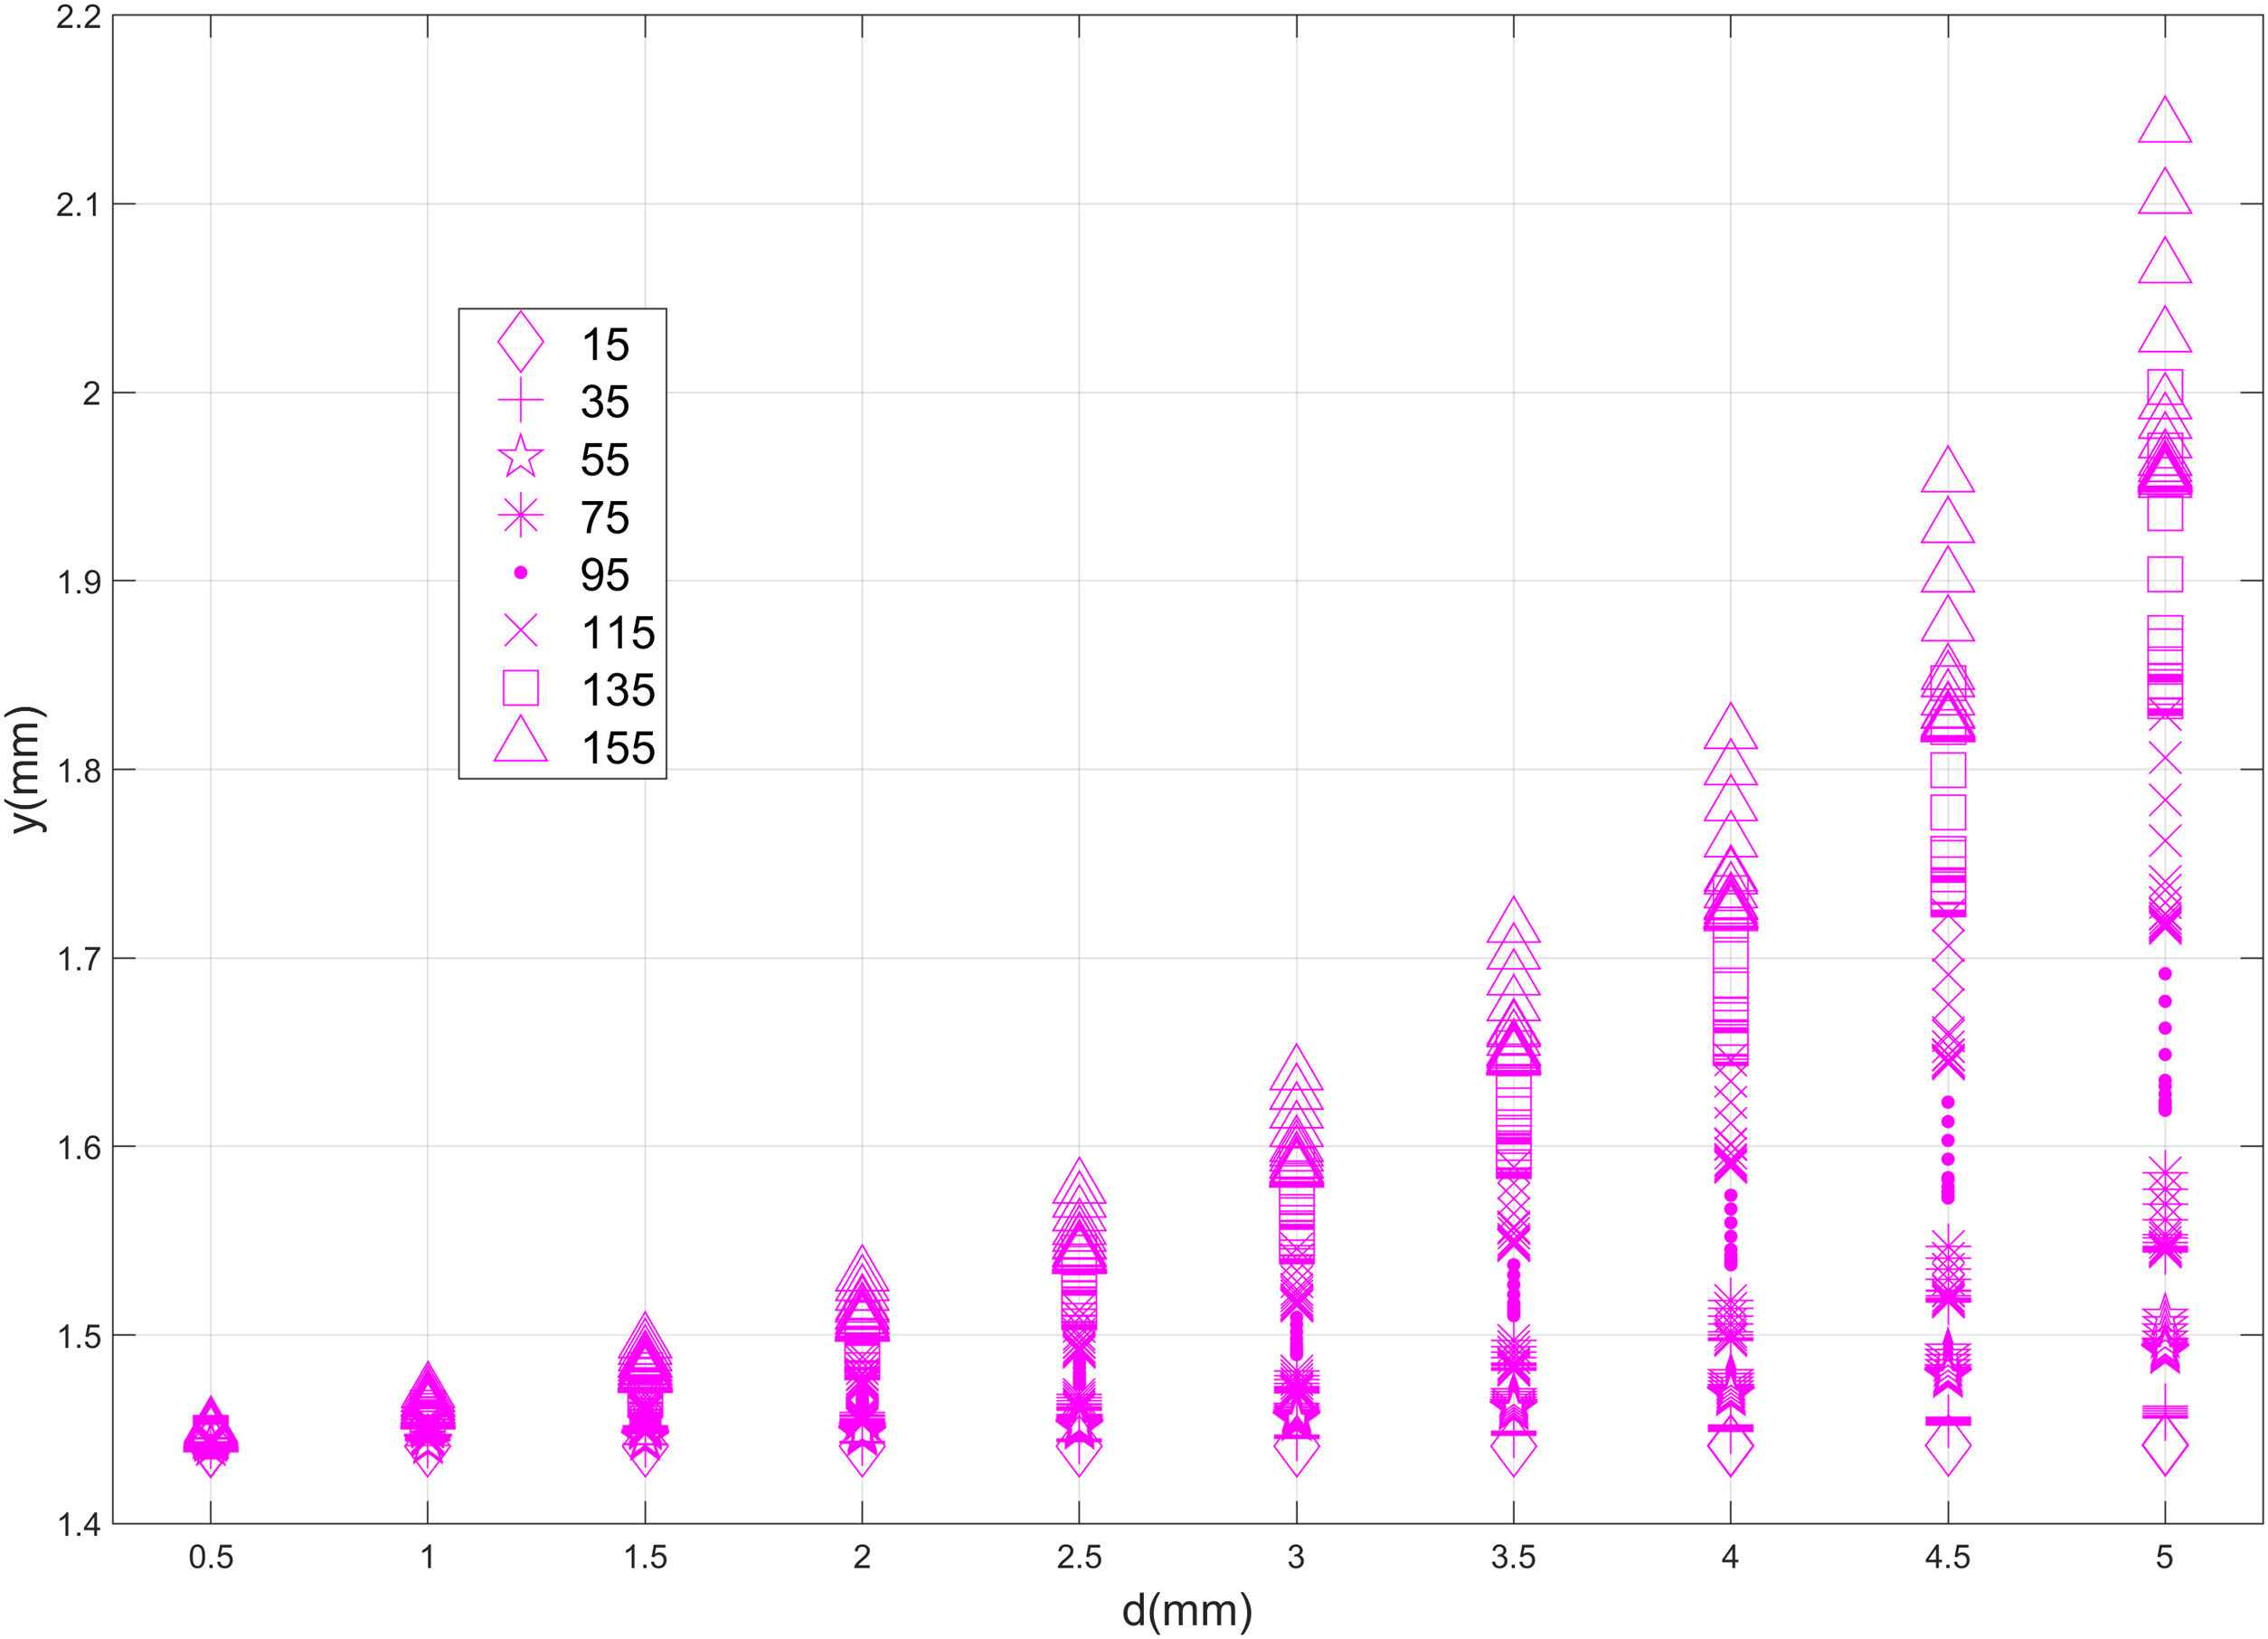
In Fig. 5, FEA-3 results are divided into 8 groups, corresponding to the preestablished x-coordinates of the imposed defect (x=15, 35, 55, 75, 95, 115, 135 and 155mm. See Table 1 for all details). For each value of x, a boxplot with the correspondent values of deflection is presented, so that the median and percentiles of the deflection could be compared between the different x-coordinates. According to Fig. 5, there is an exponential correlation between the x-coordinate of the defect and the deflection. Average deflection and specially the scatter of the values, grow exponentially as the defect approaches the middle section of the part (x=155). The same statement could be done for the depth of the defect, based on Fig. 6. In Fig. 6, FEA-3 results are divided into 10 groups, corresponding to the preestablished depths of the imposed defect (d=0.5, 1.0, 1.5, 2.0, 2.5, 3.0, 3.5, 4.0, 4.5, 5.0mm. See Table 1 for all details). As for deflection and x-coordinate, an exponential correlation could be detected between deflection and crack depth. In fact, there seems to be a cross-correlation between x-coordinate and depth, as shown by Fig. 7, where the values of deflection achieved for every x-coordinate have been grouped by crack depth. As it can be seen in this figure, both average values and scatter of the deflection grow together with x and d, following an almost identical exponential pattern.


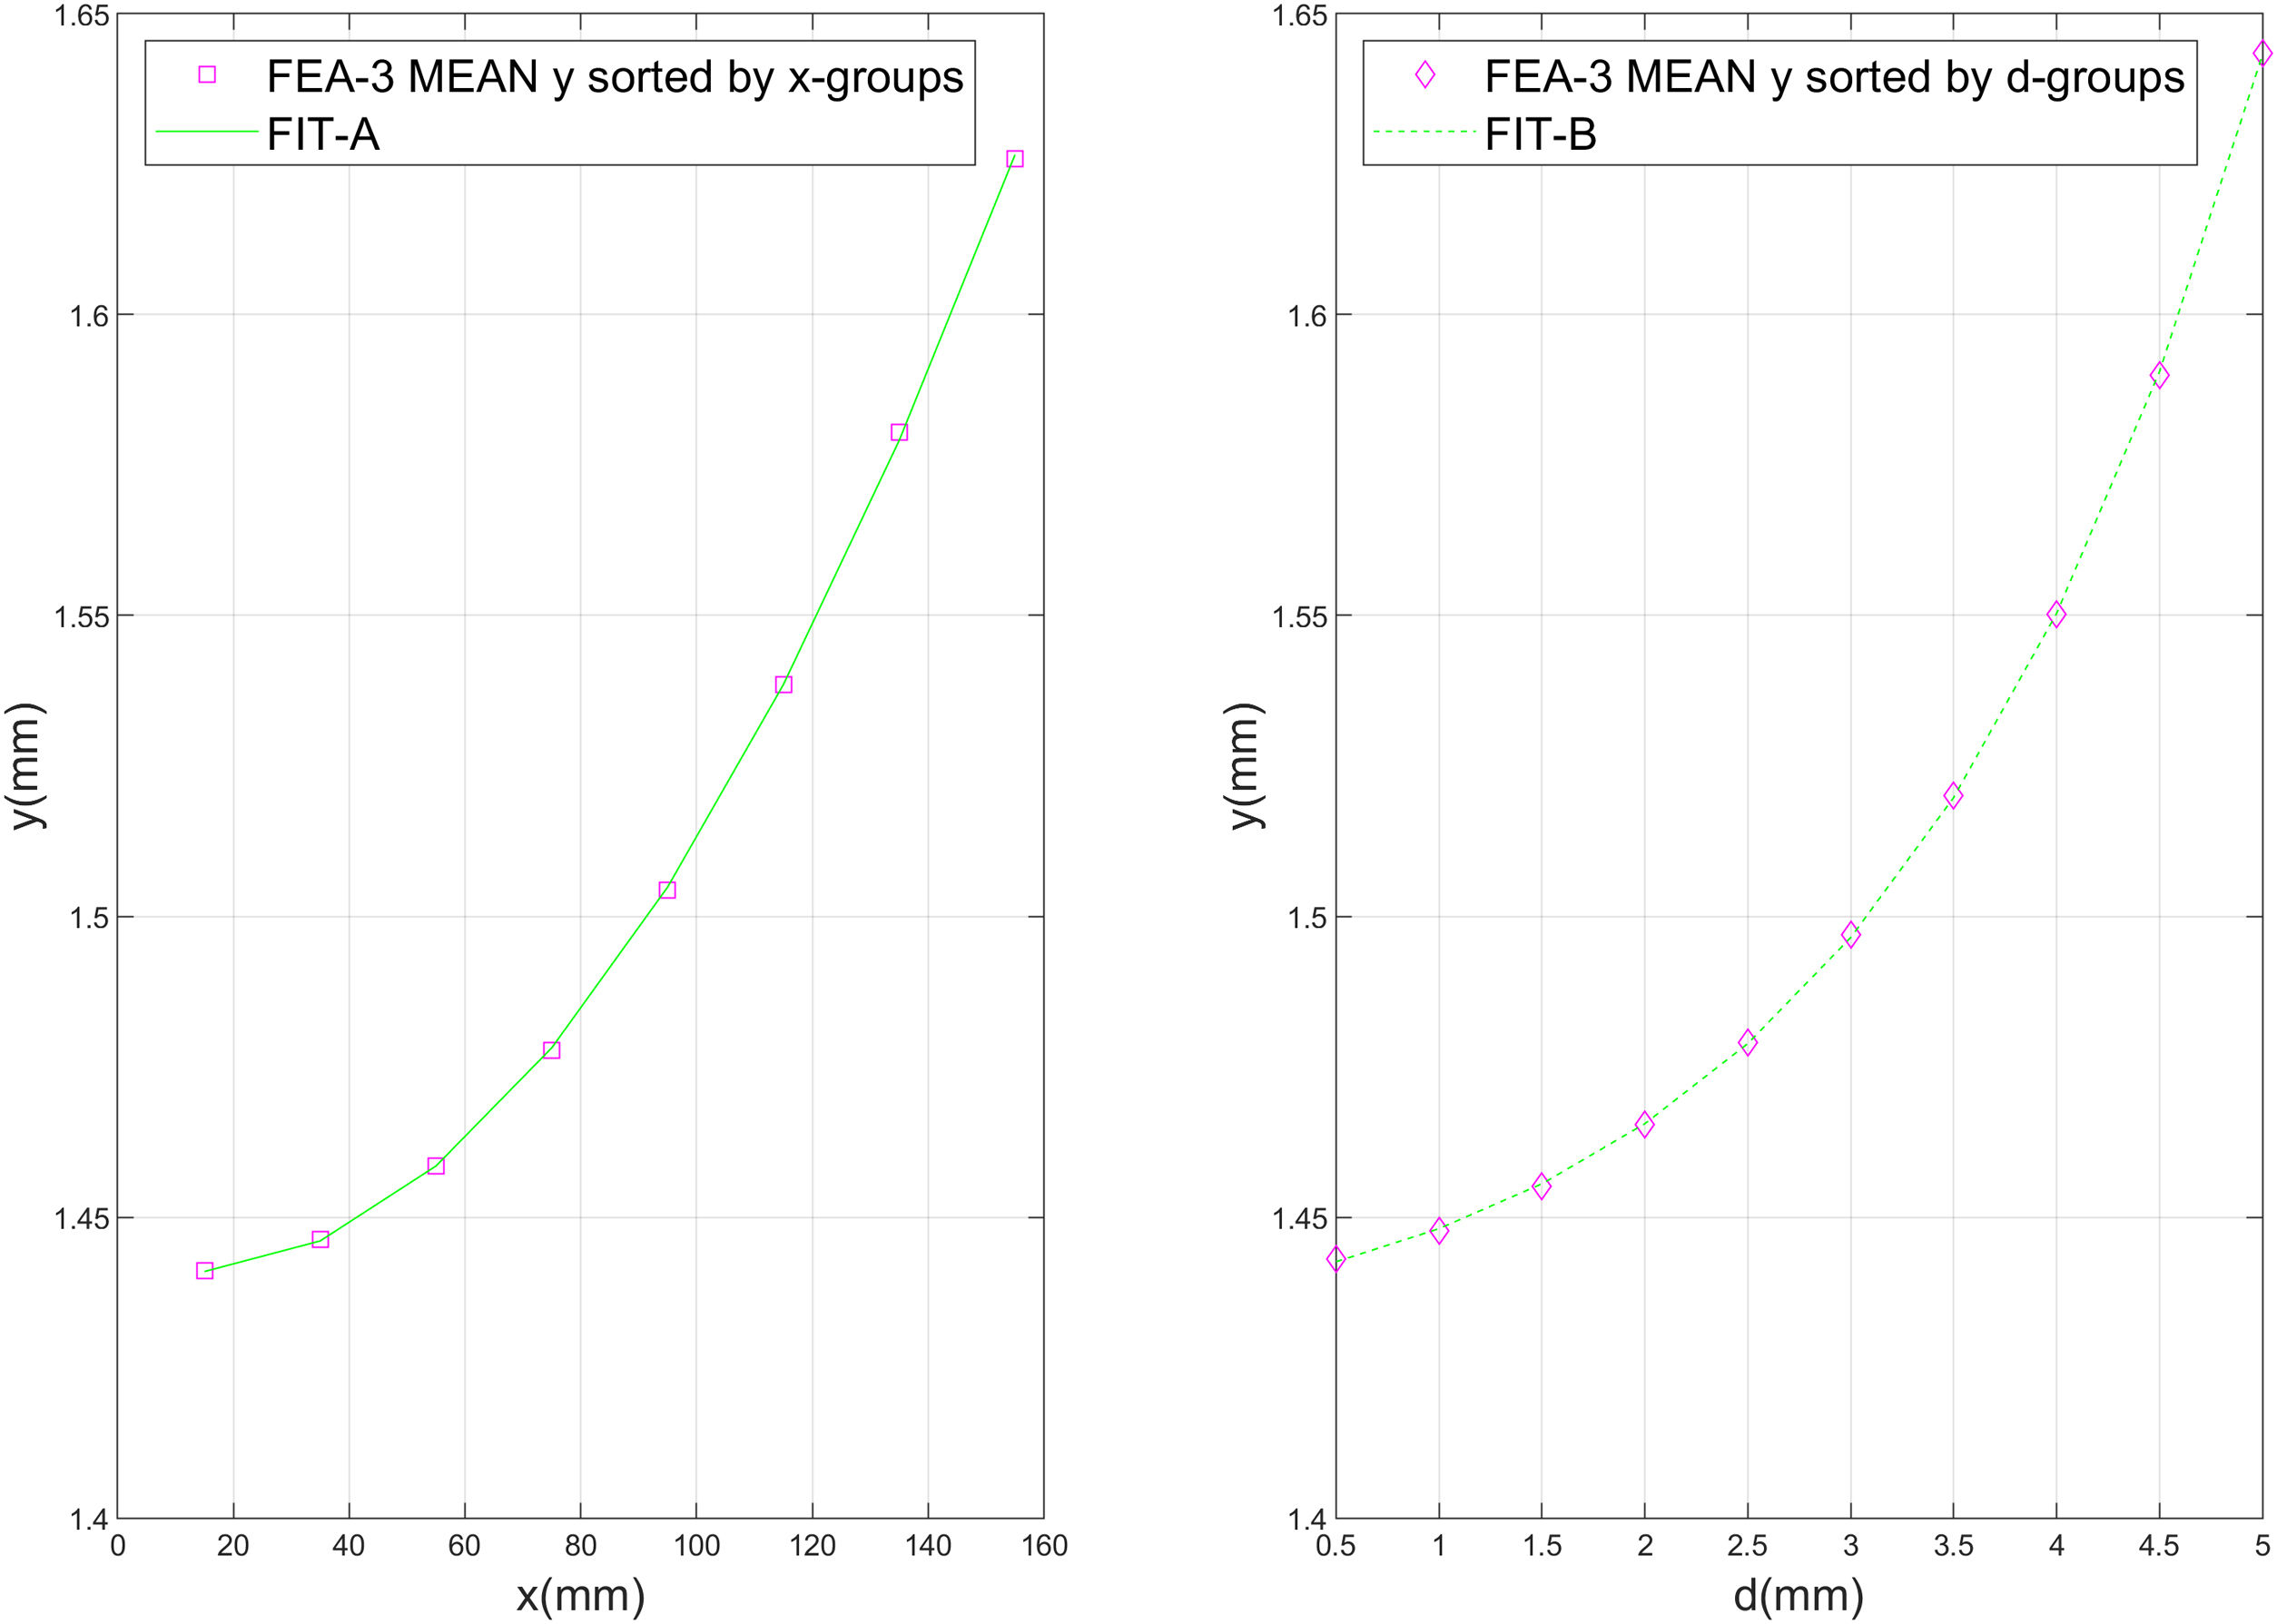
Studying the evolution of the mean FEA-3 results more closely, an exponential fit of two elements, as shown by Eq. (3), is found to be the best match for representing the correlation between y¯ and the x and d parameters.
where y¯ is the mean FEA-3 deflection, p is the x or d parameter, and C1, C2, C3 and C4 are the characteristic constants of the fit. Table 3 shows the values of the fit constants, together with the calculation of the determination coefficient R-square and Fig. 8 represents graphically both adjustments.

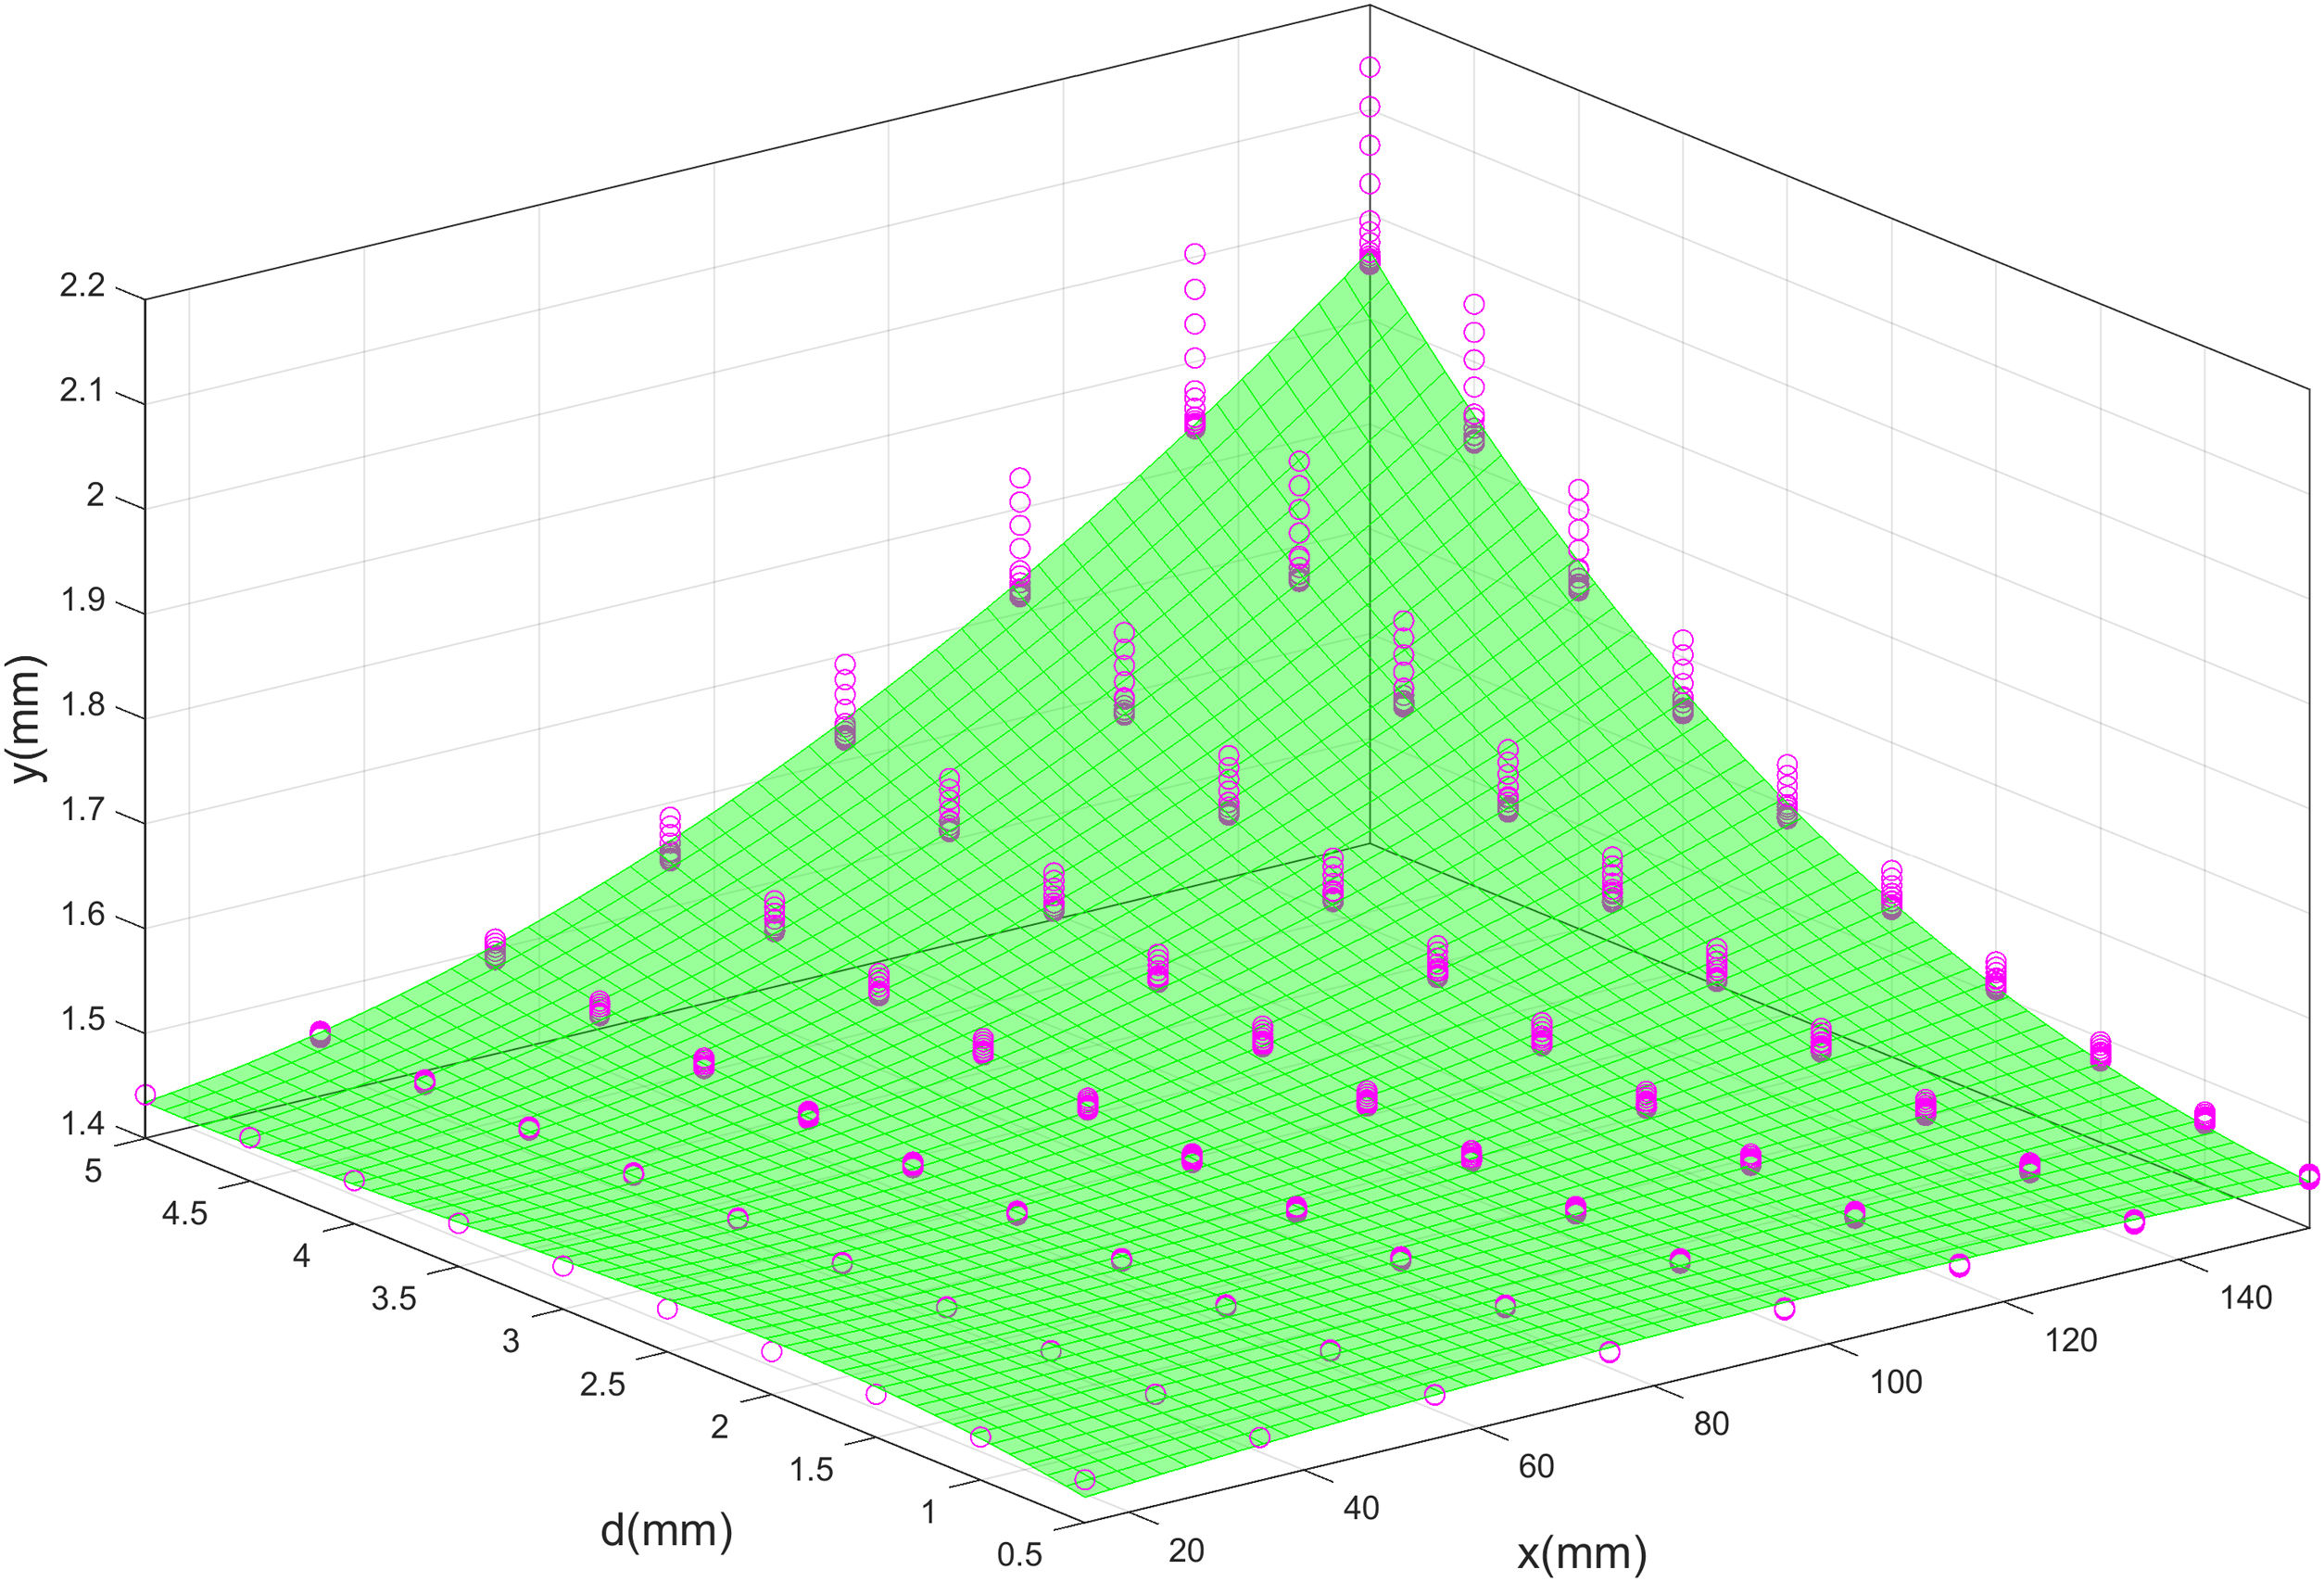
In fact, the correlation of x and d over the deflection could be pleasantly represented as a surface, as shown by Fig. 9, where the pink dots represent the deflection results of the FEA-3 tests, and the green surface represents the tree-dimensional fit. In other words, peak deflections take place when both the crack is located close to the center of the tile and its depth meets its highest values. The simultaneously of both circumstances seems to trigger the most alarming values of the deflection.

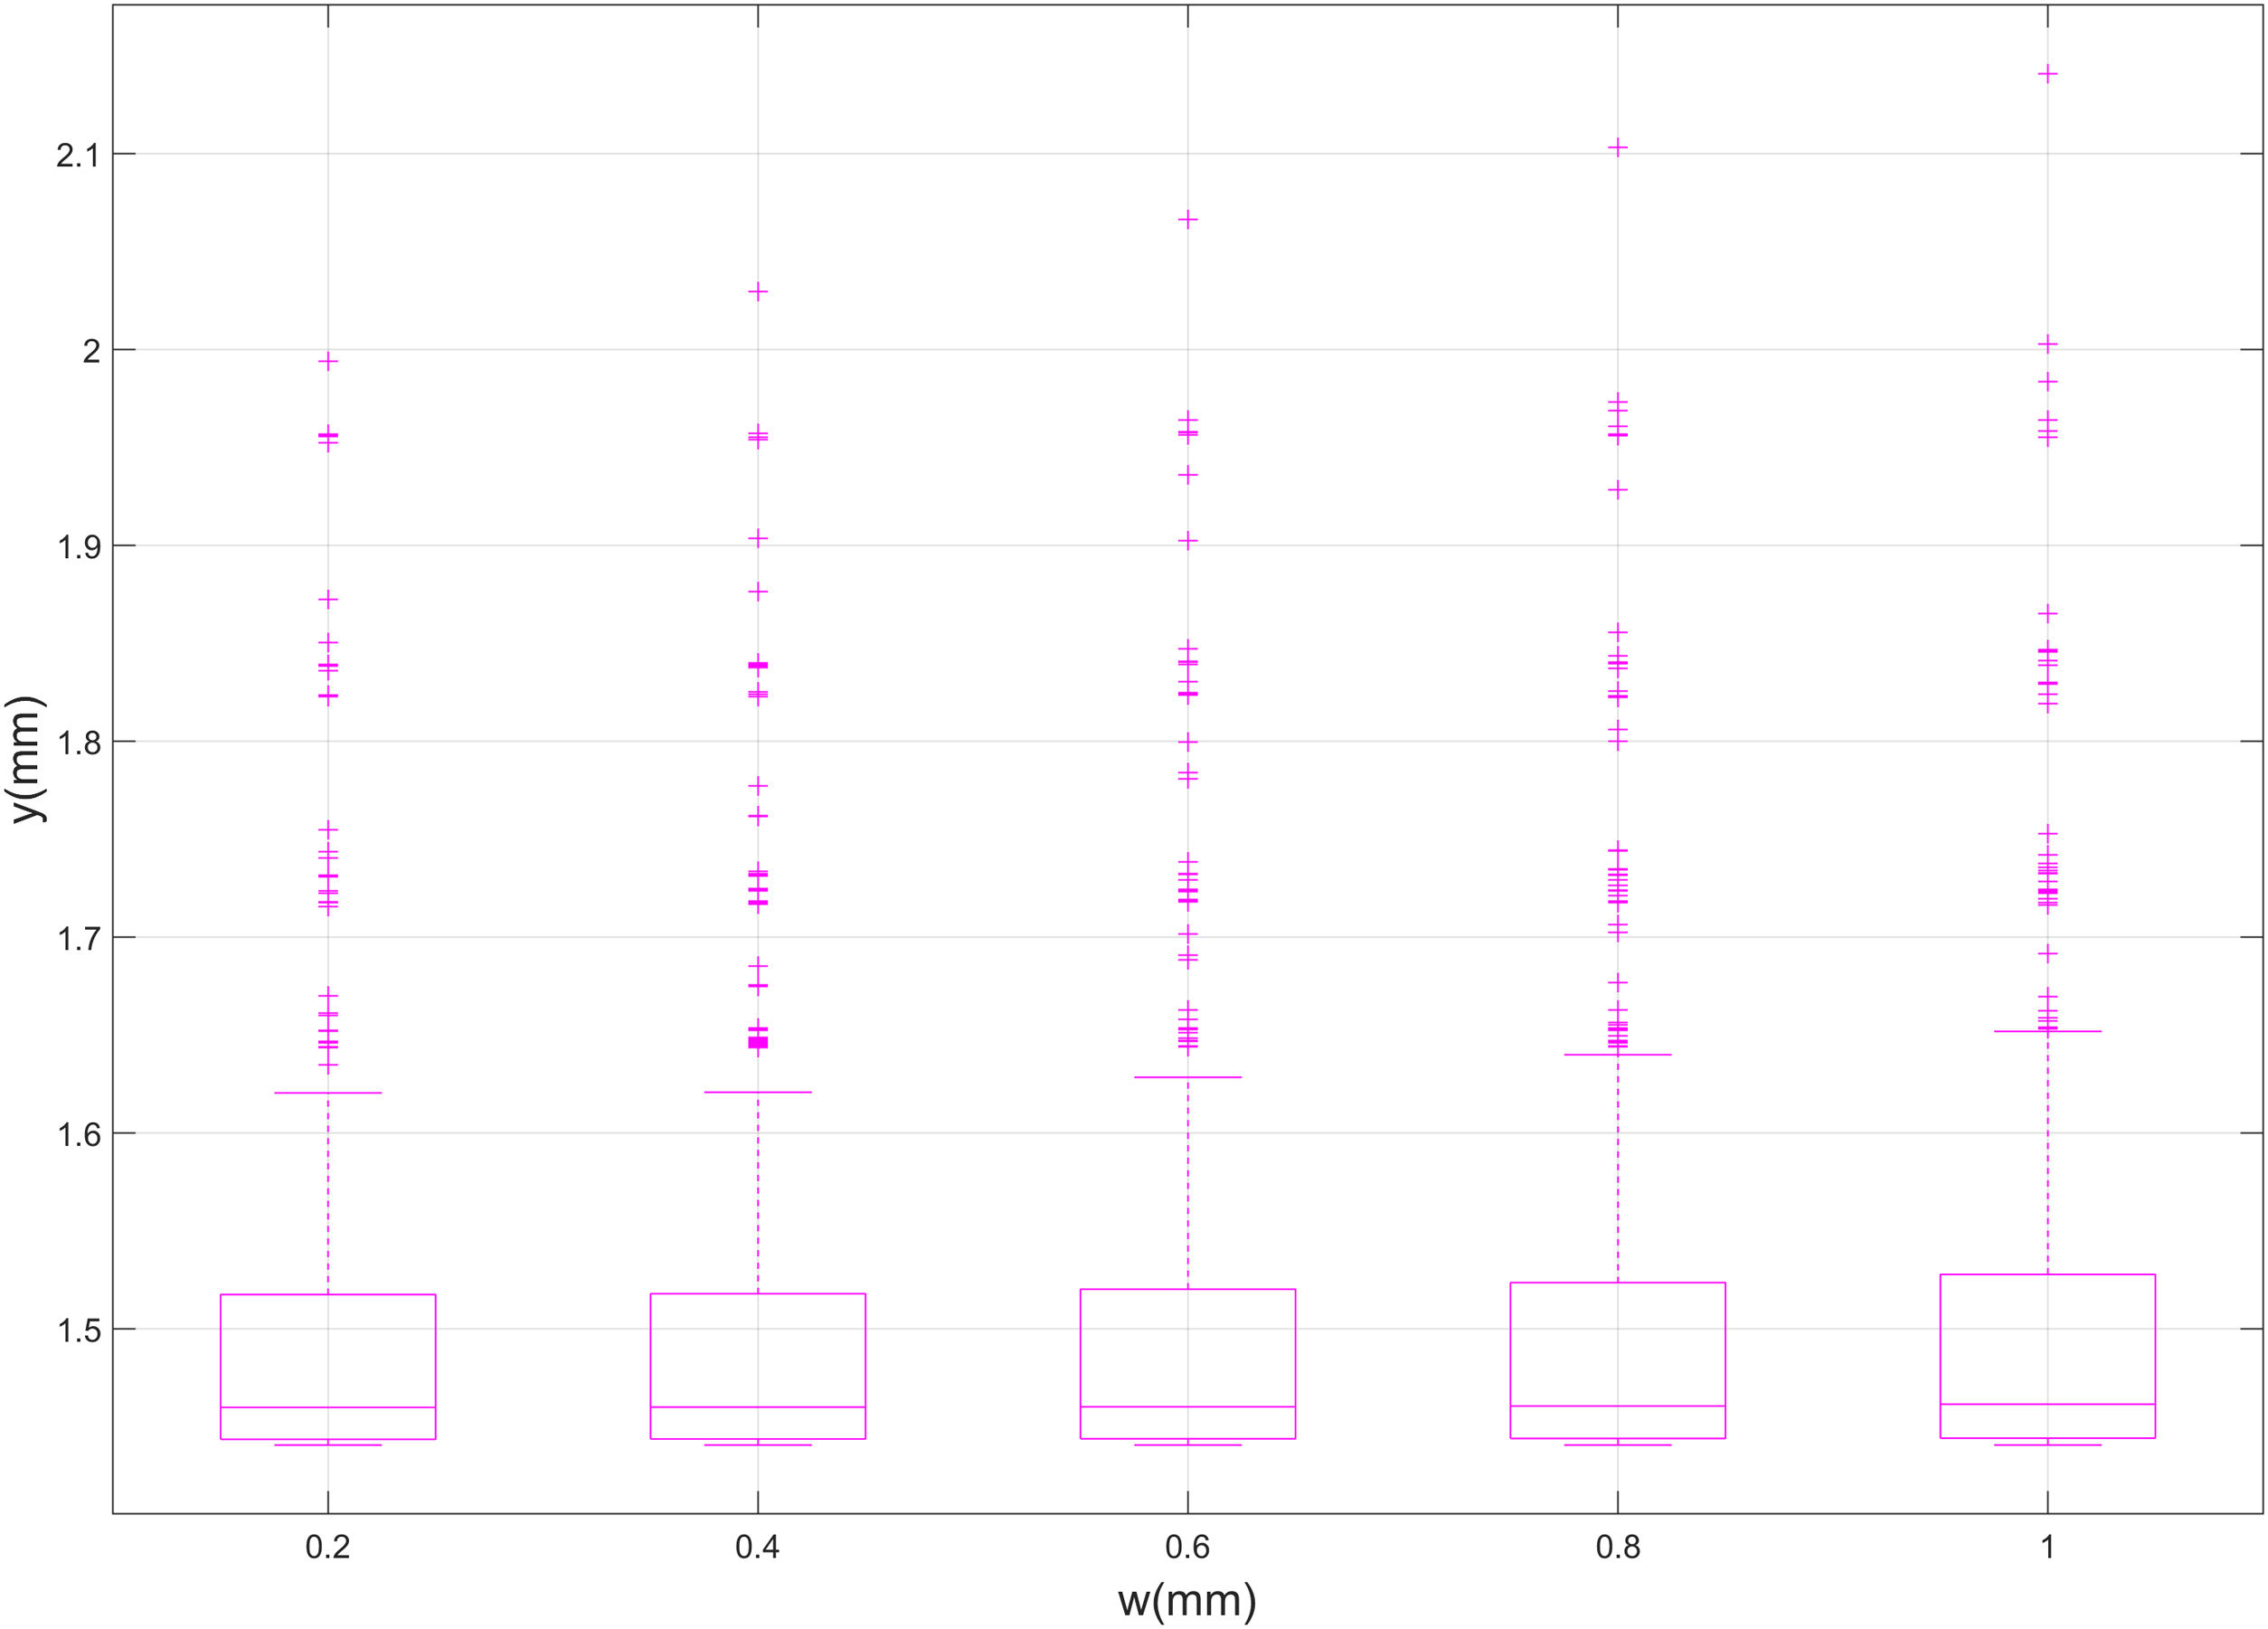
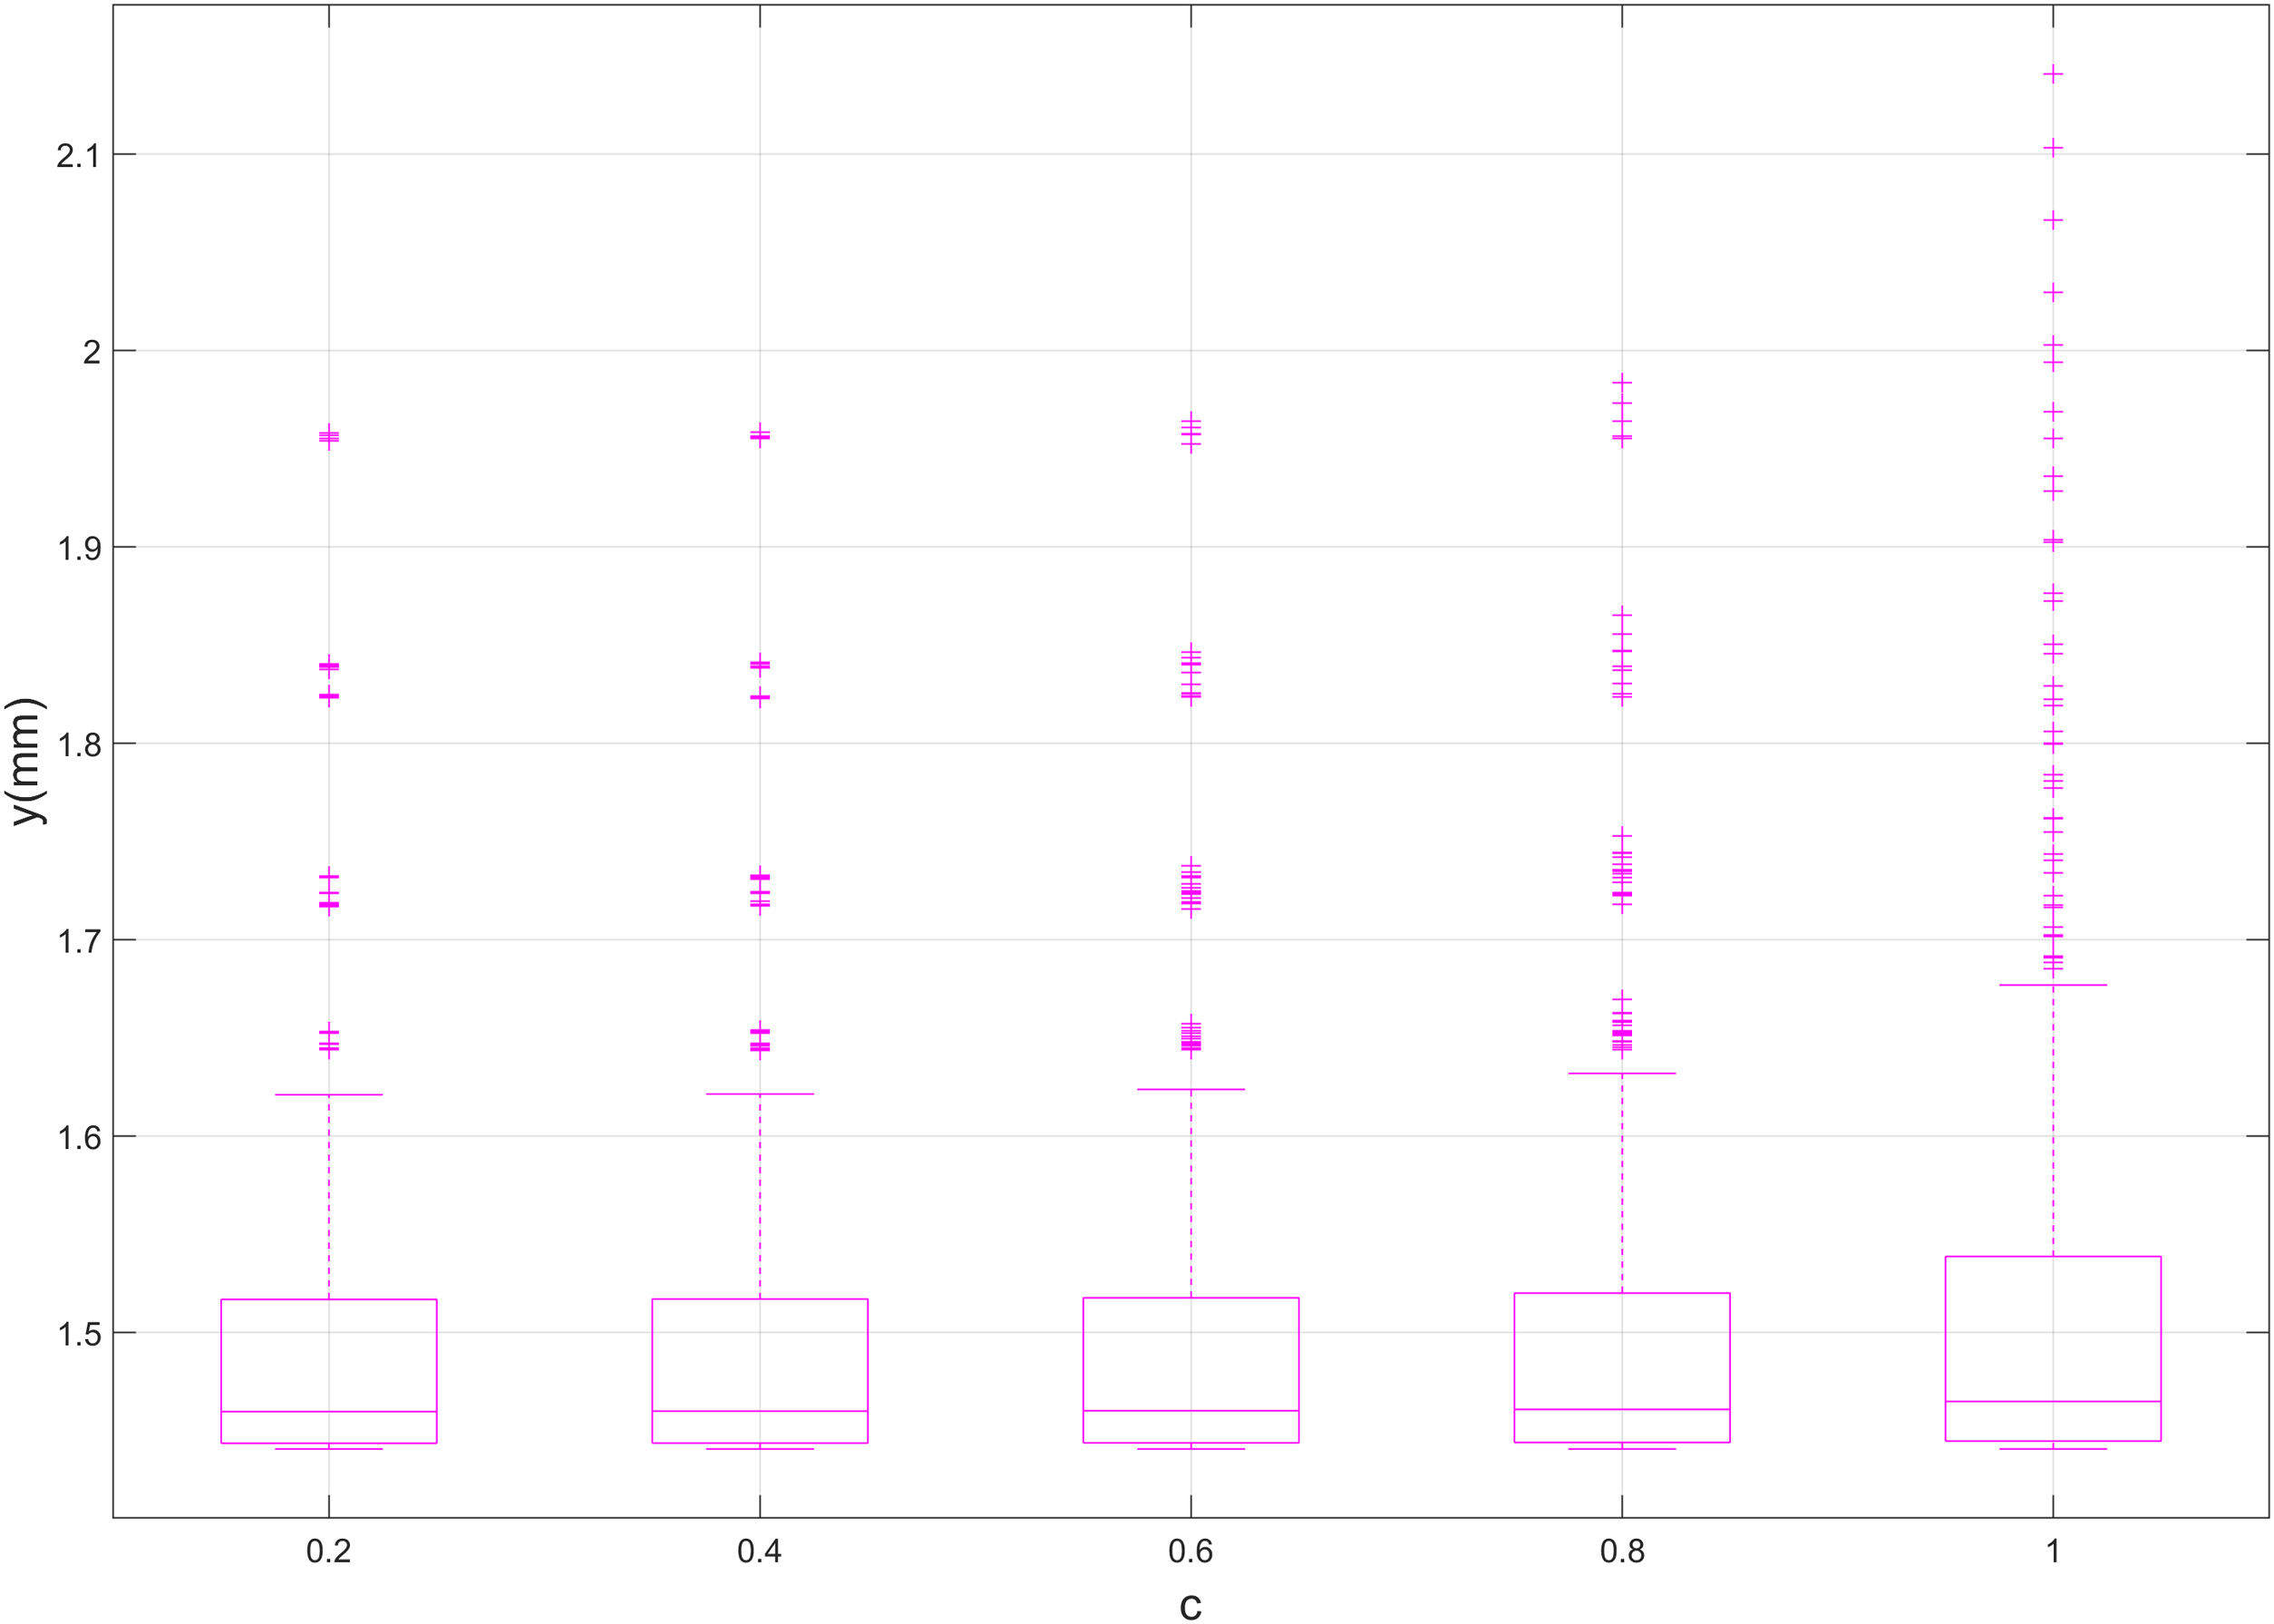
On the other side, results do not vary substantially with the width and sharpness of the crack, as presented by Figs. 10 and 11. In these figures, the median and percentiles of the deflection remain constant along the preestablished widths and sharpening factors (see Table 1 for more details). Thus, no relevant correlation between y and parametric variables w and c takes place. Only the number of outliers grows lightly as higher values of w and c are considered. Therefore, as w and c grow, deflection becomes slightly more unstable.
Conclusions

Based in our study, we can state that FEA could predict the behavior of traditional ceramic tiles under bending. The problematic of the validation could be solved by using the maximum deflection as the magnitude under study instead of the bending strength. In this particular research, experimental and simulated deflections are similar, considering both their characteristic values and their distributions vs. the applied force. It is important here to underline that the probabilistic nature of traditional ceramic materials is hardly considered by the industry, where only the mean values are considered.
The introduction of a single superficial crack in the geometry of the tile in the FEA model of the bending test, allows the study of the influence of the different parameters defining the defect over its deflection and therefore over the stress undertaken by the part. Conclusions of this study are the following:
- a)
There is an exponential correlation between the x-coordinate of the crack and the deflection, considering a range for x from 0 to L/2mm. Beyond this point, the correlation is symmetrical, as expected due to the symmetry of the model under evaluation. The fact that the maximum deflection takes place at the middle point of the part is well known for the bending test, and even logical from a non-professional point of view. However, the underlying exponential relationship is a novelty.
- b)
The depth of the crack holds an exponential correlation with the deflection as well. Such principle is true as long as the crack does not alter the linear response of the tile, which is the case of crack depths shorter than half the height of the part. If the depth of the crack exceeds this value, the predicted deflections reach out of scale levels. These predictions represent in fact genuine catastrophic ruptures.
- c)
The forecasted exponential correlation between deflection and parameters x and d could in fact be represented by means of a two elements exponential fit as presented by Eq. (3). The R-square factor is in both cases very close to 1, as displayed by Table 3, which confirms the good agreement between FEA-3 results and the fit mathematical prediction.
- d)
Moreover, there is cross-correlation between x-coordinate and depth of the defect. It is a positive, exponential correlation, which links both their average results of deflection and the scatter of them. If representing such results in a 3D plot, a nearly perfect surface is revealed.
- e)
The width of the crack has no representative influence over the deflection. On one side, this is due the smaller values the width could show being a superficial crack. On the other side, the configuration of the bending test itself tents to compress the surface of the tile and somehow closing the crack and even reducing the original width.
- f)
The sharpening of the crack has no representative influence over the deflection. In fact, there is a small increment of the deflection when c is equal to 1, and therefore the bottom of the crack is flat. This is quite an unexpected result, since it is well accepted that a good triangular bottom of the defect would facilitate the permeability of the bending inside the crack. As for the width of the crack, this could be due to the small variation allowed to the parameter. On the other side, seems that reducing the sharpening, the transversal section of the defect increases. A circumstance slightly more important than the sharpening itself.
Taken into account the previous comments, it is strongly recommended to focus the industrial manufacturing process in the consolidation of tiles with no superficial cracks in approximately the central third of its surface, to avoid a potential catastrophic break. Quality controls must be focused on this area for the same reason.
As for the geometry of the defect itself, the depth of the crack is the main factor of concern. Deep cracks or cracks growing in the direction the thickness of the tile have a major responsibility in the sudden break of the part. However, width and sharpening of the defect are mere secondary arguments.
Location and depth of the crack have a cross-correction, which causes an increment of the deflection and therefore the internal stresses which is low as an average (around 6%), but it could arise dramatically for certain combinations of the defect parameters (around 65%) causing the catastrophic break of the part.

