


Bone china samples were produced using two different milling methods: low-energy ball milling (LEBM) for 3 and 24h, and high-energy ball milling (HEBM) for 5min. After pressing, the samples were sintered at temperatures ranging from 1100°C to 1250°C. HEBM 5min yields a raw materials’ specific surface area (BET) almost 50% higher than LEBM 24h. The highest density was obtained for samples prepared by HEBM 5min (2.65g/cm3), sintered at 1200°C, which is 4.4% higher than that obtained for the sample made by LEBM 24h. Samples prepared by HEBM 5min and LEBM 24h exhibit similar Vickers hardness, indentation fracture toughness and, wear coefficient. Overall, these samples exhibit better mechanical properties than those of the samples prepared by LEBM 3h. The milling method influences the translucency of bone china up to a firing temperature of about 1150°C. Above this temperature, the formation of the liquid phase reduces porosity and, consequently, light scattering, regardless of the milling method used to produce bone china. Even so, HEBM still has a beneficial role in making bone china more homogeneous as compared to those produced by LEBM.
Las muestras de porcelana de huesos se produjeron utilizando 2 métodos de molienda: baja energía (LEBM) durante 3 y 24h y alta energía (HEBM) durante 5min. Después del prensado, las muestras se quemaron entre 1.100 y 1.250°C. La HEBM 5min produce una superficie específica de materias primas casi un 50% más alta que la LEBM 24h. La mayor densidad se obtuvo para muestras preparadas por la HEBM 5min (2,65g/cm3) y quemadas a 1.200°C, el 4,4% más que la obtenida por la LEBM 24h. Las muestras HEBM 5min y LEBM 24h mostraron dureza Vickers, tenacidad a la fractura por indentación y coeficiente de desgaste similares. En general, ambas muestras exhiben mejores propiedades mecánicas que las muestras preparadas por la LEBM 3h. El método de molienda influye en la translucidez de la porcelana de hueso a una temperatura de cocción de alrededor de 1.150°C. Por encima de esta temperatura, la formación de la fase líquida reduce la porosidad y la dispersión de la luz, independientemente del método de molienda utilizado para producir porcelana para huesos. Aun así, la HEBM hace que la porcelana de huesos sea más homogénea en comparación con las producidas por la LEBM.
Bone china is produced following the same principles of traditional porcelain, its first reports of manufacturing dating back to the 18th century, when Josiah Spode first developed this type of porcelain to fulfill the demand for translucent white products, using a mixture of bone ash, clay (kaolin) and rock (feldspar) [1–3]. This composition led to some improvement over some porcelain properties such as mechanical strength and translucency, characteristics that made bone china very attractive [3]. Some studies report bone china fracture resistance about two times higher than typical porcelain, and the shear strength up to four times higher [4]. Bone china is one of the most expensive porcelain on the market, with high aesthetic appreciation [5].
The improvement of translucency of a ceramic body can be accomplished by minimizing light scattering, for instance, by reducing the difference between the refractive indices of the constituent solid phases. Translucent ceramics are most frequently composed of crystalline grains and closed pores dispersed in a glassy matrix. Ideally, these grains should have refractive indices similar to the glass phase, and the concentration of closed pores should be minimized as much as possible [6].
The composition of bone china may vary depending on the desired properties and processing method, yet, it is very often composed of 50% bone ash, 25% potassium feldspar, and 25% kaolin [7–9]. The processing of bone china may also vary depending on the final application of the ceramic, but the most commonly used method is slip casting. Raw materials should be milled (i) to mix the raw materials in powder form, respecting the individual proportion of each component, and (ii) to reduce particle size, thus increasing the specific surface area and improving reaction and sintering speed. The raw material blend is milled over a given time, which is very dependent on milling technology. Two widely known milling methods are traditional, low-energy ball milling (LEBM), and high-energy ball milling (HEBM) [10–16].
The low-energy ball mill is one of the most commonly used milling apparatus in the ceramic industry and consists of a hollow cylinder, which rotates around its longitudinal axis. Grinding can be performed dry or wet, intermittent, or continuous [10–16].
For relatively small batches, the high-energy ball mill can be considered as a potentially interesting alternative. Laboratory-scale HEBM is usually carried out in small vessels, typically about 5cm high. The milling container, with one or more balls, is vigorously shaken, generating more than 1000 internal collisions per minute. The milling balls, with speeds around 5m/s, collide with each other and vessel walls, with impact energies, typically ten times higher than that of LEBM [10,12,13,17].
When comparing these two milling methods, besides the amount of material per batch, milling times can differ significantly. Processing times over 24h are common practice to obtain homogeneous mixtures with reasonably uniform particle size by LEBM, while HEBM can reduce milling times to a few hours or even minutes [10–19].
In this work, we present a detailed study of phase evolution upon firing, and we explore the influence of high-energy ball milling on the translucency and some thermal, physical, mechanical, and tribological properties of bone china, as compared to the traditional method of preparation of raw materials by low-energy ball milling.
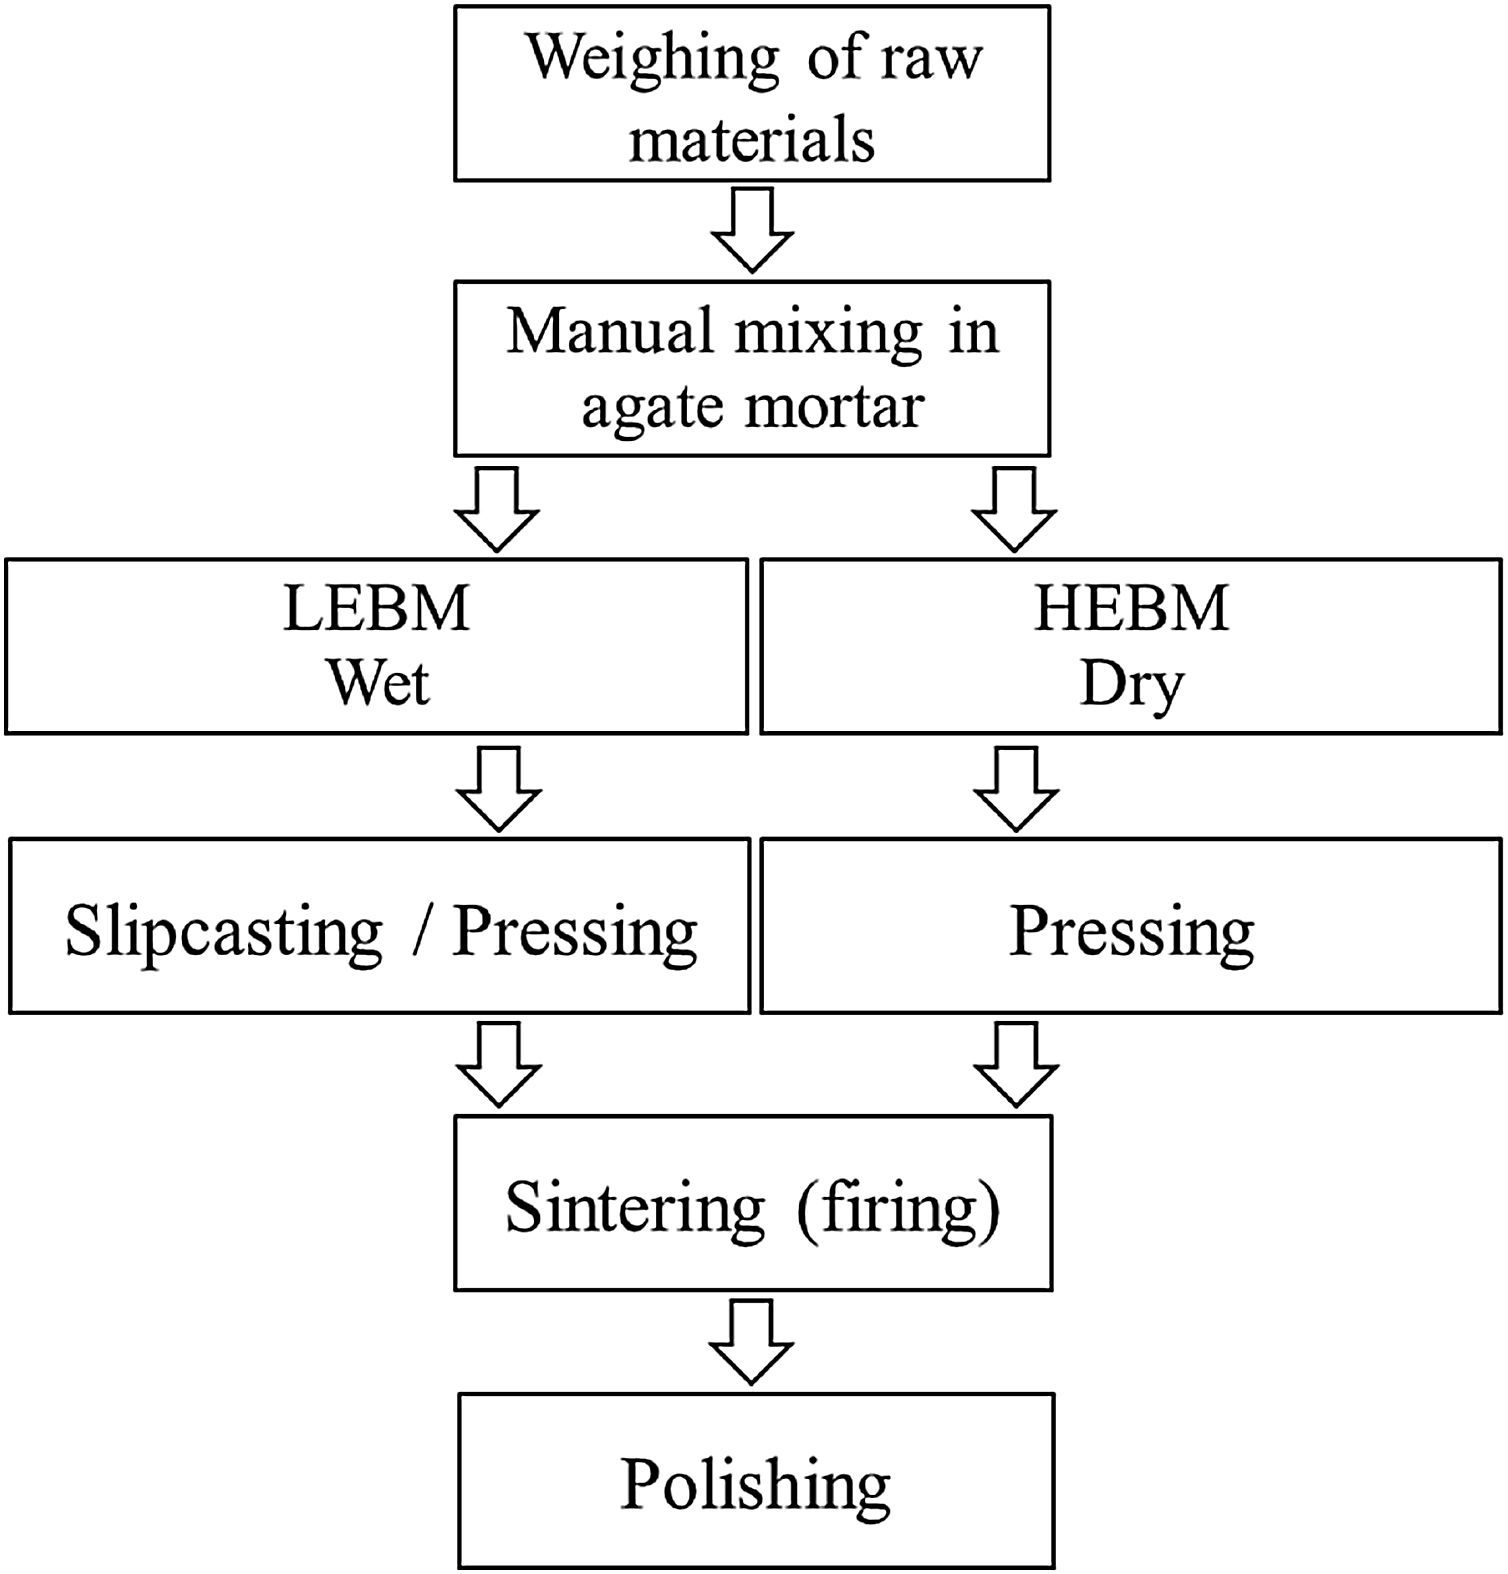
Experimental procedureSample preparationBone china samples were prepared from bone ash (50%), potassium feldspar (25%), and kaolin (25%). The bone ash used in this work was obtained by removing the organic matter from a bovine femur bone by cooking, calcination at 1000°C, breaking into smaller pieces, manual grinding in an agate mortar, and a final calcination of the comminuted bone powder at 1250°C (5°C/min heating rate and 1h hold time). Potassium feldspar and kaolin were purchased from Casa do Ceramista (Brazil). The sample preparation steps are summarized in Fig. 1.

LEBM was carried out in a De Leo mill (Brazil) for 3 or 24h. A polyethylene (PE) bottle was used as a grinding bowl and ø20mm diameter alumina balls as the grinding agent. The batch was composed of 70% solids and 30% distilled and deionized water, with 0.3% sodium silicate to improve the suspension viscosity (balls-to-powder mass ratio ∼0.9:1). After milling, the slurry was poured in a plaster mold (slip casting), dried in the air, powdered, and pressed into pellets.
A mixer/mill SamplePrep 5100 model (USA) was used for HEBM. A zirconia container [ZrO2 – 3% mol Y2O3 (Tosoh)] was used as a grinding bowl, with two small balls of zirconia [ø6.3mm ZrO2 – 3% mol Y2O3 (Tosoh)] as the grinding agent. Due to the small size of the grinding ball and agents, the samples were obtained using repeated batches, each batch consisting of 0.25g of the raw materials mixture (balls-to-powder mass ratio ∼6:1). The total time of HEBM was 5, 15, and 30min. After milling, the powder was pressed into pellets.
A manual hydraulic press Enerpac, model IPH-1240 (USA), was used for pressing the samples in pellets. The material (0.20g mass) was pressed in a metal mold with ø12mm inner diameter.
The sintering step (firing) was carried out in a Sanchis tubular furnace (Brazil) at 1100, 1125, 1150, 1175, 1200 and 1250°C (5°C/min heating rate and 1h hold time). After sintering, samples were polished in an automatic polishing machine Buehler, Minimet 1000 (USA), with TAC (Treibacher Schleifmittel-Brazil) alumina (∼4μm average particle size).
Sample analysis and characterizationThe chemical composition of the raw materials was determined by semi-quantitative X-ray fluorescence (XRF) using an Rh tube (Philips/Panalytical, model PW 2400, Netherlands), at the Laboratório de Análises de Minerais e Rochas (LAMIR), Universidade Federal do Paraná (Brazil).
X-ray diffraction analysis (XRD) was carried out for scattering angles from 5° to 70°, with a step size of 0.05°, integration time of 4s, 1° divergence and scattering slits, 0.3mm receiving slit and sample rotating at 10rpm, using a Shimadzu XRD-6000 diffractometer operating with CuKα radiation (λ=0.15418nm). Phase identification was carried out using DIFFRAC.EVA (Bruker, Germany) and the Crystallography Open Database [20].
The specific surface area was determined by nitrogen adsorption [Brunauer-Emmett-Teller (BET) method], using a Quantachrome Nova Instruments equipment (USA). The samples were vacuum pre-treated for 12h at 350°C. The particle size (DBET) was calculated as [9]
where SSA is the specific surface area, and ρ is the specific density. The density of the unfired bone china was estimated as 2.87g/cm3 from the composition (50% of bone ash, hydroxyapatite ρ=3.16g/cm3, 25% of potassium feldspar ρ=2.55g/cm3, and 25% of kaolin ρ=2.65g/cm3). Bulk density, water absorption, and open porosity of sintered samples were determined according to the ASTM C 373-88 Standard [21]. Additional samples were sintered at 1300°C to confirm the trend of density, porosity, and water absorption curves with firing temperature.
Thermogravimetric analysis (TGA) was carried out in a simultaneous thermal analyzer STA 449 F3 Jupiter (Netzsch, Germany), using 40mLmin−1 of synthetic air purge, 20mLmin−1 of ultrapure nitrogen as protective gas, and a heating rate of 10°C/min up to 1300°C. The dilatometric analysis was performed in a DIL 402 PC/4 (Netzsch, Germany) dilatometer, under static air, and a heating rate of 20°C/min up to 1300°C. The samples for dilatometry were pressed up to 1kbar in a metal mold with ø8mm inner diameter.
Microstructural information, including compositional maps by energy-dispersive electron microprobe spectroscopy (EDS), was obtained by scanning electron microscopy (SEM), in a field emission gun (FEG) electron microscope Tescan, model MIRA3 (Czech Republic), operating at 15kV accelerating voltage. Samples for SEM analysis were acid-etched with 5% HF (fluoridric acid) for 3min to remove the glass phase and subsequently coated with gold.
The transmittance at 550nm of bone china discs was measured in a double-beam UV–Vis spectrometer Varian 634 (USA). Accuracy was checked by using neutral filters (Schott NG-9). The linear attenuation coefficient (μ) was obtained as [22]
where I/I0 is the transmittance, and x is the sample's thickness.
Mechanical tests were performed only on samples sintered at 1200°C, for which the apparent density was maximum. Indentation hardness and fracture toughness (KIC) were performed using a Shimadzu microhardness tester (HMV-G), equipped with a diamond Vickers tip, under a load of ∼2000mN, for 10s. Indentation fracture toughness (KIC) was estimated as [23]
where ζ is a dimensionless constant, which for ceramics is estimated as 0.016±0.004, E is the Young modulus, H is the Vickers hardness, P is the load, and c is the half-length of the crack generated by indentation. At least ten measurements were taken for each sample.
The Young modulus was estimated by instrumented indentation test performed on polished sample surfaces using a dynamic ultra microhardness tester DUH-211S (Shimadzu, Kyoto, Japan), equipped with a diamond Berkovich indenter (115°), with a maximum load of 500mN for 10s. The maximum load and indentation time were chosen to avoid, as much as possible, crack formation at the edges of the indentation. At least six different indentation tests were performed for each sample. The Young modulus was estimated from load and contact depth data, according to the Oliver and Pharr method [24], assuming a Poisson's ratio of 0.25.
The wear coefficient of the sintered ceramics was estimated using a micro-abrasion equipment Calotest (CSM, Centre Suisse d’Electronique et de Microtechnique) adapted with a load cell to measure the normal force on the sample [25–27]. The abrasive used was a SiC slurry with particle size less than about 5μm [26]. The micro-abrasion wear coefficient (κ) is given by
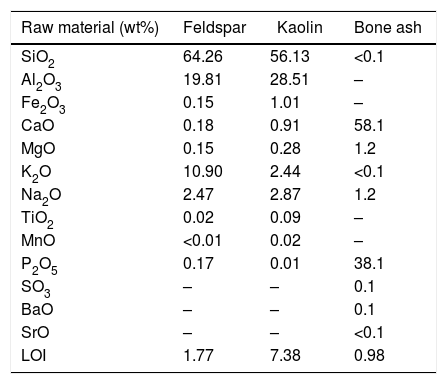
where L is the sliding distance, FN is the normal force on the sample, b is the diameter of the wear crater, and d is the diameter of the rotating sphere.Results and discussionRaw materialsChemical compositionThe chemical composition of the raw materials used in this work (bone ash, potassium feldspar, and kaolin), as obtained by X-ray fluorescence analysis, is shown in Table 1.
Chemical composition of raw materials expressed in terms of equivalent oxides (LOI=loss on ignition). Results were normalized to 100%.
| Raw material (wt%) | Feldspar | Kaolin | Bone ash |
|---|---|---|---|
| SiO2 | 64.26 | 56.13 | <0.1 |
| Al2O3 | 19.81 | 28.51 | – |
| Fe2O3 | 0.15 | 1.01 | – |
| CaO | 0.18 | 0.91 | 58.1 |
| MgO | 0.15 | 0.28 | 1.2 |
| K2O | 10.90 | 2.44 | <0.1 |
| Na2O | 2.47 | 2.87 | 1.2 |
| TiO2 | 0.02 | 0.09 | – |
| MnO | <0.01 | 0.02 | – |
| P2O5 | 0.17 | 0.01 | 38.1 |
| SO3 | – | – | 0.1 |
| BaO | – | – | 0.1 |
| SrO | – | – | <0.1 |
| LOI | 1.77 | 7.38 | 0.98 |
The ash of calcined bones is rich in calcium and phosphor, which led to β-TCP formation upon firing [28,29]. The kaolin composition, Al2O3 (56.13%) and SiO2 (28.51%), also agrees with the literature [30]. Potassium feldspar main constituents, SiO2 (64.26%), Al2O3 (19.81%) and K2O (10.90%), are in the expected proportion as found in orthoclase, K2O·Al2O3·6SiO2[8,9].
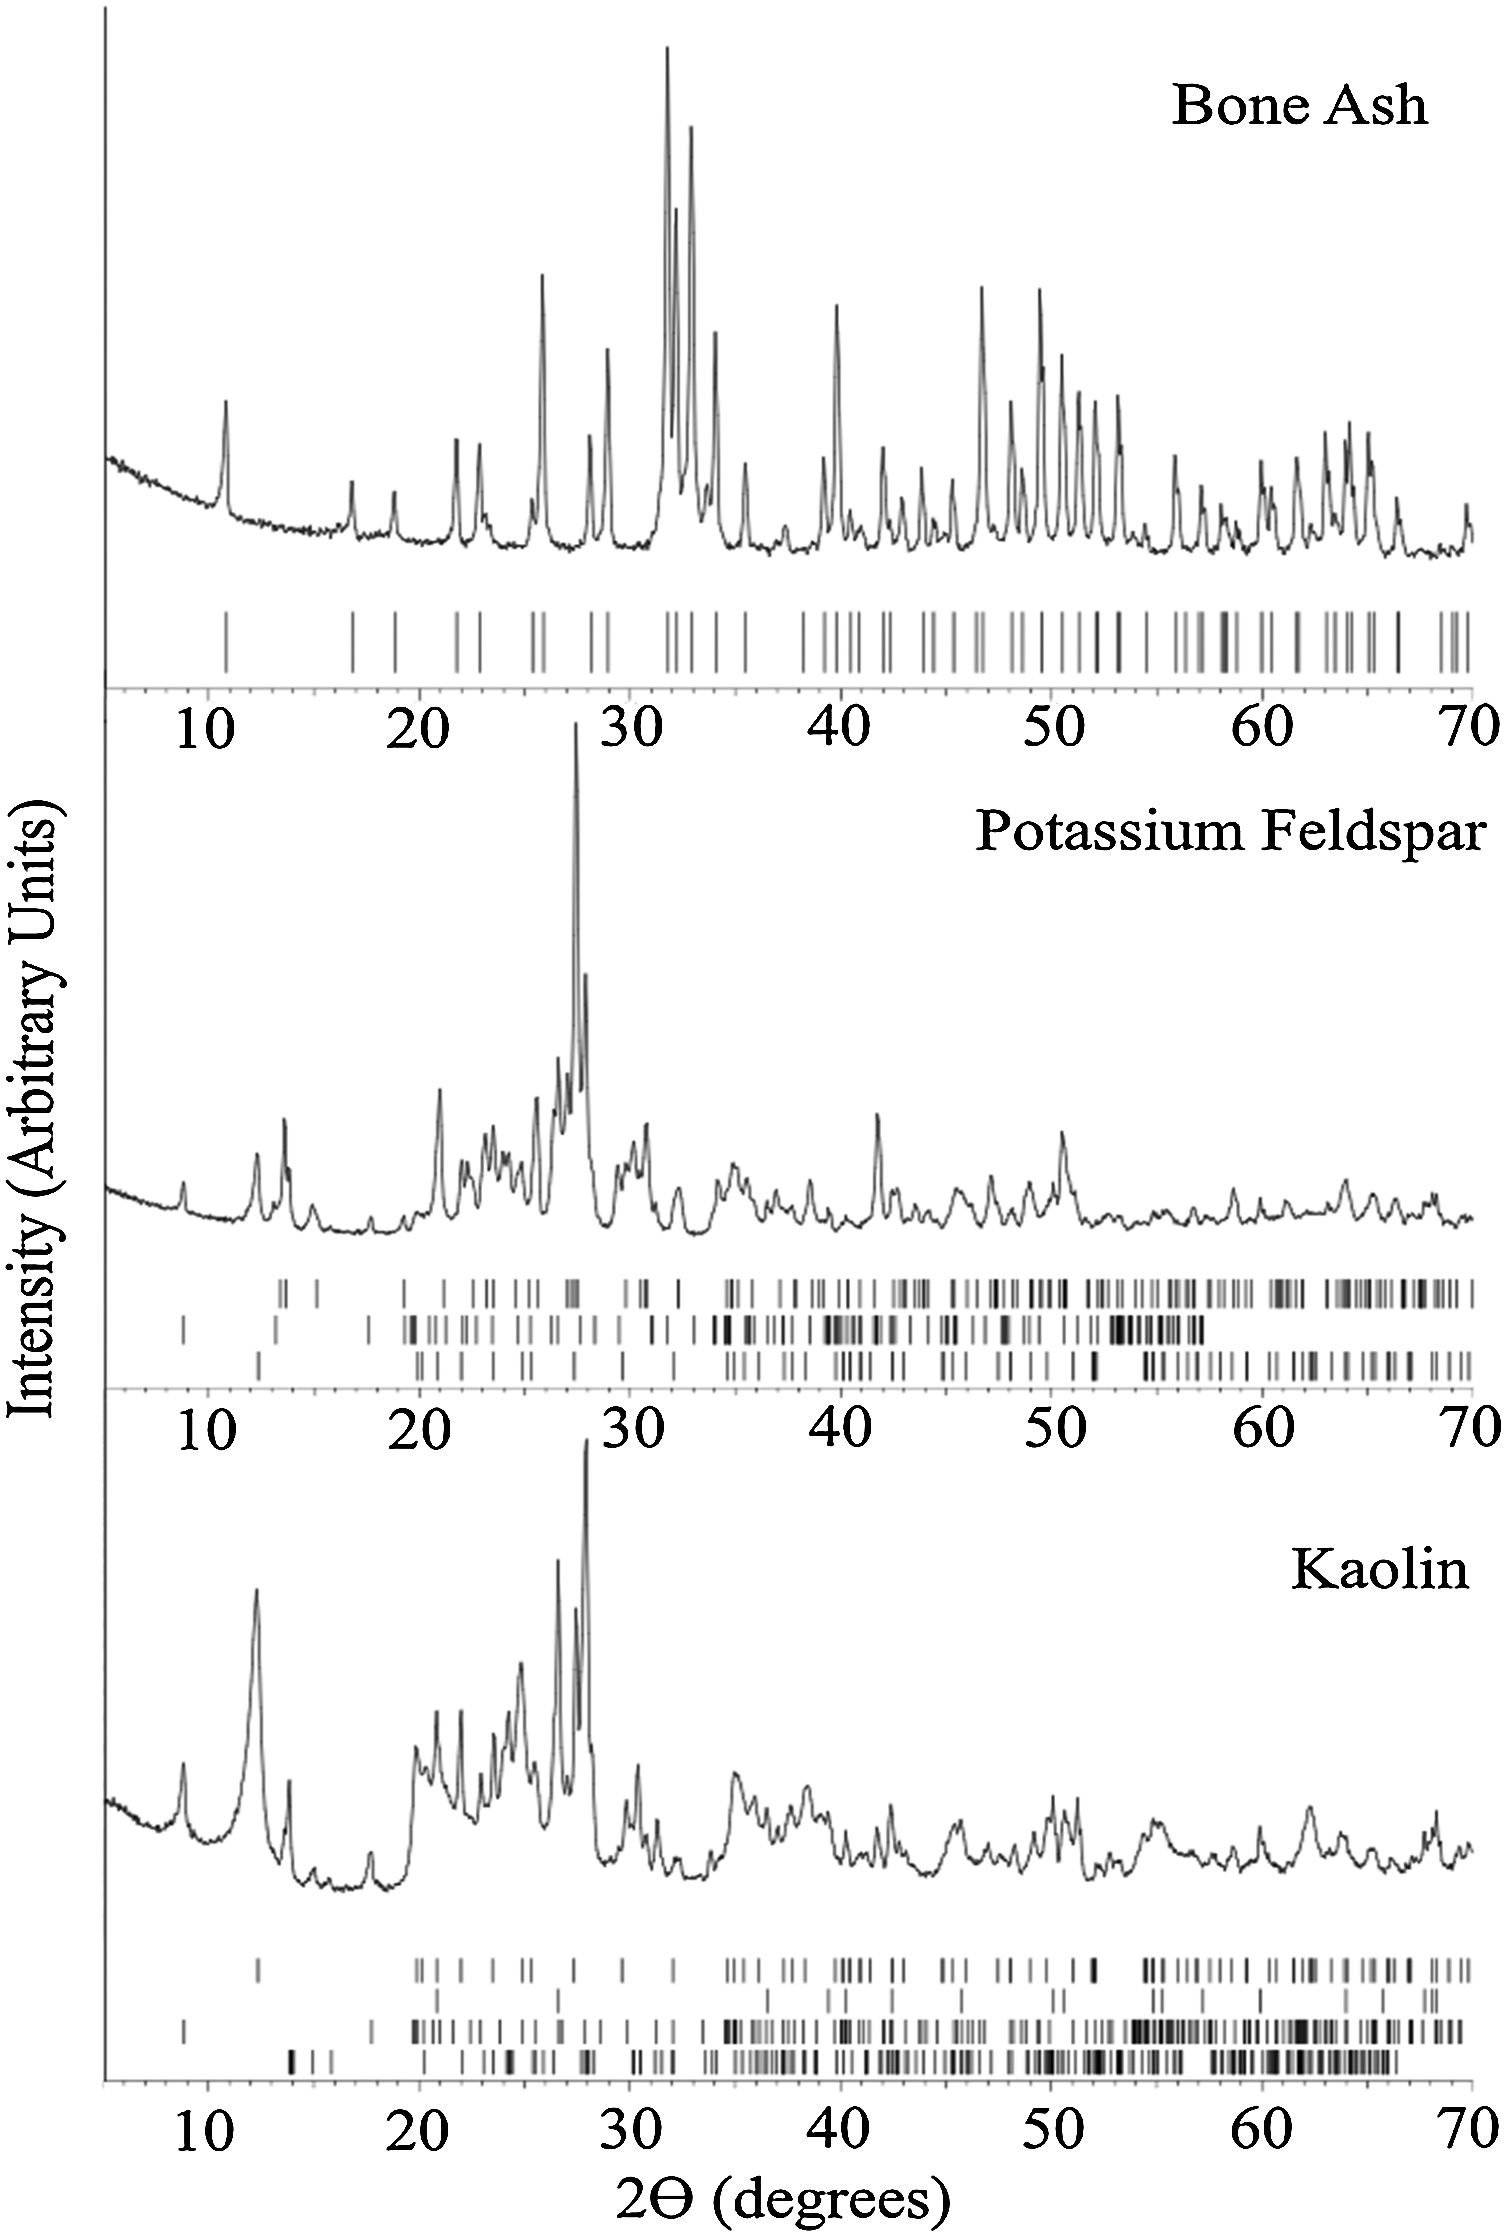
X-ray diffraction analysisFig. 2 summarizes the XRD results for the bone china raw materials. XRD of bone ash calcined at 1250°C indicates hydroxyapatite as the predominant phase, in agreement with results obtained by Miyahara et al. [31] and Zhang et al. [28]. In fact, despite decomposition of hydroxyapatite into β-TCP begins at 775°C [8], after calcination at 1250°C, β-TCP re-reacts back to hydroxyapatite by the uptake of air moisture [29].
; Potassium Feldspar – feldspar (COD 9000768), muscovite (COD 9012886), and kaolinite (COD 9014999), and Kaolin – kaolinite (COD 9014999), quartz (COD 9009666), muscovite (COD 9005013), and albite (COD 9000783).")
Raw materials’ XRD patterns at room temperature. The ticks at the bottom of each panel represent the expected positions for Bragg peaks originating, from top to bottom: Bone ash – hydroxyapatite (COD 9013627); Potassium Feldspar – feldspar (COD 9000768), muscovite (COD 9012886), and kaolinite (COD 9014999), and Kaolin – kaolinite (COD 9014999), quartz (COD 9009666), muscovite (COD 9005013), and albite (COD 9000783).
For the potassium feldspar, the XRD analysis indicated muscovite, kaolinite, and feldspar as the predominant phases. For kaolin, kaolinite, quartz, muscovite, and albite were identified.
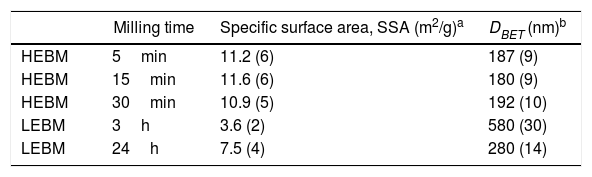
Raw materials after millingSpecific surface areaTable 2 summarizes the results obtained for the specific surface area and DBET for the raw materials mixture after milling. In terms of particle comminution, HEBM is more efficient than LEBM, even comparing results obtained for samples prepared by HEBM 5min and LEBM 24h. The results for the three HEBM times (5, 15, and 30min) were all very similar, thus indicating that grinding times longer than 5min would not significantly increase the specific surface area of bone china raw materials. Accordingly, further testing and analysis were restricted to samples prepared by LEBM for 3 and 24h and HEBM for 5min.
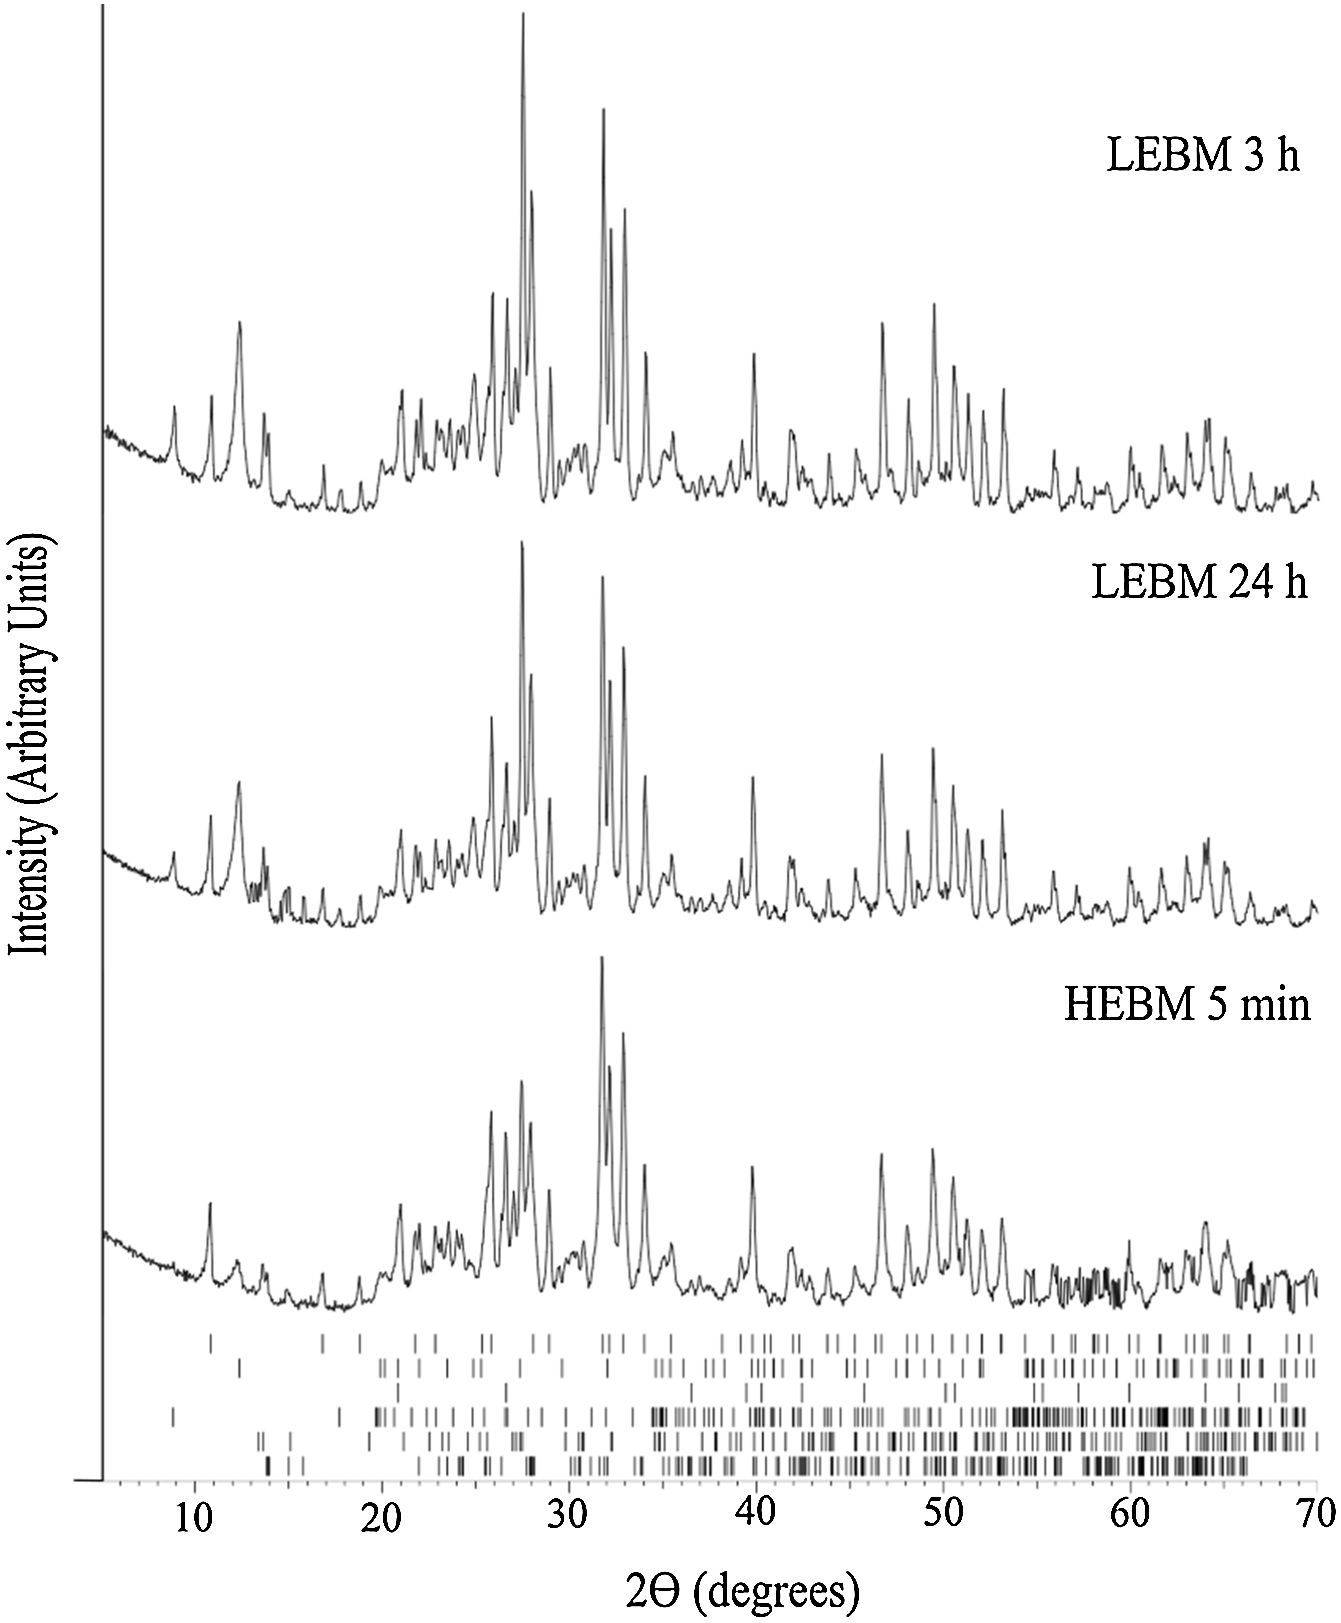
X-ray diffraction analysisFig. 3 exhibits the XRD results for the unfired samples prepared by HEBM 5min, and LEBM 3h and 24h. While the milling process does not affect phase composition, it is possible to observe that some Bragg peaks from kaolinite, at 12.4° (0 0 2¯), 24.9° (0 0 4¯), and 27.5° (0 2¯3¯), and muscovite, at 8.8° (0 0 2) and 17.7° (0 0 4), exhibit a significant reduction of amplitude in the XRD pattern of the HEBM sample. This is because kaolinite and muscovite undergo preferential orientation in the unmilled sample, due to their plate morphology. Under HEBM, these plates are broken, thus reducing the effect of preferential orientation in the mounting of the powder sample for XRD analysis [33].
, kaolinite (COD 9014999), quartz (COD 9009666), muscovite (COD 9005013), feldspar (COD 9000768) and albite (COD 9000783).")
XRD results of LEBM and HEBM unfired samples. The ticks at the bottom represent the expected positions for Bragg peaks originating, from top to bottom, hydroxyapatite (COD 9013627), kaolinite (COD 9014999), quartz (COD 9009666), muscovite (COD 9005013), feldspar (COD 9000768) and albite (COD 9000783).
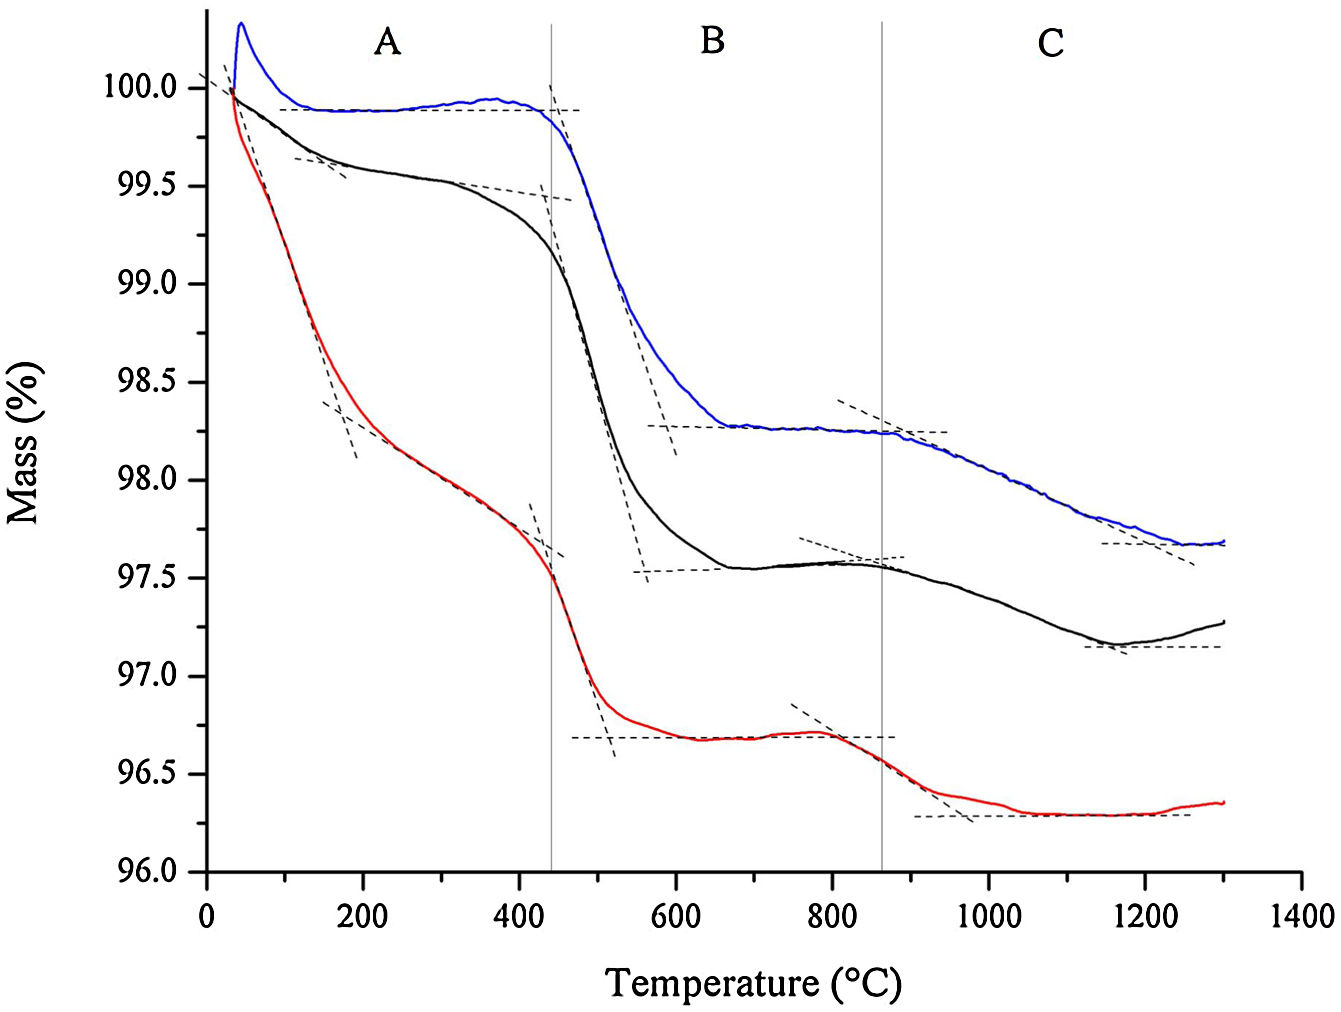
The results from thermogravimetric analysis (TGA) of bone china raw materials, as obtained after HEBM 5min and LEBM 3h and 24h, are represented in Fig. 4.
, LEBM 24h (black) and 3h (blue). The mass loss labeled A, B, C can be attributed to the (A) loss of free and weakly water, (B) dehydroxylation of kaolinite, and (C) conversion of hydroxyapatite into β-TCP.")
Thermogravimetric analysis of the raw materials mixture prepared by HEBM 5min (red), LEBM 24h (black) and 3h (blue). The mass loss labeled A, B, C can be attributed to the (A) loss of free and weakly water, (B) dehydroxylation of kaolinite, and (C) conversion of hydroxyapatite into β-TCP.
Three main mass loss is apparent in the thermogravimetric results depicted in Fig. 4. The first one is the loss of free and weakly bonded water up to 200°C in the samples prepared by LEBM 3h and 24h. The corresponding mass loss for the HEBM 5min sample extends up to around 400°C, and it is more pronounced than in the other two samples. The more significant mass loss for the HEBM 5min sample can be attributed to the breaking of hydroxyl groups from kaolinite upon high-energy milling [34]. These hydroxyls, which are retained in the sample, adsorbed to the particle surface, are then released as water upon heating up to 400°C.
The second mass loss, from 400°C to around 600°C, can be attributed to the dehydroxylation of kaolinite. This mass loss corresponding to this event is less pronounced in the sample prepared by HEBM, as expected.
Finally, the third mass loss, above 800°C, can be attributed to the conversion of hydroxyapatite into β-TCP. The onset temperature this transformation is almost 100°C less in the HEBM sample, thus suggesting the influence of milling on the conversion of hydroxyapatite into β-TCP.
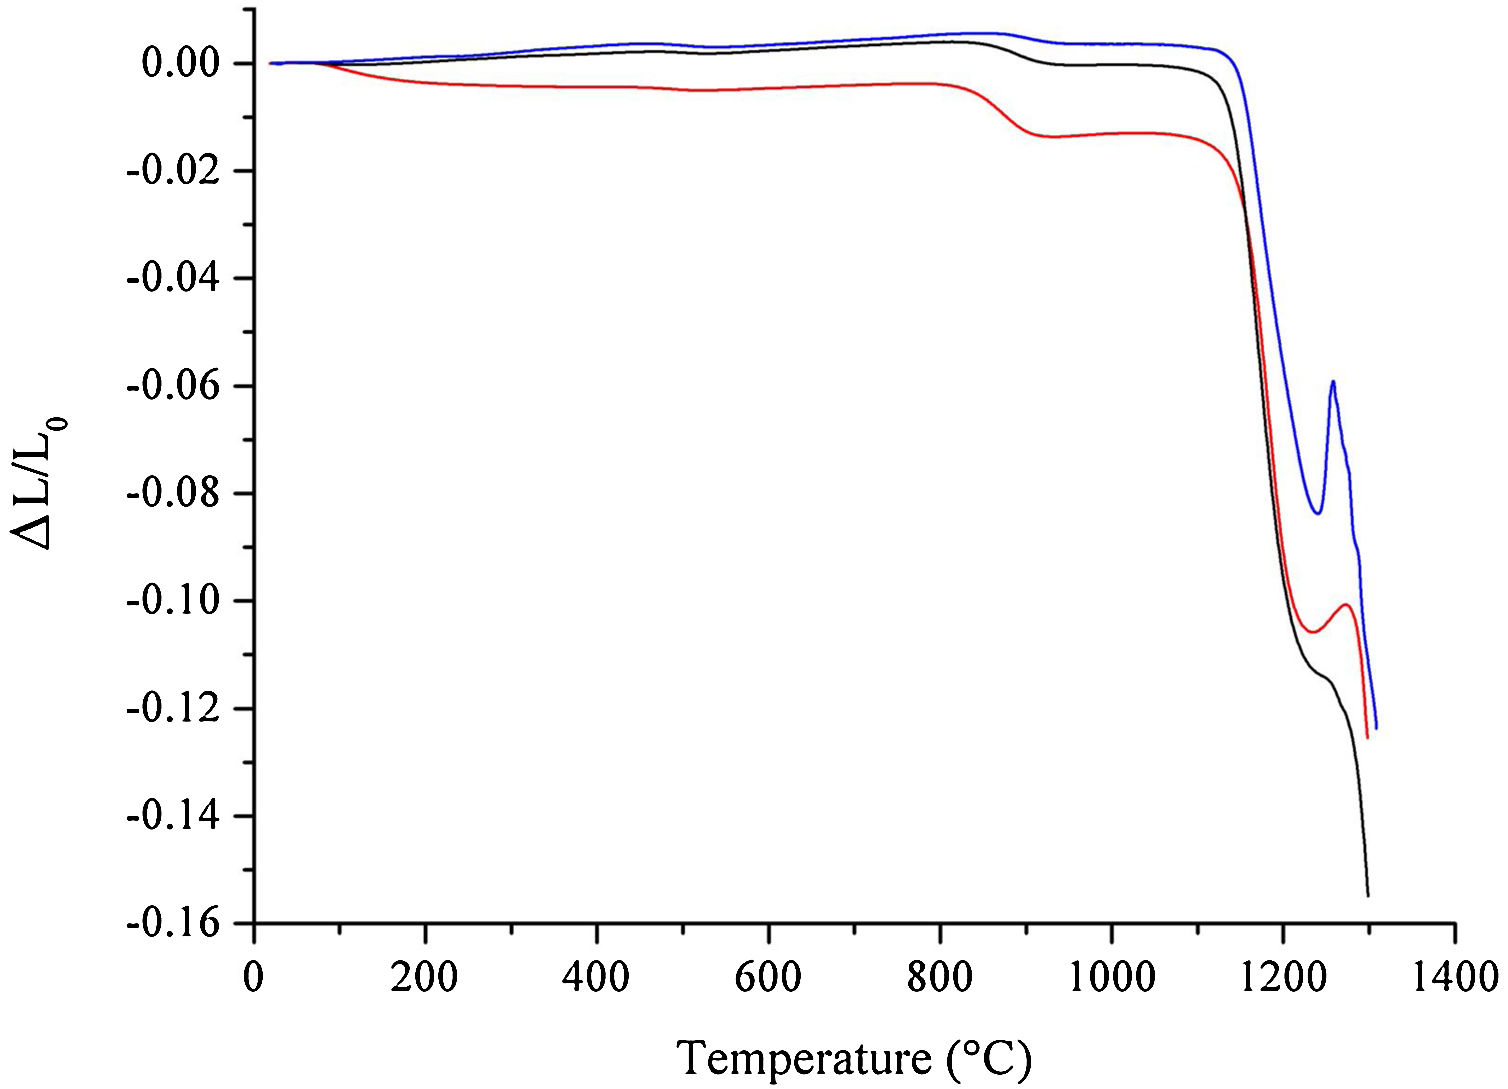
The results from the dilatometric analysis of raw materials after milling are shown in Fig. 5. The HEBM 5min sample exhibits an initial shrinkage of less than 1% that can be attributed to water loss, as already discussed above. A second thermal event, above 800°C, corresponds to the shrinkage due to the conversion of hydroxyapatite into β-TCP. Interestingly, the shrinkage associated with this transformation is more pronounced in the HEBM 5min sample, despite the corresponding weight loss being almost the same as those observed for the LEBM samples. The onset temperature for the formation of β-TCP, 830°C, 853°C, and 878°C for HEBM 5min, LEBM 24h, and LEBM 3h, respectively, follows the same trend exhibited by the corresponding weight loss, as observed in the TGA curves. The onset temperature of sintering is around 1140°C for LEBM 24h and HEBM 5min and 1155°C for LEBM 3h samples. The peak between 1250°C and 1300°C is possibly due to TCP (β→α) transformation [29].
Bone chinaX-ray diffraction analysis, LEBM 24h (black), and 3h (blue).")
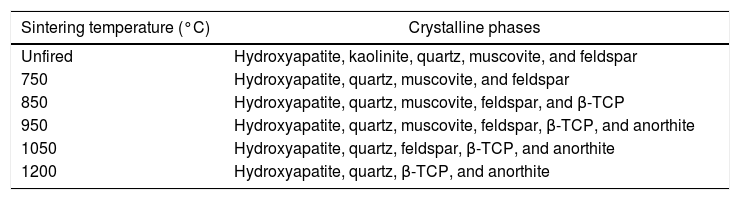
Table 3 summarizes the constituent phases of bone china sintered at different temperatures, as determined by XRD analysis.
Constituent phases present in the mixture of raw materials and bone china, sintered at increasingly higher temperatures [8].
| Sintering temperature (°C) | Crystalline phases |
|---|---|
| Unfired | Hydroxyapatite, kaolinite, quartz, muscovite, and feldspar |
| 750 | Hydroxyapatite, quartz, muscovite, and feldspar |
| 850 | Hydroxyapatite, quartz, muscovite, feldspar, and β-TCP |
| 950 | Hydroxyapatite, quartz, muscovite, feldspar, β-TCP, and anorthite |
| 1050 | Hydroxyapatite, quartz, feldspar, β-TCP, and anorthite |
| 1200 | Hydroxyapatite, quartz, β-TCP, and anorthite |
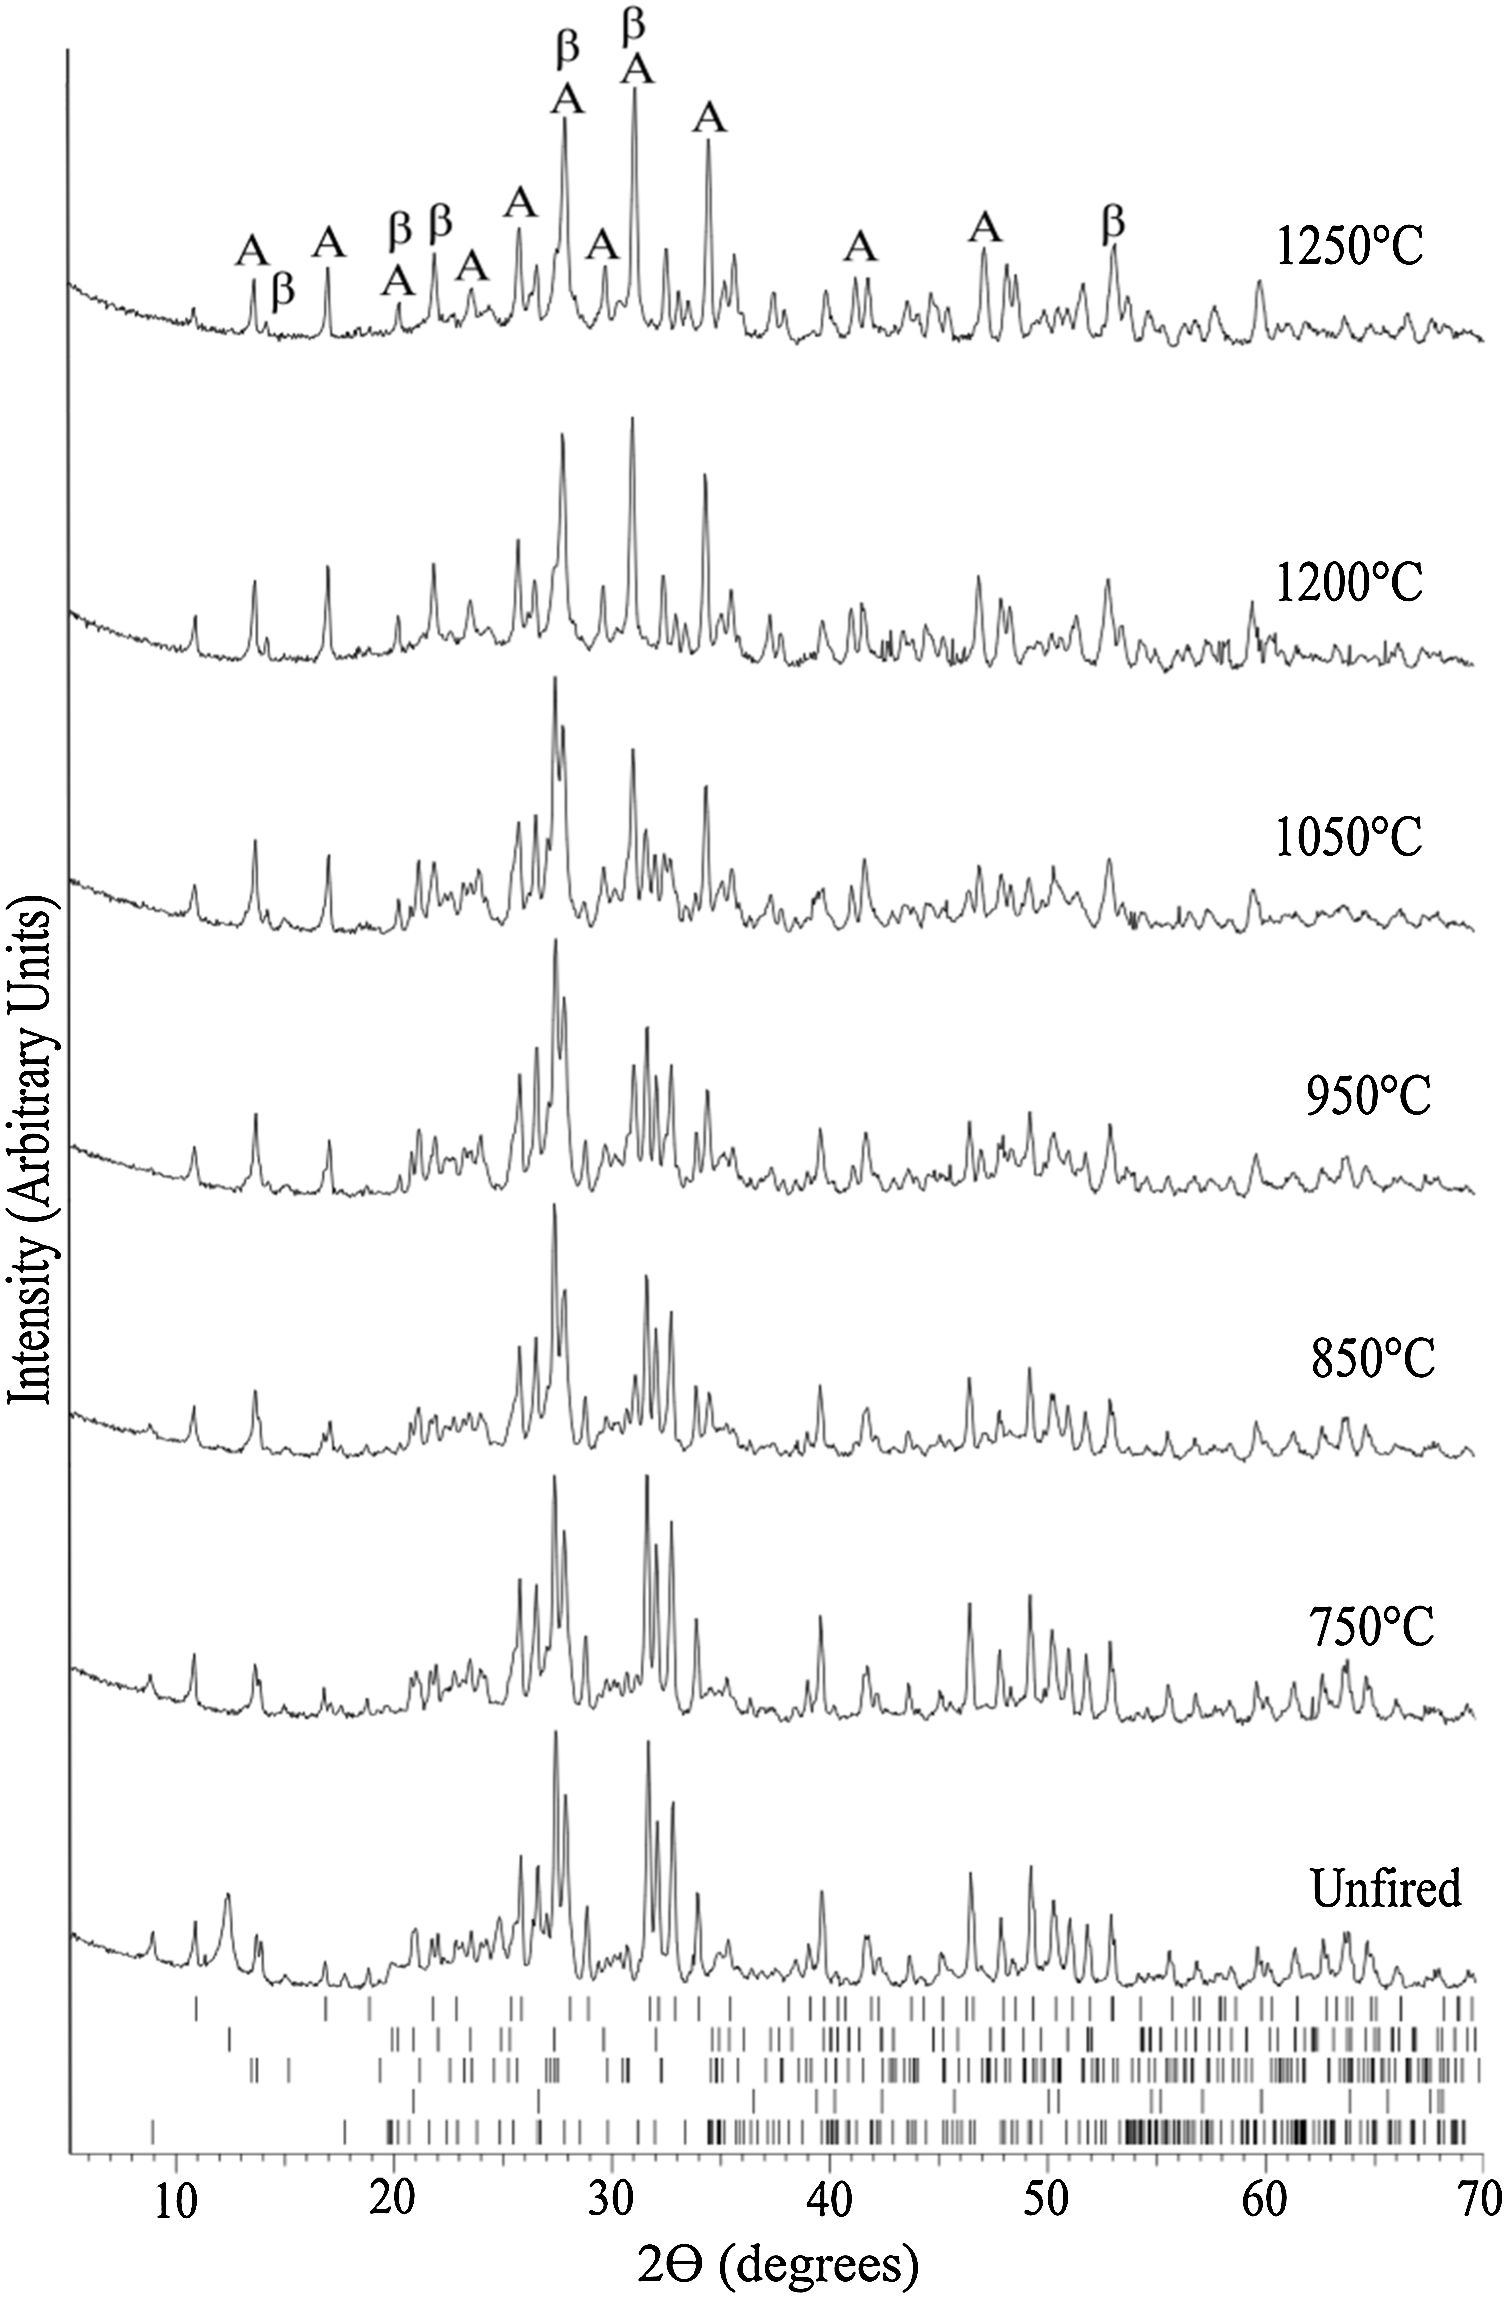
The evolution of the XRD pattern upon increasing sintering temperature is represented in Fig. 6. The main phases for the unfired sample correspond to the raw materials constituent phases, i.e., hydroxyapatite, kaolinite, quartz, muscovite, and feldspar.
, kaolinite (COD 9014999), quartz (COD 9009666), muscovite (COD 9005013), and feldspar (COD 9000768). In the top XRD pattern, A stands for anorthite (COD 1000034) and β for β-TCP (COD 9005865).")
Evolution of the XRD pattern at room temperature of bone china sintered at increasingly higher temperatures. The ticks at the bottom represent the expected positions for Bragg peaks originating from, top to bottom, hydroxyapatite (COD 9013627), kaolinite (COD 9014999), quartz (COD 9009666), muscovite (COD 9005013), and feldspar (COD 9000768). In the top XRD pattern, A stands for anorthite (COD 1000034) and β for β-TCP (COD 9005865).
At 750°C, the kaolinite has already transformed into metacaulinite and, accordingly, is no longer observed in the XRD pattern. On the other hand, hydroxyapatite has not yet transformed into β-tricalcium phosphate (β-TCP), as this transformation is expected to occur only above 775°C [8]. In fact, in the XRD of bone china sintered at 850°C, hydroxyapatite, quartz, muscovite, feldspar, and β-TCP were identified. The presence of hydroxyapatite is still observed in the XRD pattern of bone china sintered at higher temperatures, with decreasing intensity, as the transformation into β-TCP is incomplete. At 850°C, the reaction of metacaulinite with CaO, resulting in anorthite, is expected to begin [8]. However, anorthite was not detected in the sample previously sintered at this temperature, is detected only in the sample sintered at 950°C [7].
In the XRD pattern of the sample sintered at 1050°C, it is possible to observe a significant increase (decrease) of the intensity of the Bragg peaks from β-TCP (hydroxyapatite). This trend continues at 1200°C, as the transformation of hydroxyapatite into β-TCP proceeds, but it is not yet complete. Moreover, muscovite is no longer detected and, consequently, anorthite and β-TCP stand out. The presence of hydroxyapatite in bone china sintered up to 1200°C can be explained by the reaction back of β-TCP upon moisture uptake after sintering, as commented before [29].
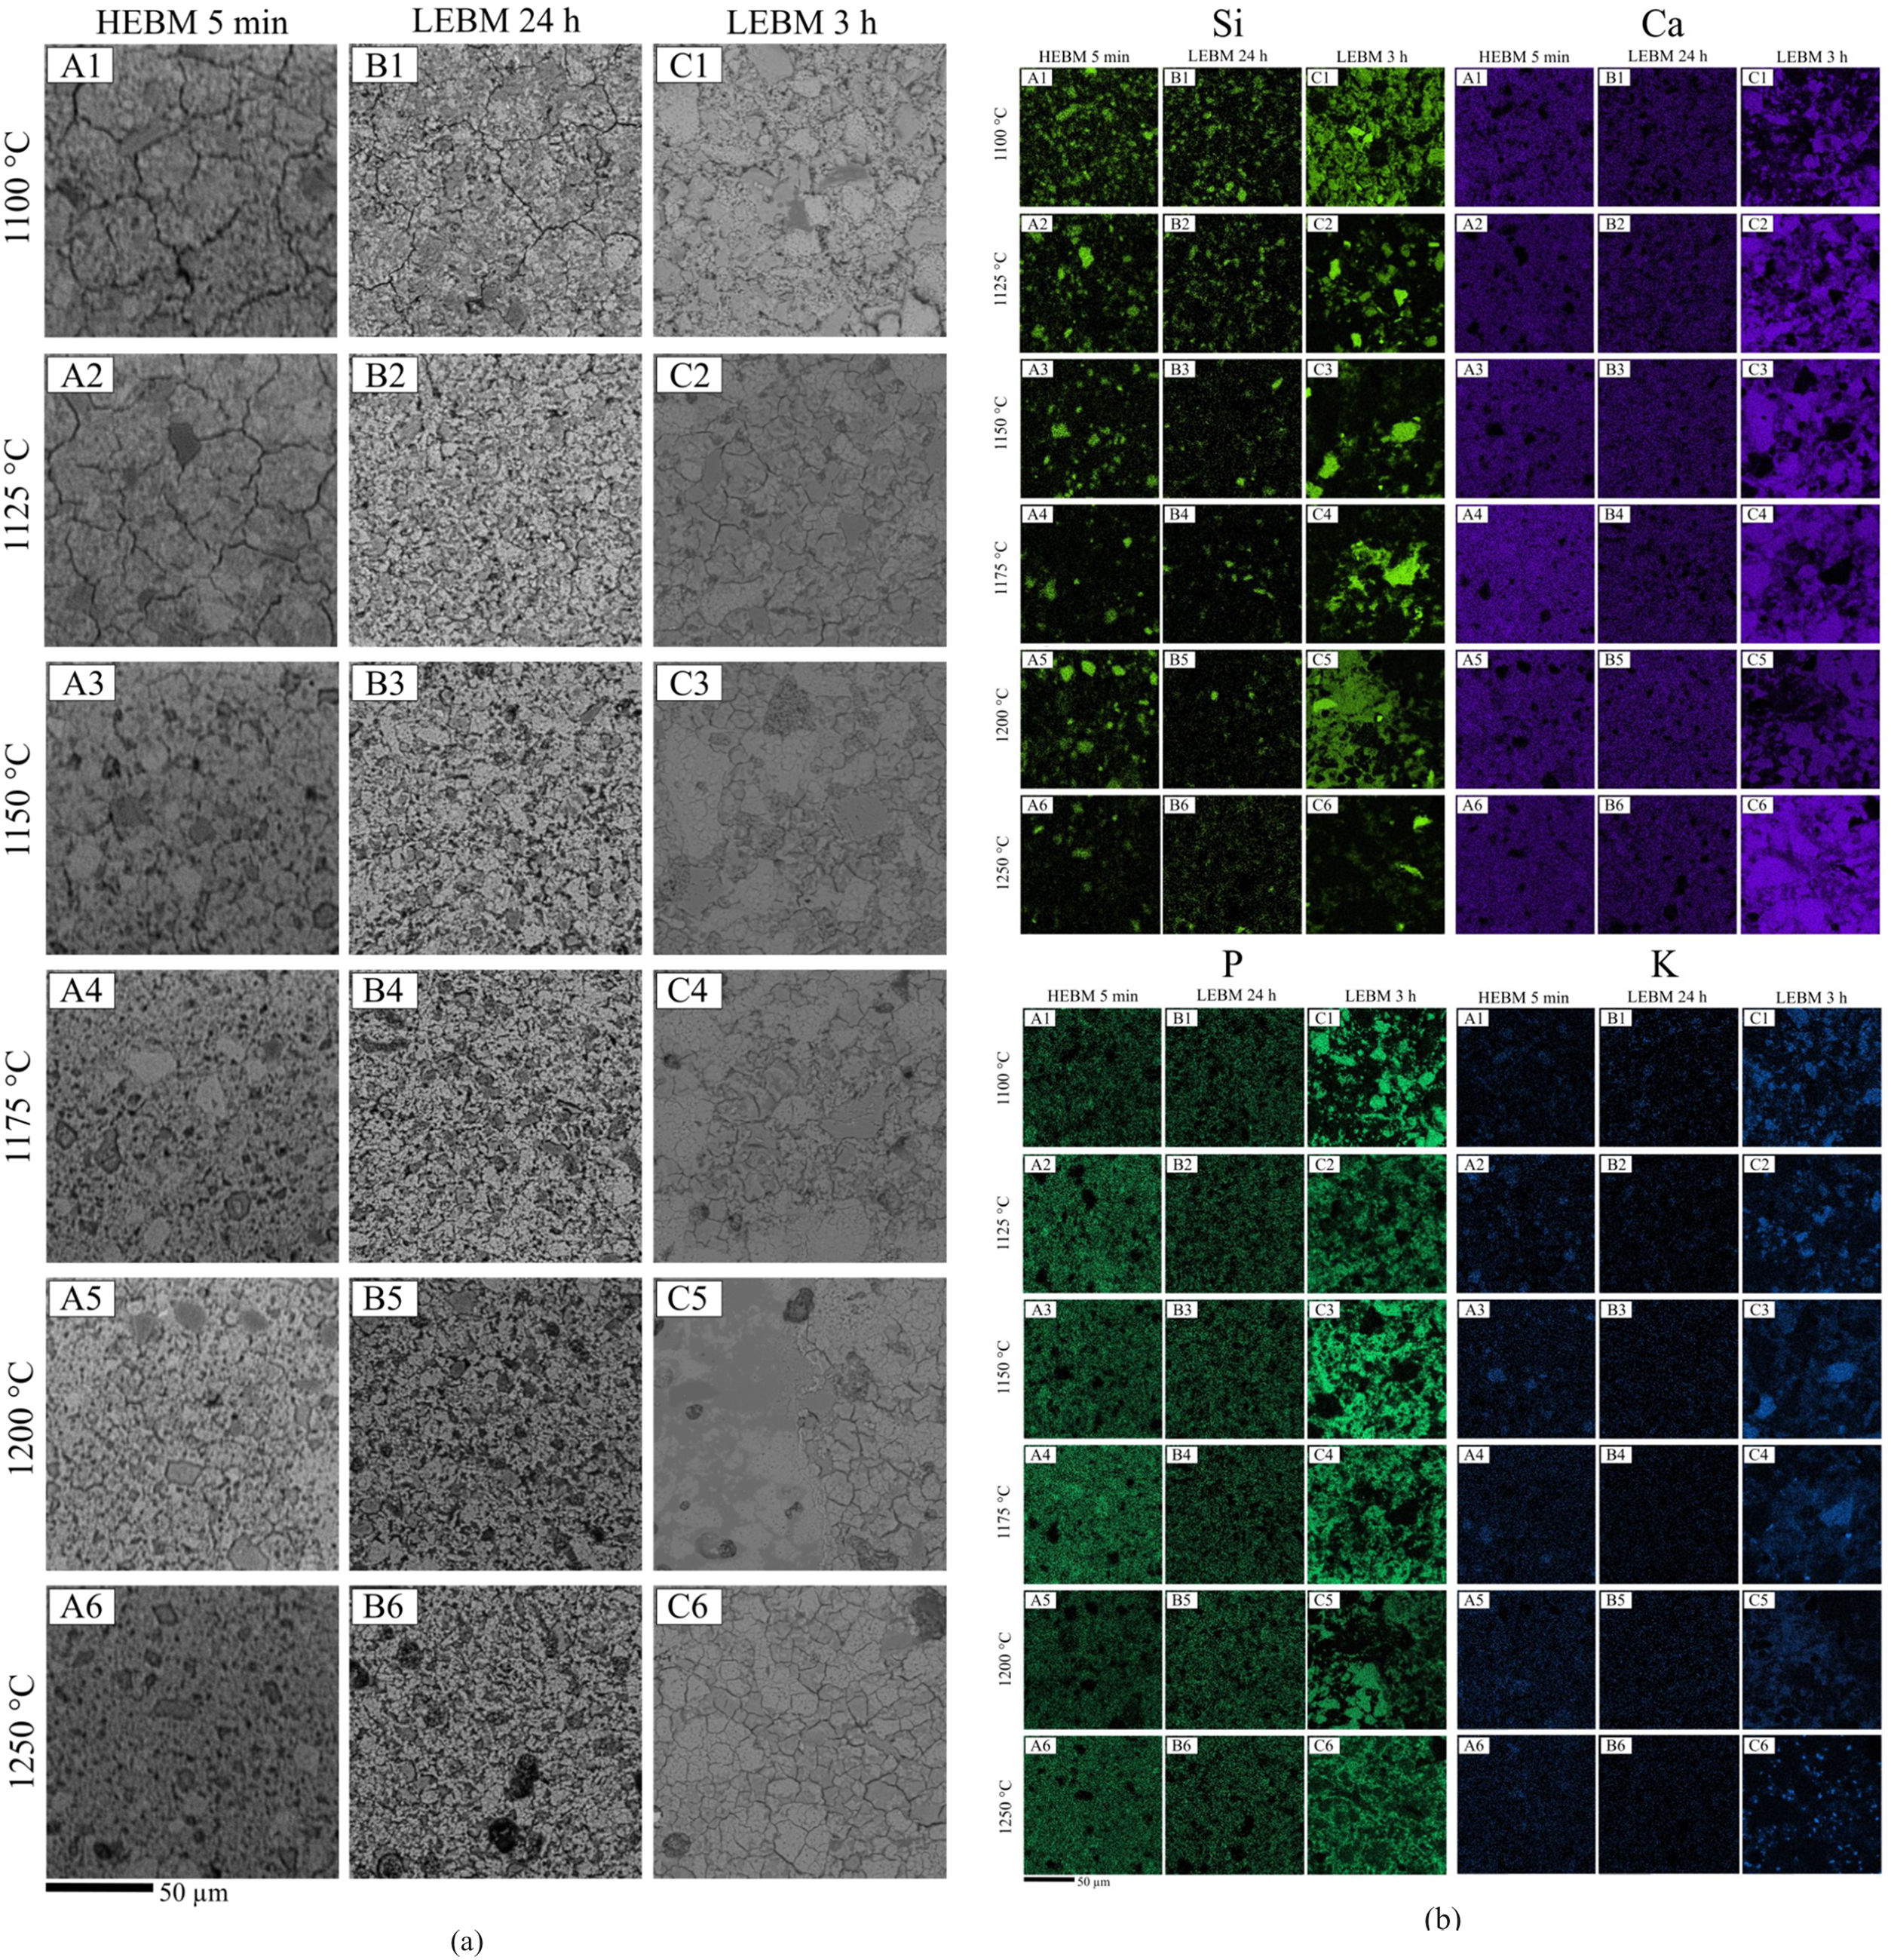
MicrostructureScanning electron microscopy (SEM) images of polished and chemically etched bone china samples are shown in Fig. 7(a). Chemical composition maps representing Ca, P, Si, and K are shown in Fig. 7(b).
 SEM secondary electrons images of bone china samples and (b) elemental composition maps (Si-light green, Ca-purple, P-green, and K-blue) – 1000× magnification. A: HEBM 5min, B: LEBM 24h, and C: LEBM 3h.")
The microcracks in the sintered ceramic body, observed regardless of the milling method used for sample preparation, are due to the relief of internal stresses in the ceramic body (generated by the thermal expansion mismatch between the matrix and grains of β-TCP) by the chemical etching with 5% HF acid [8,35].
Only minor differences are observed by comparing the microstructure from HEBM 5min and LEBM 24h samples. Samples prepared by LEBM 24h appear to be only slightly more homogeneous than those made by HEBM 5min (Fig. 7(a) – (A2) and (B2)). The sample prepared by LEBM 3h, on the other hand, exhibit a distinct microstructure, as compared to the other two samples. In fact, the LEBM 3h method was less efficient in terms of particle comminution and homogenization of the raw materials, as is particularly evident in the secondary electrons SEM image from the sample sintered at 1100°C and, also, by comparing the larger and irregular quartz and feldspar grains observed in the Si and K maps of Fig. 7(b) – (C3) and (C4) with those in (A3), (B3), (A4) and (B4). The larger grain size observed in LEBM 3h – Fig. 7(a) (C1) is also in agreement with the specific area surface results discussed in Section 3.2.1.
Samples prepared by LEBM 3h exhibit greater porosity and low homogeneity, and, for these samples, sintering with liquid phase may occur non-uniformly. Indeed, pores larger than grains, are more difficult to eliminate during sintering, even with the formation of the liquid phase [36].
The calcium (Ca) and phosphorus (P) are dispersed in the samples, as can be seen in Fig. 7(b), forming β-TCP. According to the literature, most of Ca and P contributes to the formation of the vitreous phase in bone china [37].
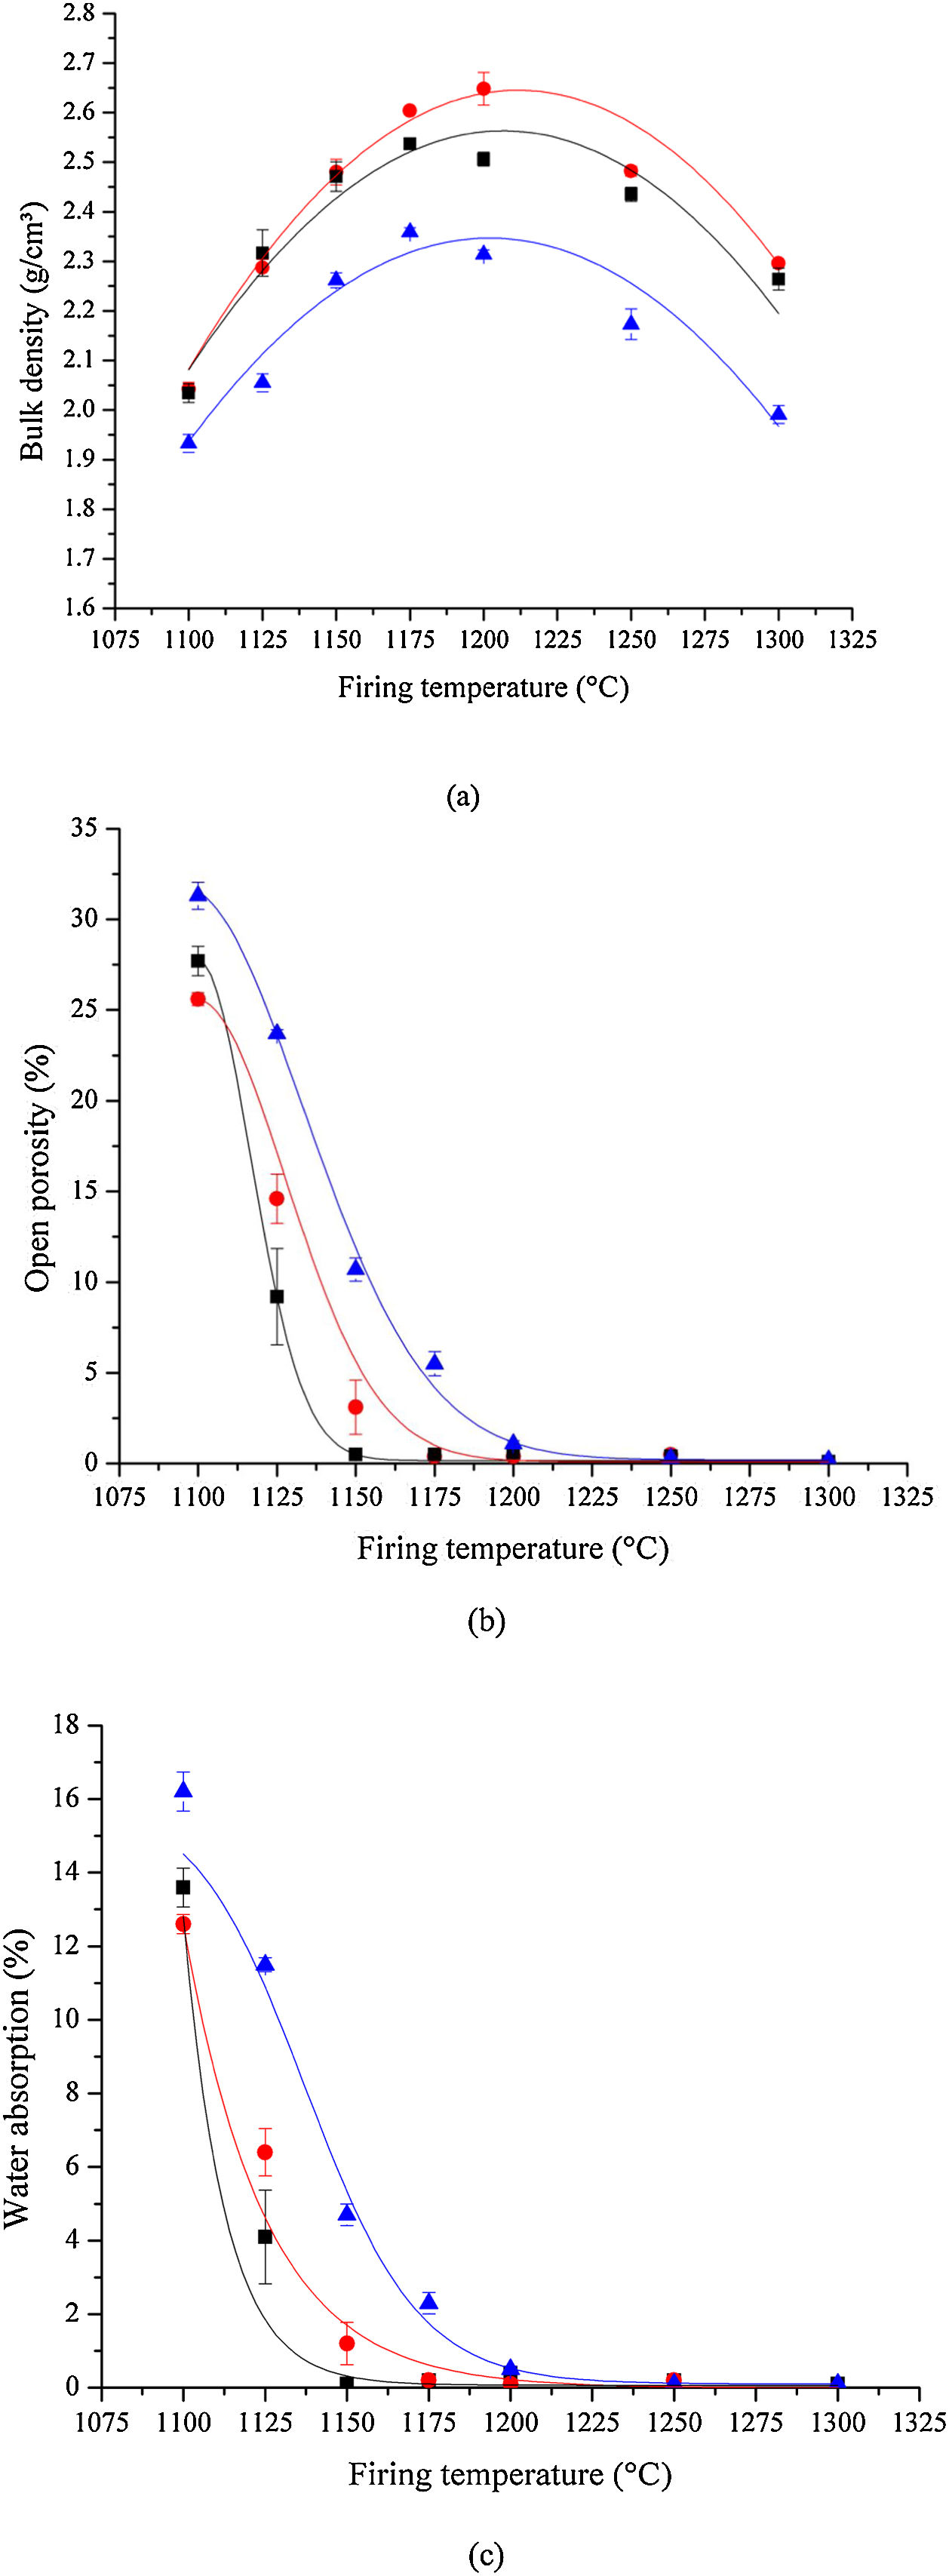
Density, porosity, and water absorptionThe room temperature bulk densities for samples sintered at increasingly higher temperatures are shown in Fig. 8(a). The bulk density reaches a maximum of 2.65g/cm3 for the sample prepared by HEBM 5min and sintered at 1200°C, being approximately 4.4% greater than that for the LEBM 24h sample. Regardless of the milling method, the bulk density reaches a maximum for bone china samples sintered near 1200°C. The lower density of samples prepared by LEBM 3h, compared to LEBM 24h and HEBM 5min, is not altered even after the onset of liquid-phase-assisted sintering above 1150°C. In fact, smaller particle sizes and greater homogeneity of the mixture of the raw materials tend to improve the densification of the ceramic body [38].
 bulk density, (b) open porosity, and (c) water absorption as a function of sintering temperature. HEBM 5min (red), LEBM 24h (black) and 3h (blue). Lines are just guides to the eyes. Observe the reduction of bulk density for samples sintered at 1250°C – see text for discussion.")
Room temperature bone china's, (a) bulk density, (b) open porosity, and (c) water absorption as a function of sintering temperature. HEBM 5min (red), LEBM 24h (black) and 3h (blue). Lines are just guides to the eyes. Observe the reduction of bulk density for samples sintered at 1250°C – see text for discussion.
The results of open porosity and water absorption analysis are shown in Fig. 8(b and c). Open porosity and water absorption both are reduced appreciably with temperature and become essentially null in samples sintered at 1200°C and above. This tendency is more pronounced in samples prepared by LEBM 24h and HEBM 5min, in contrast to LEBM 3h, for which higher sintering temperatures are needed to reach a given open porosity and water absorption value. Not surprisingly, open porosity and water absorption become null at a sintering temperature in which liquid-assisted sintering is well underway, as can be observed in the dilatometric results shown in Fig. 5[39–41]. At this point of sintering, open pores are closed, and optimum sintering is achieved when open porosity or water absorption reaches their minimum near zero [41]. At the same time, regardless of the milling method, bulk density reaches its maximum, as already mentioned. After this point, a further increase in sintering temperature reduces bulk density due to volume expansion caused by the increasing pressure of the gas trapped in closed pores [40]. It is noteworthy is less than expected from the general trend, possibly due to the volume increase in the phase transition from β – TCP to α – TCP [29].
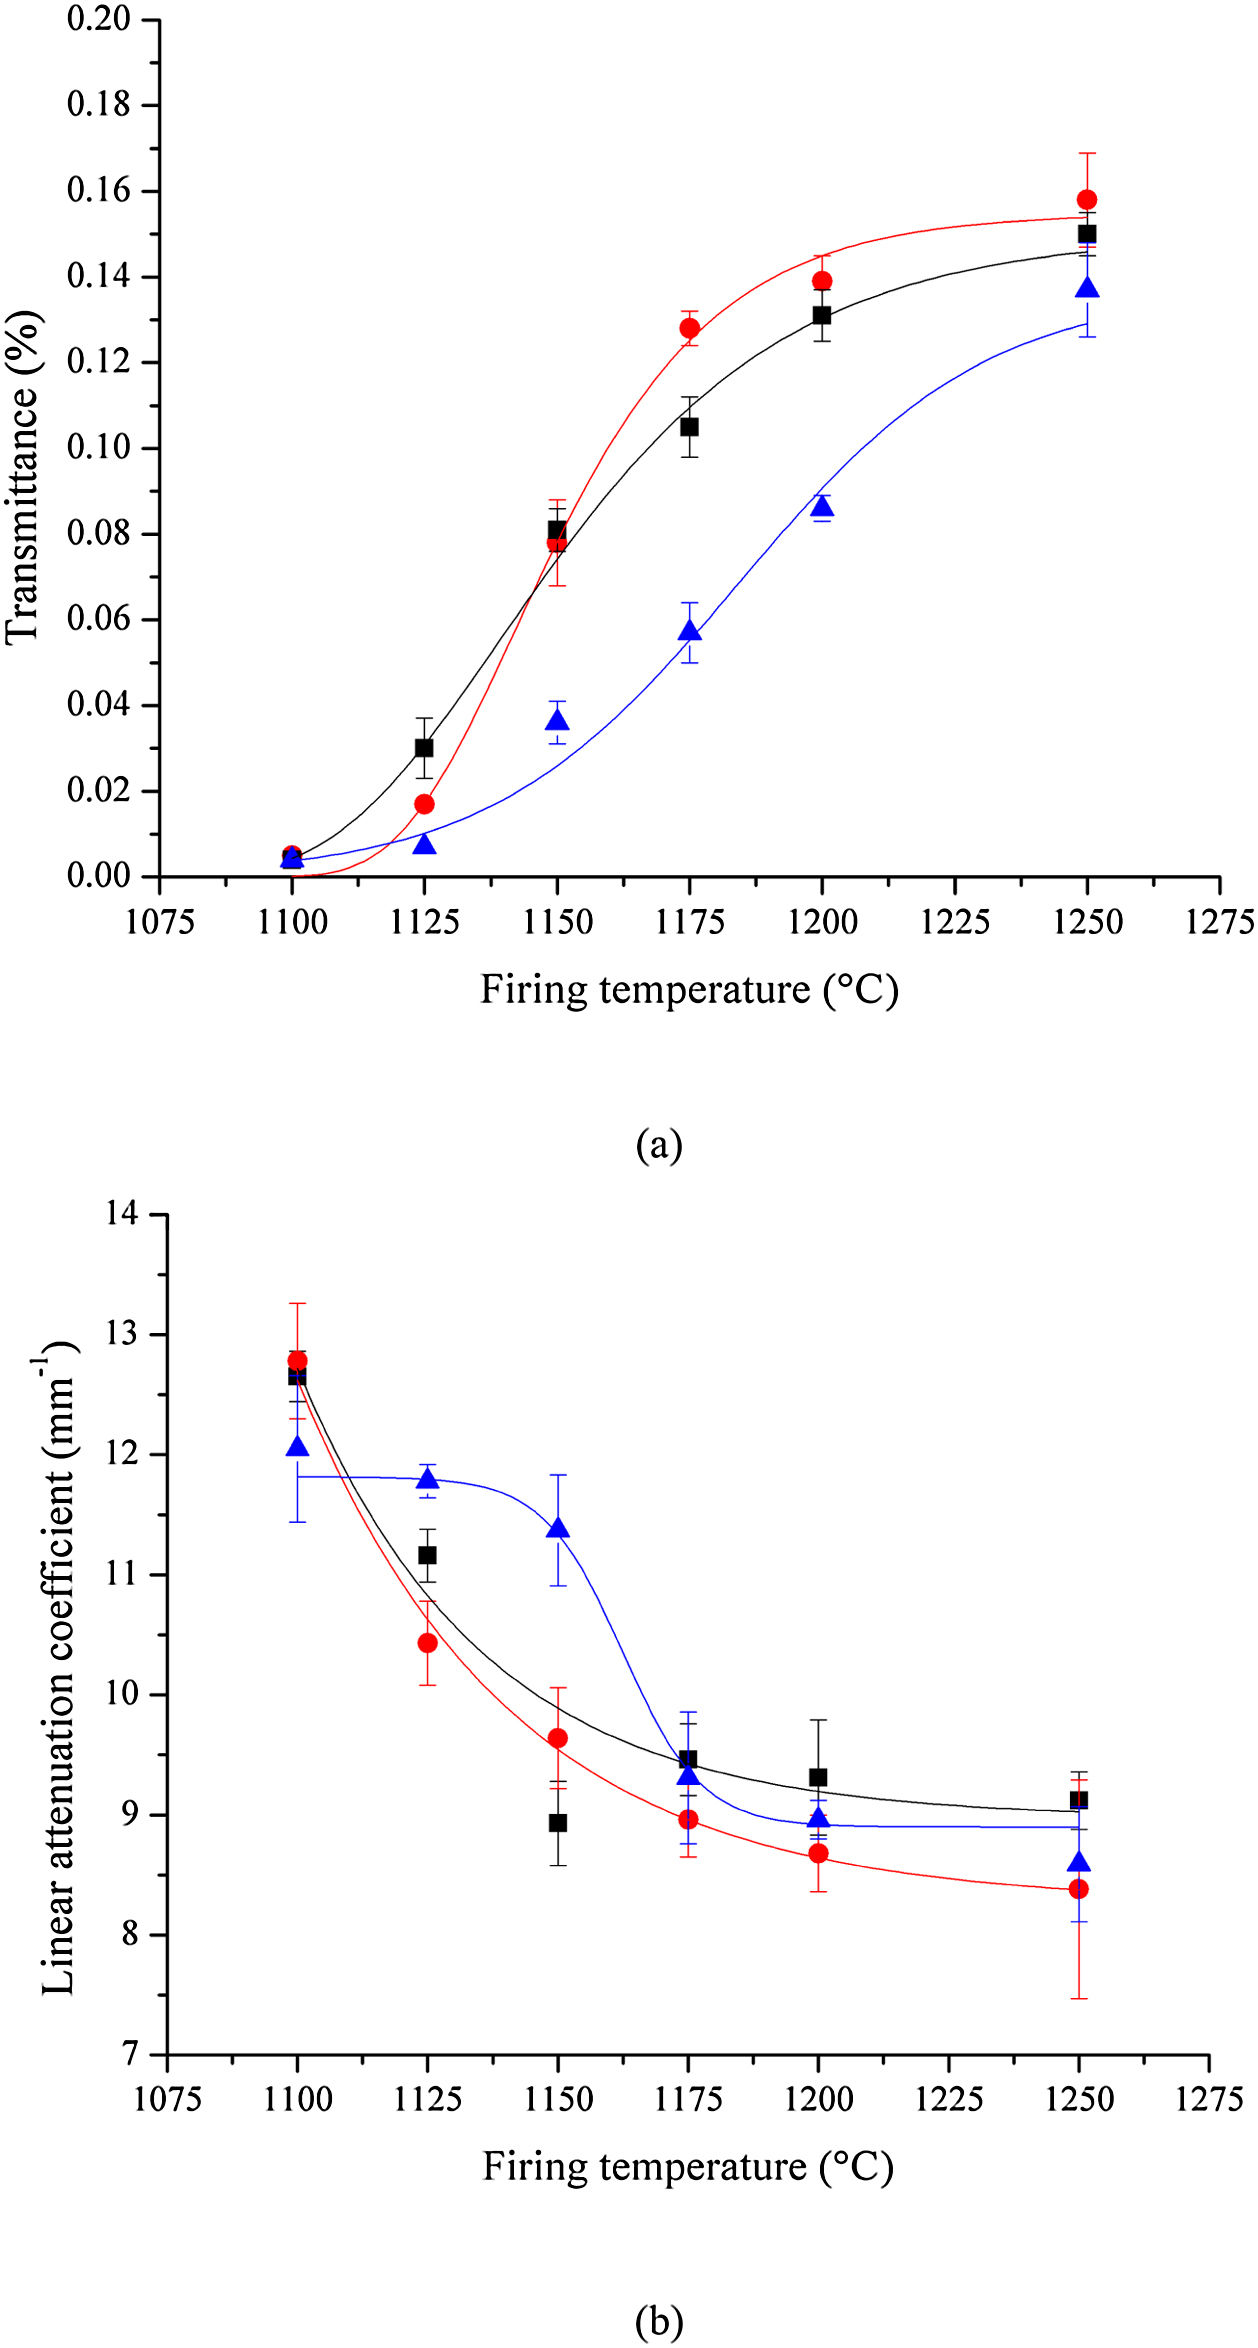
Optical transmittanceThe results of the optical transmittance tests at 550nm are shown in Fig. 9(a). Translucency increases with sintering temperature, regardless of the milling method. A clearer picture emerges when transmittance data are used to calculate the sample's linear attenuation coefficient, shown in Fig. 9(b).
 transmittance and (b) linear attenuation coefficient for bone china samples prepared by HEBM/LEBM and sintered at different temperatures. HEBM 5min (red), LEBM 24h (black) and 3h (blue). Lines are just guides to the eyes.")
The linear attenuation coefficient allows a better comparison of results, given that it takes into account the effect of the sample's thickness on the optical transmittance. The analysis of results depicted in Fig. 9 indicates that samples prepared by HEBM 5min and LEBM 24h exhibit similar transmittance and linear attenuation coefficient. However, LEBM 3h sample clearly exhibits a distinct behavior. In the first stage, below 1175°C, LEBM 3h samples show poor homogeneity, broad grain size distribution, and have greater porosity. The pore surface is considered a phase boundary that exhibits a significant difference in optical properties (refractive index), relative to the ceramic body. The non-homogeneous microstructure of LEBM 3h samples, sintered below 1175°C, contributes to increasing light scattering and, consequently, have a strong influence on the linear attenuation coefficient.
In the second stage, at 1175°C and above, LEBM 3h samples start showing a linear attenuation coefficient similar to LEBM 24h and HEBM 5min. At this sintering temperature, and above, the formation of the liquid phase reduces porosity and light scattering. Furthermore, the refractive indices of the constituent phases of bone porcelain at this sintering temperature, including the glassy phase, are all similar (around 1.53) [42,43], thus reducing the linear attenuation coefficient to something near 9mm−1, regardless the milling process [44].
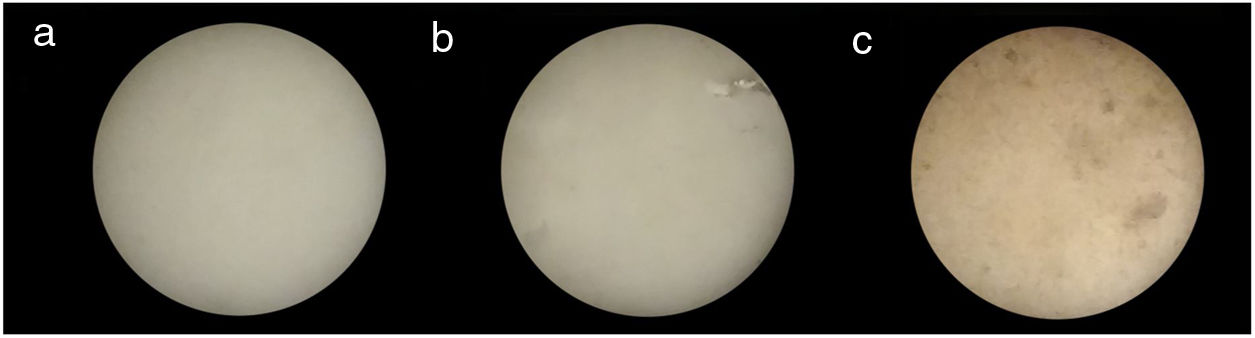
Fig. 10 shows three bone china samples sintered at 1200°C. While the visual aspect of samples prepared by HEBM 5min and LEBM 24h is very similar, the LEBM 3h sample is less homogeneous, despite having similar linear attenuation coefficient.
Mechanical properties and micro-abrasion wear coefficient HEBM 5min, (b) LEBM 24h, and (c) LEBM 3h. The samples present ø10mm.")
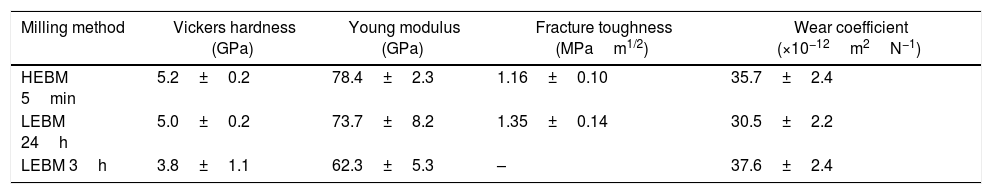
Some mechanical properties and micro-abrasion wear coefficient for bone china prepared by HEBM 5min, LEBM 24h, and LEBM 3h, and sintered at 1200°C, are summarized in Table 4. Vickers hardness, Young modulus, and indentation fracture toughness are the same, within the corresponding uncertainties, for samples prepared by HEBM 5min and LEBM 24h. The same applies, also, to the micro-abrasion wear coefficient. The Young modulus obtained for these samples compares well to the value reported by Batista et al., namely 76GPa [4].
Vickers hardness, Young modulus, indentation fracture toughness, and wear coefficient of bone china sintered at 1200°C.
| Milling method | Vickers hardness (GPa) | Young modulus (GPa) | Fracture toughness (MPam1/2) | Wear coefficient (×10−12m2N−1) |
|---|---|---|---|---|
| HEBM 5min | 5.2±0.2 | 78.4±2.3 | 1.16±0.10 | 35.7±2.4 |
| LEBM 24h | 5.0±0.2 | 73.7±8.2 | 1.35±0.14 | 30.5±2.2 |
| LEBM 3h | 3.8±1.1 | 62.3±5.3 | – | 37.6±2.4 |
Samples prepared LEBM 3h, on the other hand, exhibit smaller Vickers hardness and Young modulus, and a somewhat larger wear coefficient, despite still comparable to those of the two sets of samples, considering uncertainties [4].
It was not possible to estimate the fracture toughness of LEBM 3h due to the difficulty of measuring the crack length in these heterogeneous samples. Fracture toughness was lower than those reported in the literature (from 2 to 2.3MPam1/2), but this comparison cannot go any longer because literature data were obtained by different test methods or mathematical models [4,45]. The mechanical properties of a ceramic body are expected to be highly dependent on porosity and glass content [4,45]. Nevertheless, the results for microhardness and fracture toughness were similar to those obtained for a porcelain stoneware (Vickers hardness=4.6–5.5GPa and fracture toughness=1.2–1.4MPam1/2) [46].
ConclusionsThe effect of the milling method used for the preparation of raw materials, as well as sintering temperature, on some mechanical, optical, and tribological properties of a bone china was explored by comparing 5min of high-energy ball milling (HEBM) to more conventional 3 and 24h low-energy ball milling (LEBM).
Notwithstanding the greater specific surface area of the raw materials mixture prepared by HEBM 5min, the mechanical and tribological properties of the bone china do not differ significantly from those of the porcelain prepared by LEBM 24h. Concerning optical transmittance, the milling method influences the translucency of bone up to a sintering temperature of about 1150°C. Above this temperature, the formation of the liquid phase reduces porosity and, consequently, light scattering, regardless of the milling method used to produce bone china. However, HEBM improves the homogeneity of the bone china and, accordingly, may be considered as an alternative to traditional ball milling when a better quality product is desired.
Conflict of interestThe authors declare that they have no conflict of interest.
The support from the Brazilian Government Agencies Conselho Nacional de Desenvolvimento Científico e Tecnológico (CNPq) – grants 304675/2015-6, 304831/2014-0, 305528/2018-1, and 305253/2018-2, Programa de Apoio a Núcleos de Excelência (PRONEX), Fundação de Amparo à Pesquisa do Estado do Rio Grande do Sul (FAPERGS), and Universidade de Caxias do Sul (UCS) is gratefully acknowledged. This study was also financed in part by the Coordenação de Aperfeiçoamento de Pessoal de Nível Superior – Brasil (CAPES) – Finance Code 001 and Financiadora de Estudos e Projetos (FINEP). The authors would like to thank the Laboratório Central de Microscopia (LCMIC) and César Aguzzoli, who helped us with scanning electron microscopy analysis. Thanks are due also to the staff of the Instituto de Materiais Cerâmicos at the Universidade de Caxias do Sul (IMC-UCS), mainly R. C. D. Cruz, D. Golle and M. Finkler for thermal analysis and to Janaína Junges, Laboratório de Energia e Bioprocessos (LEBio-UCS), for nitrogen adsorption analysis.

