


The effect of adding 0.1, 0.3, 0.6, 1.0, and 2.0wt.% halloysite clay, which calcined and uncalcined form, was studied on the glossy opaque glaze hardness and mechanical properties. Since the most significant disadvantage of opaque glazes is low hardness, halloysite particles with higher toughness were added to glazes to increase this property. Since more stable halloysite tubes were obtained after the calcination process, both calcined and uncalcined halloysite additions were made to see the effect of calcination, and the obtained results were examined. Detailed technological, mechanical and microstructural characterization studies were done on glazed samples. In addition, the change in the melting behavior of the glaze and the glassy phase viscosity of the addition of halloysite was also examined and interpreted considering hot stage microscope analyses. Compared to standard glossy opaque glaze, almost all the halloysite added samples displayed similar optical properties but higher hardness, surface wear resistance, and fracture toughness values. Among the case studies, the 2% halloysite addition by weight (uncalcined and calcined form) showed the highest mechanical properties.
Se estudió el efecto de la adición de 0,1, 0,3, 0,6, 1,0 y 2,0% en peso de arcilla de haloisita, en forma calcinada y sin calcinar, sobre la dureza y las propiedades mecánicas del esmalte opaco brillante. Dado que la desventaja más significativa de los vidriados opacos es la baja dureza, se agregaron partículas de haloisita con mayor dureza a los vidriados para aumentar esta propiedad. Dado que se obtuvieron tubos de haloisita más estables después del proceso de calcinación, se hicieron adiciones de haloisita tanto calcinada como sin calcinar para ver el efecto de la calcinación, y se examinaron los resultados obtenidos. Se realizaron estudios detallados de caracterización tecnológica, mecánica y microestructural sobre muestras vidriadas. Además, el cambio en el comportamiento de fusión del vidriado y la viscosidad de la fase vítrea de la adición de haloisita también se examinó e interpretó considerando análisis microscópicos de platina caliente. En comparación con el esmalte opaco brillante estándar, casi todas las muestras añadidas de haloisita mostraron propiedades ópticas similares pero valores más altos de dureza, resistencia al desgaste superficial y tenacidad a la fractura. Entre los estudios de caso, la adición de 2% de haloisita en peso (forma calcinada y sin calcinar) mostró las propiedades mecánicas más altas.
Glaze application is widespread in ceramic products such as porcelain kitchenware, ceramic tiles, and ceramic sanitaryware. The glaze is the mixture and the layer that can form an amorphous structure similar to the glass structure due to firing on the ceramic body and obtained from the ground ceramic raw materials with suitable composition [1–4]. There are two important reasons for applying glaze to ceramic products: First, to transform the ceramic body, which has a porous and micro-rough surface, to a non-porous and flat surface from the outside and to make it easier to clean and hygienic, and secondly, to create an esthetically pleasing appearance. Glaze also increases the strength of the product and its resistance to chemicals [5–13]. Glazes are generally divided into two parts according to their main optical properties. They are: opaque and transparent. Materials that do not allow visible light to pass through are called opaque [12,14–16]. Opacity occurs due to diffusion, refraction, and light scattering caused by particles or gas bubbles in the glaze. This scattering is because the glaze particles have different refractive indices compared to the surrounding vitreous phase. The opaque appearance is significant for covering the body color. The biggest disadvantage of opaque glazes is their low hardness and wear resistance. Special particles/crystals with higher toughness can be added to the glaze to increase the hardness value. One of the most widespread additives in the glaze compositions is the zirconium silicate because of its high refractive index, scratch, wear resistance, and chemical stability [17–20]. However, due to the high prices in the market and supplement problems, manufacturers generally want to decrease this material amount in the glazes and replace it with other candidate alternatives.
Alternatively, to increase the abrasion resistance of glazes, compositions that will provide needle-like crystal formation are generally used during firing. It is well known that rod-like crystals generally improve mechanical properties in ceramic matrices [21–26]. Some studies in the literature show that rod-like crystals come together in the glaze matrix, delay cracks, and slow the propagation of the crack formed, thus increasing the wear resistance [27–29]. In the present work, halloysite clay has been added to the glossy-opaque glaze to increase the wear resistance. Since halloysite clays have a tubular structure, they provide high strength properties to the matrices when used in the compositions [30–34]. Halloysite clay was added to the glaze composition of the glossy opaque white wall tile at the ratios of 0.1, 0.3, 0.6, 1.0, 2.0 by weight. In order to see the effects of calcination, it was added to compositions using both its calcined and uncalcined form. The effects of halloysite clay addition on the hardness, fracture toughness, wear resistance and viscosity values of standard glossy opaque glaze were evaluated.
Experimental procedurePreparation of the halloysite clayIn this study, halloysite raw material (Esan Industrial Raw Materials, Turkey) was prepared to add the standard wall tile composition. Chemical characterization was carried out utilizing wavelength dispersive X-ray fluorescence spectrometry (XRF), using Philips Model PW 2400 XRF Instrument fitted with an Rh white fluorescent tube. The sample was prepared as fused beads using a Philips PERL’X3 instrument. Chemical analysis of the halloysite clay (denoted as HAL) is given in Table 1.
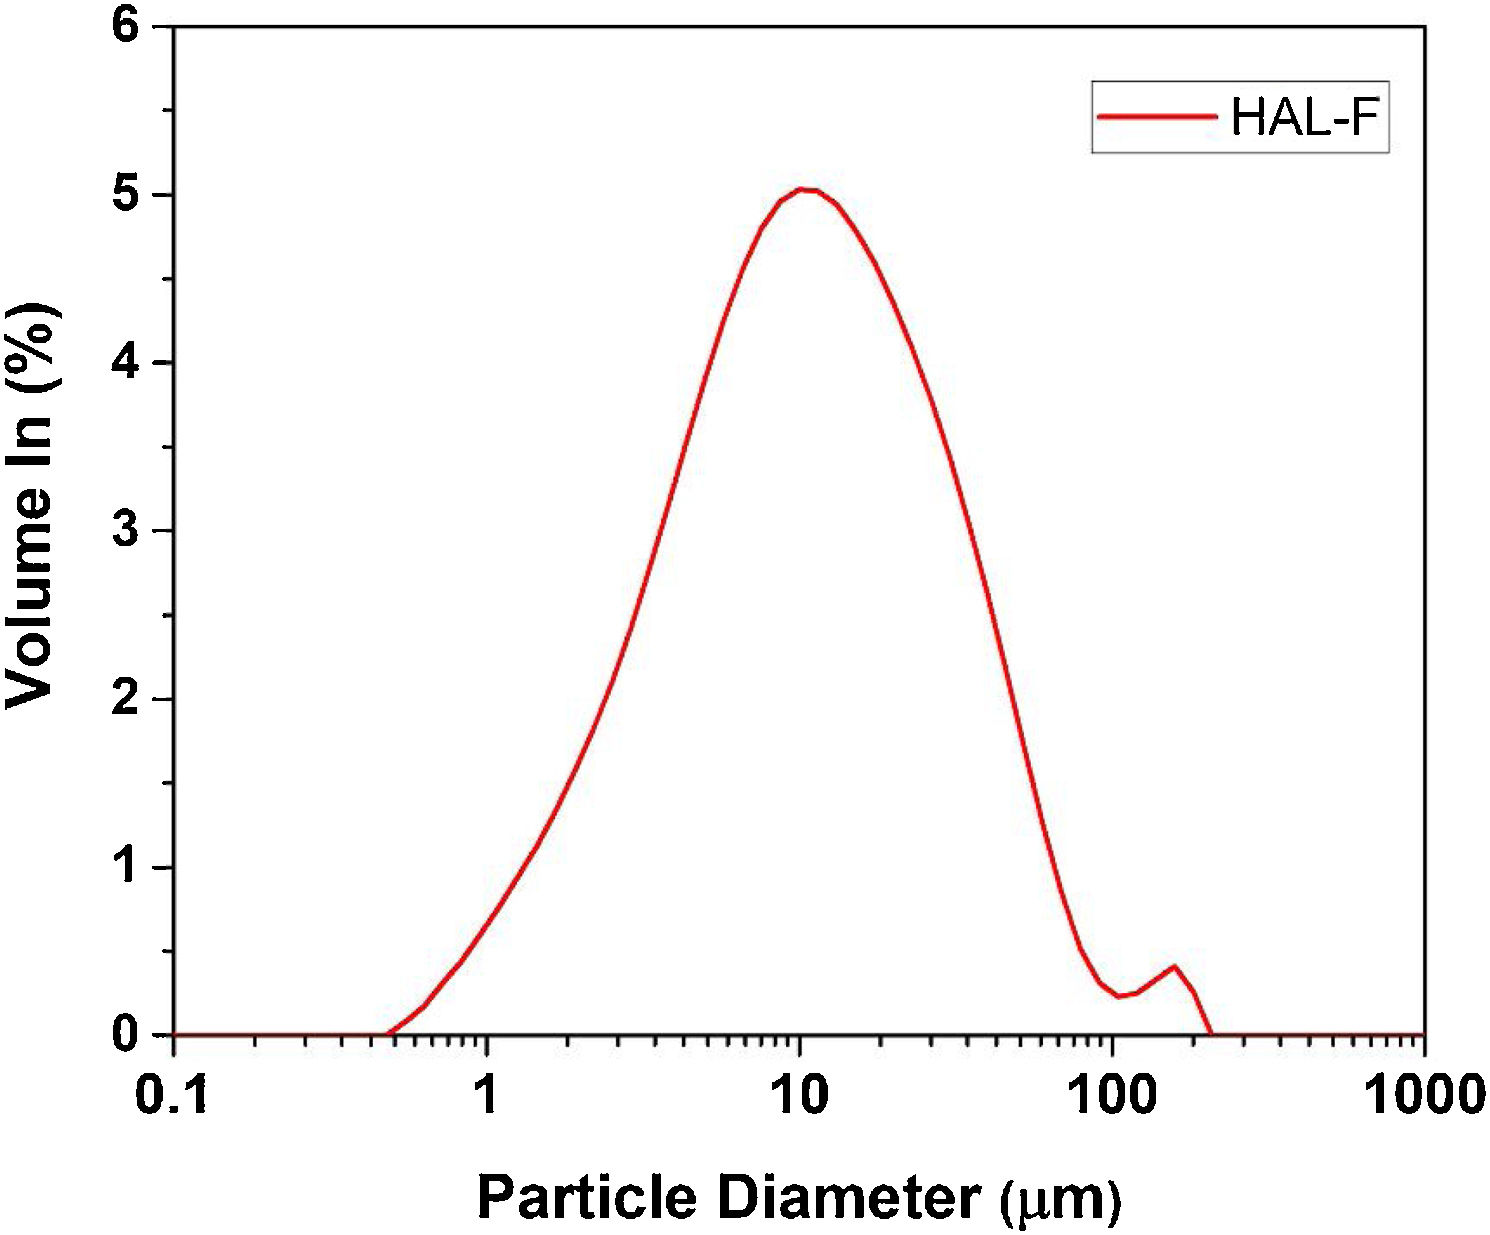
Halloysite firstly was wet-milled by a laboratory jar mill containing 60wt.% solid and 1.0wt.% deflocculant (sodium silicate), for 20min. The slurry was sieved with an aperture of 45μm. The slurry sieved through 45-μm aperture was denoted as HAL-F, the particle size distribution of slurries determined by laser diffraction analysis (Malvern Master Sizer 2000). The particle size of the HAL-F is given in Fig. 1. The sample has nearly unimodal type particle size distribution having maxima point 11μm. The halloysite slurry was dried at 100°C for 24h. Halloysite clay was added after this preliminary preparation stage. The calcined halloysite was added to the glaze after being calcined at 600°C for 1h with 10°C/min heating cycle.
Preparation of the glaze compositions with halloysite clay
To prepare the glaze composition, firstly, a frit composition was prepared. The compositional range of the frits studied is listed in Table 2. Starting raw materials were precisely weighed and homogeneously mixed. Then the mixture was put into alumina crucibles with 400g mass. Melting was carried out in an electrically heated furnace (Protherm Brand) at 1550°C for 1h under laboratory conditions. The frit was obtained by quenching the melt into the water at room temperature.
After frit preparation, the standard glossy opaque glaze was prepared according to Table 3. Weighed raw materials were wet milled in a porcelain jet mill containing alumina balls for 60min. The prepared glaze was sieved from the 90μm sieve. Then it was applied to the wall tiles by spraying. Halloysite clay was added to the glaze after this stage.
Glazed wall tiles were dried in an oven at 110°C for 2h. Glazed wall tiles were fired in an electrical laboratory kiln (Nabertherm Brand) at 1050°C for 25min. The codes and details of the prepared samples are given in Table 4.
Samples’ details.
| Sample code | Explanations |
|---|---|
| STD_POS | Standard glossy opaque glaze (without halloysite) |
| STD_POS_%0.1H | Addition of 0.1wt.% halloysite clay to the standard glossy opaque glaze |
| STD_POS_%0.3H | Addition of 0.3wt.% halloysite clay to the standard glossy opaque glaze |
| STD_POS_%0.6H | Addition of 0.6wt.% halloysite clay to the standard glossy opaque glaze |
| STD_POS_%1.0H | Addition of 1.0wt.% halloysite clay to the standard glossy opaque glaze |
| STD_POS_%2.0H | Addition of 2.0wt.% halloysite clay to the standard glossy opaque glaze |
| STD_POS_%0.1CH | Addition of 0.1wt.% calcined halloysite clay to the standard glossy opaque glaze |
| STD_POS_%0.3CH | Addition of 0.3wt.% calcined halloysite clay to the standard glossy opaque glaze |
| STD_POS_%0.6CH | Addition of 0.6wt.% calcined halloysite clay to the standard glossy opaque glaze |
| STD_POS_%1.0CH | Addition of 1.0wt.% calcined halloysite clay to the standard glossy opaque glaze |
| STD_POS_%2.0CH | Addition of 2.0wt.% calcined halloysite clay to the standard glossy opaque glaze |
The FT-IR spectra of the calcined halloysite samples were recorded on a Perkin Elmer Spectrum-100 FT-IR spectrophotometer. Halloysite powders were placed in an infrared spectrometer for testing in the frequency range of 650–4000cm−1 at room temperature [35]. Approximately 2–5mg of halloysite powder was removed from each specimen for ATR-FTIR analysis. Glossiness and coloring parameters of the samples were determined using a Multi-Gloss 268 model gloss-meter and a CR-300 model chrometer [36]. Microhardness measurements were carried out by hardness testing equipment (Instron Wolpert Tester 2100) with the help of the Vickers indentation method at a load of 50gf applied for 10s. At least ten indentations were made for obtaining an average microhardness value for each sample. The magnitude of the Vickers hardness was determined according to [37],
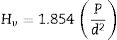
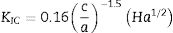
where P is the applied load (N) and d is the average diagonal length (m). Fracture toughness was determined by the fraction indentation method using Evan's equation (Eq. (2)) [15], where Kic is fracture toughness, c is average length of the cracks obtained in the tips of the Vickers marks, a is half average length of the diagonal of the Vickers marks and H is Vickers hardness. Hervas et al., in their comparison of 7 methods using Vickers indentation, reported that the Evan's method gave consistent results for all the brittle materials tested [38]. Bolelli et al. used the Evan's equation to measure the fracture toughness of glazes [39].
The PEI wear resistance (according to TS-EN ISO 10545-7: (Ceramic tiles – part 7: Determination of resistance to surface abrasion for glazed tiles)) was conducted the samples [40]. The test involves the rotation of steel ball bearings on the surface of a tile for a given number of rotations. Wear is assessed by viewing through a special chamber. The test method currently classifies tiles at the number of revolutions at which the abrasion can be readily distinguished. PEI classes are represented in Table 5[41].
X-ray diffraction (XRD) method was applied to detect the crystalline phases formed in the microstructure of sintered samples. In the analyses, the samples were used in powder form. They were scanned at 2°/min speed in the range of 5–70° with CuKα radiation, (λ=0.154nm), at 40kV and 40mA conditions using RIGAKU 2200 DMAX diffractometer.
To investigate the melting behavior of the compositions, heat microscopy analyses were carried out by using side-view hot-stage microscope (Misura 3 HSM Hot-stage microscopy, Expert Systems, Srl, Modena, Italy) [42]. It has a halogen lamp source, a tubular electrical furnace (200mm×20mm diam) and a 5× magnification charge coupled device (CCD) camera. Each powdered glaze was manually pressed into a pellet (3mm height×2mm dia.) and placed on an alumina substrate. The samples were heated at 10°C/min to 1100°C.
The determination of the viscosity curve of glazes was performed using data supplied by the heating microscope and dilatometer. This method is based on the Vogel–Fulcher–Tammann (VFT) equation represented by Eq. (3)[43,44].
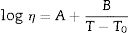
where η is viscosity. The determination of the parameters A, B and T0 is done using three pairs of known temperature–viscosity (η,T) values. T0 is the Vogel temperature, which is also called the ideal glass transition temperature and T is absolute temperature. Critical points of glasses have been determined by the viscosity values are fairly constants such as: glass transition temperature, softening point, sintering point, sphere temperature, and half sphere temperature. These data allows the solve the A, B and T0 values. Viscosity values were calculated for 1000°C for all compositions.
The microstructures of the samples were examined by scanning electron microscopy (SEM) analysis with the use of Philips XL30-SFEG-SEM equipped with energy dispersive X-ray analysis (EDX). Firstly, the surface of the samples was made suitable for SEM analysis by grinding with a series of SiC abrasive papers and then polished using diamond paste. The polished surfaces were chemically etched in an aqueous solution containing 3% HF for about 1min to reveal the crystalline structure, then the sample surfaces were coated with gold [45].
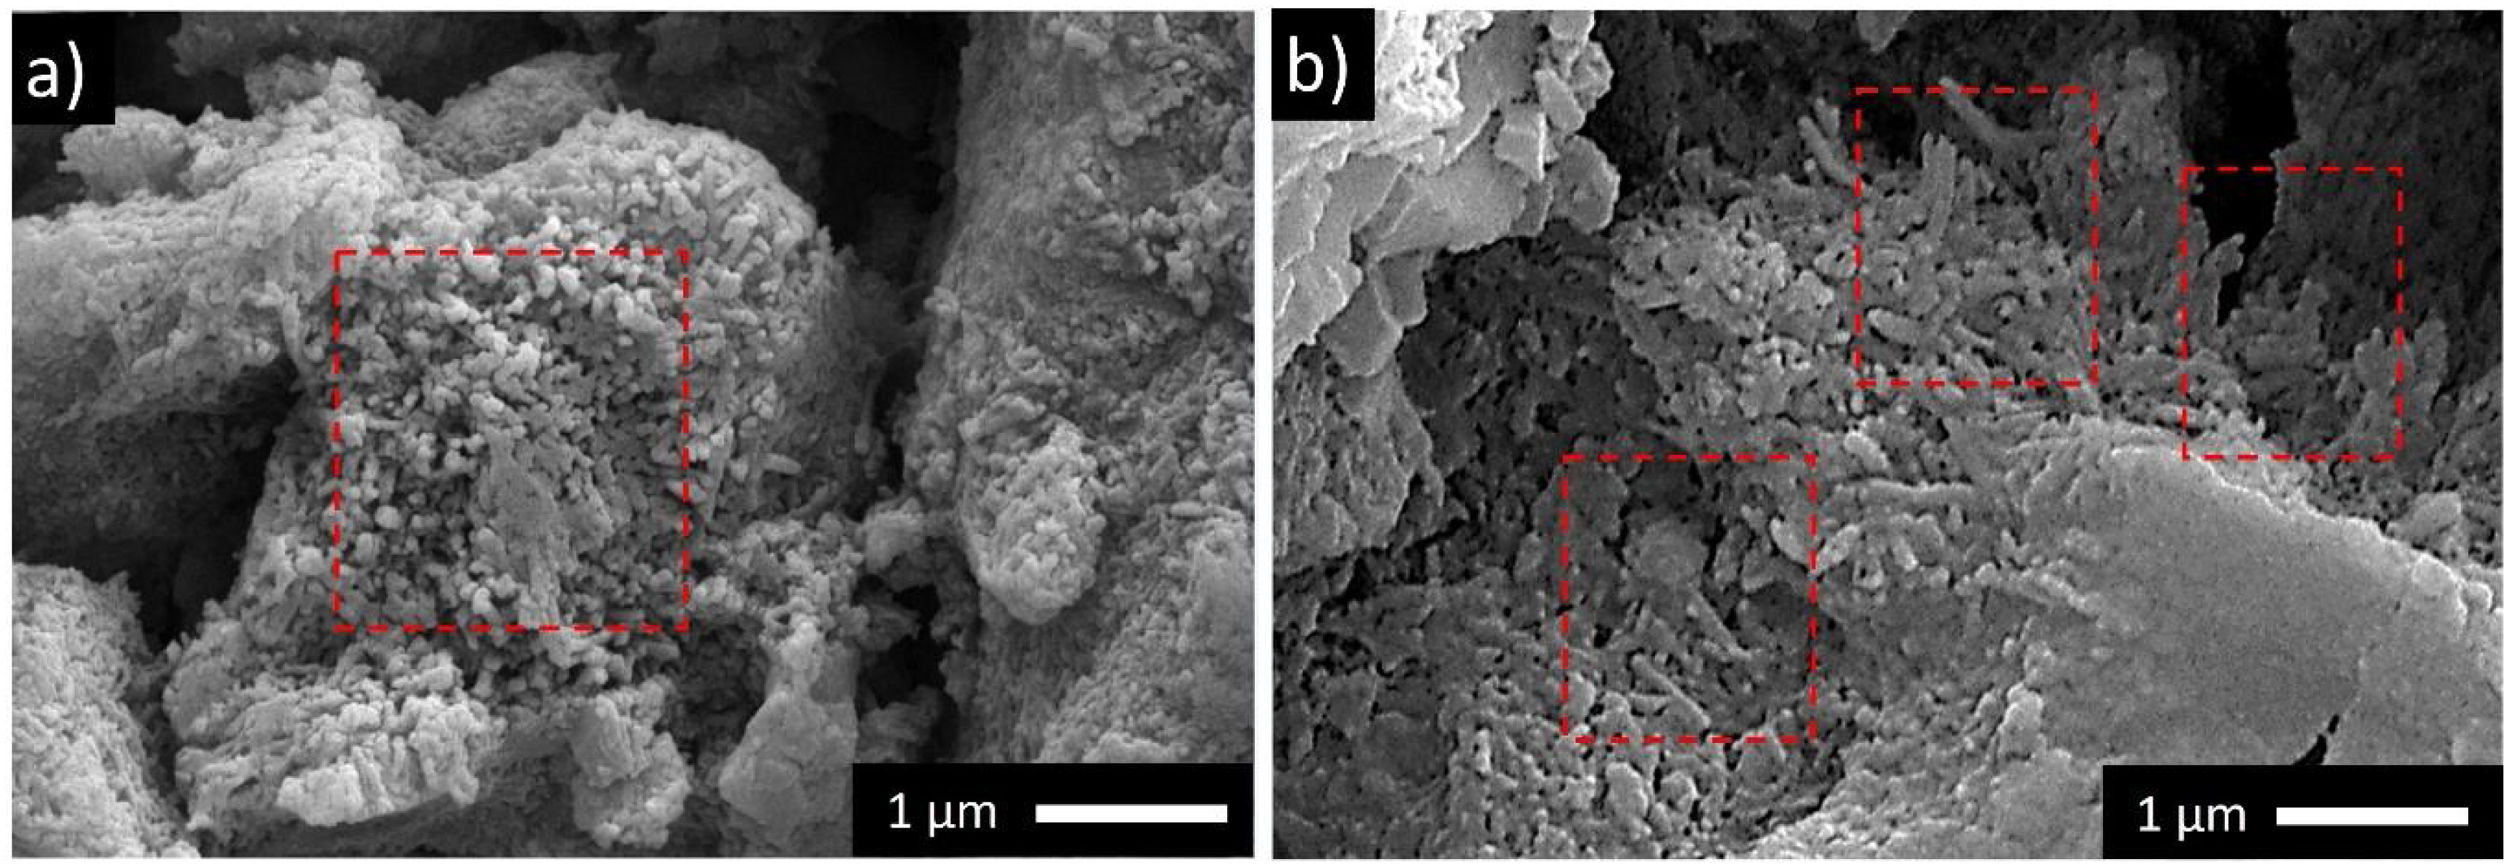
Results and discussionMicrostructural analyses of the samplesThe microstructure of uncalcined and the calcined halloysite clay at 600°C are given in Fig. 2(a) and (b) respectively. In Fig. 2(a), small rod-like structures draw attention together with layered structures. These structures formed lumps with each other. In Fig. 2(b), it is seen that the rod-like structures grow and take place in the microstructure in a unique way after calcination.
 uncalcined and (b) calcined halloysite clay.")
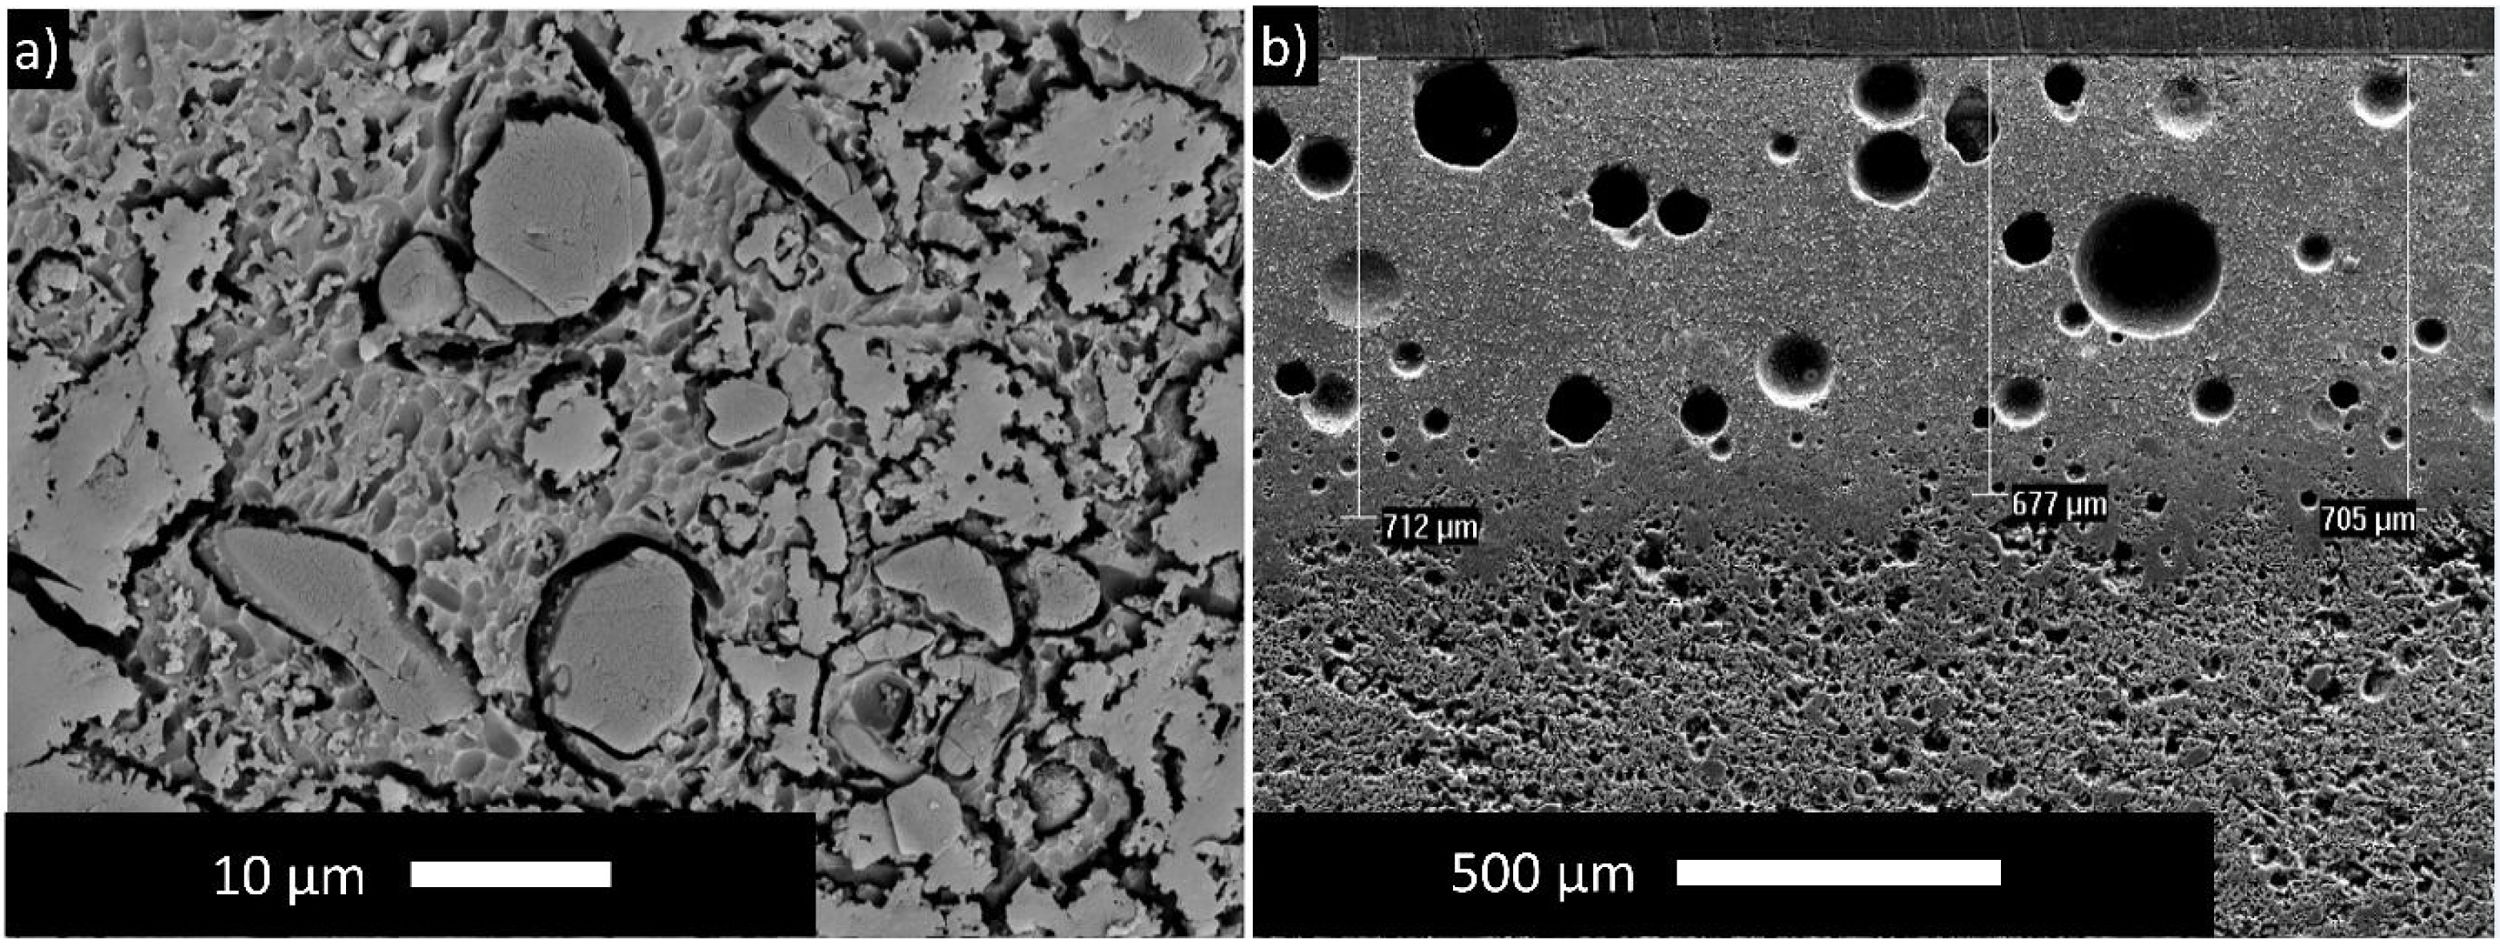
The microstructure of the standard glossy opaque glaze is shown in Fig. 3(a). Here, grains and grain groups dispersed in the glassy phase draw attention. In Fig. 3(b), a view from the cross-sectional area of the tile with standard glossy opaque glaze is presented, and average thickness of the glaze is 698±18.52μm.
 (a) surface image b) cross-sectional area image.")
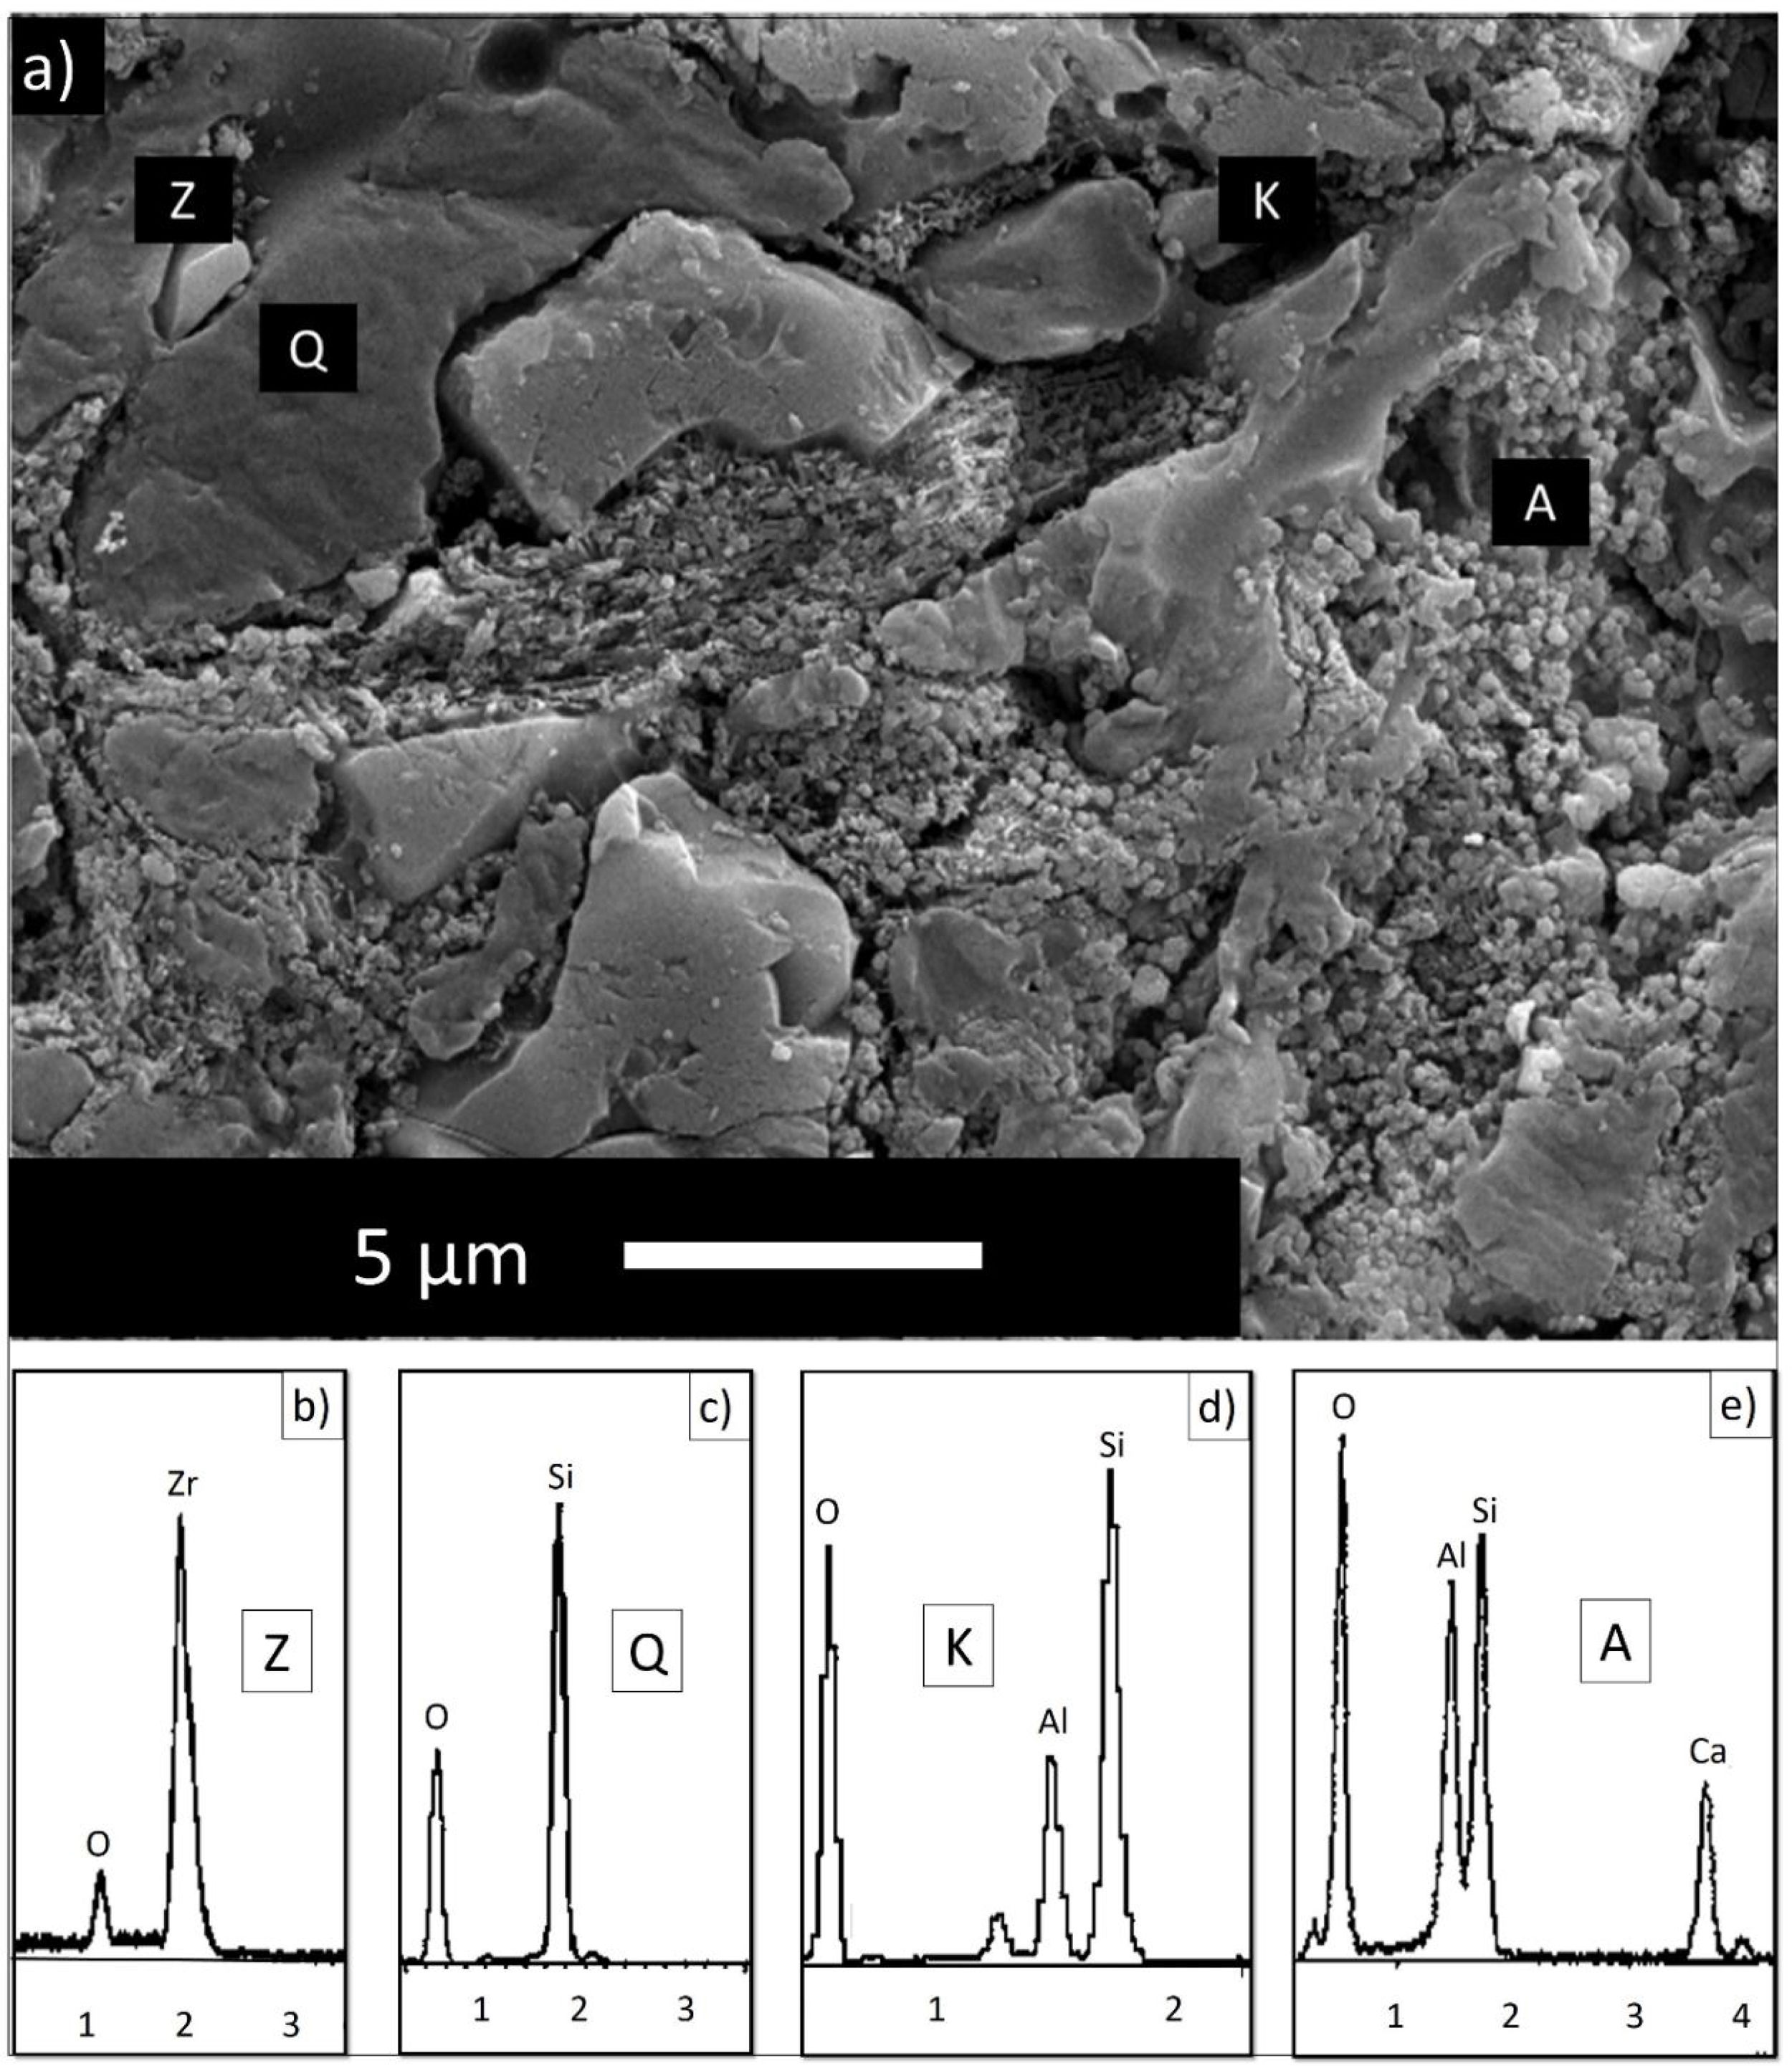
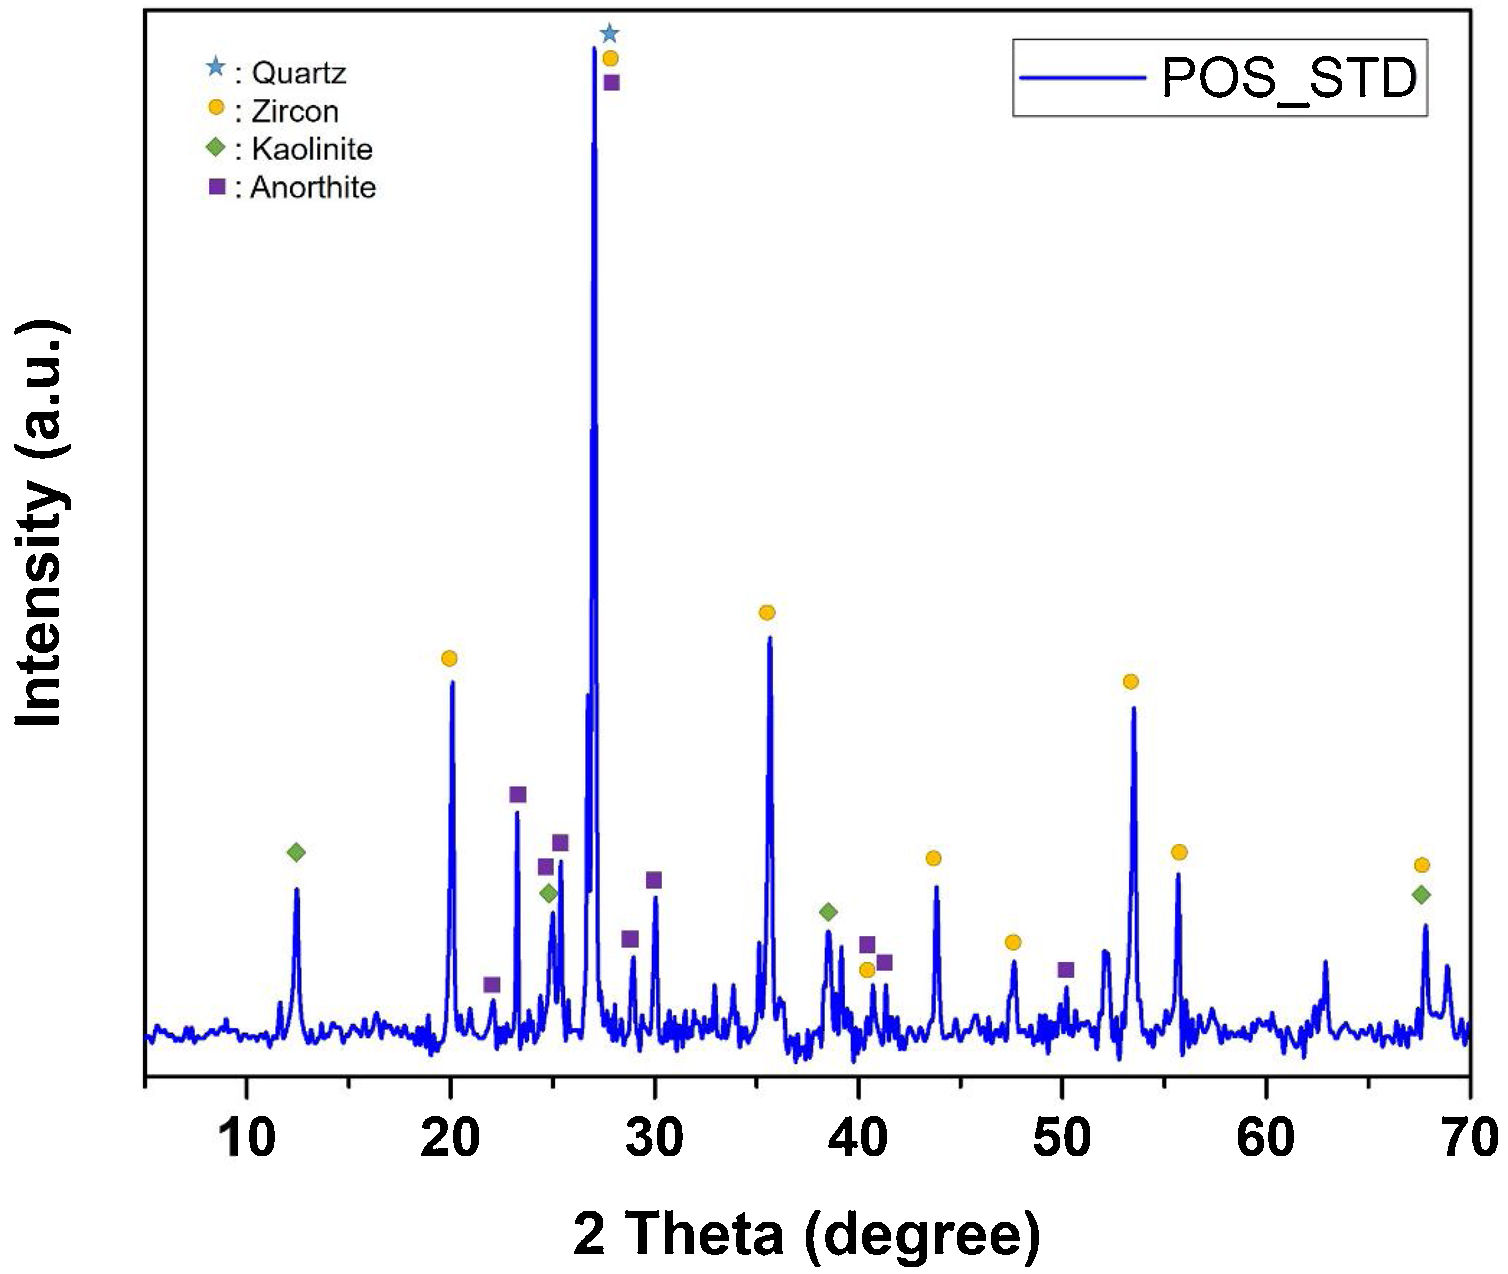
EDX analyzes were also performed on the crystals contained in the standard glossy opaque glaze (Fig. 4(a)). Fig. 4(b)–(e) are EDX spectrums of the white-colored grains (Z), angular grains (Q), layered regions (K), and round-crystalline regions (A), respectively. According to the EDX analysis results, zircon (Z), kaolinite (K), quartz (Q), and anorthite (A) crystals are observed in the microstructure.
 Microstructure of sample (STD_POS) and EDX analysis of (b) zirconium (c) quartz (d) kaolinite and (e) anorthite.")
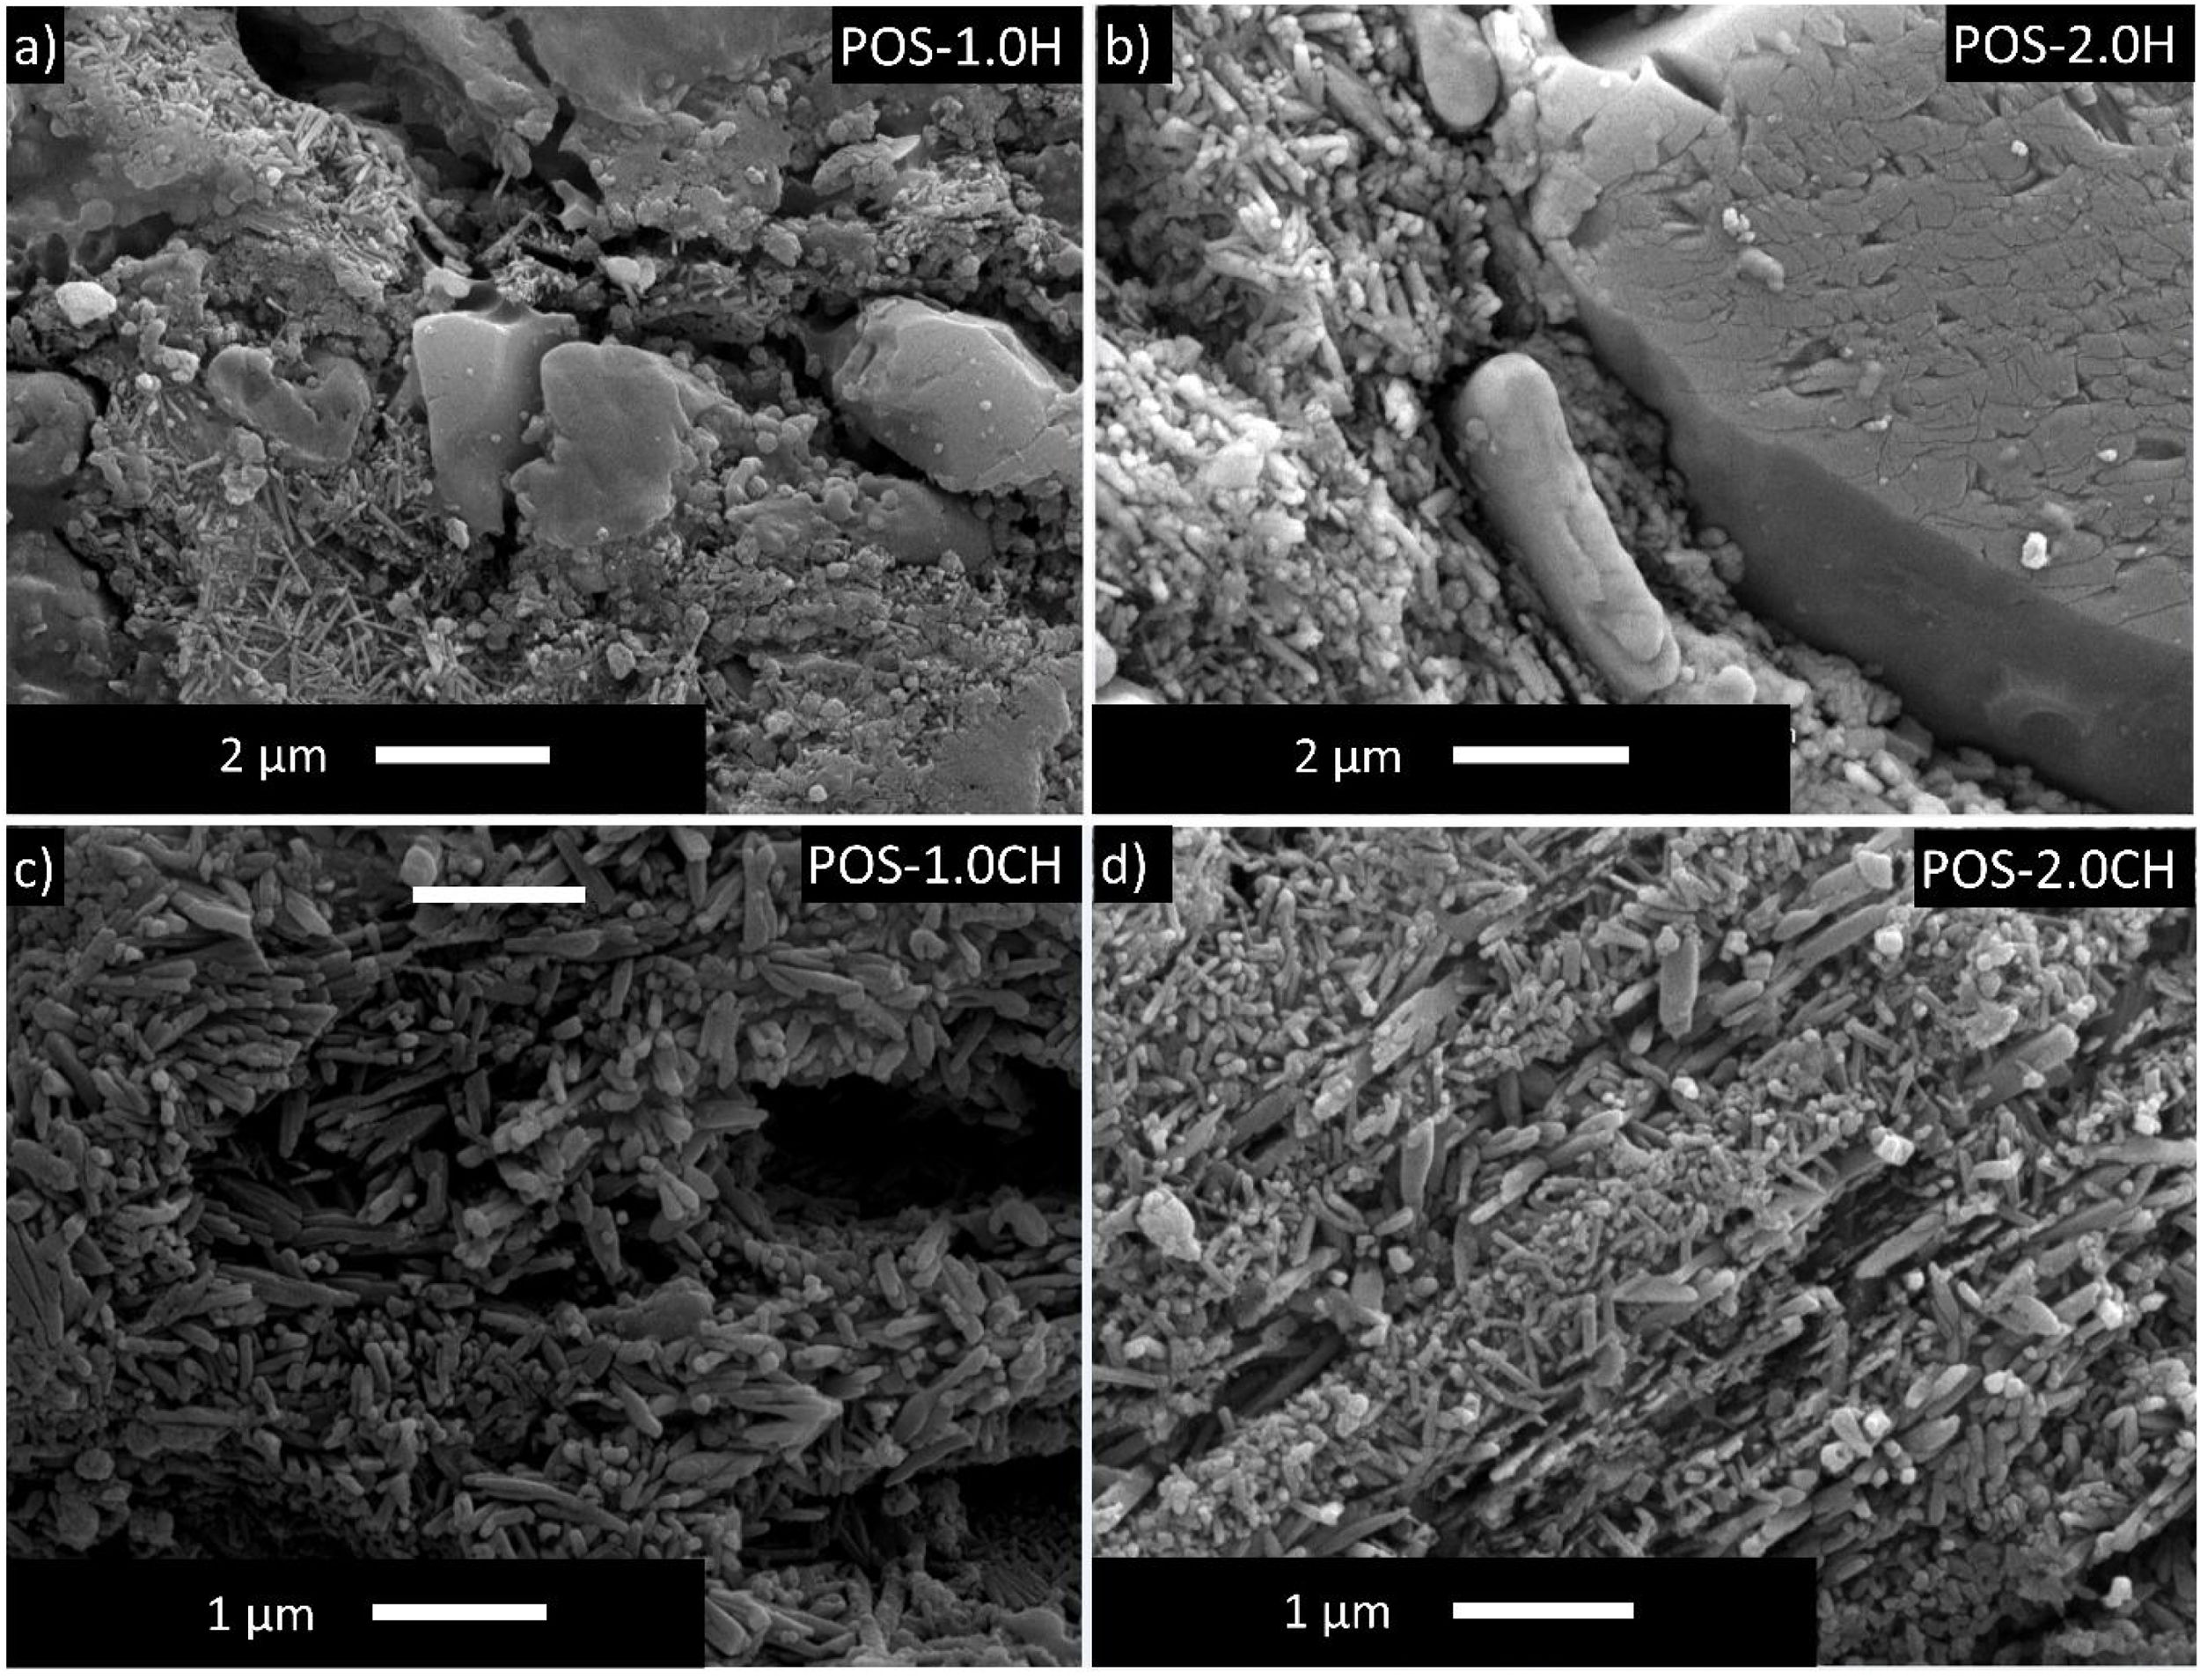
Detailed microstructures of the compositions containing calcined halloysite (POS-1.0CH, POS-2.0CH) and uncalcined halloysite (POS-1.0H, POS-2.0H) with high mechanical properties and hardness value are also shown in Fig. 5. In these microstructures, different from the standard glossy opaque glaze microstructure, needle-like crystal regions with sizes varying in the range of 200–500nm draw attention.

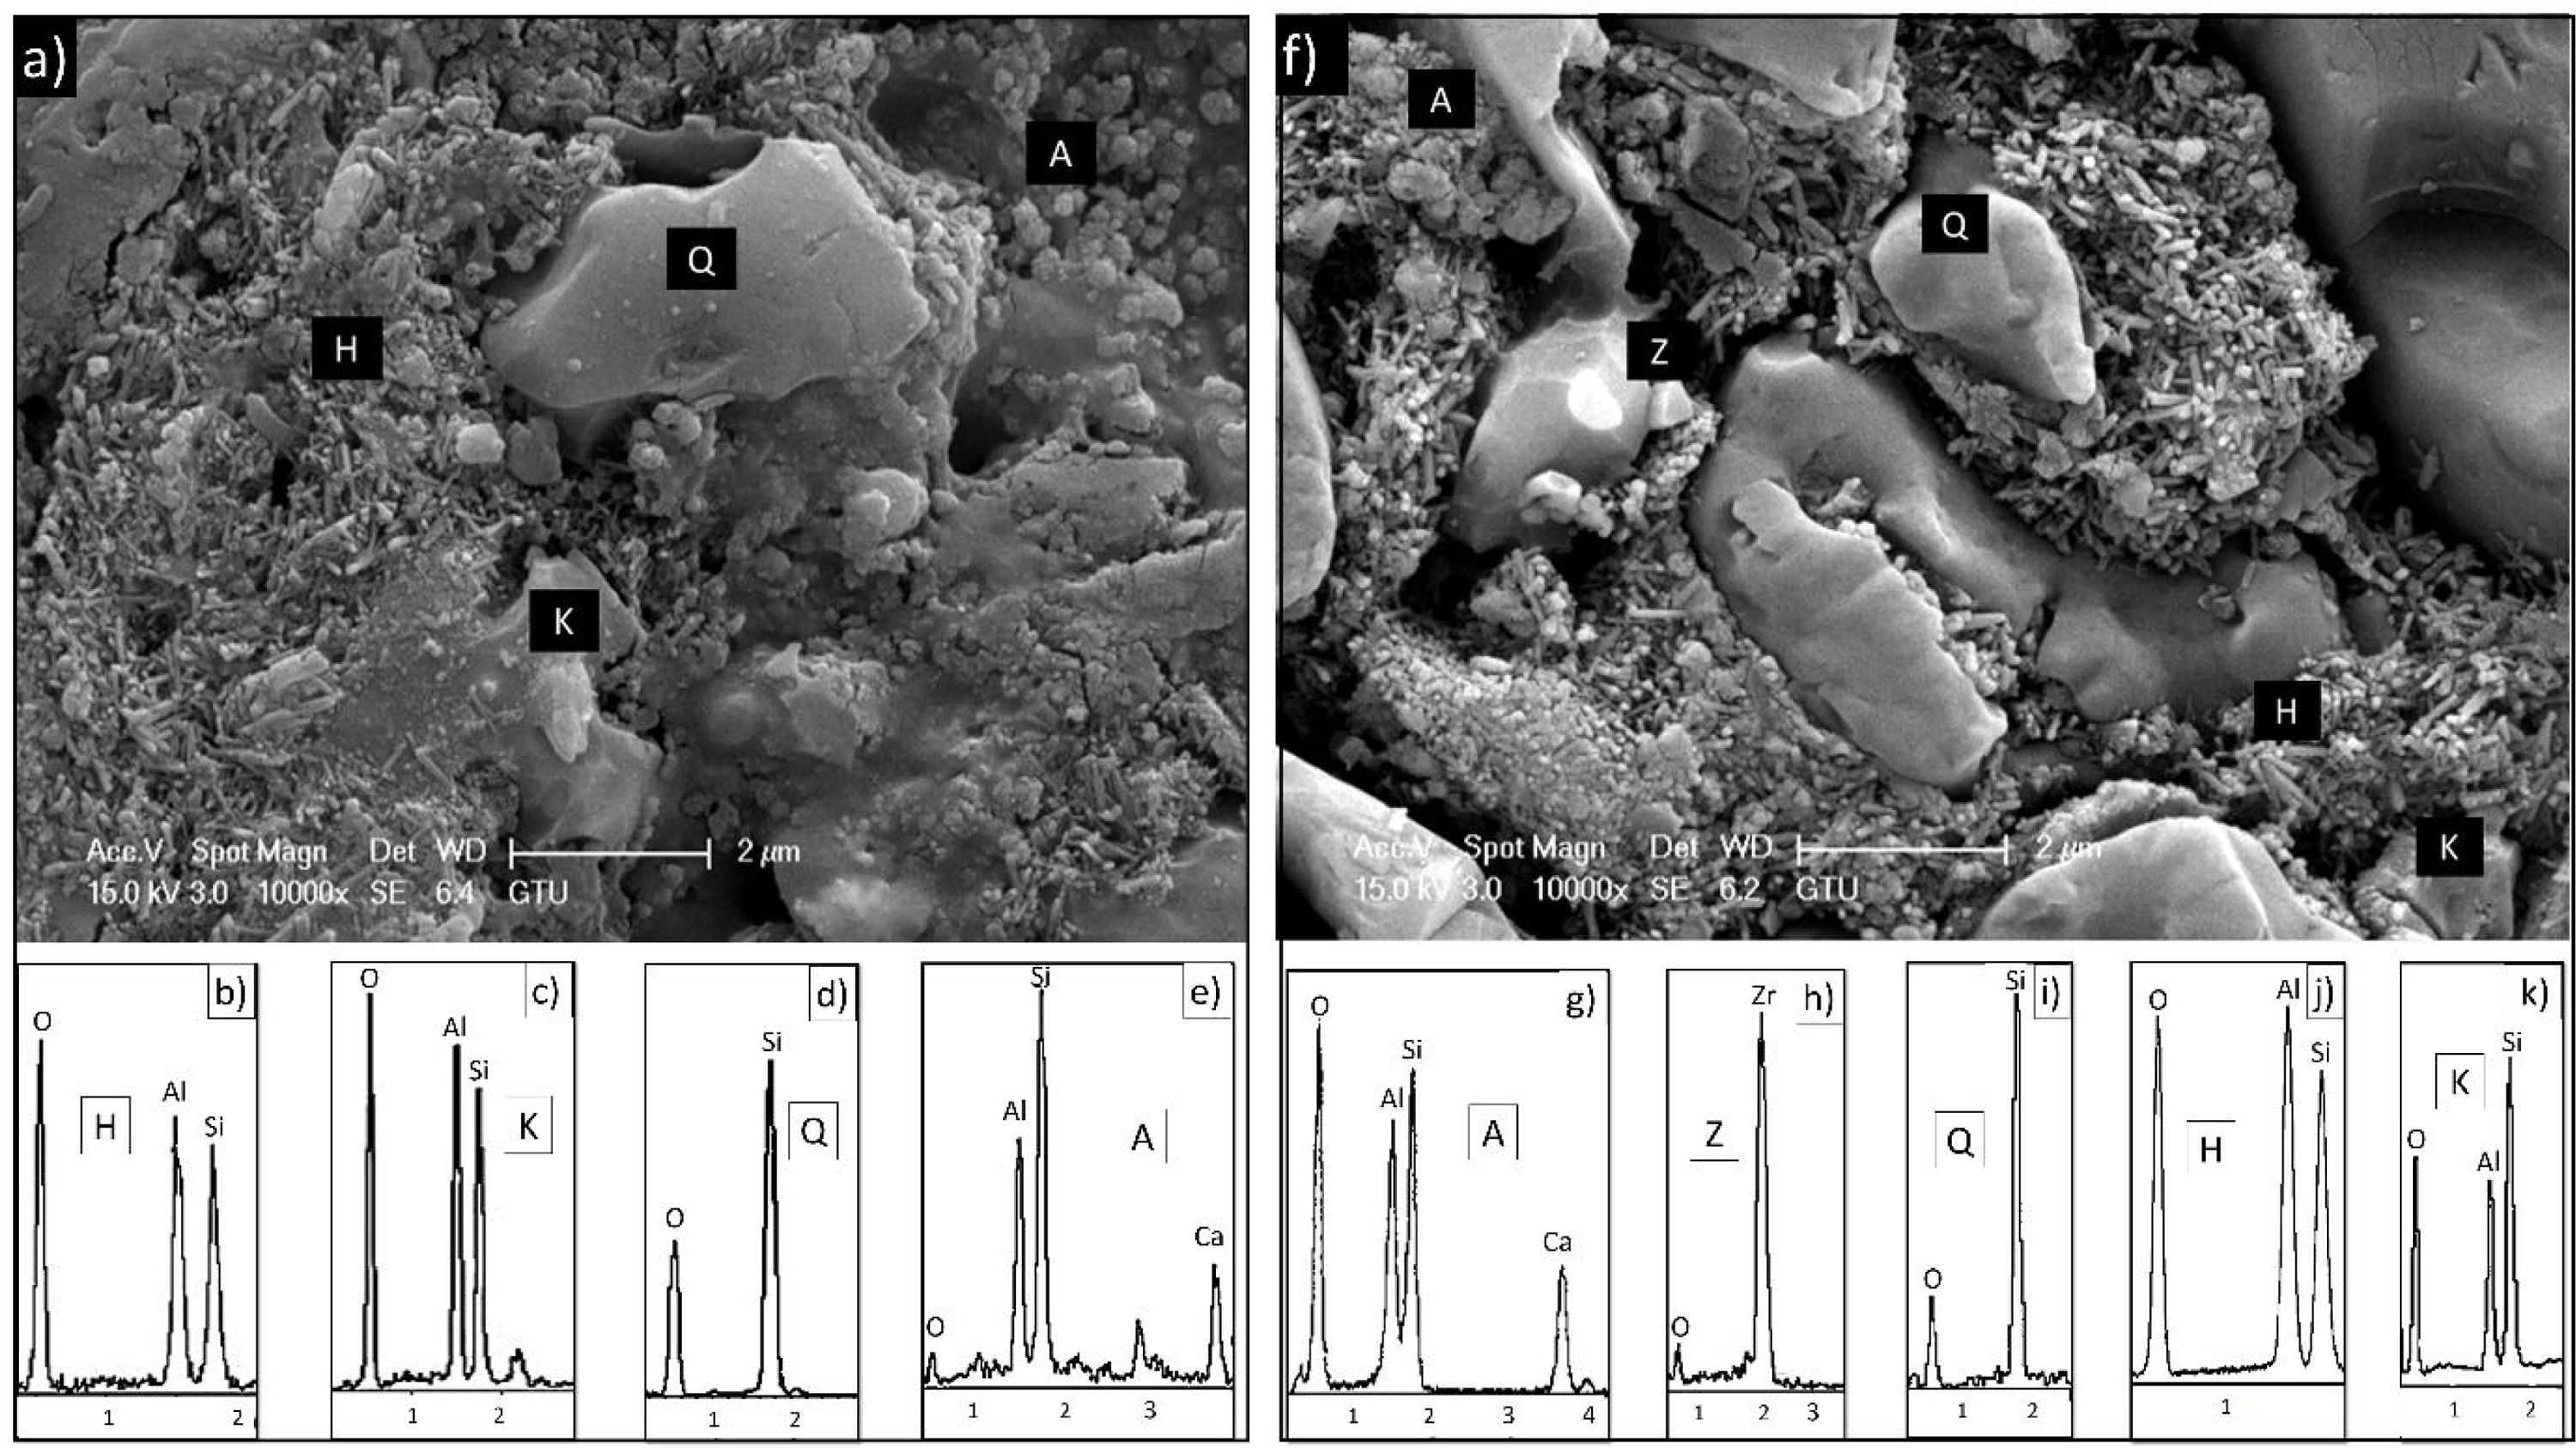
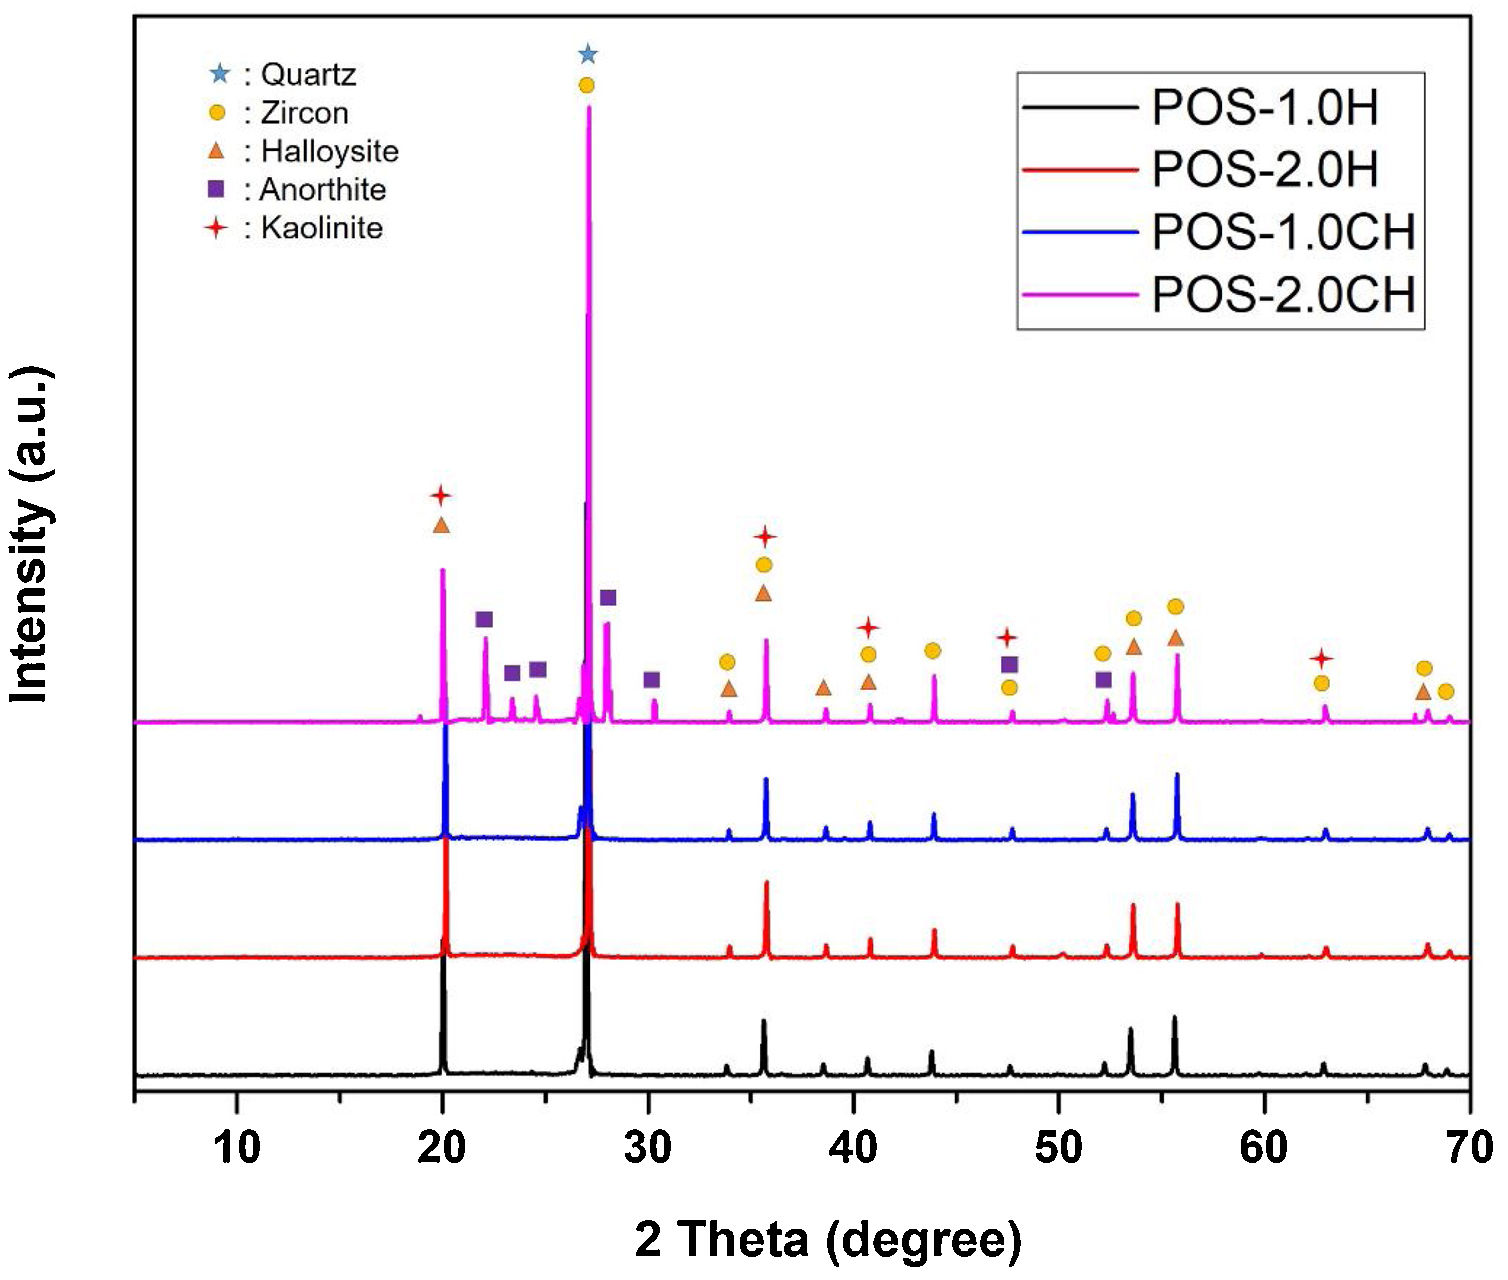
EDX analysis was also performed on the crystals of some samples containing uncalcined halloysite (POS-1.0H) and uncalcined halloysite (POS-1.0CH). In both samples, unlike the standard glossy opaque glaze, there are needle-like grainy regions (Fig. 6). Aluminum (Al) and silicon (Si) peaks draw attention in the EDX spectra taken from these regions (H). This result shows that the needle-like grains are halloysite crystals (Fig. 6(b) and (j)). The obtained results are also consistent with the XRD results (Figs. 13 and 14).
 Microstructure of POS-1.0H and EDX analysis of (b) halloysiye, (c) kaolinite, (d) quartz and (e) anorthite. (f) Microstructure of POS-1.0CH and EDX analysis of (g) anorthite, (h) zirconium, (i) quartz, (j) halloysite and (k) kaolinite.")
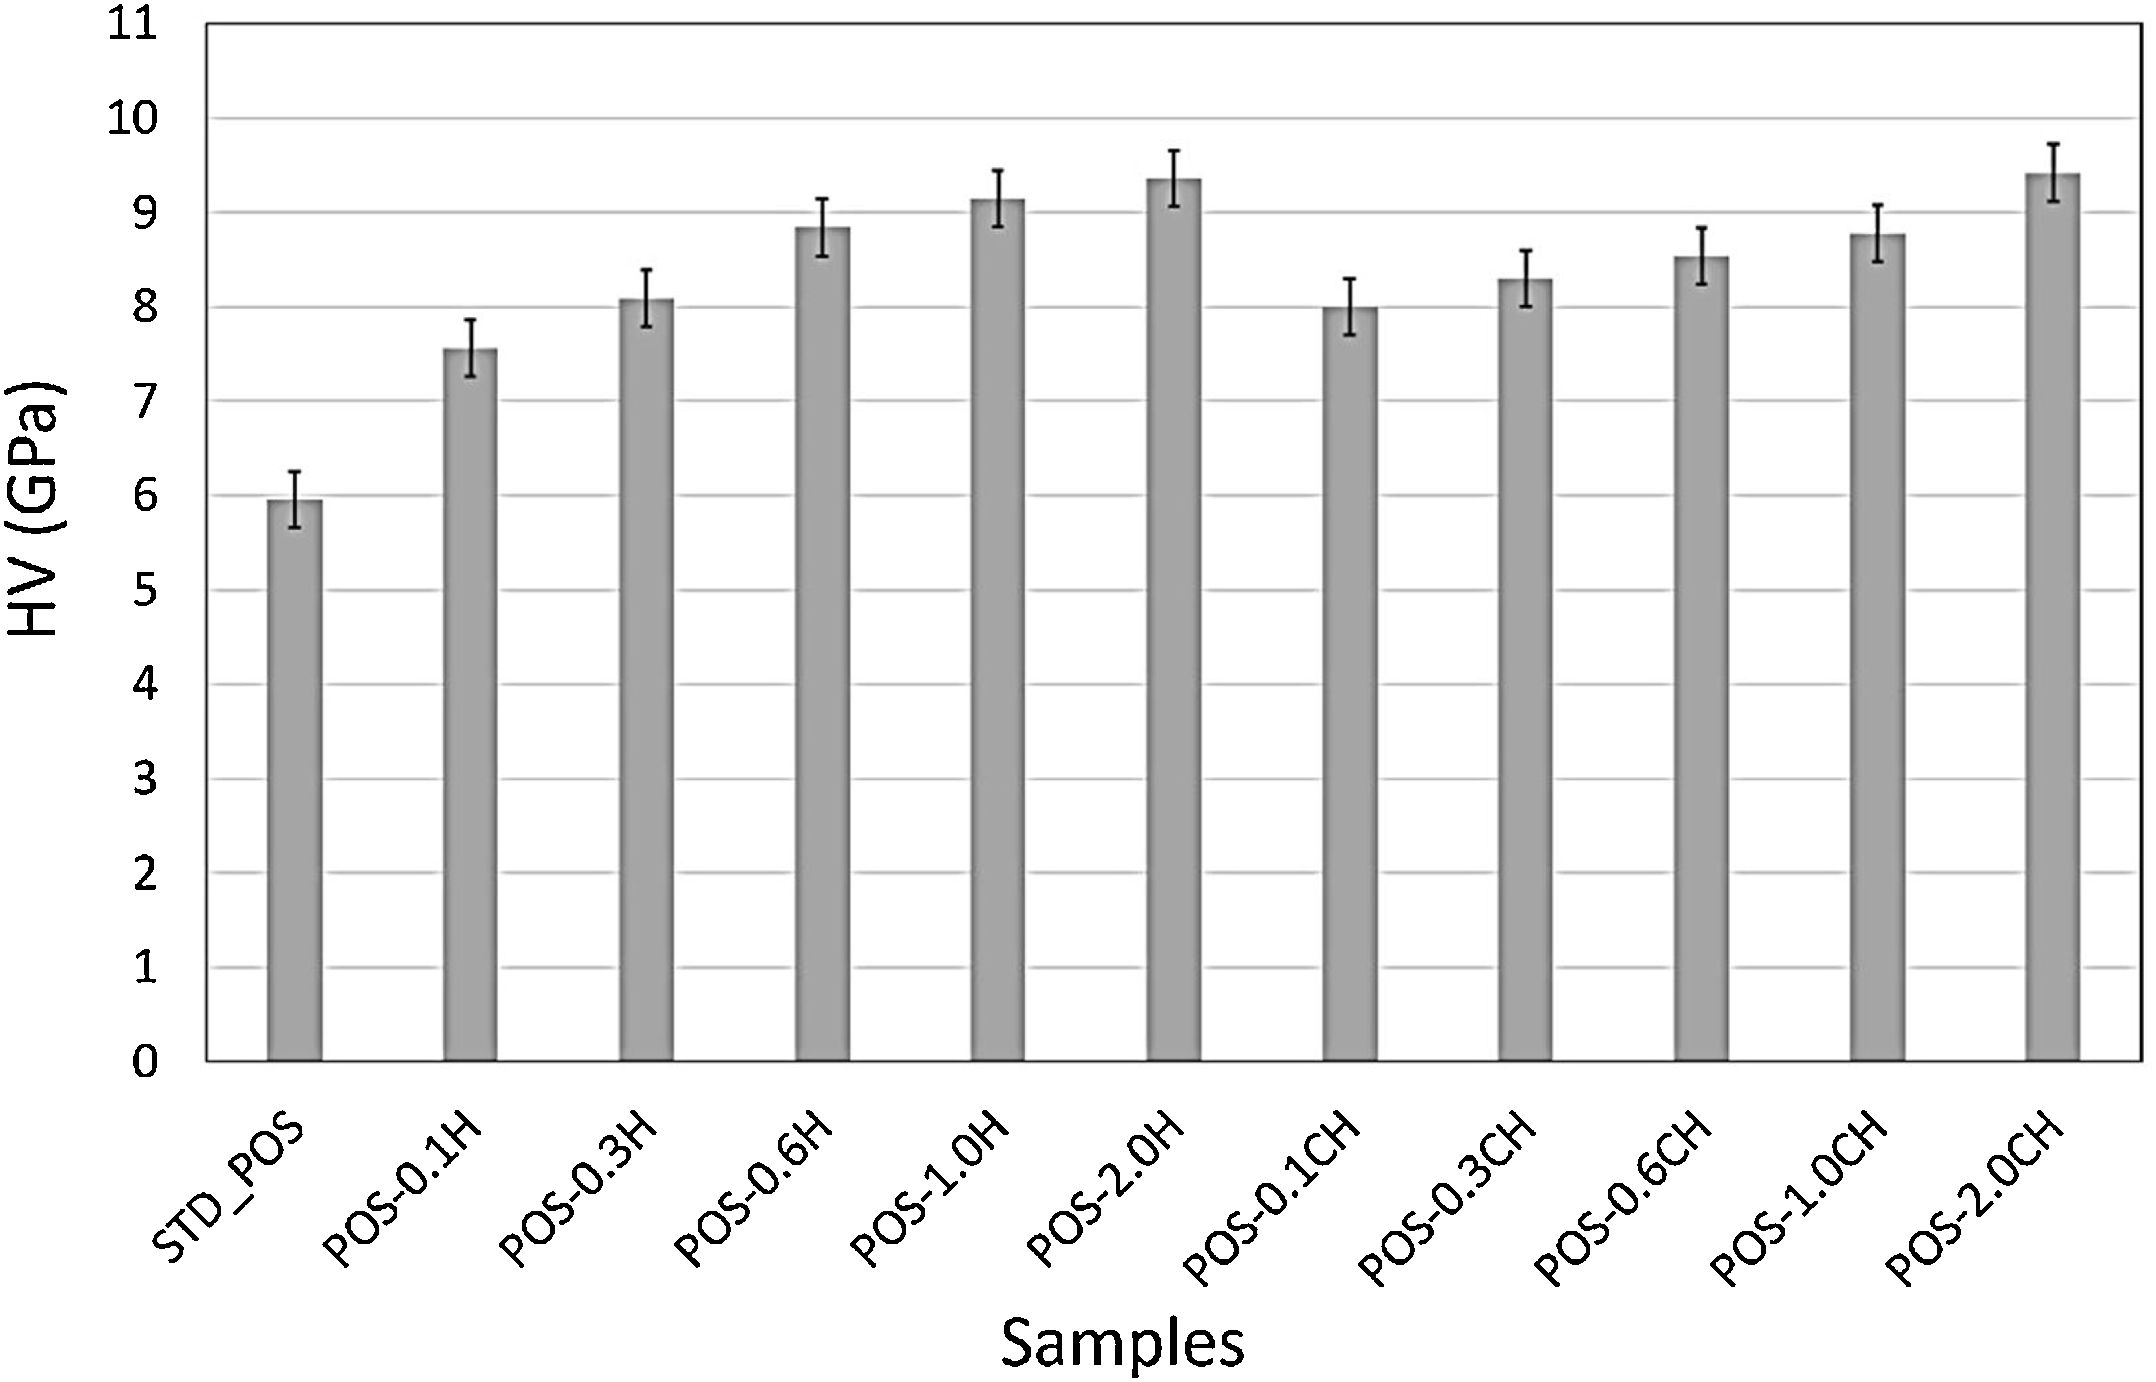
The formation of needle-like halloysite crystals in the microstructure caused a change in the hardness value of the glaze and an increase in the fracture toughness values. Vickers hardness increases corresponding to the containing calcined/uncalcined halloysite glaze sample can be observed. Sample (STD_POS) has a (Hv) value of 5.96GPa, while the hardness value for glaze containing calcined halloysite and uncalcined halloysite increases up to 9.52 and 9.36GPa for POS-2.0CH and POS-2.0H, respectively. Dispersion of the halloysite is an important factor in hardness, because a bad dispersion would produce a gradient in the hardness values. However, there was no problem in the distribution of halloysites in this study, and the distribution was homogeneous. Toughness value (KIC) also increases with the incorporation of halloysite to a glaze. Although the toughness value of the standard glossy opaque glaze was 0.797MPam1/2±0.03, this value increased considerably with the addition of calcined and non-calcined halloysite. Maximum fracture toughness values were obtained when the addition of halloysite in both species reached its maximum value (2% by weight); these are 1.201 and 1.304MPam1/2±0.03, respectively. It also has an essential effect on increasing the toughness since the needle-like grains fill the pores and thus prevent crack propagation [46].
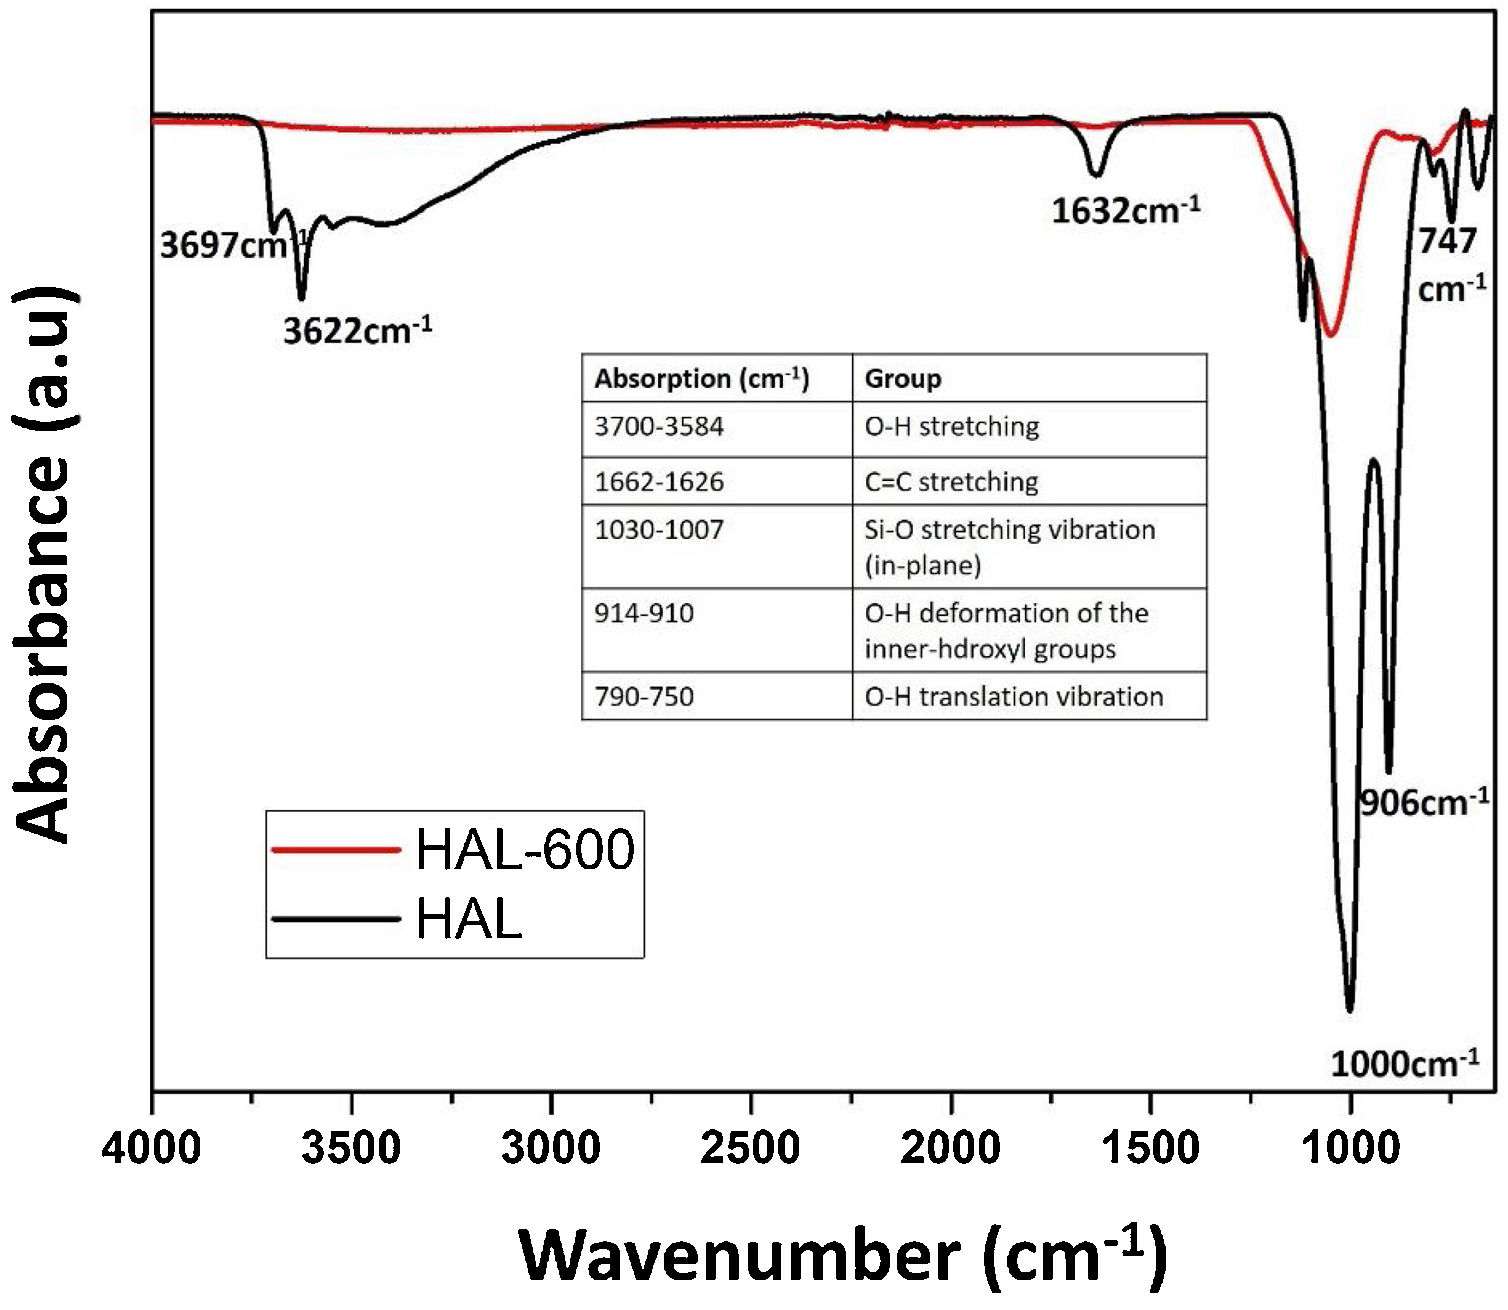
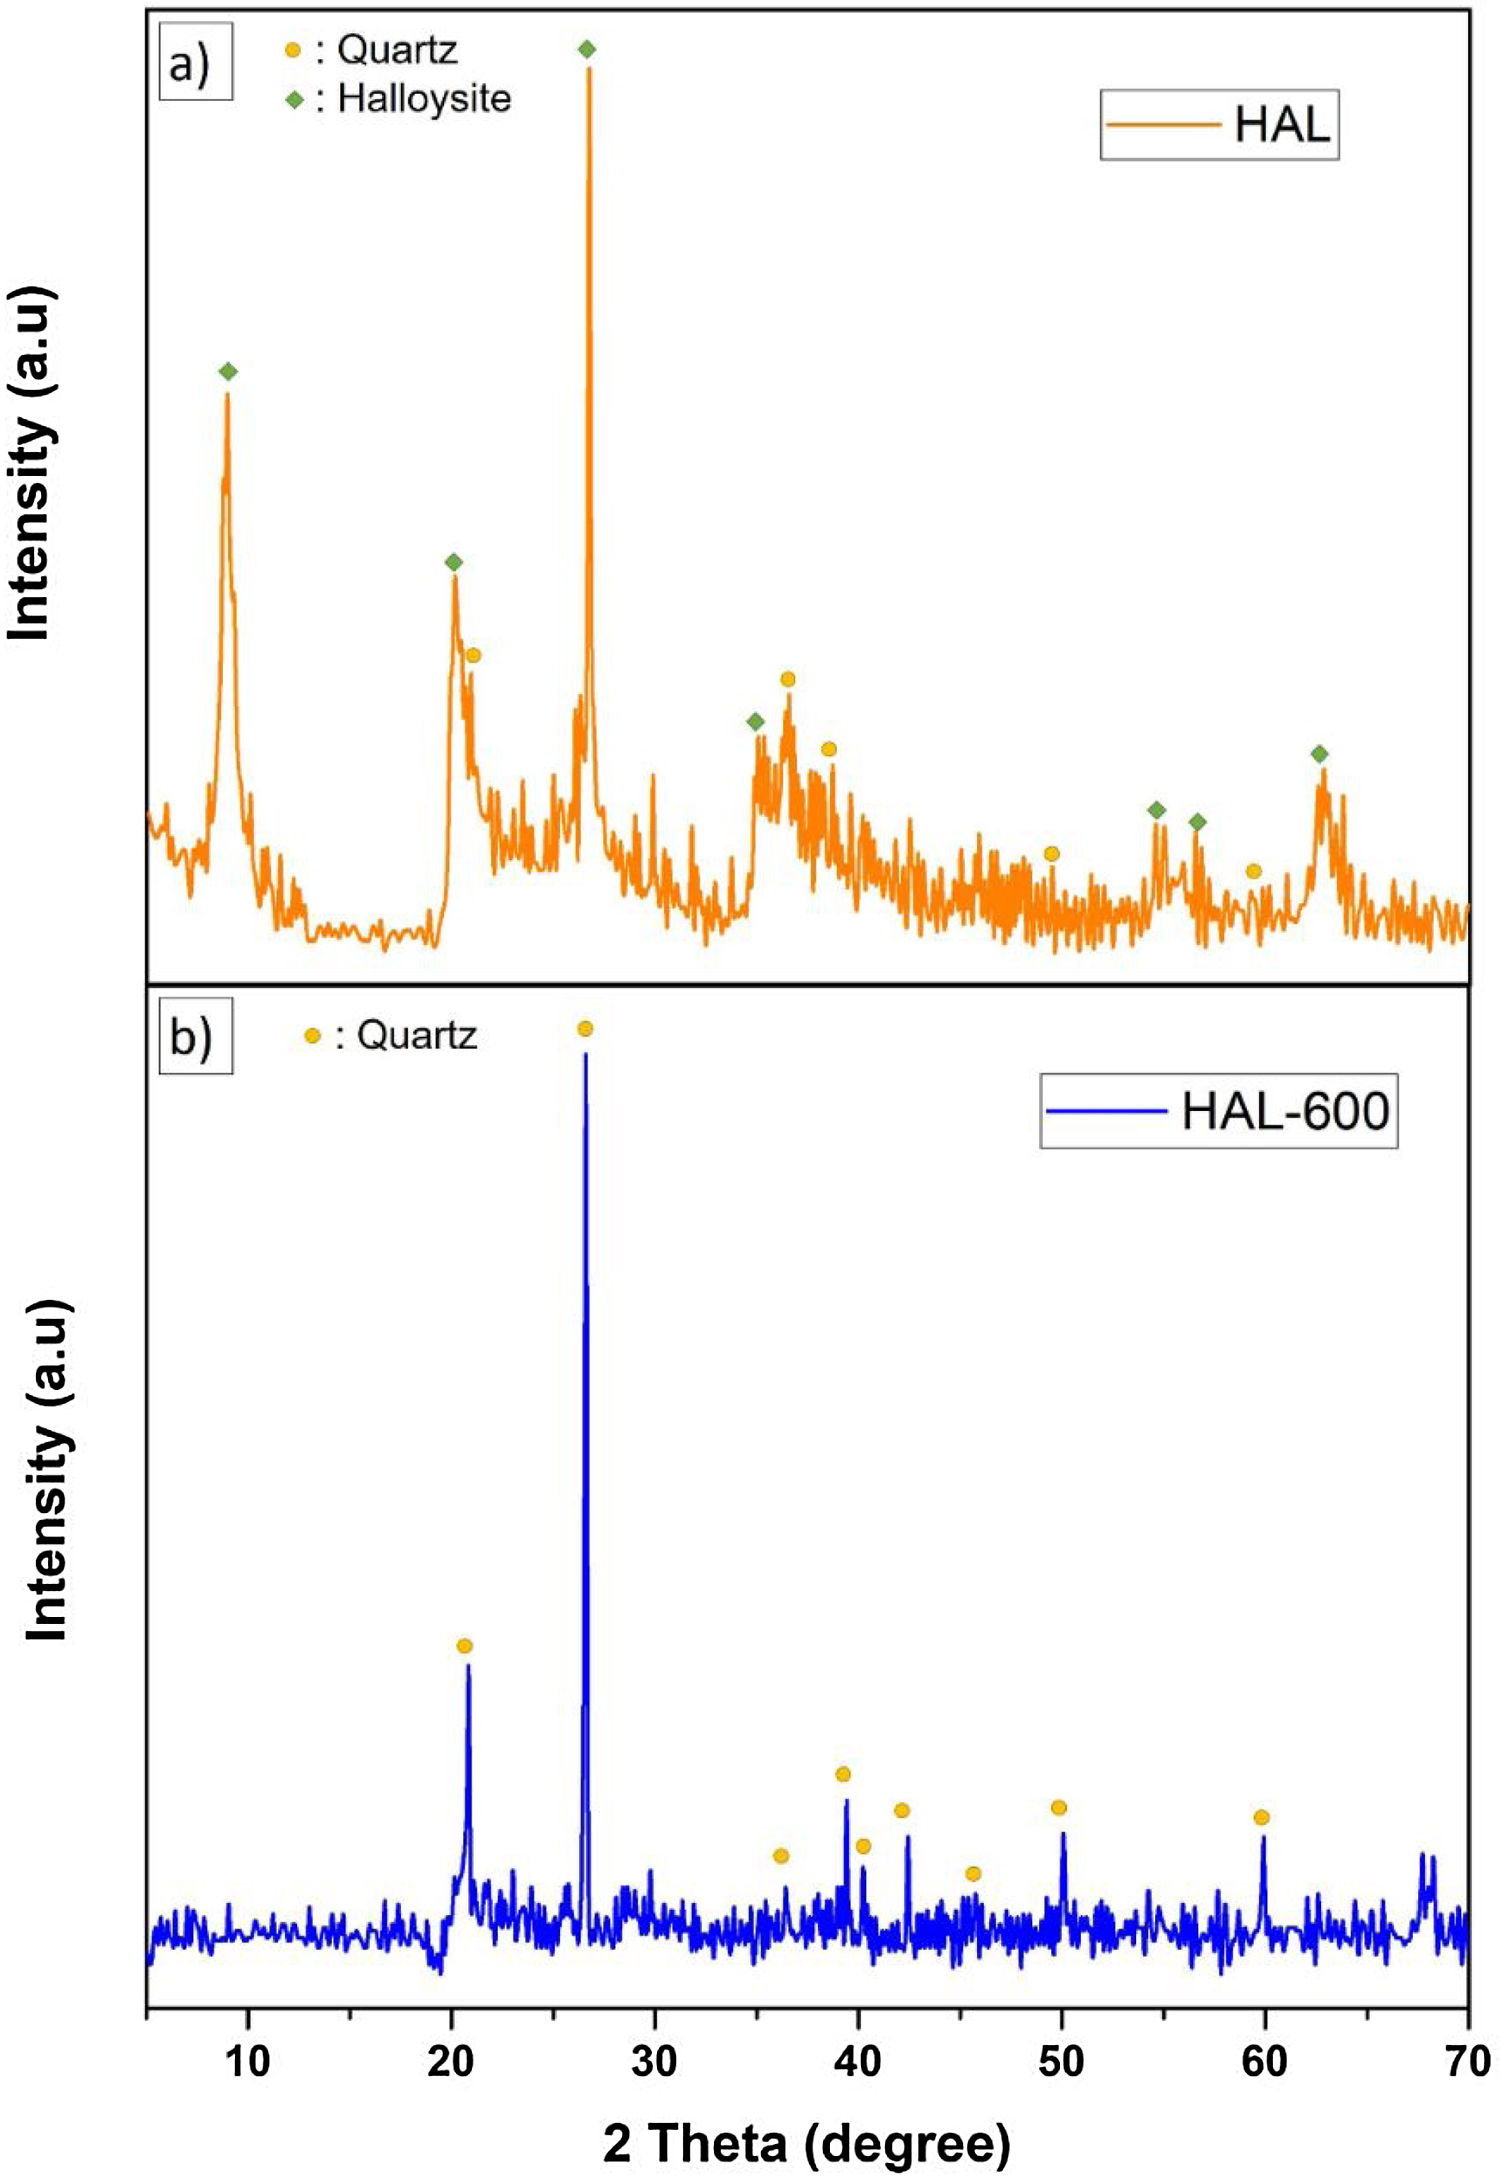
FT-IR spectra of the calcined halloysite powdersFig. 7 shows the infrared spectra of the samples calcined and uncalcined halloysite powders. Uncalcined halloysite is denoted as HAL, and halloysite calcined at 600°C denoted as Hal-600.

The FT-IR spectrum of uncalcined halloysite shows well-defined hydroxyl stretch bands characteristic for kaolin group minerals in the 3700–3600cm−1 region. Halloysite was calcined at 600°C, and uncalcined show bands associated with in-plane SiO stretching vibration in the 1000cm−1 region. The band at 1632cm−1 is observed in the spectrum corresponding to the strong bending vibrations of the adsorbed water [35]. In the case of HAL-600, a decrease in band intensity is observed in the 1000cm−1 compared to HAL. The OH stretching bands of the inner hydroxyl groups (3622cm−1) and inner-surface hydroxyl groups (3697cm−1) disappeared because of the dehydroxylation of halloysite after calcination at 600°C. In halloysite, dehydration ends and dehydroxylation begins in the temperature range of ∼450–700°C. As confirmed by the results of various studies, the release of OH groups from the octahedral coordinated Al3+ ion and the formation of metahalloysite have been reported in this region [25]. Ouyang et al. reported that, removal of the structural hydroxyls in the halloysite lattice yields an amorphous tube formed by highly distorted and randomly arranged [SiO4] tetrahedrons and [AlO6] octahedrons [47]. The microstructure photograph in Fig. 2(a) also supports the tubes formed after dehydroxylation of halloysite. The peaks at 999.76cm−1, 906.67cm−1, and 748.43cm−1 are due to in-plane stretching of SiO and OH deformation vibration of internal hydroxyl groups [48].
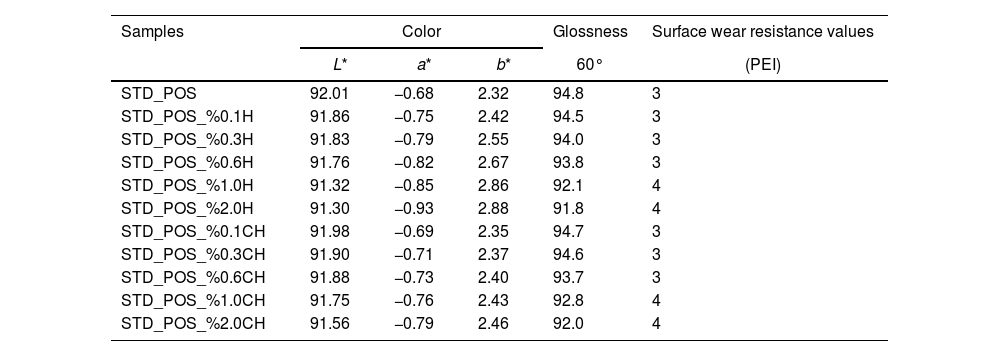
Optical properties and wear resistance of the compositionsThe optical properties and surface wear resistance (PEI) values of the studied samples are reported in Table 6. The L* value of the standard glossy opaque glaze sample is 92.01, a* value is 0.68, and the b* value is 2.32. The 60-degree gloss measurement value is 94.8. The surface abrasion value (PEI) value is 3 [40]. Optical properties and brightness values of halloysite added compositions also showed similar results to the standard. It is seen that calcined halloysite added compositions cause a minor change in color values. This reason is due to the removal of the coloring components in the calcination process at this stage. The gloss value decreases slightly, especially with an increase of 1% and 2% by weight in the addition of halloysite. However, this decrease is minimal. While the surface abrasion value (PEI) is 3 for the compositions with less than one weight percent halloysite added, this value increased to 4 when one weight percent or higher halloysite is added to the glaze.
Optical properties and surface wear resistance (PEI) value of the samples.
| Samples | Color | Glossness | Surface wear resistance values | ||
|---|---|---|---|---|---|
| L* | a* | b* | 60° | (PEI) | |
| STD_POS | 92.01 | −0.68 | 2.32 | 94.8 | 3 |
| STD_POS_%0.1H | 91.86 | −0.75 | 2.42 | 94.5 | 3 |
| STD_POS_%0.3H | 91.83 | −0.79 | 2.55 | 94.0 | 3 |
| STD_POS_%0.6H | 91.76 | −0.82 | 2.67 | 93.8 | 3 |
| STD_POS_%1.0H | 91.32 | −0.85 | 2.86 | 92.1 | 4 |
| STD_POS_%2.0H | 91.30 | −0.93 | 2.88 | 91.8 | 4 |
| STD_POS_%0.1CH | 91.98 | −0.69 | 2.35 | 94.7 | 3 |
| STD_POS_%0.3CH | 91.90 | −0.71 | 2.37 | 94.6 | 3 |
| STD_POS_%0.6CH | 91.88 | −0.73 | 2.40 | 93.7 | 3 |
| STD_POS_%1.0CH | 91.75 | −0.76 | 2.43 | 92.8 | 4 |
| STD_POS_%2.0CH | 91.56 | −0.79 | 2.46 | 92.0 | 4 |
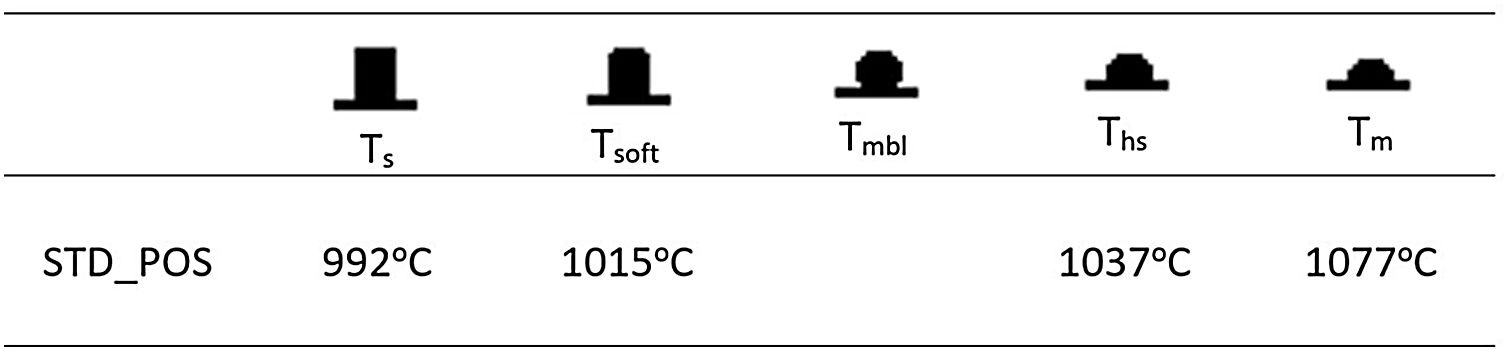
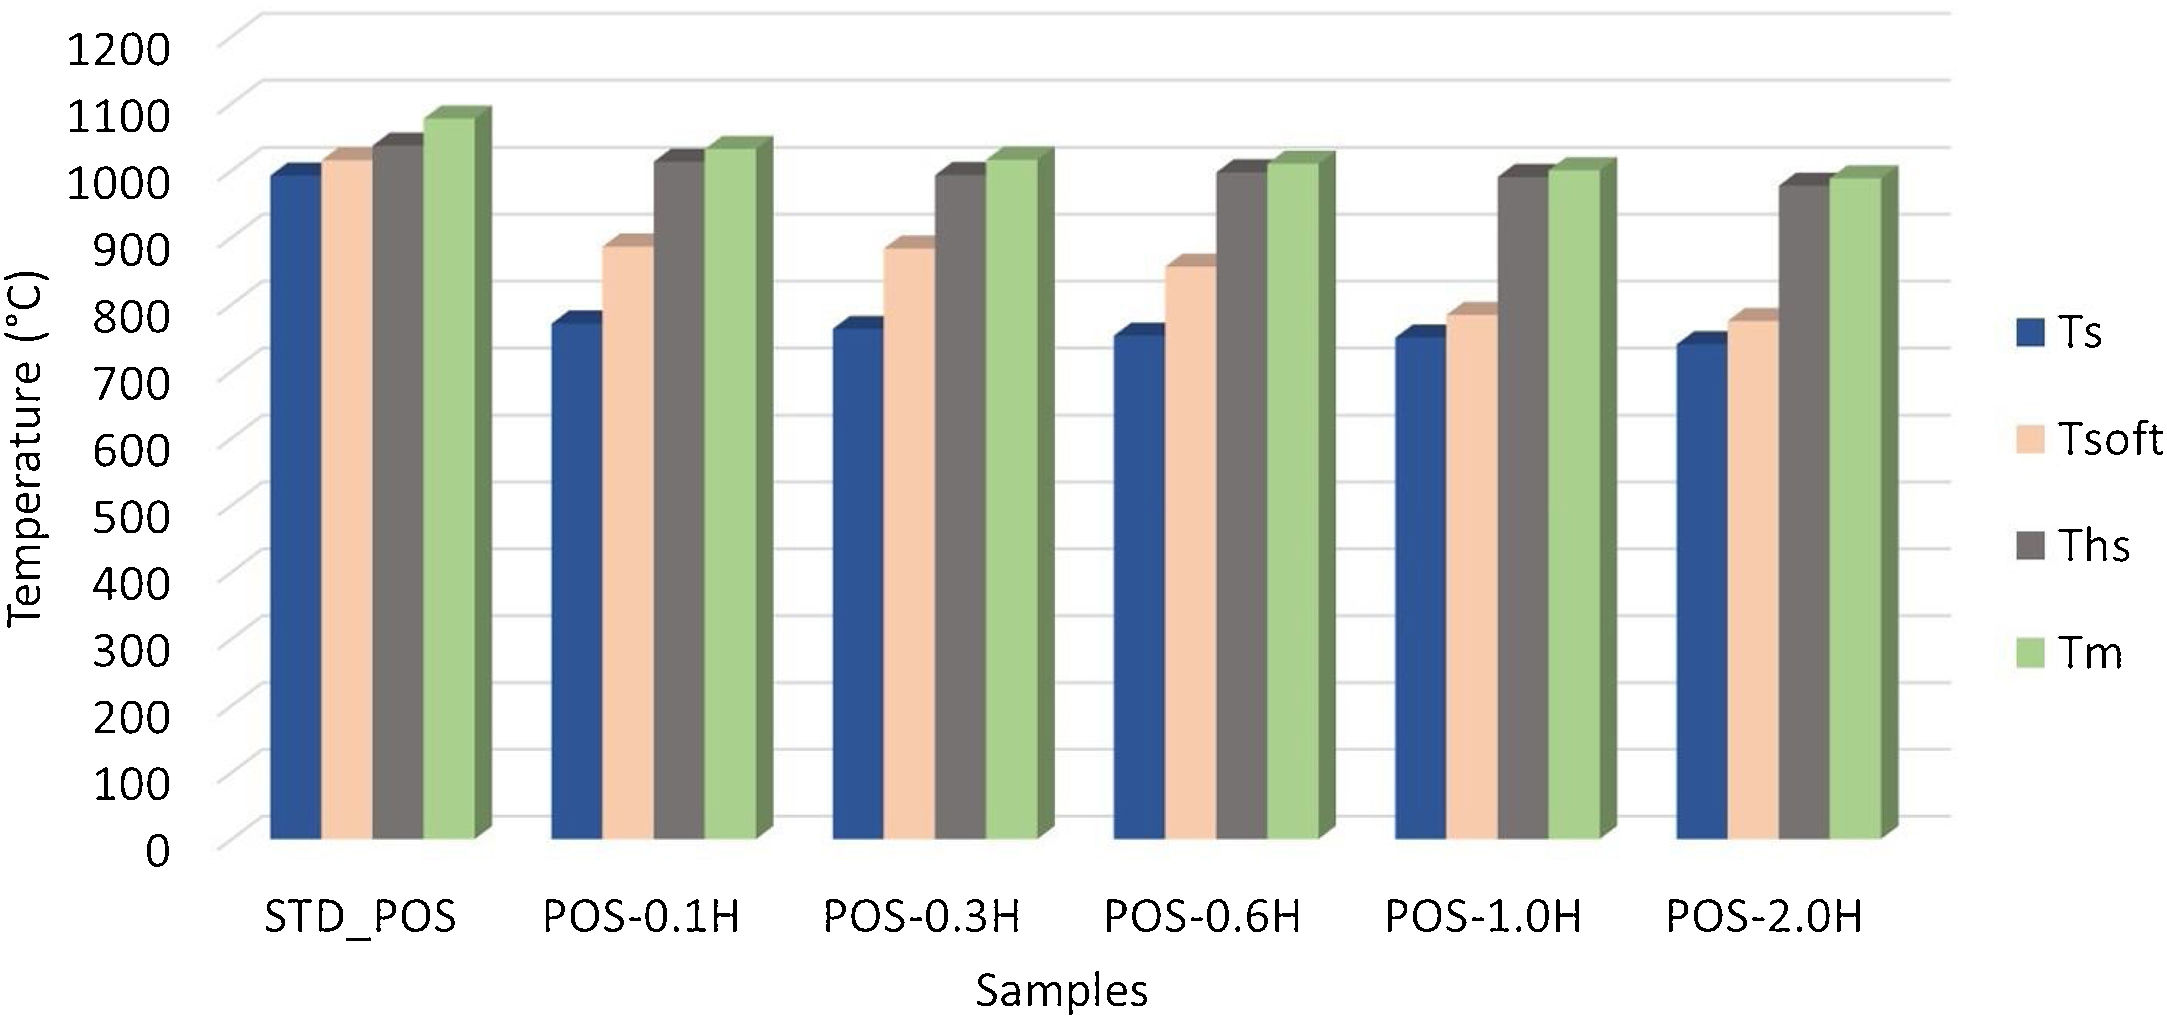
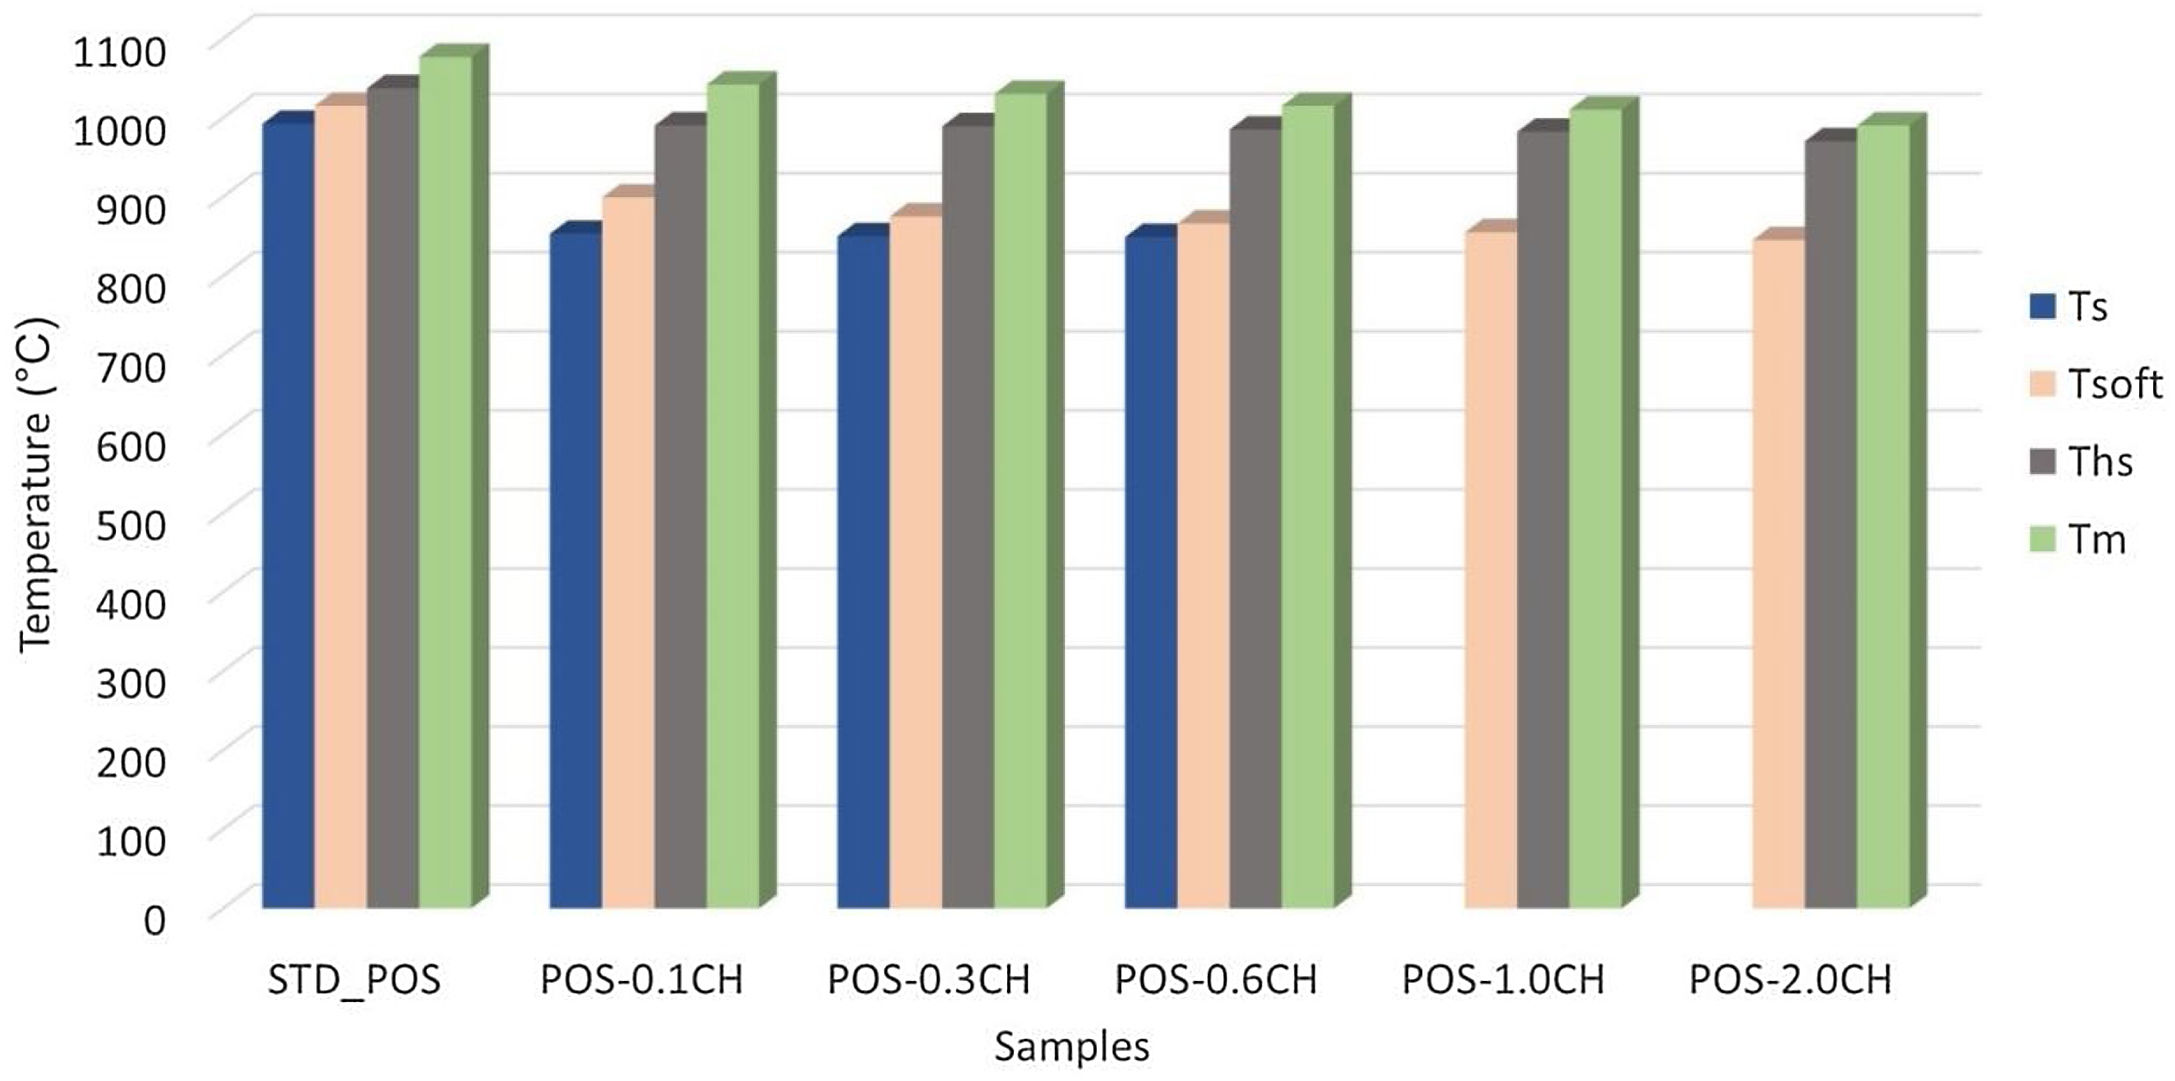
Hot-stage microscopy (HSM) measurements were performed to detect the melting behavior of the glazes with the addition of uncalcined and calcined halloysite clay. To obtain a high-quality surface, it is essential to fully understand the influence of different raw materials on the sintering and melting behavior of the glaze. Fig. 8 shows the standard glossy-opaque glaze images from critical points during heating in the HSM. The sintering temperature (Ts) of the standard glossy opaque glaze (STD_POS) is 992°C, the softening temperature (Tsoft) is 1015°C, the half-sphere temperature (Ths) is 1037°C, and the melting temperature (Tm) is 1077°C. It can only be observed for a few glazes as the formation of a sphere giving the characteristic temperature point corresponding to the minimum baseline (Tmbl) is assumed to be prevented either by residual raw materials or by crystalline phases embedded in a highly viscous melt formed during firing [49]. There is less research on the thermal behavior of the halloysite, and generally, it is accepted to be similar to kaolinite thermal behavior [25].

The sintering temperature (Ts) decreased to 771°C, the softening temperature (Tsoft) to 886°C, the half-sphere temperature (Ths) to 1013°C, and the melting temperature (Tm) to 1032°C by adding 0.1% by weight of halloysite clay to the standard glossy opaque glaze (Fig. 9). As the uncalcined halloysite ratio by weight increased, a significant decrease was observed in the characteristic melting temperatures of the glaze. Especially when the halloysite addition reached 2.0% by weight, it provided a very high decrease in the melting temperature of the glaze, and the melting temperature of the glaze fell to 988°C (Fig. 9). This tendency matches with Yibin's research. Adding 3% halloysite to iron-rich ZD coal sharply decreases the composition's softening, half-sphere, and melting temperature [50]. According to the study of Liu et al., glass transition temperature decreases slightly with Halloysite nano tubes (HNTs) content in the composite [51]. Hornak et al. mention an apparent decrease in glass transition temperature (Tg) with the increasing volume fraction of HNTs [52]. HNTs in a tubular shape have large surface areas and can act as effective nucleating sites, thus resulting in decreased characteristic temperatures. High surface area is considered the main driving factor for crystallization [53,54].

The changes in the melting behavior of the glaze with the addition of calcined halloysites were also investigated using a heating microscope. Fig. 10 compares the critical melting temperatures of the calcined halloysite added glossy opaque glaze with the standard glaze. With the addition of 0.1% by weight of calcined halloysite in the standard glossy opaque glaze, the sintering temperature decreased to 853°C, the softening temperature to 899°C, the half-sphere temperature to 990°C and the melting point to 1042°C, according to the standard glaze. Here, adding calcined halloysite at the rate of 2.0% by weight reduced the melting temperature to 990°C.

With the addition of calcined halloysite, the sintering temperature of the glaze is slightly higher than the uncalcined halloysite glazes. It is important to note that the calcined sample is dimensionally stable according to the uncalcined ones at the same compositions. This phenomenon is probably due to the solution of uncalcined halloysite particles in the liquid phase [55].
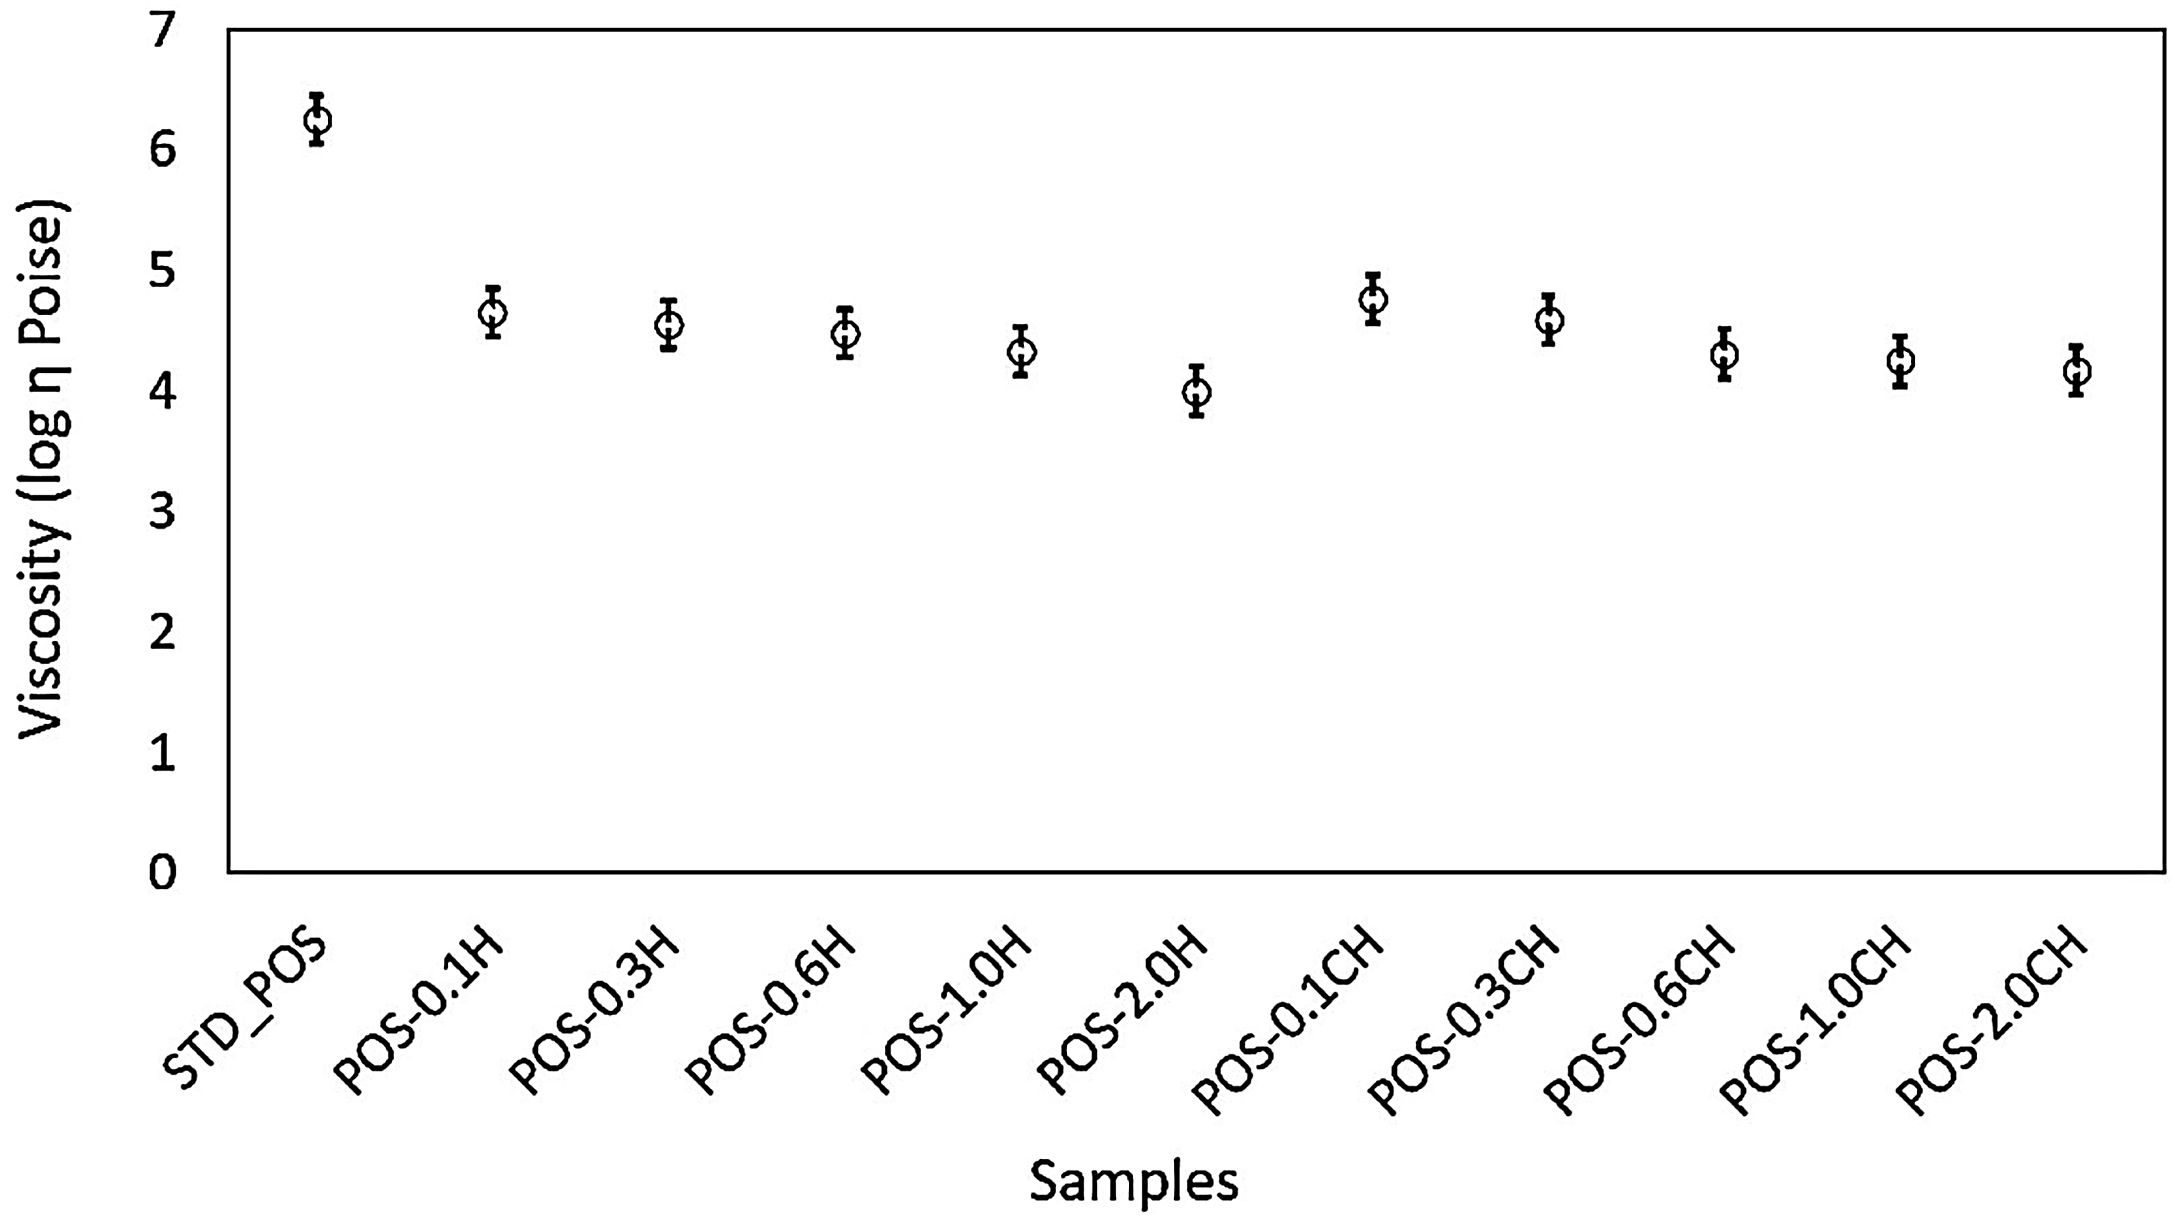
The viscosity of the glassy phase becomes very important in materials sintered with a viscous flow mechanism like a glaze [56,57]. Therefore, the compositions’ glassy phase viscosities (Fig. 11) were also investigated using a HSM device and the related equations (VFT equation). While the viscosity value of the standard glaze (STD_POS) was 6.25 Poise, this value decreased to 4.65 Poise with the addition of 0.1% by weight halloysite. When the ratio increased to 2%, the viscosity reached its minimum value (4.00 Poise).

A decrease in glaze viscosity is observed with the addition of calcined halloysite clay in the standard glaze composition (Fig. 11). The addition of 0.1% by weight of calcined halloysite reduced the viscosity value to 4.76 Poise. The addition of calcined halloysite at increasing rates again caused a decrease in the viscosity value. When this ratio reaches 2.0%, the lowest viscosity value is reached (4.17 Poise). After calcination, the rod-like structures became more stable, as seen from the microstructure Fig. 2(b). It explains why the glassy phase of the glaze has a slightly higher viscosity than that which has not been calcined.
The addition of both calcined and uncalcined halloysite in the standard glaze reduces the viscosity of the standard glaze. However, it shows that the non-calcined halloysite addition significantly reduces the sintering temperature of the standard glaze. These results reflect the viscosity values. It is evident that the increase of halloysite decreases the viscosity correspondingly and thus lowers the characteristic temperatures [58].
Phase analyses of the samplesThe crystalline phase composition of initial halloysite clay and calcined halloysite clay by XRD analyses are given in Fig. 12. The initial halloysite powder showed a (001) reflection at ∼8.96° (2θ) belonged halloysite-(10A) form (JCPDS # 029-1489) as well as traces of quartz (JCPDS # 046-1045). The characteristic peaks of hydrated halloysite were observed at 20.218, 26,742, 35.058 as seen from diffraction pattern (Fig. 12a). After subjecting to temperature from 600°C initial halloysite powders lost the peak at 8.96° (2θ) (Fig. 12b). This is a significant sign for the absence of the 10Å form and converting to the dehydrated state. After heat treatment at 600°C, halloysite clay showed quartz which exists already in the initial form, but halloysite crystalline phase was not observed. Because the heat treatment demolishes the halloysite crystalline phase by the well-known dehydroxylation process and transformed to an amorphous phase named metahalloysite. As metahalloysite presents a short range order, no XRD Bragg refractions are present. Therefore, it is difficult to evaluate this phase using XRD analysis [34]. Calcined halloysite is obtained by controlled calcination of high purity tubular halloysite clay.
 initial halloysite clay and (b) halloysite clay calcined at 600°C.")
The phases in the main composition were determined by XRD analysis of the standard glossy opaque glaze. The X-ray diffraction pattern corresponding to standard glossy opaque glaze (POS_STD) is shown Fig. 13. As it can be observed, quartz (JCPDS # 046–1045), zircon (JCPDS #06-0266), kaolinite (JCPDS # 05–0143) and anorthite JCPDS # 041–1486) appear in the standard (POS_STD) composition.

The XRD graph of the glazes prepared by adding halloysite 1% and 2% by weight and calcined halloysite clay to the composition is given in Fig. 14. Quartz (JCPDS # 046-1045), zircon (JCPDS #06-0266), halloysite (JCPDS #29-1487), kaolinite (JCPDS # 05–0143), and anorthite JCPDS # 041–1486) appear in the standard. The purpose of choosing these compositions is that they show better mechanical properties than others.
Hardness and mechanical properties of the samples
Vickers hardness is widely used for quantitative testing for hardness in the ceramic industry [16]. While the Vickers hardness value of the standard glossy opaque glaze was 5.96GPa, the hardness value of the glaze increased with the addition of halloysite (Fig. 15). It reached its maximum value (9.36GPa), especially with the addition of 2.0% by weight halloysite.

The increase in the hardness value of the glaze with a calcined halloysite clay is also shown in Fig. 15. The hardness value increases linearly with the increase in the amount of halloysite. By adding 2% by weight, the maximum hardness value (9.36GPa) was obtained. Halloysite has been used as an additive to improve some properties of ceramics [59]. Crystallization of halloysite phases in the glazes for ceramic wall tiles can be responsible for its higher micro-hardness property. Because of its needle-like structure, halloysite crystal can improve the micro-hardness of the glass-ceramic glazes [15]. Silva has produced an opaque glaze through the zircon formation, and the hardness can reach only 3.6GPa [60]. The Vickers hardness of the glaze for anorthite porcelain examined by Cheng et al. is about 2.48GPa, which is much higher than the soft porcelain glaze and close to that of the hard porcelain glaze [16]. According to the study of Kamble et al., halloysite nanotube added polymer nanocomposite had been observed to develop superior mechanical performance [61]. Typically, adding 3–5wt% halloysite to polymers increases the composite mechanical strength by 30–50% [62].
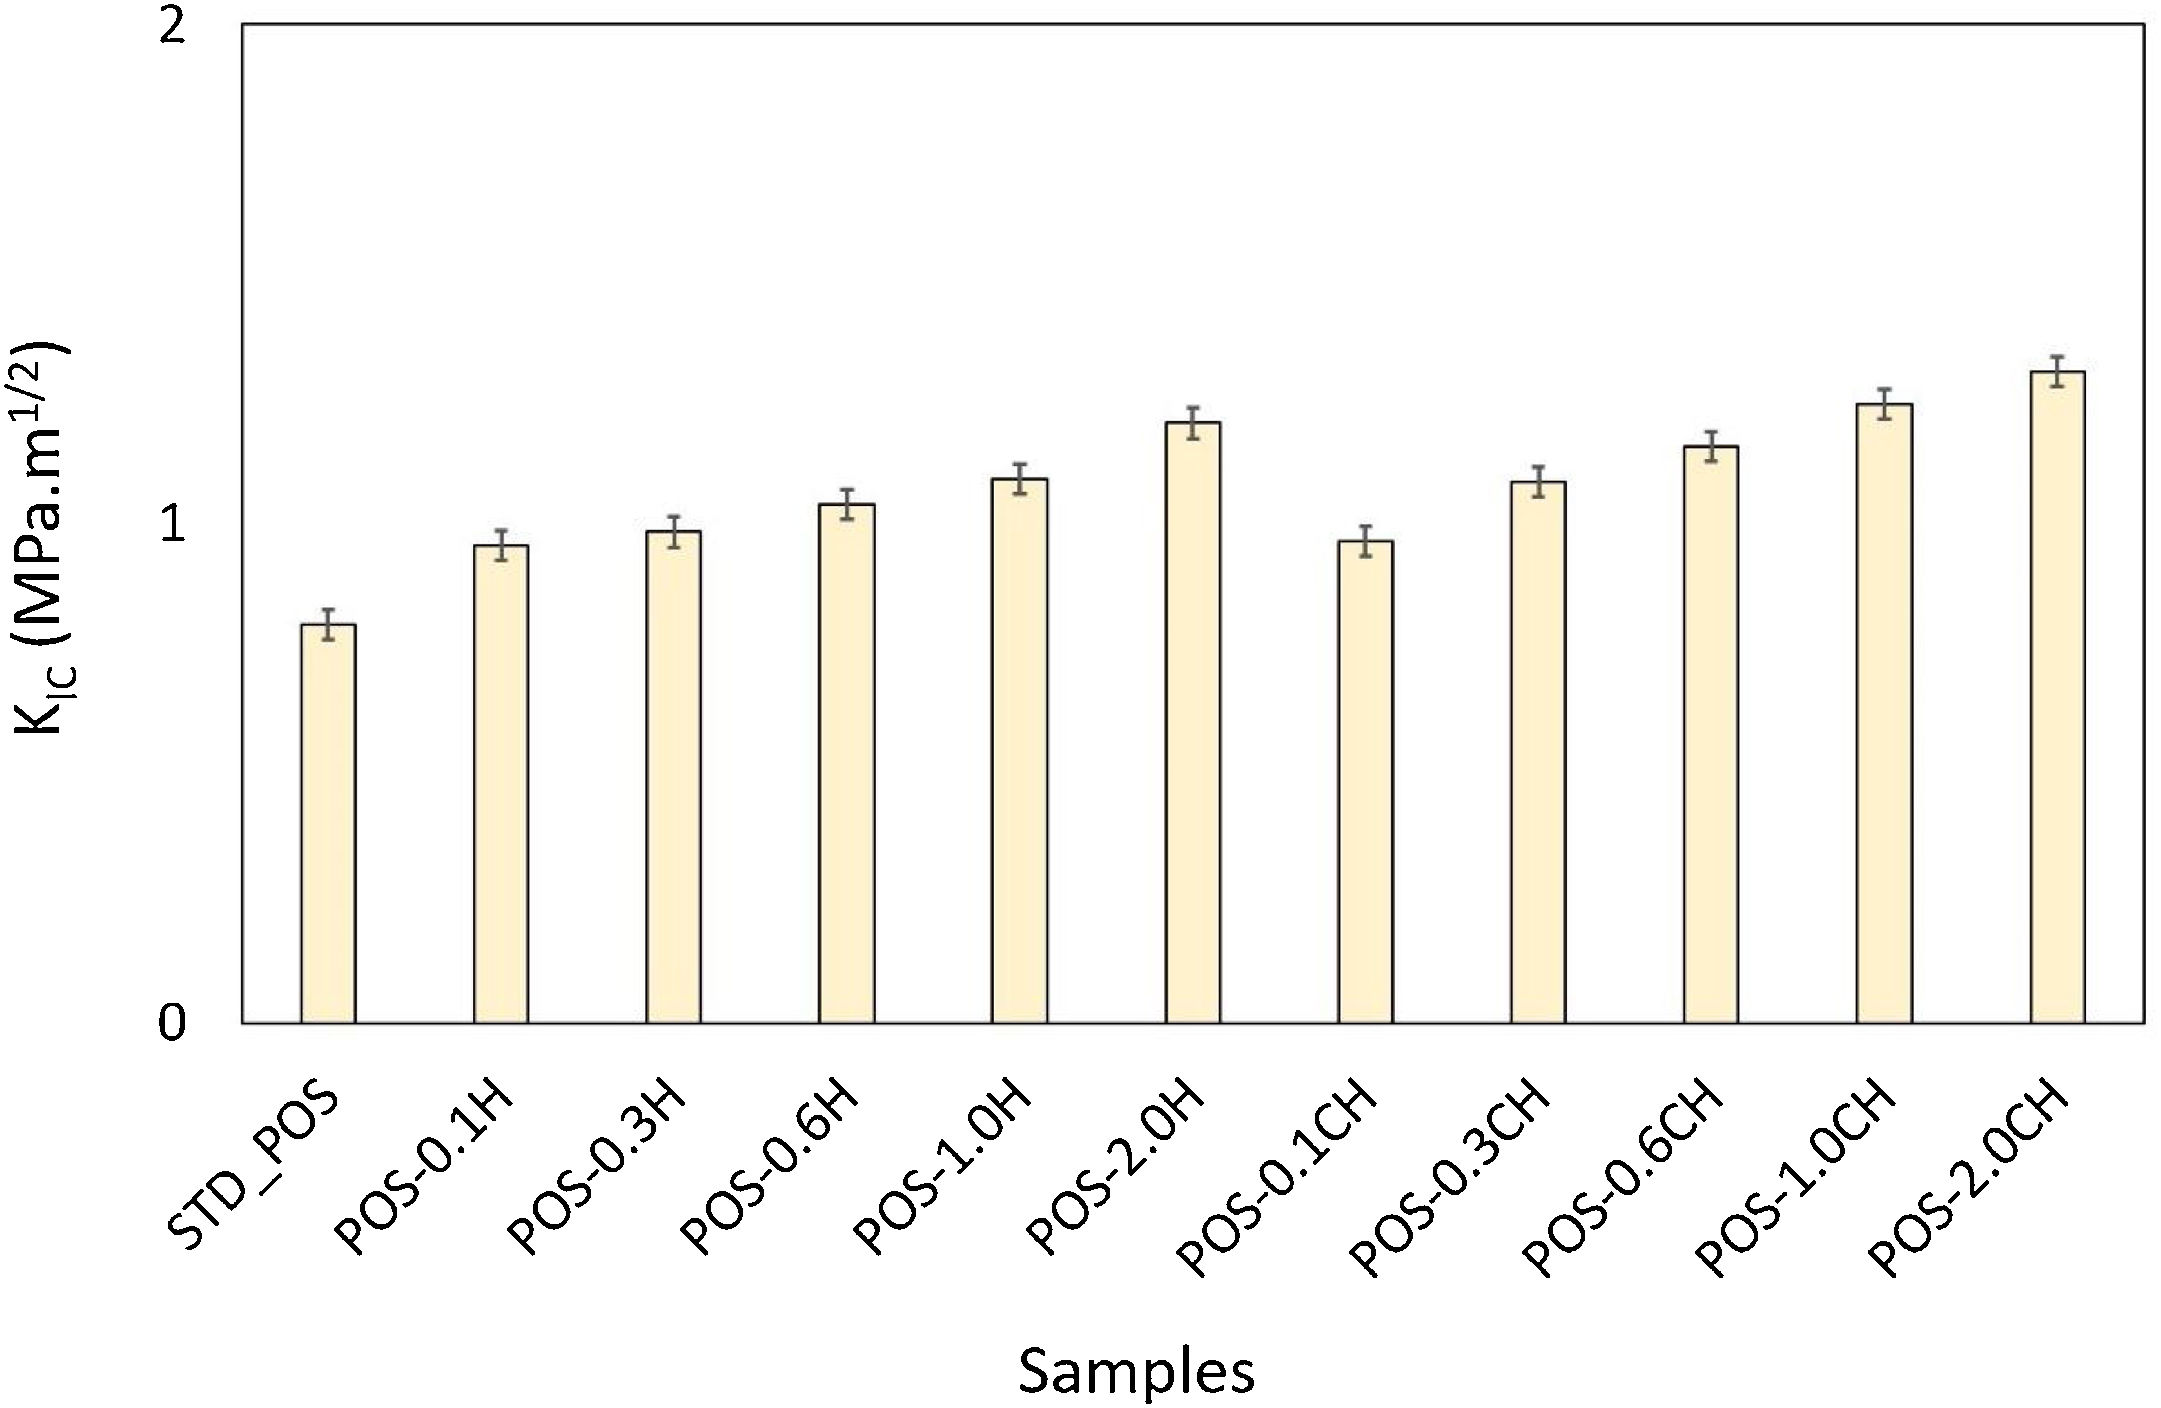
Fracture toughness of the standard and halloysite added compositions are given in Fig. 16. It shows that fracture toughness is affected by the halloysite addition. While the fracture toughness value of the (STD_POS) sample is 0.797±0.03MPam1/2, this value increases with the addition of halloysite. This value reaches the maximum point (1.201±0.03MPam1/2) with the addition of 2% halloysite by weight.

In this study, fracture toughness values of glazes with calcined halloysite addition were also measured (Fig. 16). According to the graph, especially 0.6% by weight and above, higher fracture toughness values were obtained compared to the uncalcined samples; the fracture toughness value of 1.155MPam1/2±0.03 with the addition of 0.6% calcined halloysite by weight, 1.239MPam1/2±0.03 with the addition of 1.0wt.%, and 1.304MPam1/2±0.03 with the halloysite calcined 2% by weight. While the maximum amount of uncalcined halloysite addition, fracture toughness value is 1.201MPam1/2±0.03, this value reached 1.304MPam1/2±0.03 with the same amount of addition of calcined halloysite. Similar results apply to Vickers hardness. Therefore, the calcination process has a significant effect on increasing the mechanical properties. Halloysites are clays with tubular structures by nature. The calcination process stabilized these tubular structures. Halloysite grains turned into needle-like crystals by firing at a high temperature (1050°C). In particular, such acicular crystals have an essential contribution to improving ceramics’ fracture toughness and mechanical properties [63,64].
ConclusionsThis study investigated the effect of calcined and non-calcined halloysite on the microstructure and properties of the glossy opaque glaze. Calcination of halloysite at 600°C initially involves dehydroxylation in which most of the hydroxyl groups are removed, and halloysite transforms into metahalloysite. This situation is supported by the FTIR and XRD results. Metahalloysite peaks were not observed in calcined halloysite due to their amorphous structure. The high surface area of the halloysite shifted the characteristic temperatures to the lower for all compositions. Compared to standard glossy opaque glaze, almost all the halloysite added samples displayed similar optical properties but higher hardness, surface wear resistance, and fracture toughness values. The 2% halloysite addition (calcined and uncalcined form) showed the highest mechanical properties among the compositions. While the Hv value of the sample (STD_POS) is 5.96GPa, the hardness value for the glaze containing calcined halloysite and uncalcined halloysite increases up to 9.52 and 9.36GPa for POS-2.0CH and POS-2.0H, respectively. The wear resistance value (PEI) is 3 for the compositions with less than one weight percent halloysite added; this value increased to 4 when one weight percent or higher halloysite is added to the glaze. This result is an excellent contribution to the wear resistance of glazes.
Conflict of interestThe authors declare that they have no known competing financial interest or personal relationship that could have appeared to influence the work reported in this paper.

