


En este trabajo se describe el experimento para realizar mediciones espectroscópicas de absorción solar en el infrarrojo desde el observatorio atmosférico de la Universidad Nacional Autónoma de México (UNAM), ubicado en el campus de Ciudad Universitaria en la ciudad de México. El espectrofotómetro por transformada de Fourier en el infrarrojo (FTIR por sus siglas en inglés) opera con el rastreador solar desde junio de 2010, y a partir de los espectros medidos se calculan las densidades totales de columna de varios gases atmosféricos. Se presentan los resultados para el metano (CH4), un contaminante que participa en la formación de ozono y que es importante como gas de efecto invernadero. Las columnas totales obtenidas con alta resolución temporal muestran gran dispersión y variabilidad diaria. Para los análisis que comprenden el periodo junio de 2010 a diciembre de 2011 se obtuvo un valor promedio de 2.88 × 10¹⁹ moléculas/cm2 (1.829 ppm) con un intervalo de confianza del 95% entre las 2.62 y 3.14 × 10¹⁹ moléculas/cm2. No se puede identificar un ciclo anual claro de los promedios mensuales, lo cual sugiere una afectación significativa de la concentración natural de fondo como resultado de las emisiones locales. Se presentan algunos días con aumentos extraordinarios, y un análisis sencillo de las trayectorias apunta a una dirección predominante desde el noreste del sitio de mediciones. Sin embargo, es probable que las masas contaminadas con metano que pasan sobre el observatorio atmosférico de la UNAM se originen no en una sino en varias fuentes distribuidas por la ciudad de México. Se requiere análisis más detallado de la dinámica de estas masas de aire mediante modelación.
In this work, the experiment for performing solar-absorption infrared measurements from the atmospheric observatory of the Universidad Nacional Autónoma de México (UNAM) located at the university campus in Mexico City is described. The Fourier transform infrared (FTIR) spectrometer and solar-tracking system have been operating since June 2010, and from the recorded spectra the total column amounts of several atmospheric gases can be derived. The current study presents the results obtained for methane (CH4), an important pollutant involved in ozone production and a rapidly increasing greenhouse gas. The total column amounts, retrieved with high temporal resolution, present a large dispersion and day-to-day variability. A mean value of 2.88 × 10¹⁹ molecules/cm2 (1.829 ppm), with a 95% confidence interval between 2.62 and 3.14 × 10¹⁹ molecules/cm2, has been obtained for the period from June 2010 to December 2011. No clear annual cycle can be determined from the monthly means due to the large variability in the measurements, suggesting a significant effect of local emissions on the natural background concentrations. Some days with extraordinary enhancements are presented and a simple back trajectory analysis points to a predominant source direction from the northeast of the measurement site. The methane-contaminated air masses passing over the UNAM atmospheric observatory, however, originate presumably not from one but several dispersed sources. A more detailed analysis with modeling of the dynamics of these air masses is required.
Solar absorption infrared spectroscopy is a remote sensing technique, which has been used with increasing interest to determine changes in the composition of the atmosphere. It is based on the measurement of direct solar radiation in the infrared part of the spectrum to derive the total integrated column amount of individual gases, which absorb part of the light along the optical path. A Fourier transform infrared spectrometer (FTIR) in conjunction with a solar-tracker, a device that follows the sun and directs the radiation into the spectrometer, serve to record the infrared spectra. Instruments with enough spectral resolution, such as those participating in the Network for the Detection of Atmospheric Composition Change (NDACC, http://www.acd.ucar.edu/irwg/) have the possibility to report vertical columns of gases such as O3, HNO3, HC1, HF, CO, N2O, CH4, HCN, C2H6 and C1ONO2. At first, these observations were aimed at understanding the chemistry and evolution of the ozone layer but the objectives of the network has widened to other areas of research. The Total Carbon Column Observing Network (TCCON, http://www.tccon.caltech.edu/), on the other hand, is focused on deriving accurate and precise column-averaged abundances of greenhouse gases mainly involved in carbon chemistry. Data from the various NDACC and TCCON sites operating instruments of this kind also have been widely used to validate column amounts measured with other techniques (Rinsland et al., 2006; Wiacek et al., 2007; Sepúlveda et al., 2012; Viatte et al., 2011a) and from satellite instruments (Vigouroux et al., 2007; Bergamaschi et al., 2009; Stremme et al., 2012; Buchwitz et al., 2013). FTIR spectrometers with lower spectral resolution also have been employed with other advantages such as lower-cost and higher temporal resolution (Stremme et al., 2009; Viatte et al., 2011b; Gisi et al., 2012).
Methane is the second most important greenhouse gas influenced by human activities after carbon dioxide, which in a 20-year time horizon has a global warming potential 84 times greater than CO2 (Prather et al., 2012). With a lifetime of 12 years, defined mostly by its reaction with the OH radical, methane is considered together with tropospheric ozone and black carbon, one of the short-lived climate forcers (SLCF) thought to account for 40-45% of the anthropogenic radiative forcing. Thus, reducing emissions of SLCF could significantly slow the warming of the atmosphere according to recent studies (Bond et al., 2013; IGSD, 2013). The radiative forcing of methane alone was estimated to be 0.48 [0.43 to 0.53] W/m2 in 2011, which is about 26% of the radiative forcing due to CO2 (IPCC, 2013). CH4 emissions are, however, still increasing and could accelerate with current interests to exploit natural gas reserves.
In the past decade, the main anthropogenic sources were agriculture and waste, fossil fuels and biomass burning (including biofuels) with 209, 96 and 30 Tg(CH4) yr−1, respectively. These include rice-paddies agriculture, ruminant animals, sewage and waste, landfills, and fossil fuel extraction, storage, transformation, transportation and use (coal mining, gas and oil industries). Natural sources, which account for 35-50% of the total global emissions, are dominated by wetlands, which are highly sensitive to climate change and variability. The global methane concentration has increased by a factor of 2.5 since preindustrial times, from 720 ppb in 1750 to 1803 ppb in 2011, and has been steadily increasing at a rate of 4-5 ppb yr−1 in recent years (Sussmann et al., 2012).
In this work, we have used the solar absorption infrared spectroscopic technique to retrieve methane column amounts over Mexico City. Due to the importance of this gas and because its sources in most cities are poorly quantified, the total column of methane is studied above the Mexico City metropolitan area (MCMA), one of the most densely populated areas of the world. There are important sources that could contribute to the methane abundance above the measurement site, such as water treatment plants, landfills, the sewage system, and the transportation of natural gas used in households and industry, delivered both by trucks and a complex pipe system. Another source that can contribute to methane enhancements in the air is biomass burnings in the surrounding areas and the transport of polluted air from the north of the city, where large industrial areas are located. The MCMA is surrounded by hills and mountains except to the north, forcing polluted air masses to stay over the city. A recent study suggests that methane emissions in large urban areas could be as high as twice from what is reported by the official inventory (Wunch et al.,2009).
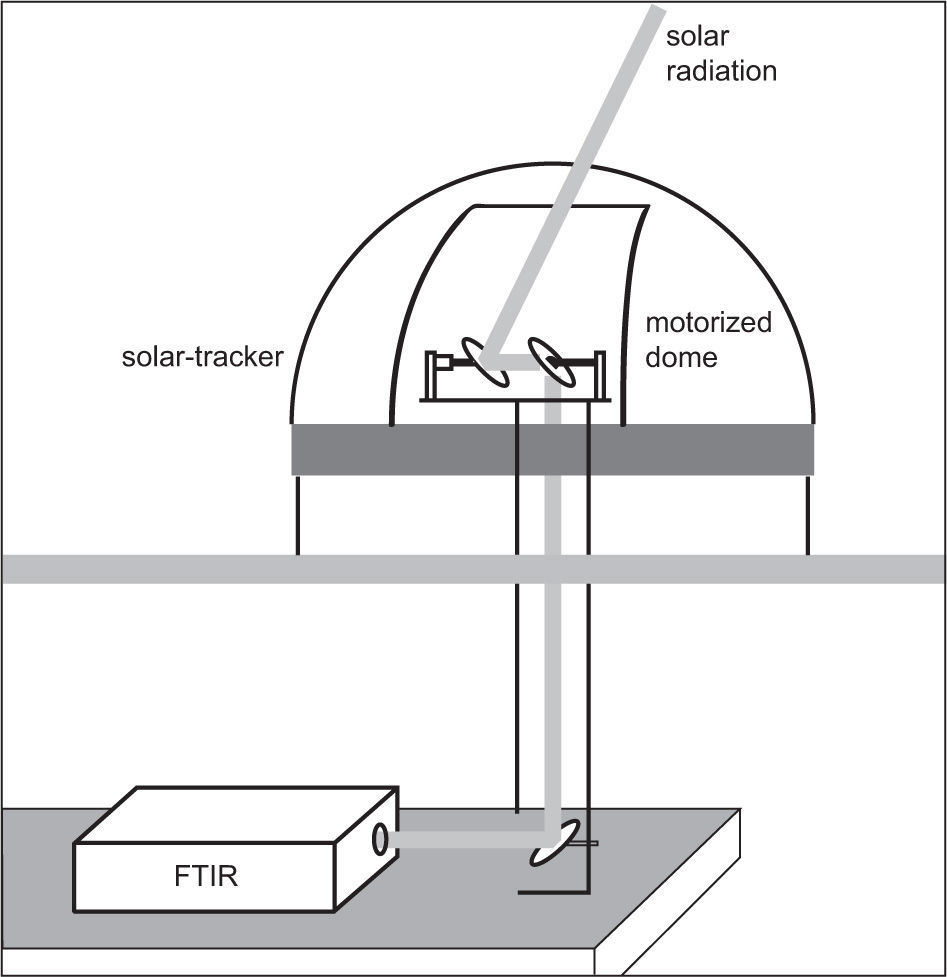
2Instrumental set-upThe solar-absorption infrared spectrometer is located at the atmospheric observatory of the Universidad Nacional Autónoma de México (UNAM), on the rooftop of the Centro de Ciencias de la Atmósfera (Atmospheric Sciences Center, CCA), within the main campus of UNAM and on the south side of the city (19.326° N, 99.176° W, 2290 masl). The fact that the instrument is situated within a mega-city represents an excellent opportunity to study the gases generated by a great number of processes that take place in the first layer of the atmosphere. The infrared spectrometer operates together with a custom built solar-tracker as described below. A motorized dome was installed on the rooftop to protect the solar tracker and software was written to move the dome azimuth angle automatically according to the position of the sun. A tube 8” in diameter was inserted through the ceiling to support the solar tracker base and allow sunlight to the laboratory one floor below. A system of mirrors guides the radiation into the entrance of the spectrometer. With this configuration, solar spectra have been collected since June 2010 whenever weather conditions are favorable. Prior measurements starting in 2009 were made with a spectrometer of lower resolution (see Section 2.2 and Stremme et al., 2009). The observatory in its current form, depicted schematically in Figure 1, is complemented by a meteorological station, a multi axis differential optical absorption spectrometer (MAX-DOAS), a light detection and ranging (LIDAR) system, and other instruments that operate continuously.

The solar tracker is composed of two elliptical plane mirrors. The first has the capability to move in two axes since it is held by a mounting system driven by two stepping motors (Oriental Motor Co., model PK266-02A). One motor sets the zenith and the other one the azimuth angle of the mirror so that the sunlight is directed towards the second mirror, which is fixed to a rotating base looking down at a 45° angle. The second mirror is centered over an 8” aperture in the base plate and exactly over the vertical tube connecting to the laboratory. A third mirror fixed on the bench table of the laboratory receives the light and directs it towards the entrance port of the spectrometer. Along the path, a 1” mirror deflects part of the light and projects it onto a white surface. A camera records the projected spot and serves as feedback to make fine corrections of the mirror movements. A “dark” filter allows the camera to see only a bright circle where the sun is located, while the rest of the image remains totally dark.
The software for solar tracking was developed in the Lazarus environment which provides various tools for applications and is based on the programming language Pascal (http://www.lazarus.freepascal.org/). The projected sunspot captured by the camera is manually moved to the position where the light is accurately focused into the detector of the spectrometer and then used as feedback to continuously correct the movement of the sun. A graphical user interface was developed to change and control the parameters, view settings and actual positions of the solar image, and establish whether the tracking conditions allow the taking of measurements.
A glass fiber dome (Technical Innovation, model HS-6), 1.8 m in diameter, is installed around the solar tracker on the rooftop and is controlled with a software written in C++. The program has been fully automated to power the motors both for opening/ closing the hatch and turning the dome to follow the movement of the sun throughout the day.
2.2FTIR spectrometer and acquisition parametersAn FTIR spectrometer (Bruker Optik GmbH, model Vertex 80), with maximum unapodized resolution of 0.06cm−1, was installed in June 2010 with the configuration shown in Figure 1. Although prior to that date another spectrometer with lower spectral resolution was operational (Bruker Opag22, max. resolution 0.5cm4), the data presented in this contribution was obtained from the newer Vertex 80 instrument. The spectrometer is equipped with a KBr beam-splitter/ windows and two detectors (mercury cadmium telluride [MCT] from 12 500-400cm−1 and InGaAs from 14300-3800cm−1). The MCT detector needs to be cooled by filling its dewar with liquid nitrogen. A rotating wheel that houses a set of narrow-band filters is used to make measurements in specific frequency ranges. The OPUS v6.5 program from Bruker is used to record the spectra by selecting a sequence of spectra to be measured with a selected filter and detector following a predetermined observing schedule.
The solar absorption spectra used in this work were taken with a resolution of 0.1cm”1 between 400 and 8000cm−1, using the KBr beam-splitter, an aperture of 1mm and no filter, since filters were not available at the time. For this work only data recorded between June 2010 and December 2011 have been used. Depending on the time of the year and the sky conditions, measurement routines were started after 8 LST (local standard time = UT-6) and concluded at around 18 LST, when the sun falls behind the line of trees west of the building where the observatory is located.
2.3AutomationThe solar IR absorption measurements have been semi-automated to start the measurements remotely. The computer can be accessed from any device with Internet connection and if the weather conditions are favorable, the following steps are conducted:
- 1.
Liquid nitrogen is filled into the detector with a special self-constructed dispensing system. It consists of a 35 L dewar connected to a liquid withdrawing device and a phase separator. A solenoid valve was installed which opens when a voltage is applied through a computer-controlled timer. Liquid nitrogen flows through a funnel into the detector for a specified time, usually 60 to 90 seconds depending on how full the 35 L dewar is and how much pressure is accumulated inside it.
- 2.
The dome is opened and set to automatic-turning mode.
- 3.
Mirrors are moved manually to search for the position where the sunspot is seen by the camera, then the solar tracker is activated and, using the sunspot as feedback, the mirrors are finely and continuously moved to fix the beam into the spectrometer.
- 4.
The interferogram signal is checked in the spectrometer and the settings are adjusted (gain, aperture) for each measurement mode (filter, detector). The sequence is launched and the automatic measurement begins.
To secure good quality spectra, the settings need to be checked and re-adjusted every few hours. At the end of the day the measurement sequence is stopped and the dome is sent to home position and closed. After the spectra are recorded, an initial quality-control procedure is applied in which the spectra taken with clouds and excessive noise are eliminated from the data set. This process is carried out by a program written in interactive data language (IDL) that compares the average intensities between two regions in each spectrum, one region corresponding to thermal emission (500.0-1500.0cm−1) and the other one where the direct solar radiation, with this optical set-up, presents a maximum (3900.0-5200.0cm−1). This process guarantees that all spectra in our database were recorded during clear sky conditions.
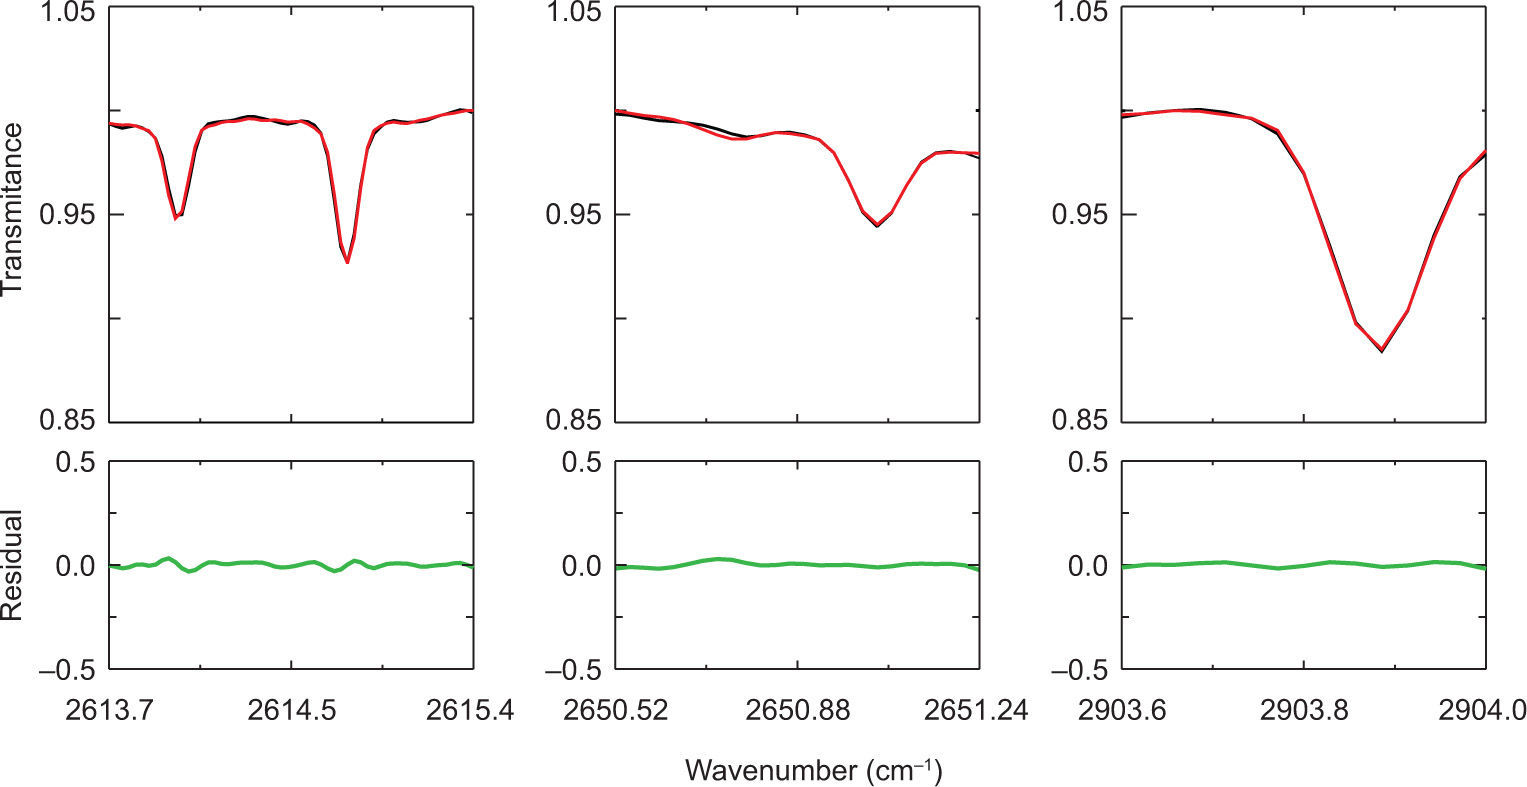
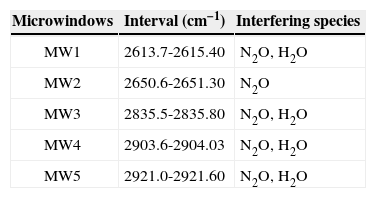
3RetrievalThe solar FTIR spectra were analyzed with the SFIT2v.4.003 code (Ridder, 2011), which has been co-developed at NASA Langley, NIWA Lauder and the NDACC Community (NCAR, Bremen, Wollon-gong) for retrieving columns and vertical profiles of atmospheric gases from ground-based solar absorption spectra. Total column amounts for a number of trace gases as well as of the interfering species are retrieved by simultaneously fitting the simulated spectra to the measured ones within a specified spectral regions, or microwindows (Tables I, II). For some gases a low resolution vertical profile may be retrieved. The code calculates a synthetic spectrum using a forward model in which the atmosphere is modeled by a number of homogeneous layers. Each of these layers is associated with values of temperature, pressure and concentration of the gases of interest. The radiative transfer that occurs through the atmosphere, from the top to the place where the instrument is located, must be calculated using a ray-tracing algorithm. This calculation includes the solar zenith angle at the time of the measurement, the effect of the curvature of the atmosphere and the effect of refraction. Once the synthetic spectrum is calculated, it is compared with the measured one and the forward model is adjusted until the best fit between the two spectra is achieved.
Microwindows (MWs) commonly used for the retrieval of CH4 and the interfering gases that must be considered within each MW.
| Microwindows | Interval (cm−1) | Interfering species |
|---|---|---|
| MW1 | 2613.7-2615.40 | N2O, H2O |
| MW2 | 2650.6-2651.30 | N2O |
| MW3 | 2835.5-2835.80 | N2O, H2O |
| MW4 | 2903.6-2904.03 | N2O, H2O |
| MW5 | 2921.0-2921.60 | N2O, H2O |
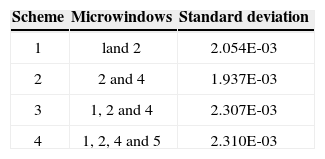
Schemes tested with four combinations of microwindows and the fit results as the standard deviation of the spectral points in the residuals (see Fig. 2).
| Scheme | Microwindows | Standard deviation |
|---|---|---|
| 1 | land 2 | 2.054E-03 |
| 2 | 2 and 4 | 1.937E-03 |
| 3 | 1, 2 and 4 | 2.307E-03 |
| 4 | 1, 2, 4 and 5 | 2.310E-03 |
The SFIT2 code uses an inverse modeling technique based on a constrained least-square fitting to extract the volume mixing ratio (VMR) profiles of the gases of interest from the measured spectrum. The volume mixing ratios of the gases of interest of each of the modeled layers are the variables of interest known as the state vector x with n elements. The measured spectrum is the observation vector y with m elements, the relationship between the observation vector and the state vector is described by the forward model F.
The parameter b is a vector that includes all model variables that are not to be optimized during the fit and are often called model parameters, and ε is the error vector that includes errors in the observation, in the forward model and in the model parameters. By inverting this equation x may be obtained for a given value of y, but due to the error vector, the best that can be achieved is a statistical estimate.
In the optimal estimation theory x is a weighted mean of the a priori knowledge of the state vector, xa, that is nothing else than the a priori volume mixing ratio profile of the gas of interest and the information taken from the spectrum. The true profile varies from the mean profile

The forward model can be linearized with the aid of the Jacobian matrix which represents the sensitivity of the observation variables y to the state variables x, in matrix form
where K is calculated initially from xa and later is calculated iteratively until the solution converges. The code iterates until the cost function J, defined asis minimized by solving:


Sa and Sε are the a priori and the measurement noise covariance matrices, respectively. The observational error is the spectral noise and it is the forward model error, which dominates the retrieval error.
The solution of this equation is known as “optimal estimate” or the retrieval and is given by the following equality:

G is known as the gain matrix and describes the sensitivity of the retrieval to the observation:
The ability of the measured spectrum to constrain the volume mixing ratio profile of the gas of interest (the state vector, x) is given by the averaging kernel matrix A=∂x^/∂x, which represents the sensitivity of the retrieval x^ to the true state vector xtrue.
The averaging kernel matrix, A = GK, is the product of the gain matrix G=∂x^/∂y and the Jacobian matrix ∂ y ⁄ ∂ x.
The information content may be defined in terms of the degrees of freedom for signal, which is the trace of the averaging kernel. Mathematically, this is the sum of the diagonal elements of the averaging kernel matrix (Rodgers, 2000).
Using the averaging kernel matrix leads to an expression for the optimal estimate or retrieval x^:
where In is the identity matrix.
The first term, Axtrue, represents the contribution of the true state x to the solution. The second term (In − A)xa represents the contribution of the a priori assumptions. The third term Gε is the contribution from the random error, which describes measurement noise. An ideal measurement would have an averaging kernel matrix that is an n dimensional identity matrix, A = In, in which case the second term is zero (Jacob, 2007; Rodgers, 2000).
The retrieval presented here is carried out by profile scaling and retrievals are restricted to one degree of freedom, as the spectral resolution of the instrument does not allow sufficient vertical information to determine pressure broadening of the lines. However, the optimal estimation formalism and the diagnostic tools such as the averaging kernels A are still valid and help in the characterization of the retrievals and the discussion.
The “layer scheme” used in this study is composed of 39 layers; the bottom of the first layer is at an altitude of 2.3 km and has a height of 700 m. On top of this are 14 layers equally spaced by 0.5 km, thus reaching 10 km. The distance between the next 10 layers is 1 km until the 20 km height is reached; the next five layers have a separation of 2 km between them. From 30 to 70 km there are eight layers separated by 5 km and finally on top of these eight layers there is one of 10 km thickness.
The temperature and pressure profiles for running the retrievals were taken from radiosondes and adapted for our location. The spectroscopic parameters used for the calculations of the forward model were taken from the High Resolution Transmission (HITRAN) database version 2004 with the 2006 update (Rothmann et al., 2005, 2013).
The data set in the period selected for this work consists of 188 716 spectra after the first quality control had been applied (clear sky only). These spectra were analyzed with the SFIT2 code in a server running six processors in parallel mode; each processor was analyzing a part of the data set, from which 150 892 spectra showed convergence according to the criteria of the code. After this process was completed, two additional filters were applied to exclude some spectra that presented systematic errors in the residuals (difference between the measured and the simulated spectra) despite having converged. The first filter was to reject all the spectra with an average root mean square (RMS) of all microwindows greater than 0.3%, after which 120477 spectra remained from the data set. The second filter was to reject outliers in the resulting total column values, probably through perturbations during the individual measurements. Those “unrealistic” columns with values smaller than 2.0 × 10¹⁹ and greater than 4.0 × 10¹⁹molecules/cm2 were eliminated and the final number of spectra considered for this work was 120 247.
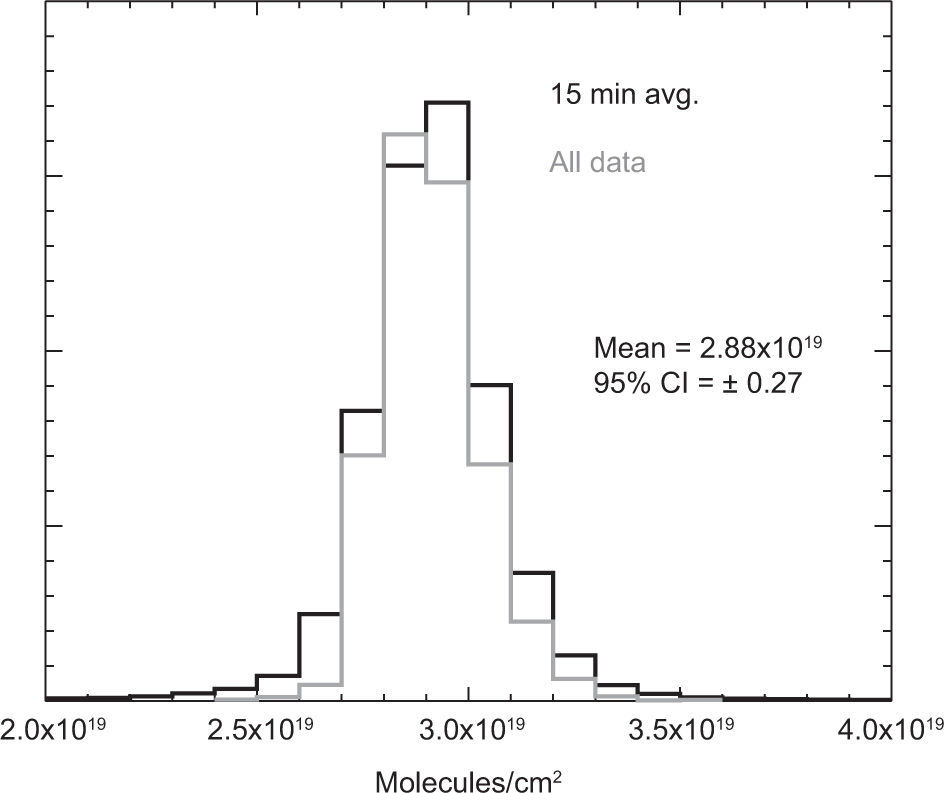
4ResultsThe distribution of all the total vertical columns of methane measured between June 2010 and December 2011 are presented in Figure 3 as a histogram. When the 15 min averages of all measurements are considered, the mean is found to be 2.88 × 10¹⁹ molecules/cm2. The 95% confidence limit lies in the rangebetween2.62 × 1019and 3.14 × 10¹⁹ molecules/cm2, clearly showing considerable dispersion in the data. Also evident is the asymmetric structure in the distribution of the observed columns, where a wing towards larger values suggests the effect of local emissions.
 and averaged in 15 min intervals (gray) separated in bins of 0.1 × 10¹⁹ molecules/cm2.")
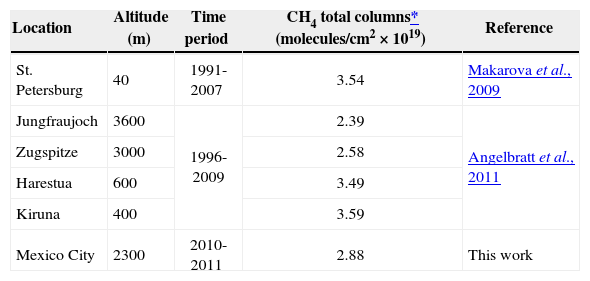
Methane’s mean global growth-rate has been variable in the last few decades but since 2000, values between 0.13 and 0.25% yr−1 have been reported from several stations (Makarova et al., 2009; Angelbratt et al., 2011). Despite the strong global trend, a comparison is presented in Tables III with other stations around the world.
Comparison of different locations where the mean total column of methane has been reported.
| Location | Altitude (m) | Time period | CH4 total columns* (molecules/cm2 × 1019) | Reference |
|---|---|---|---|---|
| St. Petersburg | 40 | 1991-2007 | 3.54 | Makarova et al., 2009 |
| Jungfraujoch | 3600 | 1996-2009 | 2.39 | Angelbratt et al., 2011 |
| Zugspitze | 3000 | 2.58 | ||
| Harestua | 600 | 3.49 | ||
| Kiruna | 400 | 3.59 | ||
| Mexico City | 2300 | 2010-2011 | 2.88 | This work |
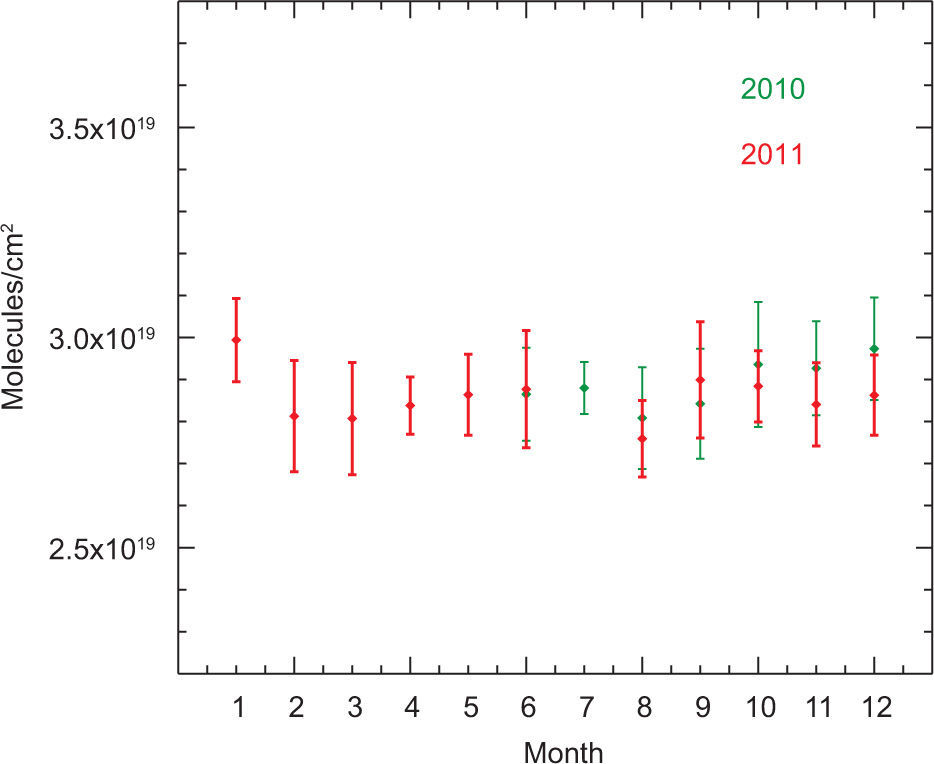
The data were averaged every month in order to detect a possible annual cycle over Mexico City (results are shown in Fig. 4). The plot shows in green the data from year 2010 and in red the monthly averages corresponding to year 2011; the vertical bars represent the standard deviations from all the columns within each month. Again, a very large dispersion of the data collected can be clearly seen from the plot. The large variability does not permit a clear identification of an annual cycle in Mexico City, for which the analysis of more years will be necessary.

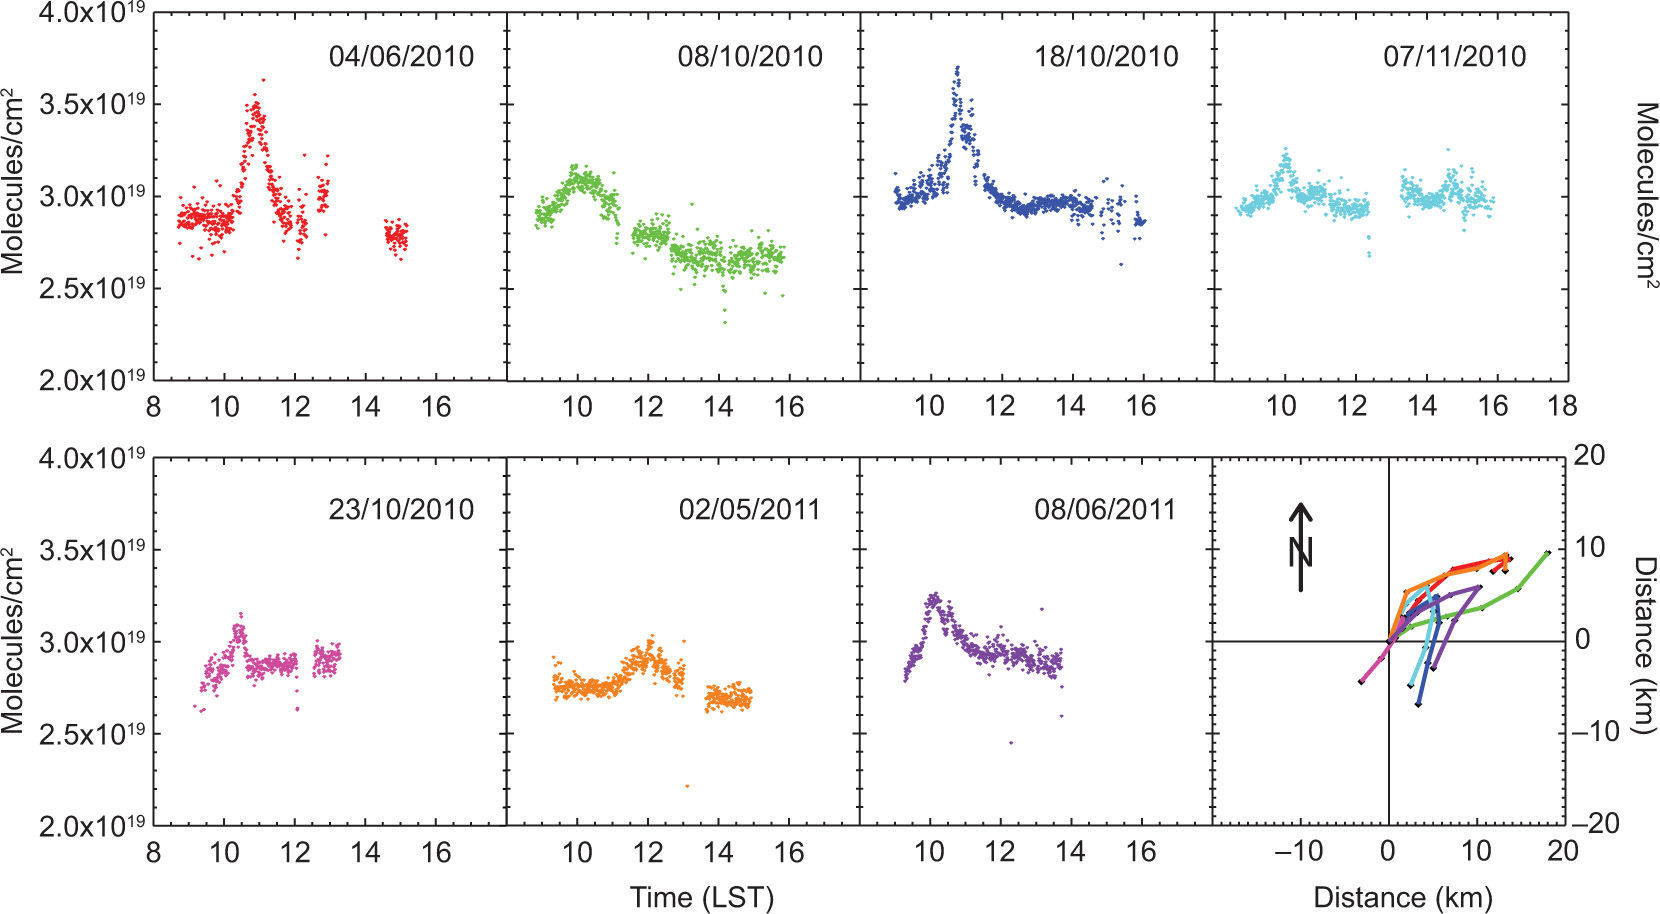
Individual days were analyzed to detect anomalies in methane total columns over the site. The behavior was found to be rather fluctuating and occasional peaks could be observed. Seven days with large enhancements were chosen as examples and are presented in Figure 5. The plots clearly show the presence of air masses with large amounts of CH4, in times contributing to increases of up to 20% of the total column. In agreement, the presence of enhancements has been observed previously in Mexico City from surface concentrations measured with an in situ FTIR spectrometer (Grutter, 2003). A back trajectory analysis was performed by simply taking the wind speeds and directions from five nearby surface stations and using their instantaneous averages to reconstruct the paths. The predominant direction where these air masses could be coming from is NE, but probably there is more than one important source in a large urban area.
5Conclusions
In this paper, the new configuration of the solar absorption infrared spectrometer in UNAM’s atmospheric observatory is described. As it has been shown with the previous arrangement using an FTIR spectrometer of lower resolution (Stremme et al., 2009, 2012) this experiment has the capability of obtaining, with high temporal resolution, the evolution of total columns of key pollutants. In the case of carbon monoxide, a top-down estimate of the total emission of the entire metropolitan area using the average growth-rate measured with this technique and satellite observations has been carried out (Stremme et al., 2012). Other photochemical and climate relevant species such as ozone, formaldehyde, carbon dioxide and small hydrocarbons also will be investigated with this experiment. Apart from events with methane enhancements like those shown in this study, a longer time series will allow for the investigation of changes in the atmospheric composition over the city affected by population growth, urban climate, shifts in technology or fuel use, etc.
The results shown for CH4 are an example of the potential of this experiment to detect polluted air masses over the measurement site. The origin of the observed CH4 emission events are not yet fully understood but the measurements indicate that there are strong emissions of methane in mega-cities, which must be better understood to improve estimates of the global CH4 budget. Methane is an important player in air quality since it participates in the formation of ozone and, more importantly, it reacts with the hydroxyl radical affecting the availability of this “detergent” to degrade other important organic compounds. The total column amounts and variability of greenhouse gases define how the energy balance is disturbed and, in highly polluted environments like Mexico City, could play important roles in modifying regional climate. In this work, we present a large day-to-day variability in methane pointing to significant local emissions affecting the natural background levels. CH4 has been described as a key short-lived climate forcer, thus efforts to mitigate the emissions could have an immediate response in slowing or even stabilizing its background concentration. In the case of human activities carried out in large urban areas like Mexico City, these benefits involve controlling or improving processes in landfills, water treatment plants and leaks during the distribution of natural gas.
We would like to thank UNAM and Conacyt for their financial support through grants PAPIIT-DGAPA IN119310 and 121620/145349, respectively. The mechanical (Alfredo Rodríguez and Miguel Meneses) and instrumentation (Wilfrido Gutiérrez and Manuel García) workshops at the CCA-UNAM are acknowledged for their contributions. Meteorological data was downloaded from the SIMAT-GDF network. Alejandro Bezanilla is grateful for the support of the Conacyt stipend-program during his graduate studies at UNAM.