


The mechanisms of hepatic fat loss in late-stage metabolic dysfunction-associated fatty liver disease (MASLD) are enigmatic and the prognostic significance of low hepatic fat content (LHF) in chronic liver disease (CLD) is unknown. Proton density fat fraction (PDFF), measured by magnetic resonance imaging (MRI), is considered the most accurate noninvasive method for quantifying hepatic fat content. This study aimed to address these issues by evaluating PDFF.
Patients and MethodsThis is a single-center, retrospective study involving 762 patients with CLD, measuring liver stiffness (LS) using MR elastography and PDFF using MRI. LHF was defined as a PDFF ≤ 2.7 % and hepatic reserve function was assessed using the albumin-bilirubin (ALBI) score. Multivariate analysis explored associations between variables.
ResultsLHF was 27 % in the entire cohort, and PDFF was significantly decreased with LS ≥ 5.5 kPa (p < 0.05). On the multivariate analysis, low body mass index and ALBI score were independently associated with LHF (p < 0.05). In advanced CLD (n = 288), ALBI score and PDFF showed a significant negative correlation regardless of etiology (MASLD/non-MASLD: r= -0.613/-0.233), and the prevalence of LHF increased with progression of ALBI grade (p < 0.01 each). In addition, lower PDFF was associated with increased liver-related and all-cause mortality (p < 0.01), and Cox proportional hazards models extracted LHF as an independent prognostic factor, along with ALBI score and hepatocellular carcinoma (p < 0.05 each).
ConclusionsIn ACLD, hepatic reserve dysfunction contributed to hepatic fat loss independent of nutritional status, suggesting that LHF may be a poor prognostic factor in all etiologies.
The liver is a central organ in lipid metabolism, so its pathophysiology is universally linked to lipid abnormalities. Steatosis, the excessive appearance of microvesicular or macrovesicular lipid droplets (LDs) in hepatocytes, is a hallmark of nonalcoholic fatty liver disease (NAFLD) [1]. The name NAFLD has recently been renamed metabolic dysfunction-associated fatty liver disease (MASLD) [2]. Traditionally, LDs have been considered simply lipid stores in the liver, but recently, they have been shown to have a variety of cell biological activities and are now recognized as important hub organelles in lipid metabolism, energy homeostasis, cell signaling, and immune defense [3,4,5]. Furthermore, it has been suggested that the cell biological activities of LDs may also be involved in the development of fibrosis in MASLD [3,4,6]. Other chronic liver diseases (CLDs) have also been associated with hepatic fat deposition, and alcohol-related liver disease (ALD) is a subtype of steatotic liver disease (SLD). Hepatitis B can also cause fatty deposits, and hepatitis C is the best-known pathogen closely associated with LDs [4]. As patients with nonalcoholic steatohepatitis (NASH) progress to the stage of cirrhosis, there is often a reduction in hepatic fat, termed “burn-out” NASH, which is associated with poor prognosis [6,7]. However, the mechanism is not well understood, and the impact of low hepatic fat content (LHF) on prognosis in other CLD patients has not been studied. These reasons may include the fact that liver biopsy, the gold standard for the diagnosis of steatosis, is invasive and not recommended for the evaluation of minute amounts of intrahepatic fat [8].
Magnetic resonance imaging (MRI) can measure triglyceride concentration in liver tissue using the proton density fat fraction (PDFF), which is the ratio of the fat signal to the total water-to-at signal [9]. MRI-PDFF is highly reproducible within and between observers and is currently the most accurate quantitative imaging biomarker for assessing hepatic fat content. Paired studies of liver biopsy and MRI-PDFF measurements have shown that a decrease in PDFF quantitatively reflects improvement in hepatic steatosis [10,11]. Our previous studies have shown that hepatic PDFF strongly correlates with body fat mass as assessed by computed tomography and also with muscle mass [12]. We also established that the prognosis of cirrhotic patients can be stratified based on a low PDFF threshold (< 2.7 %) using first quartile MRI-PDFF measurements obtained from the general population in Western countries [12,13]. However, given the racial differences in body composition, it is essential to validate the LHF criteria in other populations. The aim of this study in Japanese CLD is to analyze the pathomechanism of hepatic fat loss by MRI-PDFF measurements and to investigate the association between low PDFF and prognosis in advanced chronic liver disease (ACLD).
2Materials and methods2.1Study populationThis retrospective single-center study included data from 762 of 780 CLD patients with PDFF were measured by MRI between July 1, 2018, and July 31, 2023.
The MRI examinations aimed to assess liver steatosis and to diagnose the liver fibrosis stage by liver stiffness (LS) measured by elastography (MRE) and to screen for hepatocellular carcinoma (HCC) on noncontrast MRI. Excluded from this analysis were six patients for whom LS measurement on MRE was difficult due to massive ascites or excessive iron deposition and 12 patients for whom blood laboratory data were missing.
The etiology of CLD was hepatitis B in 153 patients, hepatitis C in 172, MASLD in 231, ALD in 111, and others (autoimmune liver disease, unknown) in 95. All hepatitis C patients were subjects who had achieved SVR (sustained virologic response) with treatment. Diagnostic criteria for the etiology of CLD and diagnostic procedures for cirrhosis and HCC are provided in the Supporting Information (1).
2.2Data collectionFor each patient, age, sex, height, weight, body mass index (BMI) and baseline laboratory data were collected. The mean and median intervals between blood biochemical tests and MRI scans were 9 ± 10 days and 7 (0–16) days, respectively.
ACLD is a widely used term to stratify the risk of portal hypertension and hepatic decompensation based on noninvasive diagnostic tests. It represents the stage of advanced fibrosis and cirrhosis. The definition of ACLD in this study was fibrosis (F) stage 3 and 4 patients diagnosed by MRE, and the severity of liver dysfunction was assessed by albumin–bilirubin (ALBI) score and MELD-Na score [14,15]. In addition, the progression of ACLD was stratified by modified ALBI grade [16]. The ALBI score calculation method and classification of mALBI grades are shown in Supporting information (2). The ALBI score provides an objective assessment of hepatic reserve function and does not include factors related to lipid metabolism. In patients with CLD of all etiologies and stages, many articles have reported the high prognostic value of the ALBI score [17].
2.3MRI protocolAll patients fasted overnight (> 12 h) before evaluation with a 1.5-T whole-body MRI system (Siemens Voyager XT 1.5T; GE Healthcare, Tokyo, Japan).
The intrahepatic fat content was assessed by PDFF (%) using the IDEAL IQ method as previously described [9], and fibrosis progression was determined based on LS (kPa) measured by elastography [18]. The measurement technique is shown in Supporting information (3). PDFF and LS measurements were analyzed by a radiologist specializing in hepatology. The diagnosis of F stage was made using two criteria for each etiology, considering that LS on MRE varies by etiology. Patients were classified into three categories (no steatosis: < 5.2 % / steatosis G1: 5.2–11.3 % / steatosis G2–3: ≥ 11.3 %) based on steatosis grading by MRI-PDFF [19]. In contrast, there is no clear consensus on the PDFF threshold for distinguishing normal from abnormally low values. Therefore, based on our previous report, the diagnosis of LHF in the present study was based on a PDFF ≤ 2.7 % [12]. Classification methods and criteria for liver fibrosis are presented in the Supporting Information (4).
2.4Nutritional assessmentIn this study, malnutrition was assessed by sarcopenia and by total lymphocyte count (TLC), an immunological nutritional assessment index, and TLC < 1500/mm3 was defined as lymphopenia [20]. Skeletal muscle mass was measured using MRI. In practice, the right and left paraspinal muscle area was measured at the level of the superior mesenteric artery on MRI images, and a cutoff value of 12.62 cm2/m2 for males and 9.77 cm2/m2 for females, corrected by the square of the height, was applied for the diagnosis of sarcopenia [21,22].
2.5Follow-up and outcomesSubjects were followed from the date of the first (baseline) MRI until death (including transplant), last known encounter, or the end of the study period (July 2023). Transplant patients were last observed on the date of surgery. A three-stage follow-up process was used to examine patient outcomes. First, the electronic medical records of all subjects were reviewed for the primary outcome, death (including transplantation). Second, patients referred to other facilities were contacted by the facility, and finally, attempts were made to contact patients by telephone to investigate outcomes before they were deemed untraceable.
2.6Statistical analysisJMP statistical software (version 17.2; SAS Institute Japan, Tokyo, Japan) was used for all statistical analyses. The chi-square test, Wilcoxon–Mann–Whitney test, and Spearman's rank correlation coefficient was used for intergroup analyses, and multiple comparisons of variables among multiple groups were performed using the Steel–Dwass post hoc or Steel tests after confirming significant differences by the Kruskal–Wallis test. Logistic regression analysis was used to examine factors associated with LHF in CLD. A stepwise increase/decrease method was used to select variables. Patient prognosis was analyzed using Kaplan–Meier and Cox proportional hazards methods, and the stepwise method was used for variable selection. Statistical significance was set at a p value of < 0.05.
2.7Ethical statementsThis study was approved by the Ethical Review Board of Nippon Koukan Hospital (Approval No. 202,014). The study was conducted in accordance with the “Ethical Principles for Medical Research Involving Human Subjects” described in the 1975 Declaration of Helsinki as revised in 2000. Informed consent was obtained from the participants n an opt-out manner.
3Results3.1Baseline characteristicsThe characteristics of all patients are shown in Table 1. The median age of all patients was 62 years (range: 15–94), BMI was 24 kg/m2 (range: 15–50), and LS was 2.8 kPa (range: 1.0 to 18.9). In addition, there were 64 cases of HCC (8 %) and 221 cases of sarcopenia (29 %).
Clinical characteristics at baseline.
Statistics are shown as the mean ± SD (standard deviation) or n (%). ALBI, albumin–bilirubin grade; ALD, alcohol-related liver disease; ALP, alkaline phosphatase; ALT, alanine aminotransferase; AST, aspartate aminotransferase; BMI, body mass index; BUN, blood urea nitrogen; CRP, C-reactive protein; γ-GTP, γ-glutamyl transpeptidase; HCC, hepatocellular carcinoma; LHF, low hepatic fat content; LS, liver stiffness; MASLD, metabolic dysfunction–associated steatotic liver disease; MELD-Na, model for end-stage liver disease sodium; NLR, neutrophil-to-lymphocyte ratio; PT, prothrombin activity; TC, total cholesterol; TLC, total lymphocyte count.
The mean PDFF was 8.0 ± 7.4 %, and the median was 4.8 %. The PDFF for each etiology (Supplementary Figure 1) was highest for MASLD (13.3 ± 8.3 %), with no significant difference among hepatitis B (5.9 ± 6.3 %), hepatitis C (5.8 ± 5.3 %), ALD ± 6.4 %) and others (3.9 ± 3.2 %). Hepatic steatosis (PDFF ≥ 5.2 %) was present in 85 % (195/231) of the MASLD group and 32 % (167/531) of the non-MASLD group (p < 0.001).
The comparison of LHF and non-LHF patients in Table 1 showed no sex differences but significant differences in age, BMI, three types of blood cells, liver function parameters, and ALBI score. In addition, there were significant differences in nutritional data for protein and lipids, blood urea nitrogen (BUN), and sodium. The prevalence of non-MASLD, ascites, sarcopenia, lymphopenia, and HCC were significantly higher in the LHF group than in the non-LHF group. Stepwise methods were performed using factors that were significant in univariate analysis, and multivariate analysis was performed with nine selected factors (Table 2). Logistic regression analysis of factors associated with LHF identified low BMI, lower levels of γ-glutamyl transpeptidase (γ-GTP) and TLC, and higher BUN and ALBI scores as independent factors, in addition to non-MASLD patients.
Univariate and multivariate analysis of factors associated with LHF (PDFF ≤ 2.7 %) in patients with CLD.
ALBI, albumin–bilirubin; BMI, body mass index; BUN, blood urea nitrogen; γ-GTP, γ-glutamyl transpeptidase; HCC, hepatocellular carcinoma; MASLD, metabolic dysfunction–associated steatotic liver disease; TC, total cholesterol; TLC, total lymphocyte count.
PDFF and ALBI scores for 5 groups (< 2.5, ≥ 2.5 and < 3.5, ≥ 3.5 and < 4.5, ≥ 4.5 and ≥ 5.5, ≥ 5.5) by LS (kPa) were studied in MASLD (Fig. 1A, B) and non- MASLD (Figs. 1C, D). The PDFF and ALBI scores within these groups were then investigated. In the MASLD group, the PDFF increased up to LS 5.5 kPa and was significantly lower at LS ≥ 5.5 kPa, while the ALBI score remained constant up to LS 5.5 kPa and was significantly higher at LS ≥ 5.5 kPa. Similarly, in the non- MASLD group, the PDFF was significantly lower at LS ≥ 5.5 kPa, and the ALBI score was significantly worse at higher LS. Further analysis by steatosis grade (Supplementary Fig. 2) showed that in the MASLD group, mainly patients with severe steatosis (G2–3) had an increase from LS 3 to 5.5 kPa and a decrease at LS ≥ 5.5 kPa. In contrast, in the non-MASLD group, overall patients with steatosis showed similar changes.
 and ALBI score in 5 groups (< 2.5, 2.5 to 3.5, 3.5 to 4.5, 4.5 to 5.5, ≥ 5.5 kPa) based on LS value. In the MASLD groups shown in the upper row, PDFF(A) decreased at ≥ 5.5 kPa (p < 0.01), and ALBI score(B) increased significantly (p < 0.05). In the lower non-MASLD groups, patients with ≥ 5.5 kPa had the lowest PDFF(C) values and the highest ALBI scores (D).")
Comparison of PDFF (%) and ALBI score in 5 groups (< 2.5, 2.5 to 3.5, 3.5 to 4.5, 4.5 to 5.5, ≥ 5.5 kPa) based on LS value. In the MASLD groups shown in the upper row, PDFF(A) decreased at ≥ 5.5 kPa (p < 0.01), and ALBI score(B) increased significantly (p < 0.05). In the lower non-MASLD groups, patients with ≥ 5.5 kPa had the lowest PDFF(C) values and the highest ALBI scores (D).
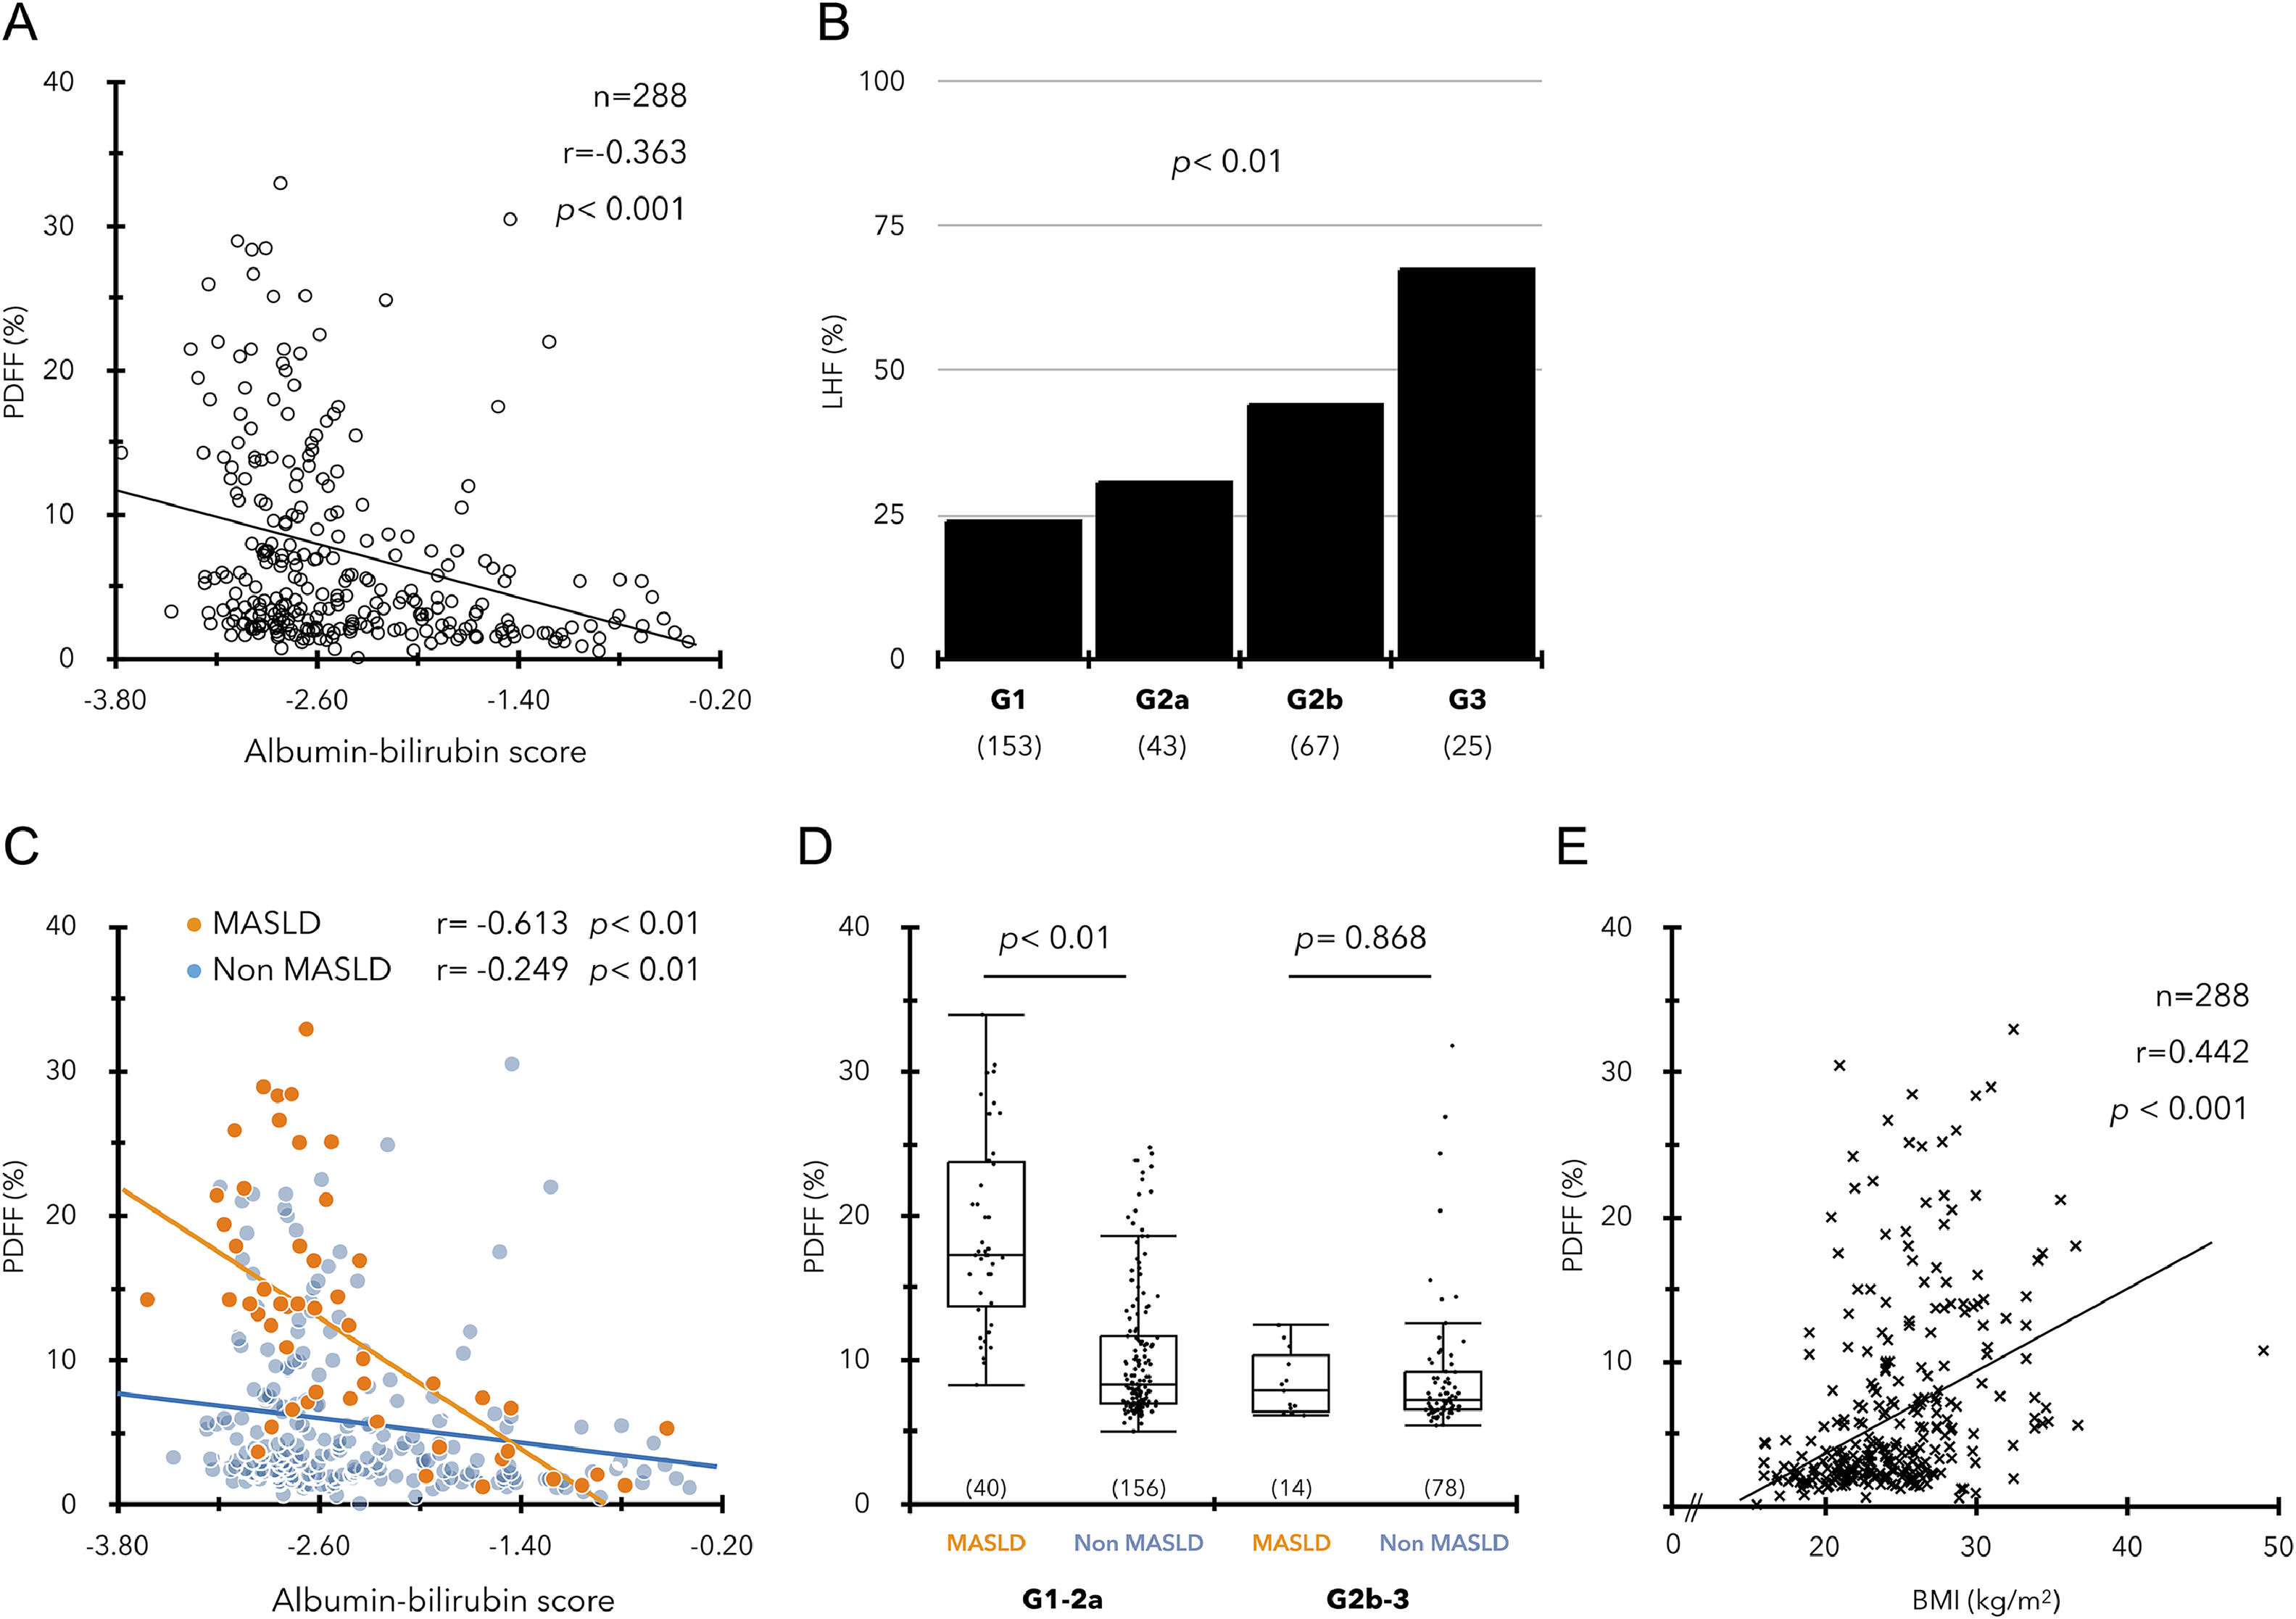
In a study of 288 ACLD patients, ALBI score and PDFF showed a significant negative correlation regardless of etiology (Fig. 2A, Supplementary Figure 3), and the incidence of LHF was significantly associated with mALBI grade progression (Fig. 2B). The relationship between the ALBI score and PDFF was similar in the MASLD and non-MASLD groups (Fig. 2C). However, the significant difference in PDFF between the two groups decreased with worsening ALBI score, and the PDFF difference between the two groups disappeared in patients with mALBI grades 2b‒3 (Fig. 2D). In contrast, BMI also showed a significant positive correlation with PDFF but was not associated with the ALBI score (Fig. 2E, Supplementary Figure 3D).
 Significant correlation between ALBI scores and PDFF values in ACLD (n = 288). (B) Prevalence of LHF (PDFF < 2.7 %) in each ALBI grade. (C) Relationship between high ALBI score and low PDFF in the MASLD and non-MASLD groups. (D) Comparison of PDFF values between MASLD and non-MASLD groups in mALBI grades 1–2a/2b–3. (E) Relationship between BMI (kg/m2) and PDFF values in ACLD.")
(A) Significant correlation between ALBI scores and PDFF values in ACLD (n = 288). (B) Prevalence of LHF (PDFF < 2.7 %) in each ALBI grade. (C) Relationship between high ALBI score and low PDFF in the MASLD and non-MASLD groups. (D) Comparison of PDFF values between MASLD and non-MASLD groups in mALBI grades 1–2a/2b–3. (E) Relationship between BMI (kg/m2) and PDFF values in ACLD.
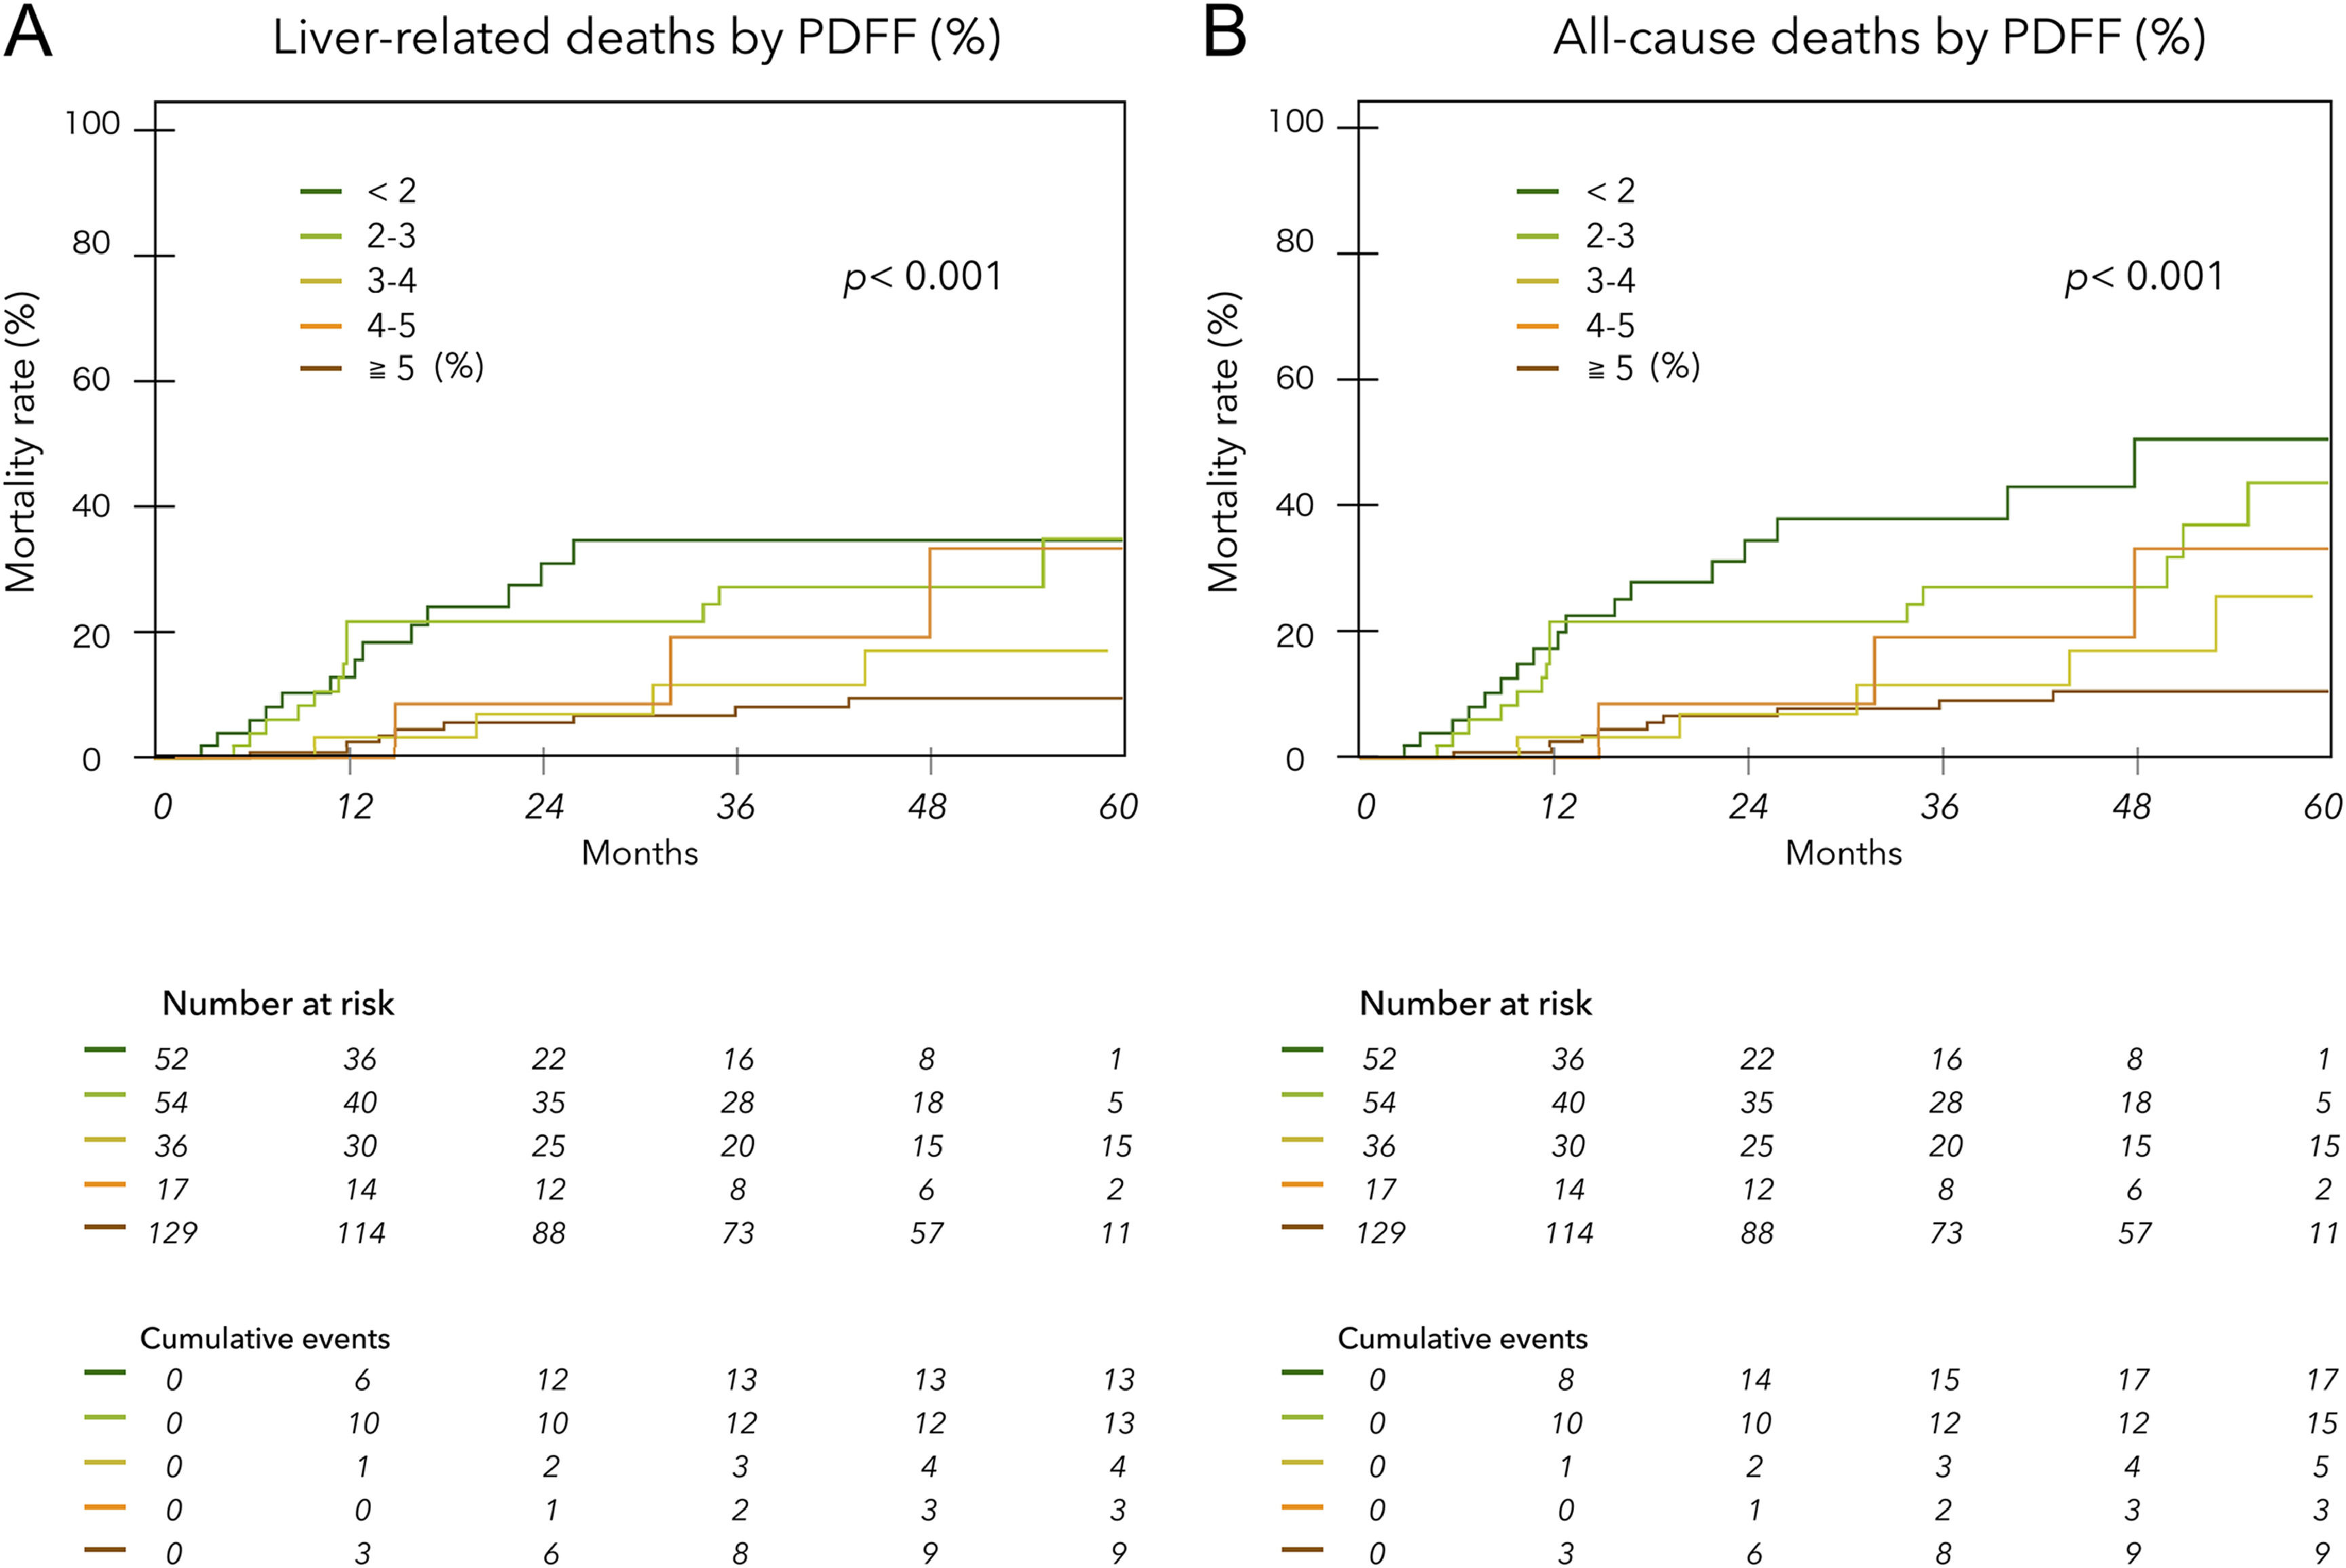
The mean observation period based on the date of MRI examination was 33.0 ± 19.5 (median, 35) months. During this period, liver-related deaths occurred in 42 patients, including two liver transplants. Of these, 30 were due to liver failure, and 12 were due to HCC. There were seven deaths not related to liver disease (1 case each of heart failure, hematologic disease, malignant lymphatic, and unknown; 3 cases of infection not related to liver disease). Fig. 3 shows liver disease-related deaths (A) and all cause mortality (B) by PDFF (%) in ACLD patients. Lower PDFF was significantly associated with higher cumulative mortality (log-rank test p < 0.001 for each). The hazard ratios for liver-related death and all-cause mortality for patients with PDFF < 3 % were 3.49 (95 % CI 1.87 to 6.57) and 3.79 (95 % CI 2.15 to 6.82), respectively (p < 0.001). The Kaplan‒Meier survival curves for ACLD patients with and without LHF (PDFF ≤ 2.7 %) significantly stratified prognosis, regardless of the etiology and HCC complications (Fig. 4A, B, C, D). However, when examined by mALBI grade, LHF was a significant prognostic factor only in patients with mALBI 2b–3 (Fig. 4E, F).
 based on MRI-PDFF in ACLD (n = 288). (A) Liver-related mortality. (B) All-cause mortality.")
. (A) All patients. (B) MASLD patients. (C) Non-MASLD patients. (D) Patients with HCC. (E) Patients with mALBI grade 1–2a. (F) Patients with mALBI grade 2b–3.")
Factors contributing to prognosis in ACLD patients were analyzed using the Cox proportional hazards model. Seven factors were selected using a stepwise method from those that were significant in univariate analysis, and then multivariate analysis was performed to extract mALBI grades 2b–3, HCC, and LHF (Table 3).
Prognostic factors by the Cox proportional hazards model in ACLD.
ALD, alcohol-related liver disease; CRP, C-reactive protein; HCC, hepatocellular carcinoma; LHF, low hepatic fat content; mALBI, modified albumin–bilirubin.
Logistic regression analysis was performed, and leukocytes, hemoglobin, albumin, triglyceride, BUN, TLC, ascites and sarcopenia were significantly associated with LHF in univariate analysis. In the multivariate analysis, TLC and sarcopenia were identified as independent factors associated with LHF (Table 4).
Univariate and multivariate analysis of factors associated with LHF in patients with mALBI grade 2b–3.
In the present study using MRI-PDFF, we demonstrated that impaired hepatic reserve function strongly impacts hepatic fat loss in ACLD patients and that LHF (PDFF ≤ 2.7 %) is a significant prognostic factor in all etiologies Figs. 5, 6 and 7.


MRI-PDFF allows non-invasive and accurate assessment of whole liver fat content with a dynamic range of 0–100 %, and previous studies have reported a hepatic PDFF of approximately 4 % in the general population [13,23]. However, MRI-PDFF is mainly used to diagnose steatosis, and there is currently no reference value for low hepatic fatness. Therefore, in our previous study [12], we set the cutoff value of PDFF suggestive of LHF at 2.7 %, based on Western reports. In this Japanese study, it was observed that hepatic fat loss in MASLD patients occurs at significantly advanced stages of hepatic fibrosis (LS ≥ 5.5 kPa). Furthermore, our data suggest that a PDFF < 3 % is a poor prognosis in ACLD patients and that the previously reported criteria for LHF are acceptable. MASLD is a very common cause of CLD worldwide, with many reports indicating that approximately one-third of patients show fibrosis progression and an increased risk of death once cirrhosis develops [24,25]. In a large study of biopsy-proven MASLD cirrhosis and cryptogenic cirrhosis (< 5 % fat deposition), the similar prevalence of metabolic syndrome suggests that most cryptogenic cirrhosis cases are advanced MASLD cirrhosis [25]. However, it is not known how these two disease spectra are continuous. Our data show that PDFF goes from increasing to decreasing at LS ≥ 5.5 kPa in patients with MASLD and is strongly affected by worsening ALBI scores, i.e., impaired hepatic reserve function. In patients with MASLD, a very low risk of hepatic decompensation of 1.6 % (over three years) has been reported when the LS on MRE is < 5 kPa [26]. Furthermore, previous studies with different etiologies have reported that decompensated cirrhosis onset occurs at LS cutoff values ranging from 5.1 to 6.48 kPa. [27,28,29,30]. These findings may suggest that hepatic fat loss may be a significant finding associated with decompensated ACLD, but it is unclear whether it is the cause of hepatic decompensation.
In follow-up studies of biopsy-proven MASLD [31], severe steatosis (PDFF ≥ 15.7 %) has been reported as an independent factor associated with the risk of fibrosis progression. A similar trend was observed in our MASLD patient data. Hepatic steatosis was observed in approximately 30 % of non-MASLD patients, but the impact of steatosis on advanced liver fibrosis remains controversial in etiologies other than SLD. In patients with HBV, there are reports suggesting that HBV infection may inhibit the promotion of fibrosis in steatosis [32]. Further studies are needed to clarify the relationship between steatosis and fibrosis progression in non-MASLD patients. In contrast, our study reveals that a decrease in PDFF with a worsening ALBI score is a common finding in both MASLD and non-MASLD patients with ACLD. Interestingly, the substantial difference in PDFF between the two groups decreased as the ALBI score increased and eventually disappeared in the most severe stage of the disease. These results seem to indicate that hepatic fat loss may not be unique to MASLD.
This study demonstrates a strong correlation between impaired hepatic reserve function and decreased hepatic fat content in ACLD. Despite numerous previous studies, the mechanisms underlying hepatic fat loss in MASLD remain incompletely understood. Regarding intrahepatic mechanisms, it has been noted that the expression of fatty acid transport protein 5 (FATP 5), a key protein involved in the hepatic uptake of serum free fatty acids (FFAs), is significantly decreased in advanced fibrosis NASH [33]. Interestingly, a study of adolescent MASLD patients reported increased expression of FATP 5 compared to healthy controls [34]. This suggests that the liver may actively intervene early in the disease to regulate systemic lipid metabolism homeostasis. Elsewhere, Van der Poorten et al. [35] reported that serum adiponectin levels, which have potent antisteatotic activity of adipose tissue origin, increase with liver fibrosis and are independently associated with burnout NASH. Serum adiponectin levels in cirrhotic have been shown to correlate with hepatocellular damage, as well as with high serum bile acid levels associated with hepatic dysfunction, independently of BMI [35,36]. Therefore, we consider that the present study suggests that impaired hepatic reserve function may be involved as an underlying factor in the mechanism of disrupting the homeostasis of lipid metabolism.
In this study, LHF was identified as a poor prognostic factor in ACLD, regardless of etiology. Notably, the prognostic impact of LHF was more pronounced in patients with complications such as HCC or advanced ALBI grades. Further analysis of patients with advanced ALBI grade revealed a higher prevalence of sarcopenia and lymphopenia in those with LHF. The results suggest that the combination of severe hepatic dysfunction and malnutrition is responsible for the even poorer prognosis of patients with LHF. The liver is an important hub organ of energy metabolism supplying lipid energy to the whole body, while it is one of the organs that consumes the most energy at rest [37]. This suggests that the depletion of intrahepatic energy sources may affect hepatocyte dysfunction. Enooku et al. [33] reported that reduced FATP5 mRNA expression in advanced NASH was significantly associated with subsequent hepatic fat loss and progression to advanced cirrhosis. Future studies to determine how preservation of hepatic fat content affects the prognosis in ACLD patients will be important for new treatment strategies.
This study has several limitations. First, being a single-center retrospective study, the results require validation. Second, we did not include complications of metabolic disorders such as diabetes, hyperlipidemia, or hypertension in our study.
Prospective studies in advanced MASLD have shown that the major cause of death is liver-related death due to hepatic reserve dysfunction [38] so the present study was limited to the relationship between hepatic pathology and low hepatic fat content. Third, most of the subjects in this study had not undergone liver biopsy. Therefore, the diagnosis of MASLD without hepatic steatosis was based on the previous diagnosis of MASLD. The fourth is a limitation to be noted in MRI-based non-invasive tests. As ACLD is a progressive and diverse condition, various factors other than liver fibrosis may affect LS values [39]. In terms of liver fat content, it has been pointed out that the correlation between histopathological findings and MRI-PDFF values is weaker in the presence of liver fibrosis [40].
5ConclusionsOur MRI-PDFF study highlights the importance of maintaining adequate hepatic fat content in patients with CLD, considering the stage of disease progression. Impaired hepatic reserve function in ACLD patients independently contributes to hepatic fat loss, and LHF was shown to be an independent prognostic factor in all etiologies. These findings have important clinical implications, and monitoring and managing hepatic fat content in ACLD may have a significant impact on patient prognosis and lead to effective nutritional intervention approaches.


