


Recently, interest in the relationship between weekend catch-up sleep (WCUS) and chronic diseases is increasing. We aimed to study the correlation between sleep duration and non-alcoholic fatty liver disease (NAFLD), an emerging metabolic disease.
Materials and methodsData on sleep duration from the Korea National Health and Nutrition Examination Survey was recorded. The subjects were divided into three groups according to the duration of WCUS: Group 1, those who slept for less than 7 hours in a week; Group 2, those who slept for less than 7 hours on weekdays but more than 7 hours on weekends (those with WCUS pattern); and Group 3, those who slept for more than 7 hours in a week. Multivariate logistic regression analysis was used to analyze the correlation between sleep duration and NAFLD.
ResultsA mean sleep time of 7 hours or more showed a significant negative relationship with NAFLD (odds ratio [OR]: 0.84, 95% confidence interval [CI]: 0.79–0.89 in all; OR 0.91, 95%CI 0.84–0.99 in males; OR 0.86, 95%CI 0.79–0.94 in females). Groups 2 and 3 showed significant negative relationships with NAFLD when Group 1 was used as a reference (Group 2; OR: 0.80, 95%CI: 0.70–0.92, Group 3; OR: 0.73, 95%CI: 0.66–0.82). WCUS showed similar correlations with NAFLD, regardless of sex.
ConclusionsWCUS and sleep duration are significantly associated with NAFLD. A prospective cohort study is needed to prove the causal effects.
Sleep duration is an important indicator of the state of human health. Several studies on the general population have reported that short sleep duration correlates with obesity, hypertension, diabetes mellitus, and cardiovascular diseases [1–3]. In one meta-analysis study, it was reported that insufficient sleep was associated with systemic chronic inflammatory disorders such as metabolic syndrome and an increase in the blood levels of inflammatory markers in patients with chronic diseases [4,5]. In addition, insufficient sleep adversely affects mental health [6]. Sleep duration is associated with various forms of human health.
The liver is essential for the maintenance of life and plays an important role in metabolism. Non-alcoholic fatty liver disease (NAFLD) is a metabolic liver disease caused by excessive accumulation of fat, and its prevalence is very high worldwide [7]. NAFLD is a term for a wide spectrum of pathological diseases ranging from simple steatosis to non-alcoholic steatohepatitis, which can progress to liver cirrhosis [8–10]. Furthermore, NAFLD is associated with an increased risk of metabolic conditions such as type 2 diabetes, cardiovascular diseases, obesity, metabolic syndrome, and insulin resistance [11,12]. Therefore, it is considered to be a serious disease according to recent clinical research.
Insufficient sleep was negatively correlated with liver fibrosis [13]. Insufficient sleep, as well as poor sleep quality, can trigger several pathophysiological processes that are associated with NAFLD [14]. The most common forms of sleep disturbance in NAFLD include obstructive sleep apnea (OSA), insomnia, and restless leg syndrome [15]. In particular, several studies investigating the prevalence of liver dysfunction in obstructive sleep apnea have reported that it is independently associated with elevated transaminases and progression to non-alcoholic steatohepatitis and liver fibrosis [16]. NAFLD patients have more than one feature of the metabolic syndrome, and now it is considered to be the hepatic component of this syndrome [17]. Therefore, the study of sleep duration can have important implications for public health and clinical studies related to chronic metabolic diseases.
Recently, people are not only required to do a lot of work in the community to which they belong but also have other personal activities, leading to insufficient sleep during the week. Therefore, some people can get enough sleep on both weekdays and weekends, while others cannot due to various enormous responsibilities during the week and compensate for this lack of sleep on weekends. This is called weekend catch-up sleep (WCUS), which is a sleep pattern to compensate for insufficient sleep during the week by sleeping for longer hours on weekends [18]. A previous study reported that there was a correlation between WCUS and obesity by directly and indirectly modulating the chronic inflammatory state of the human body [19]. Hwangbo et al. reported that WCUS was correlated with hypertension and metabolic syndrome [20].
Sleep duration is associated with NAFLD, but studies on the correlation between the various patterns of sleep and NAFLD are still lacking. In addition, WCUS is one of the most common sleep patterns among modern people, and it is related to obesity. However, its effect on fatty liver disease is unclear. We investigated the correlation between sleep duration, WCUS, and NAFLD using data from the Korea National Health and Nutrition Examination Survey (KNHANES).
2Methods2.1ParticipantsThis study was based on the results of the KNHANES conducted from 2008 to 2019. The KNHANES is a highly representative national cross-sectional survey data that is managed by the Korea Disease Control and Prevention Agency. The KNHANES consists of strictly selected data by stratified multi-step probabilistic cluster sampling based on gender, age, and geographical area. The data included various past diseases, health surveys, nutritional status surveys of subjects, and clinical information such as blood tests, including aspartate aminotransferase (AST) and alanine aminotransferase (ALT).
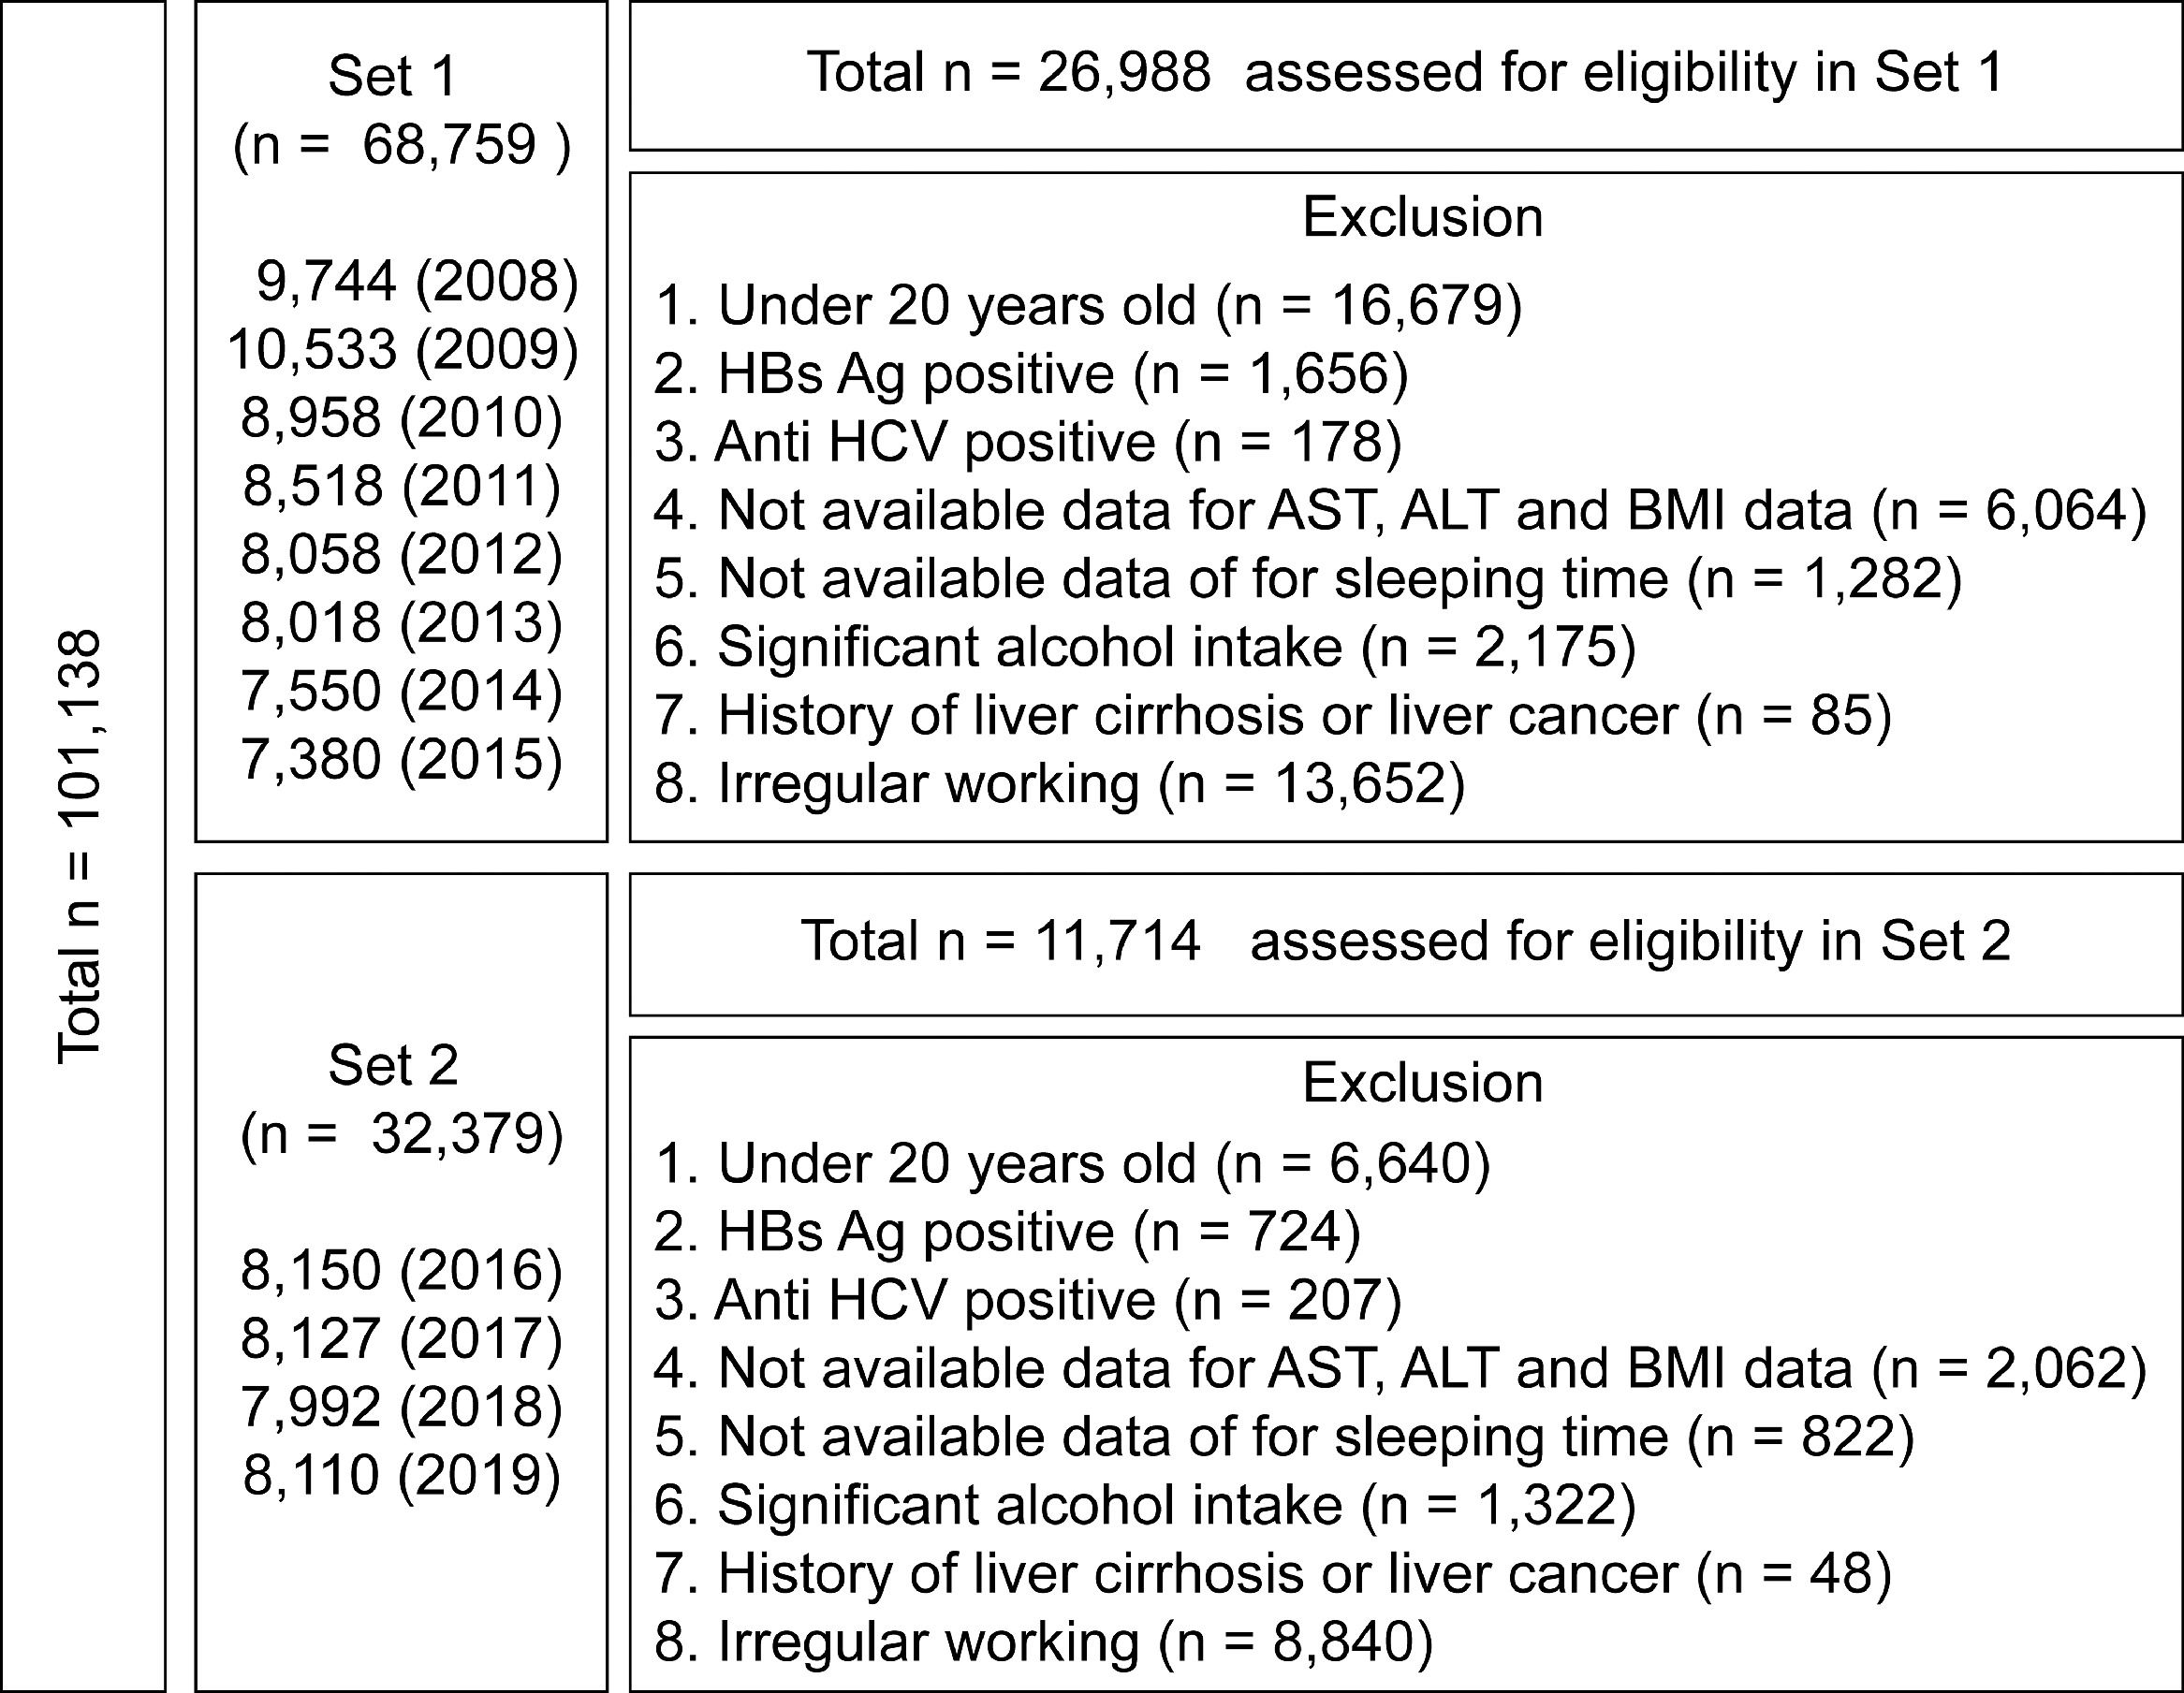
A total of 101,138 subjects were registered in the KNHANES from 2008 to 2019, and the health survey reported the average daily sleep duration of all the participants over the past years. Since the KNHANES collected the sleep duration differently as of 2016, we divided the total data into Set 1 and Set 2 according to the type of sleep duration collected.
From 2008 to 2015, the mean sleep duration regardless of weekdays and weekends were collected (Set 1; n = 68,759), while KHANES data were collected separately for mean weekday and weekend sleep duration from 2016 to 2019 (Set 2; n = 32,379). Among them, we excluded subjects who were less than 20 years (n = 16,679 in Set 1 and n = 6640 in Set 2), with hepatitis B and C infections (n = 1834 in Set 1 and n = 931 in Set 2), liver cirrhosis or liver cancer (n = 85 in Set 1 and n = 48 in Set 2), shift workers and others who slept irregularly (n = 13,652 in Set 1 and n = 8840 in Set 2), and those who consume alcohol excessively (more than 210 g/week for male, more than 140 g/week for women; n = 2175 in Set 1 and n = 1322 in Set 2). Subjects with missing data on major blood tests, clinical information, and sleep duration were excluded from the analysis (n = 7346 in Set 1 and n = 2884 in Set 2) (Fig. 1).

The study was approved by the Medical Institution Ethics Committee of the International St. Mary's Hospital (IRB No. IS21EISI0076).
2.2Measurements of clinical and biochemical variablesThe smoking status was classified as follows: non-smoker, former smoker, or current smoker. Alcohol consumption was calculated as the amount of alcohol intake in grams based on the number of drinks per week or month and the average number of drinks consumed at a time. Body mass index (BMI) was calculated by dividing the weight (kg) by the square of the height (kg/m2). Obesity was defined as BMI ≥ 25 kg/m2. The average of two–three blood pressure measurements was recorded. Hypertension was considered when the systolic blood pressure was > 140 mmHg and/or the diastolic blood pressure was > 90 mmHg, or the subject was on antihypertensive medication. Venous blood samples were collected for blood testing after fasting for 8 hours and the levels of fasting blood sugar, AST, ALT, triglycerides, and cholesterol were measured. Individuals whose fasting blood sugar level was > 126 mg/dL or who had previously been diagnosed with diabetes by a doctor were classified as having diabetes. Hypertriglyceridemia was considered when the triglyceride level was greater than or equal to 200 mg/dL. Metabolic syndrome was defined based on the National Cholesterol Education Program (NCEP) Adult Treatment Panel III (ATP III) [21].
2.3Definition of sleep habits, WCUS, significant steatosisIn Set 1, the group was divided into a group that slept more than 7 hours and a group that slept less than 7 hours according to the average duration of sleep per week. In Set 2, the group was also divided based on 7 hours of sleep duration and the data was analyzed for weekdays and weekends, respectively. In addition, in Set 2, sleep patterns in which sleep less than 7 hours during the week but supplemented for more than 7 hours on weekends were defined as WCUS. Therefore, subjects who had less than 7 hours of sleep during the weekdays and did not have WCUS were classified into Group 1, subjects who had less than 7 hours of sleep during the weekdays and had WCUS were classified into Group 2, and subjects who had more than 7 hours of sufficient sleep also during the weekdays were classified into Group 3.
For fatty liver, the hepatic steatosis index (HSI) was used to determine the presence of a fatty liver. The HSI was calculated as follows: his = 8 × (ratio of ALT/AST) + BMI (+ 2 for female, + 2 in case of diabetes). HSI is an indicator developed based on the medical examination of the subjects whose fatty liver condition was assessed by ultrasound, and an HSI of greater than or equal to 36 was considered as an indicator of fatty liver [22].
We separated the data from sets 1 and 2 according to the forms from the survey of sleep duration and studied the correlation between sleep duration and NAFLD within each set.
2.4Statistical analysesAll statistical analyses were performed using the R software version 4.1.1. The baseline characteristics were expressed as mean ± standard deviation for continuous variables or as percentages for categorical variables. The significance of differences in continuous variables between the two groups was investigated using the independent t-tests. The significance of differences in categorical variables was determined using the chi-square test. Multiple logistic regression analysis was performed to determine the effect of sleep duration and WCUS on HSI ≥ 36 after adjusting for covariates. A p-value of < 0.05 was considered statistically significant.
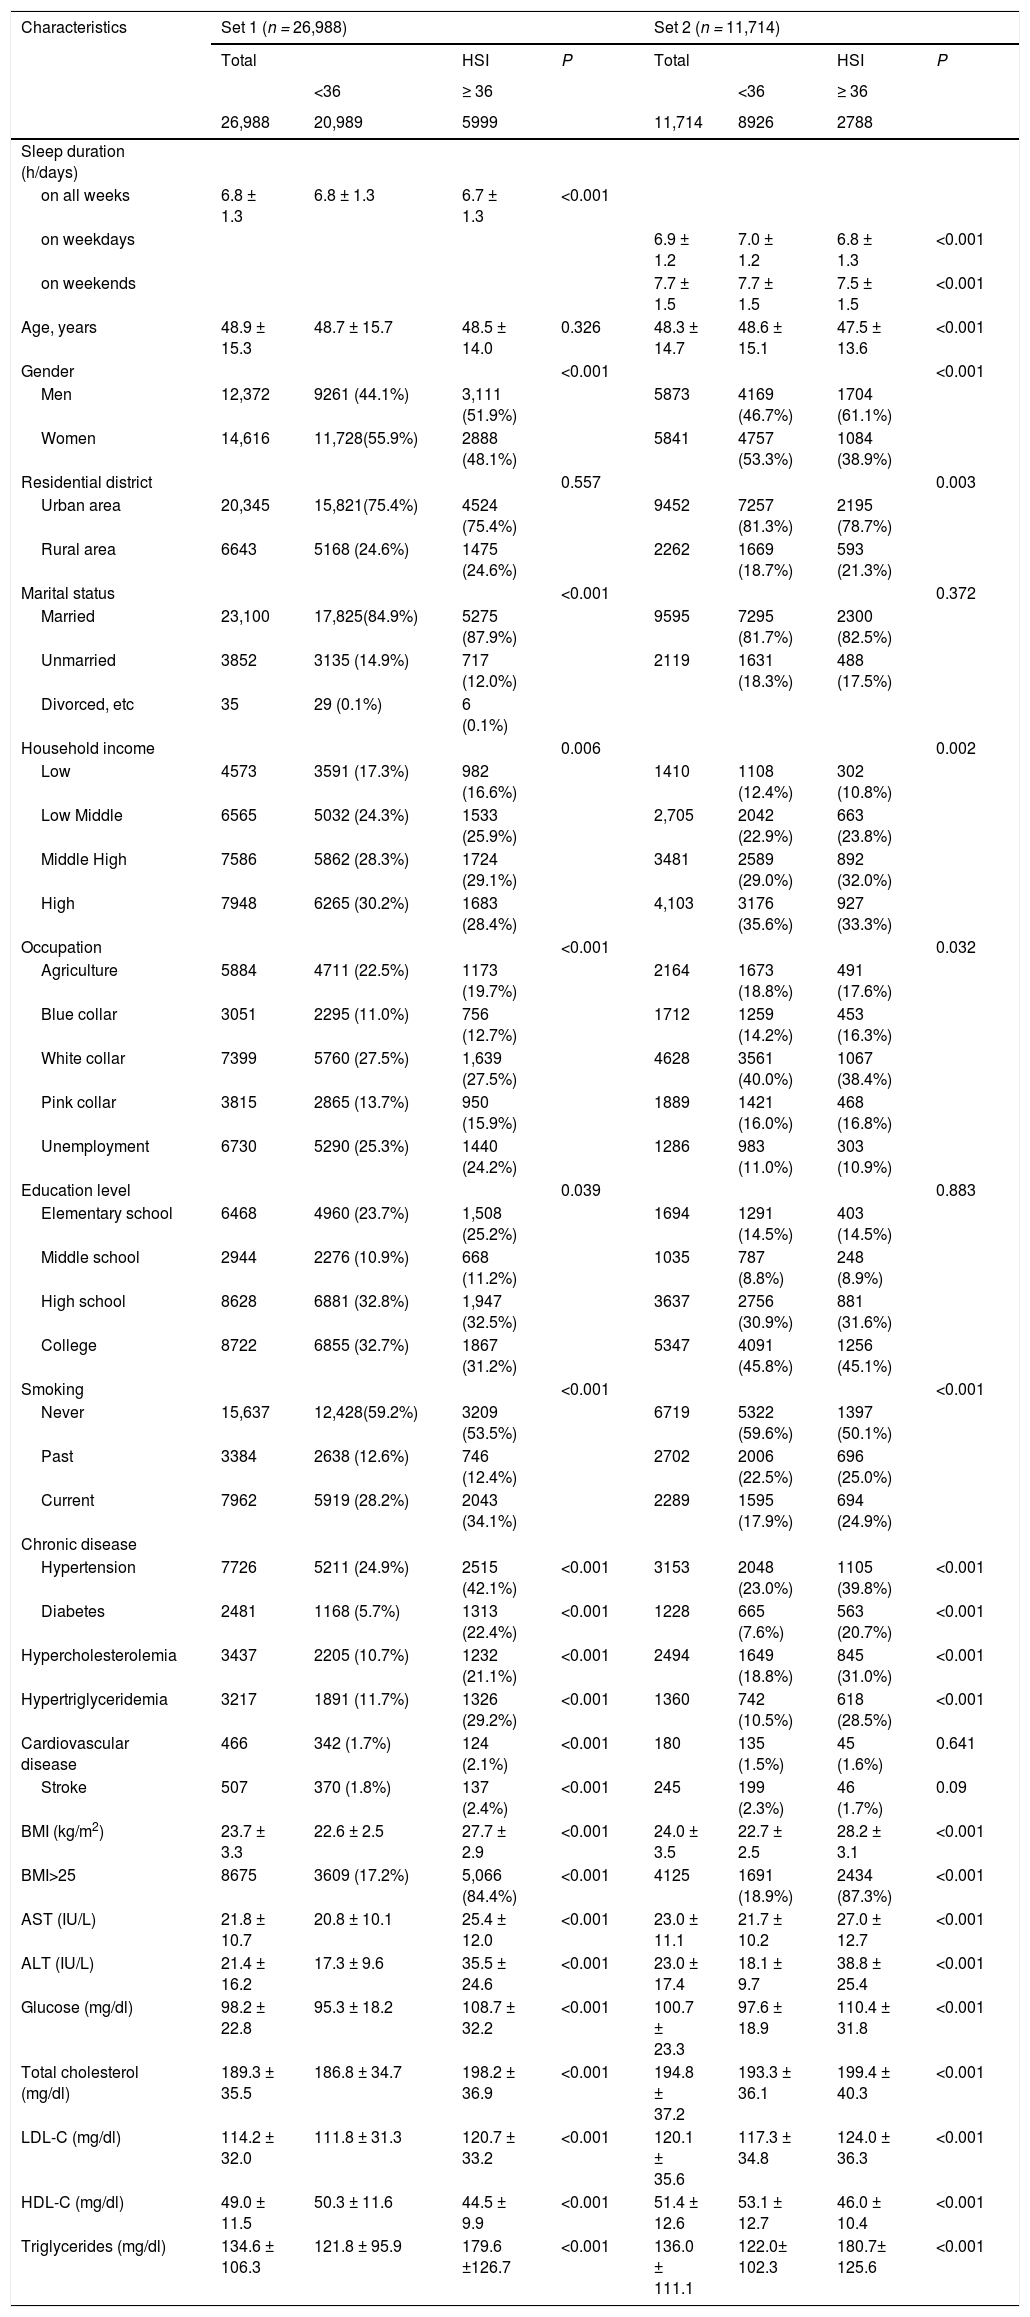
3Results3.1Baseline participants characteristicsSet 1 included 26,988 subjects and Set 2 included a total of 11,714 subjects. In Set 1, there were 12,372 male subjects (45.8%), 20,345 city dwellers (75.3%), and 23,100 married persons (85.5%). There were 8675 (32.1%), 2481 (9.1%), 7726 (28.6%), and 3437 (12.7%) people with obesity, diabetes, hypertension, and hyperlipidemia, respectively. The mean AST, ALT, serum glucose, and total cholesterol levels were 21.8 IU/L (± 10.7), 21.4 IU/L (± 16.2), 98.2 mg/dL (± 22.8), and 189.3 mg/dL (± 35.5), respectively. Collected without distinction between weekday and weekend time in Set 1, the mean sleep duration of the subjects in Set 1 was 6.8 hours (± 1.3 hours), and 15,825 (58.6%) subjects had more than 7 hours of sleep during the entire week.
In Set 2, there were 5873 male subjects (50.1%), 9452 city dwellers (80.7%), and 9595 married persons (81.9%). There were 4125 people with obesity (35.2%), 1228 people with diabetes (10.5%), 3153 people with hypertension (26.9%), and 2494 people with hyperlipidemia (21.3%). With respect to the blood tests, the mean AST, ALT, serum glucose, and total cholesterol levels were 23.0 IU/L (± 11.1), 23.0 IU/L (± 17.4), 100.7 mg/dL (± 23.3), and 194.8 mg/dL (± 37.0), respectively. The average sleep duration during the weekdays of Set 2 subjects was 6.9 hours (± 1.2 h), and 7026 subjects had an average sleep time of more than 7 hours (59.9%). The mean duration of sleep during the weekend was 7.7 hours (± 1.5 hours). The basic features of all the subjects are described in Table 1.
Clinical characteristics in the study population in Set 1.
*ALT, alanine aminotransferase; AST, aspartate aminotransferase; BMI, body mass index; LDL-C, low-density lipoprotein cholesterol; HDL-C, high-density lipoprotein cholesterol.
Continuous variables are expressed as means and standard deviations. Categorical variables are expressed as numbers and percentages
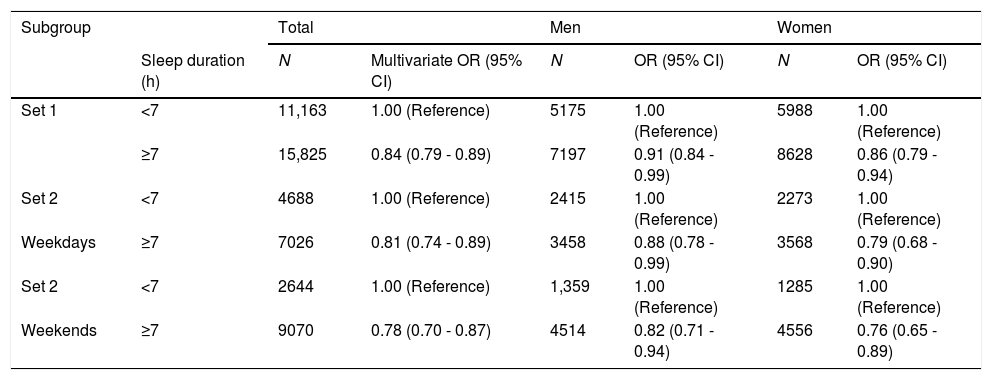
In all Set 1 subjects, the mean sleep duration of 7 hours or more was associated with a negative OR for NAFLD compared with less than 7 hours of sleep duration (odds ratio [OR]: 0.84, 95% confidence interval [CI]; 0.79–0.89 for all; OR; 0.91, 95%CI; 0.84–0.99 for male subjects; OR: 0.86, 95%CI; 0.79–0.94 for female subjects) (Table 2).
Associations between sleep duration and quality and the risk of fatty liver in clinically relevant subgroups.
*The risk of sleep duration on the prevalence of hepatic steatosis in (A) total, (B) men, and (C) women.
Adjusted for age (continuous), residence, education, marital status, smoking (never, former, current), alcohol consumption (g/week), systolic blood pressure, and serum total cholesterol.
In Set 2 subjects, the mean sleep duration of 7 hours or more during the weekdays was associated with a negative OR for NAFLD compared with less than 7 hours sleep duration (OR: 0.81, 95%CI: 0.74–0.89 for all; OR: 0.88, 95%CI: 0.78–0.99 for male subjects; OR: 0.79, 95%CI: 0.68–0.90 for female subjects) (Table 2). Set 2 subjects with a mean sleep duration of 7 hours or more during the weekend was associated with a negative OR for NAFLD (OR: 0.78, 95%CI: 0.70–0.87 for all; OR: 0.82, 95%CI: 0.71–0.94 for male subjects; OR: 0.76, 95%CI: 0.65–0.89 for female subjects) (Table 2).
3.3Relationship between sleep habits and HSI according to WCUSIn Set 2, which consists of data separated according to the duration of sleep on weekdays and weekends, there were 2365 (20.2%) subjects who slept for less than 7 hours during the week and could not catch up on weekends (Group 1); 2602 (22.2%) subjects who slept for less than 7 hours during the week and had WCUS (Group 2); and 6747 (57.6%) subjects who slept for more than 7 hours during the week (Group 3).
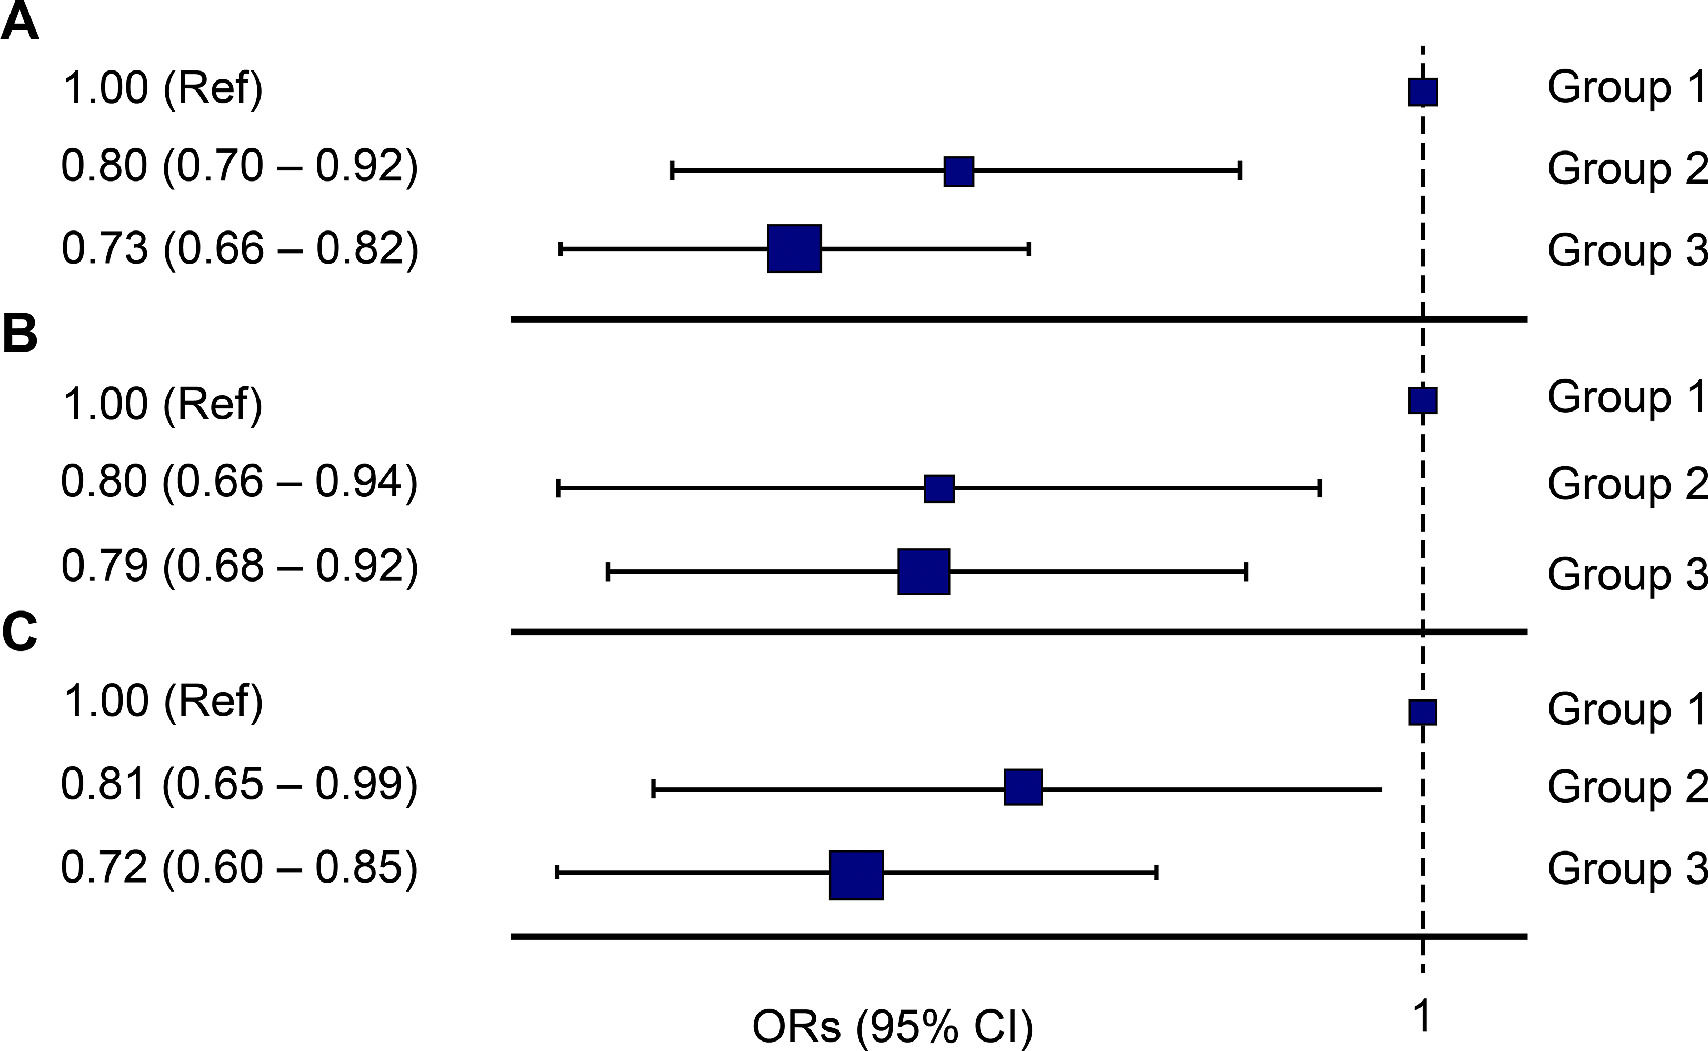
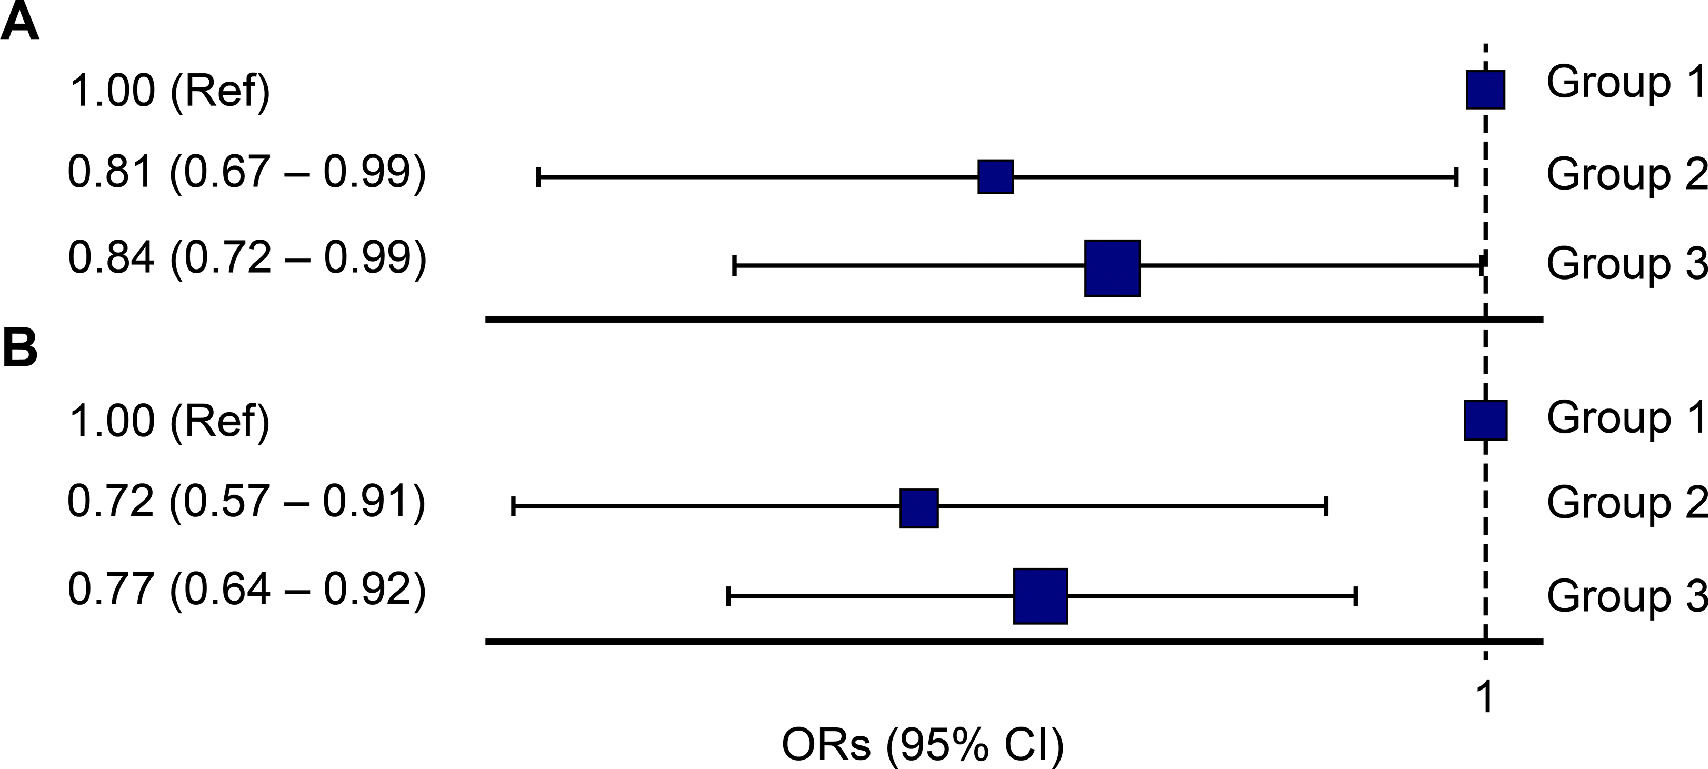
Based on Group 1, the OR of Group 2 was 0.80 for NAFLD (95%CI: 0.70–0.92), and the OR of Group 3 was 0.73 (95%CI: 0.66–0.82) (Fig. 2). In men, based on Group 1, the ORs for Groups 2 and 3 for NAFLD were 0.80 (95%CI: 0.66–0.94) and 0.79 (95%CI: 0.68–0.92), respectively, which showed a significant correlation. In women, based on Group 1, the ORs of Group 2 and Group 3 for NAFLD were 0.81 (95%CI: 0.65–0.99) and 0.72 (95%CI: 0.60–0.85), respectively (Fig. 2). In the sub-analysis of subjects with obesity, the ORs of Group 2 and Group 3 based on Group 1 were 0.81 (95%CI: 0.67–0.99) and 0.84 (95%CI: 0.72–0.99), respectively. In the subjects with metabolic syndrome, the ORs of Group 2 and Group 3, based on Group 1 were 0.72 (95%CI: 0.57–0.91) and 0.77 (95%CI: 0.64–0.92), respectively (Fig. 3).
 for non-alcoholic fatty liver disease according to the sleep pattern (Group 1: less than 7 hours of sleep during the entire week, Group 2: Weekend catch up sleep, Group 3: 7 or more than 7 hours of sleep during the entire week); (A) entire cohort, (B) male subjects, (C) female subjects.")
The odds ratio (OR) for non-alcoholic fatty liver disease according to the sleep pattern (Group 1: less than 7 hours of sleep during the entire week, Group 2: Weekend catch up sleep, Group 3: 7 or more than 7 hours of sleep during the entire week); (A) entire cohort, (B) male subjects, (C) female subjects.
 for non-alcoholic fatty liver disease according to the sleep pattern (Group 1: less than 7 hours of sleep during the entire week, Group 2: Weekend catch up sleep, Group 3: 7 or more than 7 hours of sleep during the entire week); (A) obesity, (B) metabolic syndrome.")
The odds ratio (OR) for non-alcoholic fatty liver disease according to the sleep pattern (Group 1: less than 7 hours of sleep during the entire week, Group 2: Weekend catch up sleep, Group 3: 7 or more than 7 hours of sleep during the entire week); (A) obesity, (B) metabolic syndrome.
For ALT ≥ 40 IU/L, based on Group 1, the OR of Group 2 was 0.76 (95%CI: 0.63–0.92) and the OR of Group 3 was 0.75 (95%CI: 0.64–0.88). For BMI ≥ 25 kg/m2, based on Group 1, the OR of Group 2 was 0.87 (95%CI: 0.77–0.98) and the OR of Group 3 was 0.77 (95%CI: 0.70–0.86).
4DiscussionFrom the analysis of the data from the KNHANES (2008–2015) in this study, less than 7 hours of sleep showed a significant correlation with HSI ≥ 36, suggestive of NAFLD. Even when the sleep duration is analyzed by dividing it into weekdays and weekends using the KNHANES data (2016–2019), less than 7 hours of sleep showed a significant correlation with HSI ≥ 36. In addition, when separated into male and female subjects, less than 7 hours of sleep in both male and female subjects showed a significant correlation with HSI ≥ 36.
There are some plausible mechanisms that link the decrease in sleep and NAFLD. Hypothalamic–pituitary–adrenal axis and autonomic nervous system activities are important in the regulation of physical and mental health conditions. Cortisol, inflammatory cytokines, and norepinephrine, which are derivatives of these systems, are associated with the variation in sleep such as total sleep time, sleep quality, sleep efficiency, and circadian midpoint. The dysregulation of this axis caused by changes in sleep can increase the risk of NAFLD onset [23].
Leptin may be also considered a physiologic cause of metabolic disease. This peptide hormone secreted by the adipose tissue from a molecular physiological perspective promotes satiety. The blood concentration of leptin is closely related to the sleep duration [24]. A decrease in sleep duration results in a decrease in leptin concentration and an increase in the activity of the food reward system. This leads to an increase in calorie intake and weight gain. In addition, a decrease in sleep duration causes a decrease in the intestinal-derived peptide, glucagon-like peptide-1 (GLP-1), and GLP-1 delays gastric emptying and promotes satiety [25]. The physiological background on the development of obesity can explain the occurrence of NAFLD due to reduced sleep duration.
Sleep duration is an important factor that affects the development of diabetes and cardiovascular diseases. A previous meta-analysis reported a significant correlation between sleep duration and the development of diabetes [26]. A previous epidemiological study reported that insufficient sleep duration increases the risk of developing cardiovascular diseases [27,28]. In addition, Hoevenaar-Blom et al. reported that sufficient sleep can reduce the risk of cardiovascular diseases [29]. According to a study by Kwon et al., sleep duration is a factor that can predict not only the mortality rate of cardiovascular diseases but also cancer. Therefore, it can be inferred that sleep duration is closely related not only to the occurrence of a disease but also to its survival rate [30].
NAFLD is a metabolic disease. It is a major risk factor for obesity, diabetes, and cardiovascular diseases. It can progress to cirrhosis or liver cancer. Fatty liver has several causes, and insufficient sleep is closely related to NAFLD. Kim et al. reported that poor sleep quality and reduced sleep duration are significantly correlated with the occurrence of NAFLD [14]. An inadequate sleep habit affects the hormone metabolism of the body, which can lead to obesity, metabolic syndrome, and NAFLD.
In a previous report, WCUS was reported to be significantly correlated with a decrease in the incidence of metabolic syndrome [31]. In that study, it was found that WCUS can reduce the OR of metabolic syndrome by 45%. This present study revealed a significant correlation between sleep duration and HSI. Our result is similar to that of a previous study which showed a correlation between overall sleep duration and chronic metabolic disease. Furthermore, NAFLD is associated with WCUS. In modern societies, it is difficult for people to get enough sleep during the week leading to sleep supplementation on weekends. In our study, Group 2 of the WCUS accounted for approximately 22.2%. When Group 1 was used as a reference, the ORs of Group 2 and Group 3 for NAFLD were 0.80 (CI: 0.70–0.92) and 0.73 (CI: 0.66–0.82), respectively. Our study revealed that people who get enough sleep have a lower risk of developing NAFLD than those who get insufficient sleep. Furthermore, we revealed that people who had WUCS have a lower risk of developing NAFLD than those who did not get enough sleep, even on weekends.
When analyzed in men and women, the largest negative correlation of 7 hours or more of sleep was higher than less than 7 hours with NAFLD, and a negative correlation was observed in the WCUS group with NAFLD. WCUS was found to be highly correlated with the incidence of NAFLD, regardless of sex.
Other results support the correlation between WCUS and NAFLD. Reduced total sleep duration showed a significant relationship with ALT of 40 IU/L or higher. In addition, those who had enough sleep during both weekdays and weekends or WCUS showed a negative relationship with an ALT of 40 IU/L or higher. Similar results were also obtained with obesity, which is a known prognostic factor of chronic diseases. Those who had 7 hours or more of sleep on weekdays and weekends and those who had WCUS showed a negative correlation with obesity in our study. Based on these results, it is thought that WCUS is significantly correlated with NAFLD. No research has shown how WCUS relieves the fatty liver in animal experiments and other clinical studies, however, we have suggested that sleep supplementation during weekends may ease oxidative stress and inflammation in the liver.
This study had some limitations. First, this was a cross-sectional study. Therefore, it is not known whether insufficient sleep duration is a causal factor of NAFLD. However, the KNHANES is a representative national survey data, and the sample size is large. It is a major discovery that there is a high correlation between WCUS and NAFLD. Second, sleep duration was not an individually observed measure. However, since the data was from a national survey it was considered highly reliable because it was collected by survey experts. Third, the gold standard method of diagnosing NAFLD is a biopsy, and our study did not include histological results. However, due to the high cost of biopsy and the complications related to biopsy, non-invasive diagnostic methods have been widely used in recent research [32]. HSI is a representative method for diagnosing NAFLD [22].
In conclusion, the overall sleep duration and WCUS were negatively correlated with NAFLD (HSI ≥ 36). In the future, the causal relationship between WCUS and NAFLD should be prospectively studied to enhance the proper concepts and methods of sleep hygiene. Based on this study, it is expected that the methods of treatment of NAFLD will be expanded since there is no clear treatment of NAFLD other than improving eating habits or weight loss.
FundingThis study was supported by National Research Foundation of Korea (grant number 2018R1C1B5043143). The funder had no role in study design, data collection and analysis, decision to publish, or preparation of the manuscript.
Author ContributionsSangheun Lee: Visualization, Conceptualization, Writing – review & editing, Methodology, Supervision, Funding acquisition, Yongsang Seo: Writing – original draft, Data curation, Gi-Ho Sung: Data curation, Formal analysis, Ki Jun Han: Writing – review & editing
Data sharing statementData are available in a public, open access repository.
We gratefully acknowledge the Korea National Health and Nutrition Examination Surveys (KNHANES) from the Korea Centers for Disease Control and Prevention.


