


Liver fibrosis is an important prognosis marker in non-alcoholic fatty liver disease (NAFLD). Biopsy has been considered the gold-standard method for measuring liver fibrosis; however, it is an invasive procedure. Non-invasive diagnostic tools have been developed, such as clinical scores and magnetic resonance elastography (MRE), which is the most accurate non-invasive method to determine liver fibrosis. Thus, the aim was to determine the NAFLD Fibrosis Score (NFS) and the Fibrosis-4 Score (FIB-4) cut-off points that best identify NAFLD patients at risk for developing liver fibrosis.
Patients and MethodsSingle-center cross-sectional study with prospective recruitment of NAFLD (training-cohort) and MAFLD (validation-cohort) patients undergoing MRE. The NFS and the FIB-4 cut-off points that best-differentiated patients with fibrosis, using the MRE as the standard method, were determined.
ResultsTwo cohorts were analyzed, a training cohort that included the initial 183 patients with NAFLD and a validation cohort that included 289 patients. In the training cohort, 60.1% had mild steatosis and 11.5% had liver fibrosis ≥ F1 by MRE. ROC curves were developed for FIB-4 and NFS, and the cut-off points chosen were 1.505 (sensitivity=85% and specificity=86%) for FIB-4 and -0.835 (sensitivity=100% and specificity=70%) for NFS, showing greater specificity than the cut-off points currently used (51% and 76%, respectively). The two cohorts exhibited similar characteristics and similar sensitivity and specificity results for the chosen cut-off points.
ConclusionsThis study has shown cut-off points with greater specificity and excellent sensitivity to guide the indication for further liver evaluation by MRE in NAFLD patients.
Metabolic-associated fatty liver disease (MAFLD), formerly called non-alcoholic fatty liver disease (NAFLD), comprises a spectrum of abnormalities, ranging from isolated steatosis to steatohepatitis, characterized by inflammation, necrosis, and hepatocellular ballooning and progression to fibrosis, cirrhosis, liver failure and/or hepatocellular carcinoma (HCC) [1–3]. MAFLD is significantly different from previous diagnostic criteria for NAFLD [1]. The two most important and significant differences between MAFLD and NAFLD are as follows: MAFLD diagnosis does not require the exclusion of patients with alcohol intake or other chronic liver diseases and the presence of metabolic abnormality is necessary for its diagnosis [1]. In Western countries, the overall prevalence of NAFLD ranges from 30% to 40% in the general population and it affects up to one-third of the population living in South America or the Middle East [4,5]. An exponential increase in its prevalence is expected in the coming decades, together with the global epidemic of obesity, type 2 diabetes mellitus (T2DM), and a sedentary lifestyle [6].
Fibrosis is the main predictor of morbidity and mortality in NAFLD, increasing the risk of cardiovascular disease and severe liver disease [7,8]. Thus, fibrosis is also a key factor in NAFLD management. Although liver biopsy remains the gold-standard method for diagnosing and staging fibrosis, it is an invasive procedure, subject to sampling errors, inter-observer variability, and clinical complications [9,10]. For this reason, non-invasive tools have been developed for the assessment of hepatic fibrosis in NAFLD, such as tests based on clinical and laboratory parameters, including the NAFLD Fibrosis Score (NFS) and the Fibrosis-4 Score (FIB-4), as well as ultrasound-based elastography techniques [9,11-15].
Both the FIB-4 score and NFS score were identified by current guidelines as suitable predictors for the initial evaluation of NAFLD patients [16–19]. However, the cut-off points currently used present a considerable rate of false positives, with a positive predictive value of 43% for both [7]. Magnetic resonance elastography (MRE) has played a prominent role in the assessment of liver fibrosis and is currently the most accurate non-invasive method for the detection and staging of fibrosis, with excellent intra- and inter-observer agreement [12,20,21]. However, this method is not yet widely available, mainly due to its cost. If we consider the high prevalence of NAFLD, the assessment of liver fibrosis in all these patients becomes unfeasible [9]. In this scenario, the present study aimed to identify patients at risk for liver fibrosis from the early stages (F1-F2) by calculating NFS and FIB-4 scores and comparing the results to a non-invasive evaluation of liver fibrosis by MRE.
2MethodsThis was a single-center and cross-sectional study conducted through the prospective selection of patients aged 18 years or older who were referred by the clinician to undergo multiparametric magnetic resonance (MR) of the liver for suspected or followed-up NAFLD period 2020-2021. Patients agreed to participate in the study by signing their free and informed consent. Following the performance of MR, MRE was added at no cost for the additional assessment of liver stiffness.
For the development of this study, two cohorts of patients were recruited: the training cohort and the validation cohort. In the training cohort, 183 patients diagnosed with NAFLD were included. Patients with other chronic liver diseases, such as hemochromatosis, Wilson's disease and alpha-1-antitrypsin deficiency, were excluded, as well as those patients infected either with hepatitis B, C, or human immunodeficiency virus, those with significant alcohol intake (ethanol intake above 20g/day for women and 30g/day for men), transplant patients, or patients taking drugs that could cause steatosis (e.g., amiodarone, tamoxifen, estrogen or corticosteroids).
The validation cohort included 289 patients diagnosed with viral hepatitis and patients who reported alcohol consumption, taking into account the MAFLD criteria [1,2]. Criteria for a diagnosis of MAFLD were based on evidence of hepatic steatosis, in addition to one of the following three criteria, namely overweight/obesity, presence of T2DM, or evidence of metabolic dysregulation [1,2]. In this analysis, 60 participants without steatosis on MR of the liver (Supplementary Data) were also included due to the presence of metabolic syndrome, meaning the presence of at least three out of the following criteria: obesity [body mass index (BMI) ≥ 30 kg/m2], hyperglycemia (fasting blood glucose higher than 100 mg/dL), T2DM, hypertension and dyslipidemia.
In both cohorts, patients who underwent the examination or procedures with technical failure, which prevented the quantitative assessment of hepatic stiffness (movement artifacts, hepatic iron overload, and metallic artifacts due to the presence of prosthesis in the abdominal region), were not included as well as those patients who have refused to participate in the research.
2.1Exam protocolAll exams were performed on a 1.5 Tesla MR system (Magnetom Aera - Siemens Healthineers – Erlangen, Germany). For image acquisition, an 18-channel body flex coil was applied. A 6-hour fasting period was requested before the exam.
Liver steatosis assessment was performed with the most recent MR methods, which use gradient-echo pulse sequence for liver fat, and iron quantification in the liver, named vibe q-Dixon, with six echoes, providing coverage for the entire liver, and generating fat maps, R2* (iron), and water fraction separately. The software used in the study was the LiverLab® - Siemens Healthineers – Erlangen, Germany. The variables provided were the proton density fat fraction (PDFF), expressed as a percentage, and the liver iron concentration, expressed in milligrams per gram (mg/g).
Hepatic fibrosis assessment was performed using MRE of the liver with additional software and hardware (Resoundant®) installed on the magnetic resonance equipment. MRE was performed through the generation of mechanical waves by an external device transmitted through a plastic tube to a device placed on the patient's right hypochondrium. 2D gradient-echo pulse sequence protocol was used to generate images of four axial slices of the liver (each 10 mm thick), encompassing the largest possible area of the liver parenchyma. Four minutes were added to the total exam time. The variable provided was liver stiffness, expressed in kilopascals (kPa). Intravenous contrast was not used, and the total exam lasted approximately 20 minutes.
2.2Exam interpretationImage analysis was performed by a radiologist with approximately five years of experience in MRE. The quantification of liver fat was obtained by placing a region of interest with a 1-cm radius on the fat maps in each of the anatomical segments of the liver, avoiding areas of large vessels and the gallbladder, which can generate less accurate results. The final value was calculated as the mean of the values found and expressed as a percentage. Hepatic steatosis was defined as MR-PDFF ≥ 5.6%.
Liver stiffness was assessed by drawing freehand geographic regions of interest on the elastograms to cover the maximum portion of the hepatic parenchyma, with a confidence map of four axial slices for the MRE sequence. In addition, special care was taken to avoid regions of wave interference, large vessels (> 3 mm), liver fissures, and image artifacts within the liver, as well as an area of low statistical confidence, which may generate less accurate results [22]. The final value was calculated as the mean of the four measurements taken, expressed in kPa, and classified into fibrosis stages 1–2, 2–3, 3–4 and 4, which are equivalent to stages F1–F2, F2–F3, F3–F4 and F4 of the METAVIR system, to facilitate clinical practice, considering that an excellent correlation between MRE rigidity and the pathological degree of fibrosis obtained in liver biopsy samples has already been demonstrated [22]. The following values were considered: F1-F2: 2.9 - 3.5 kPa; F2-F3: > 3.5 – 4.0 kPa; F3-F4: > 4.0 - 5.0 kPa; F4 > 5 kPa [22].
2.3Clinical and laboratory dataClinical and laboratory data of the patient were collected using an interview held by a clinician just before the examination. Data were also obtained from the institution. Laboratory tests carried out six months prior to the examination were also considered. The NFS (variables: age, BMI, T2DM, aspartate aminotransferase (AST), alanine aminotransferase (ALT), platelets and albumin) and FIB-4 (variables: age, AST, ALT and platelets) were calculated. The scores were correlated with the fibrosis stages, which were estimated using MRE.
2.4Statistical analysisNormality was verified for all variables using the Shapiro-Wilk test and the histograms. Quantitative variables were expressed as mean ± standard deviation or median, interquartile range (25th-75th). Categorical variables were presented as frequency and percentage (%). The sample size calculation consisted of 289 patients, considering an error margin of 5% and adopting a significance level of 5%. To determine the cut-off points for the FIB-4 score and the NFS score, the Receiver Operating Characteristic (ROC) curve was used. Sensitivity, specificity, and the areas under the curve were calculated. The Student's t-test was used to compare the means between the two groups. To assess the association between categorical variables, the chi-square test with Yates' continuity correction was applied. The level of significance adopted was 5% (p <0.05). Data obtained in the study were analyzed statistically using SPSS software, version 21.0 (IBM Corporation, USA).
2.5Ethical statementThe present study was approved by the Ethics Committees of Hospital de Clínicas de Porto Alegre (CAAE 26455019.6.0000.5327) and Hospital Moinhos de Vento (4.074.580) and followed the guidelines for studies in humans.
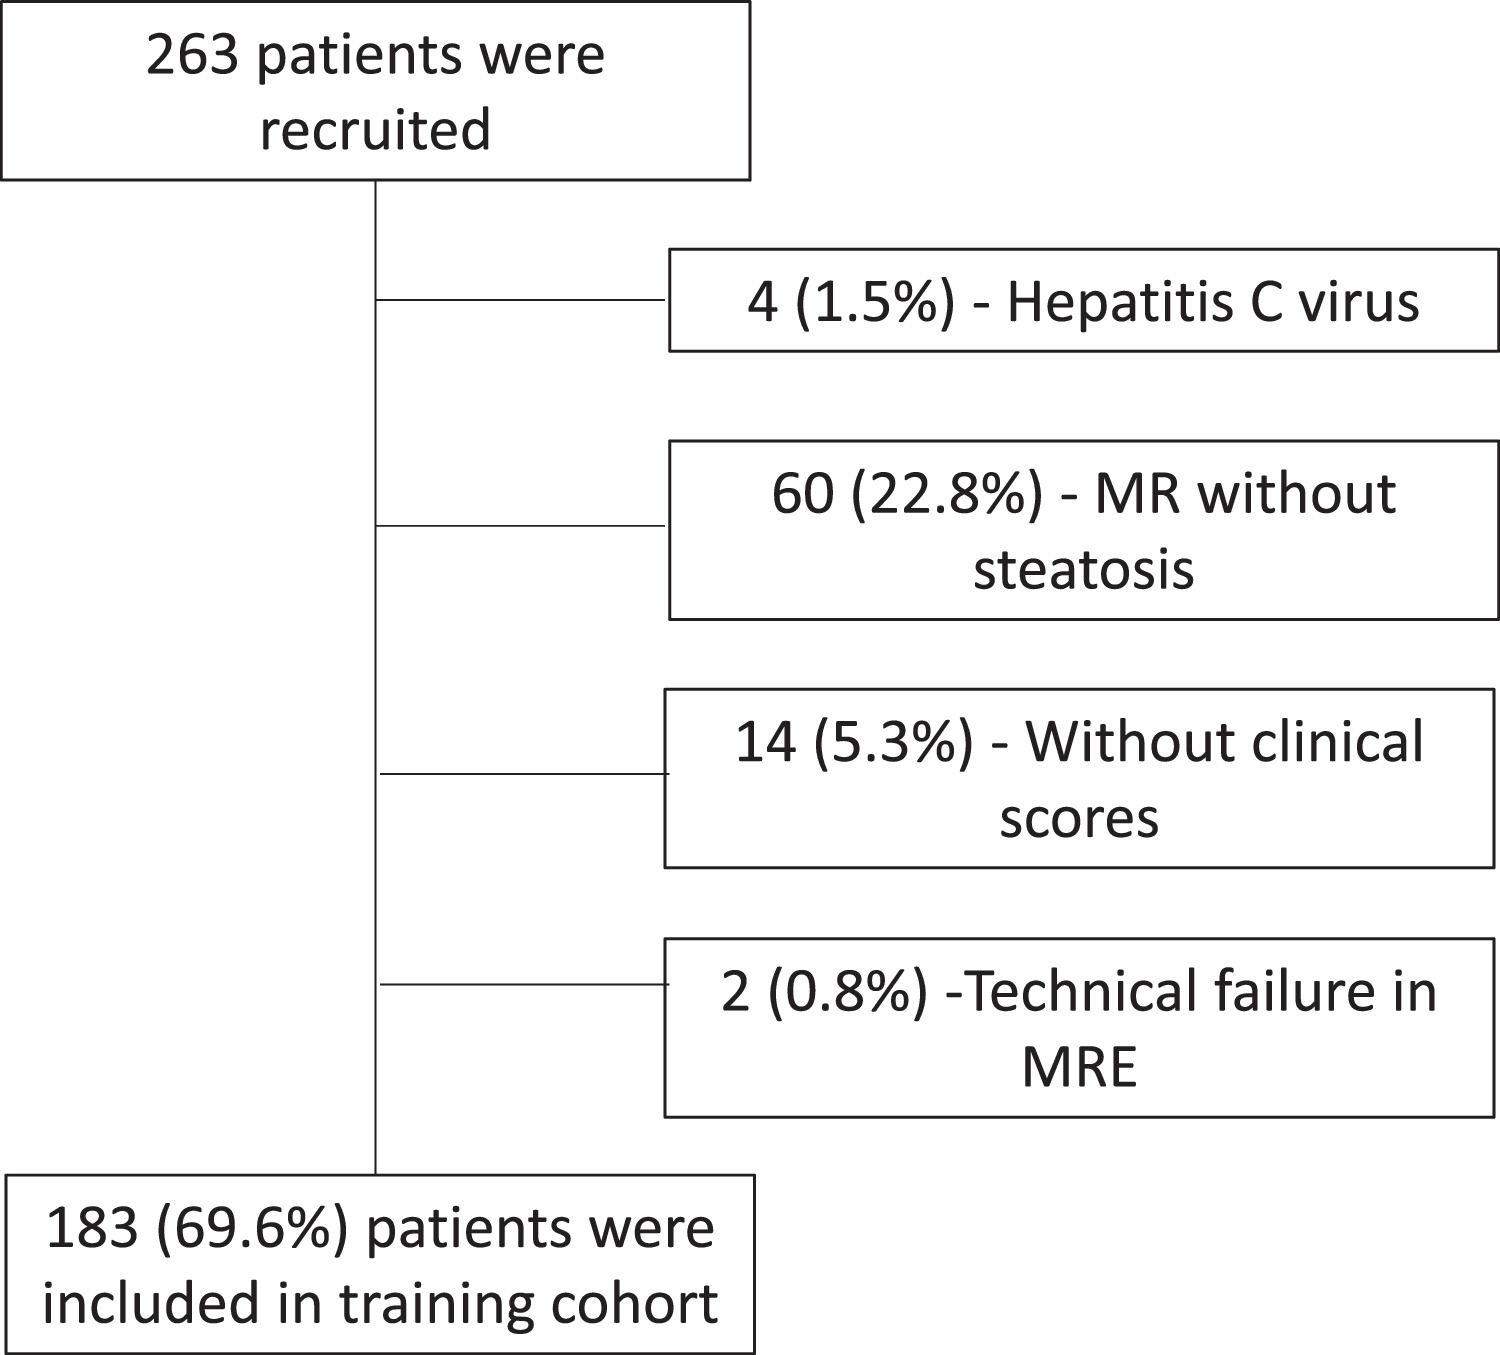
3Results3.1Training cohortOf the 263 patients who underwent MR of the liver and MRE examinations, 183 (69.6%) were included in the study, according to the flowchart (Fig. 1). The characteristics of the patients in the training cohort group are summarized in Table 1. The average age was 52.9 ± 12.4 years, and 50.3% were female. More than half of the patients were obese as measured by BMI and had central obesity as measured by waist circumference and impaired fasting glycemia (IFG). In addition, almost half of the patients met the criteria for metabolic syndrome. Regarding hepatic steatosis, 60.1% of patients had a mild degree, and a similar number of patients had moderate (19.7%) and severe (20.2%) steatosis. There were 21 patients with some degree of liver fibrosis (≥ F1) and 10 patients with advanced fibrosis (F3-F4).

Demographics of the included patients in the training Cohort
| Variables* | Training Cohort N = 183 |
|---|---|
| Age (years) | 52.9 ± 12.4 |
| Gender | |
| Female | 92 (50.3) |
| Male | 91 (49.7) |
| Weight (kg) | 87.1 ± 15.9 |
| Height (m) | 1.67 ± 0.10 |
| BMI (kg/m2) | 31.1 ± 4.3 |
| Waist circumference (cm) | 102.9 ± 13.1 |
| Type 2 diabetes mellitus | 46 (25.1) |
| Impaired fasting glycemia | 111 (60.7) |
| Hypertension | 86 (47.0) |
| Dyslipidemia | 89 (48.6) |
| Obesity Metabolic syndrome | 107 (58.8) 85 (46.4) |
| Alcohol consumption | |
| Yes | 79 (43.2) |
| No | 104 (56.8) |
| Glucose (mg/dl) | 105.4 ± 17.0 |
| AST (U/l) | 32 (24 to 47) |
| ALT (U/l) | 44 (30 to 69) |
| Platelet count (X 109/l) | 242 ± 66 |
| Albumin (g/dl) | 4.58 ± 0.36 |
| Triglycerides (mg/dl) | 153.5 (113 to 208.5) |
| HDL | 49.5 ± 13.8 |
| NFS | -1.31 (-2.44 to -0.49) |
| FIB-4 | 1.10 (0.85 to 1.45) |
| PDFF (%) | 13.0 (8.6 to 19.3) |
| Steatosis grade | |
| Grade 1 | 110 (60.1) |
| Grade 2 | 36 (19.7) |
| Grade 3 R2# kPa | 37 (20.2) 47.3 ± 15.6 2.3 ± 1.0 |
| Fibrosis grade | |
| F0 | 162 (88.5) |
| F1-F2 | 8 (4.4) |
| F2-F3 | 3 (1.6) |
| F3-F4 | 1 (0.5) |
| F4 | 9 (4.9) |
Values are means ± standard deviations (SD), medians (IQR), or counts (%), as appropriate. Type 2 diabetes mellitus is defined as the treatment of previously diagnosed diabetes mellitus with antidiabetic drugs; impaired fasting glycemia, defined as fasting blood glucose of 100 mg/dL; hypertension, defined as the treatment of previously diagnosed hypertension; dyslipidemia, defined as the treatment of previously diagnosed dyslipidemia; and obesity, defined as a BMI ≥ 30 kg/m2. ALT, alanine aminotransferase; AST, aspartate aminotransferase; BMI, body mass index; FIB-4, fibrosis-4 score; HDL, high-density lipoprotein; kPa, kilopascal; NFS, non-alcoholic fatty liver disease fibrosis score; PDFF, proton density fat fraction; R2#, MR relaxometry of the liver (hepatic iron content).
There was a significant correlation between the presence of IFG/T2DM and fibrosis (p = 0.006), with a prevalence of liver fibrosis of 17.1% in diabetic patients, which was higher than that found in the general sample of 11.4%. In the sample evaluated, hypertension (p = 0.22), dyslipidemia (p = 1.00), and obesity (p = 0.07) showed no significant correlation with fibrosis. Furthermore, there was no significant difference in the prevalence of fibrosis between the degrees of steatosis, which were 10.0%, 16.7%, and 10.8%, respectively, for the mild, moderate, and severe degrees.
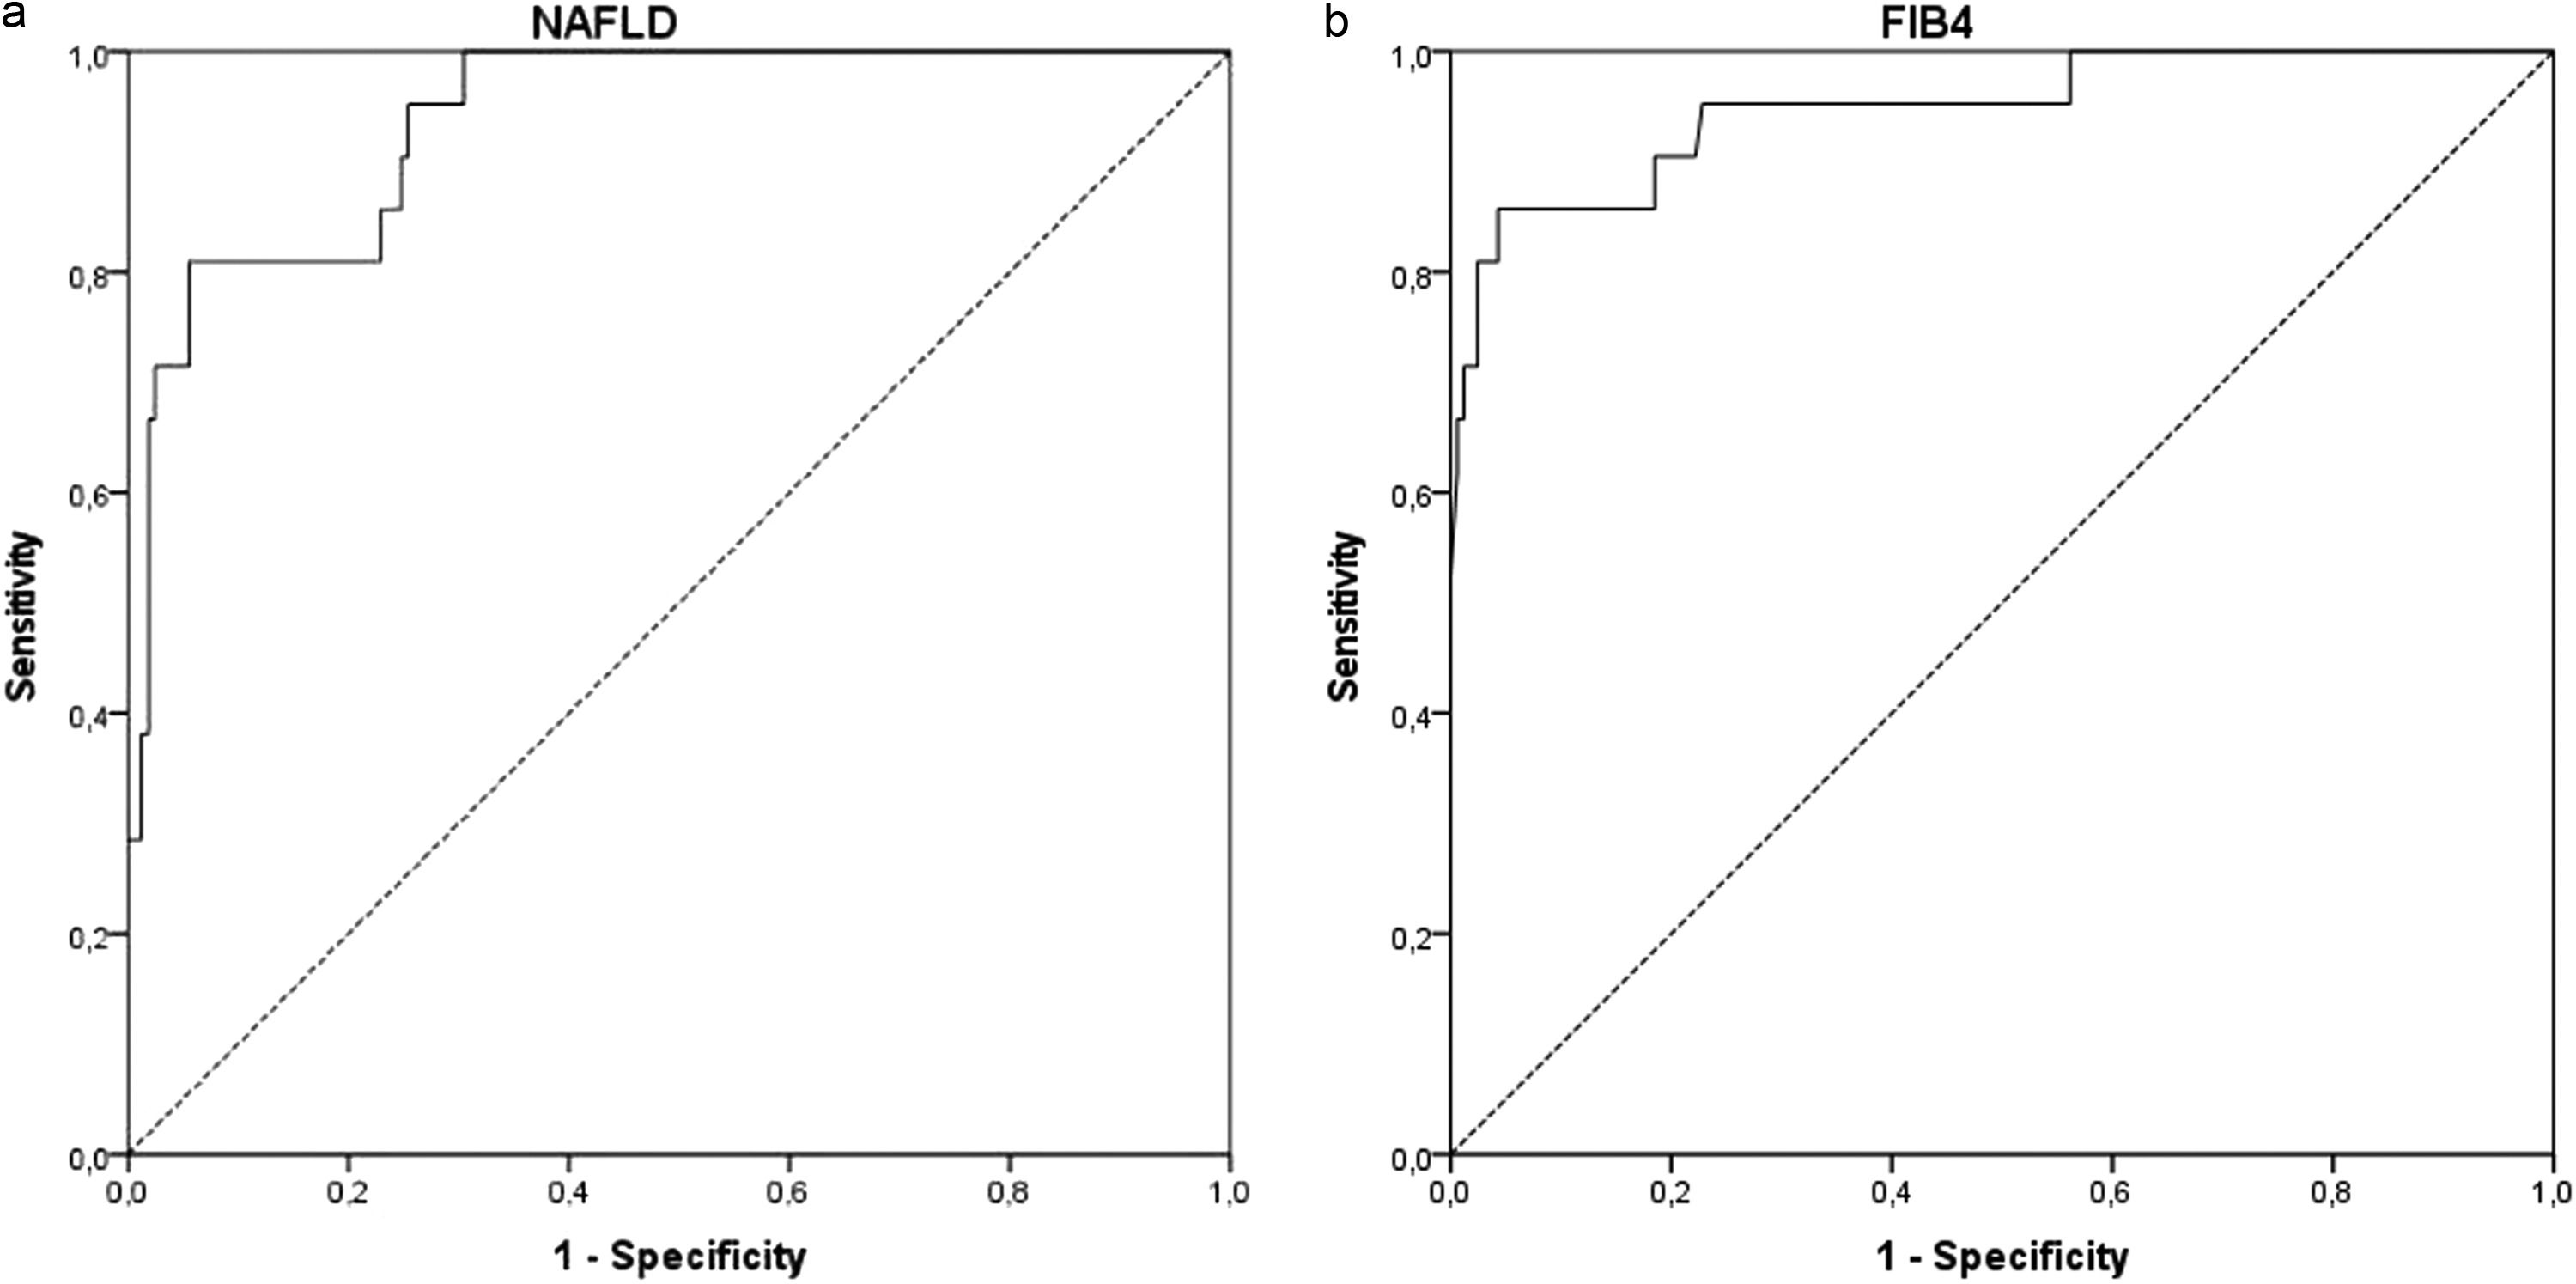
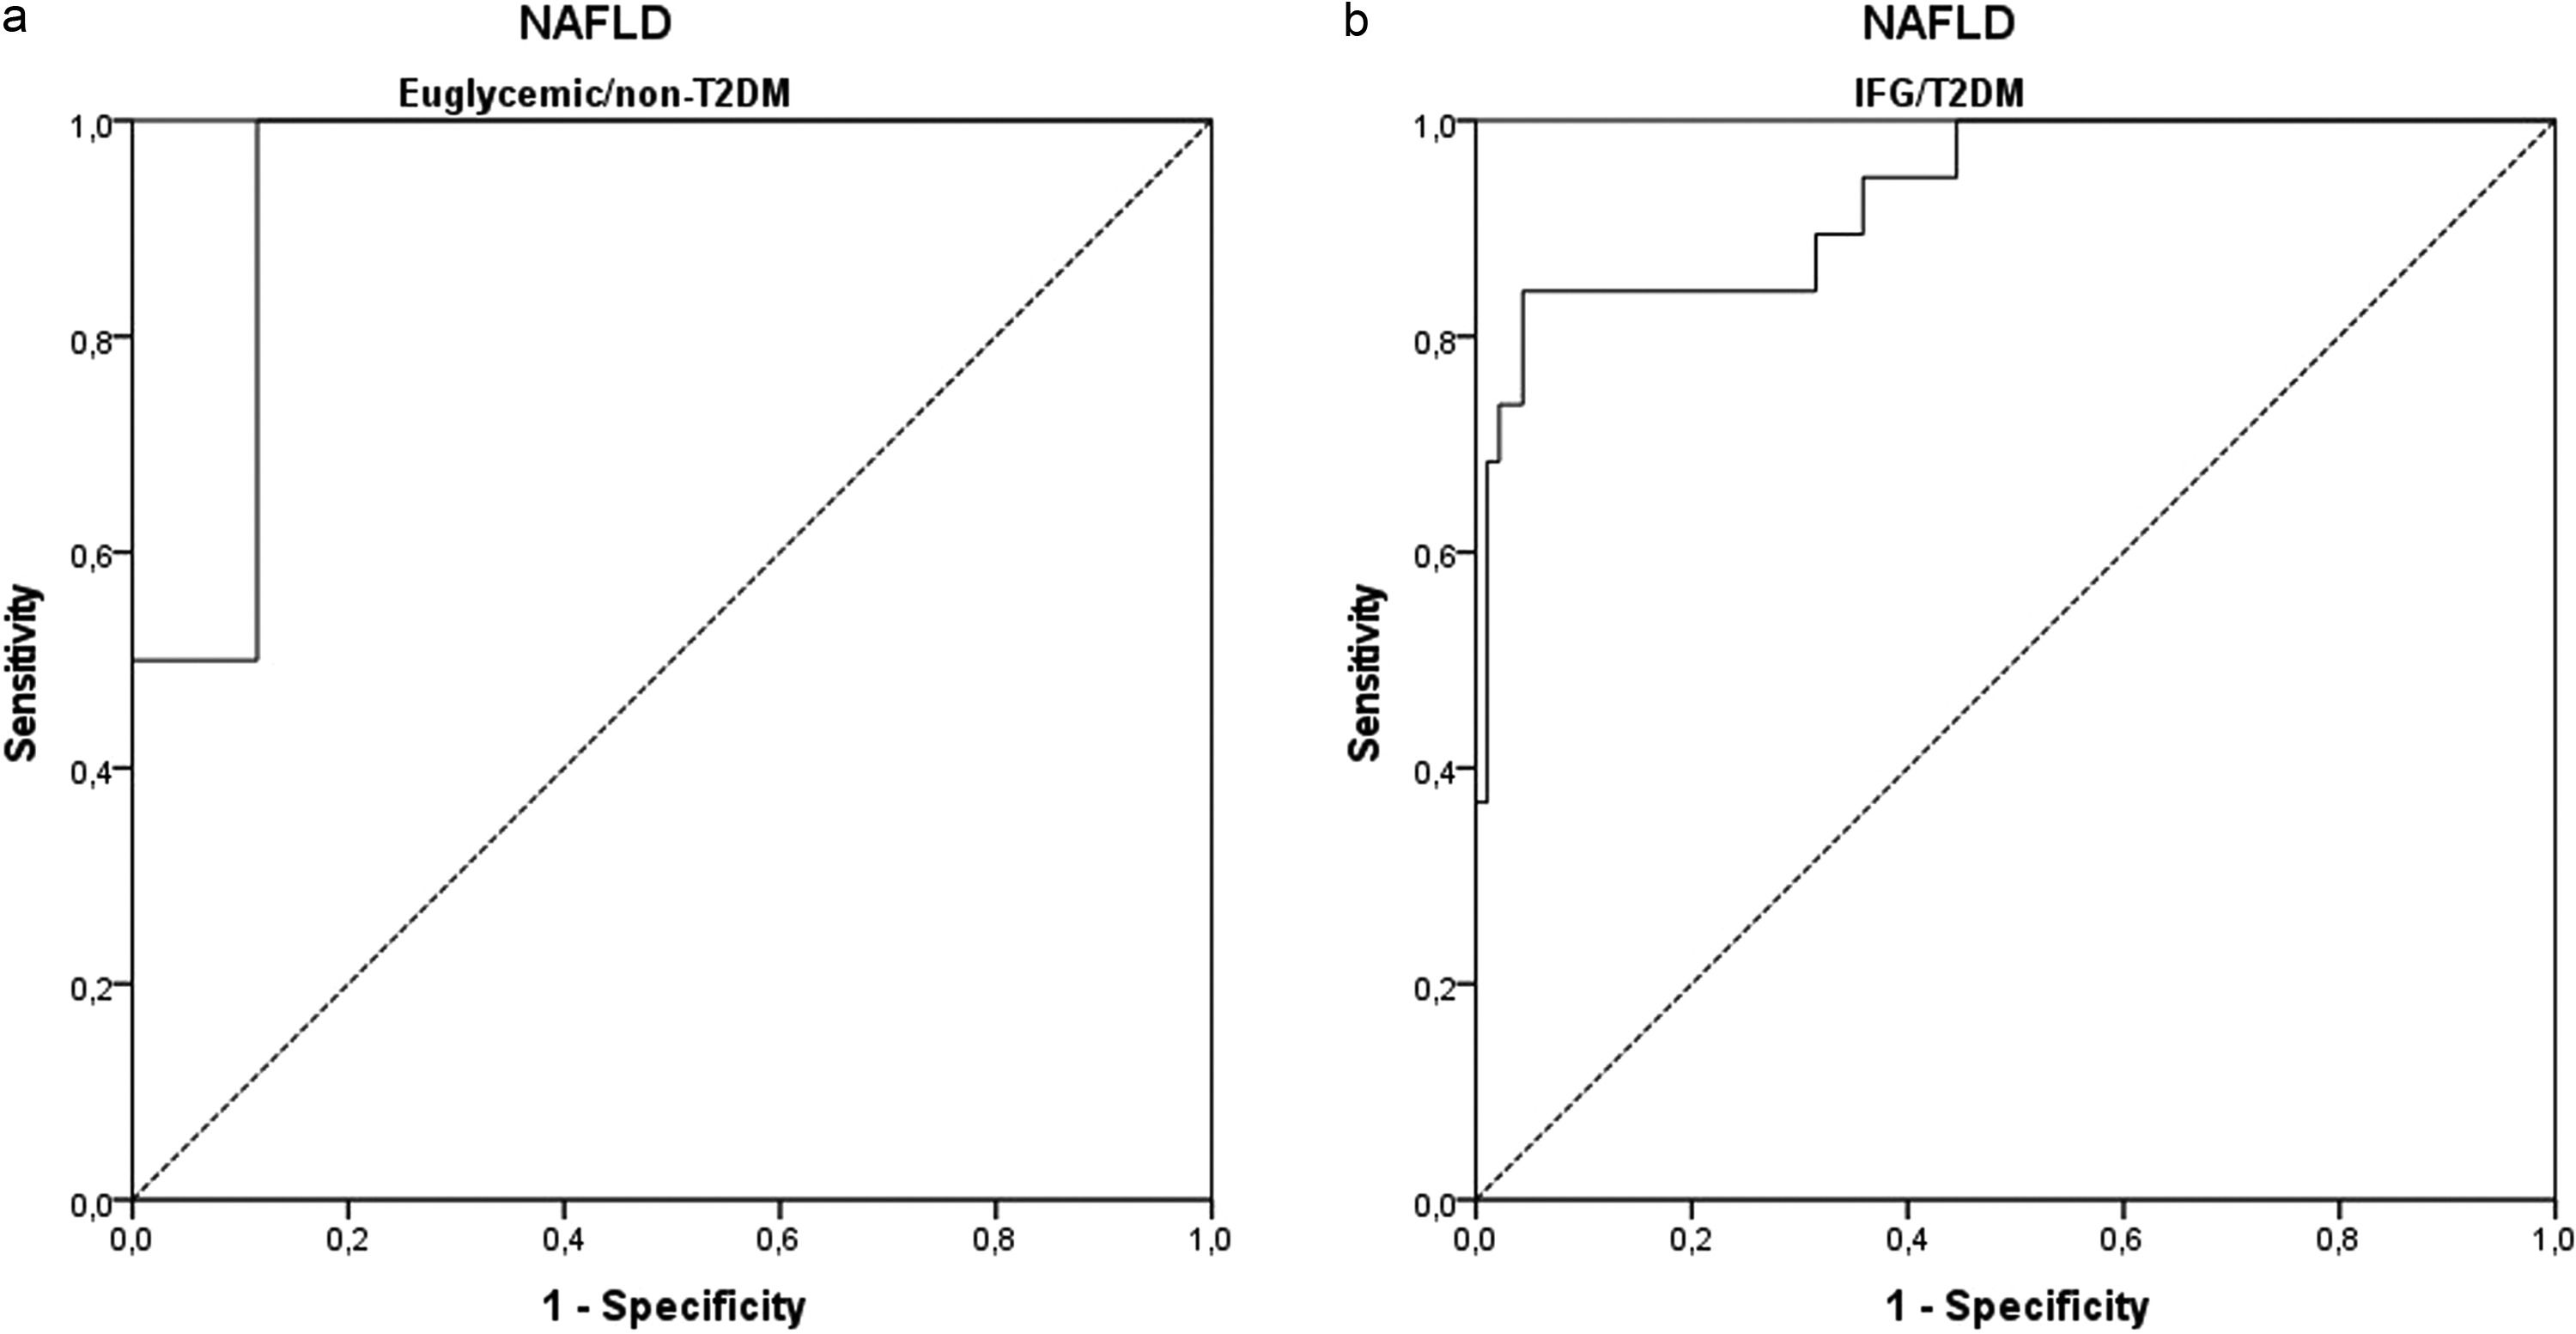
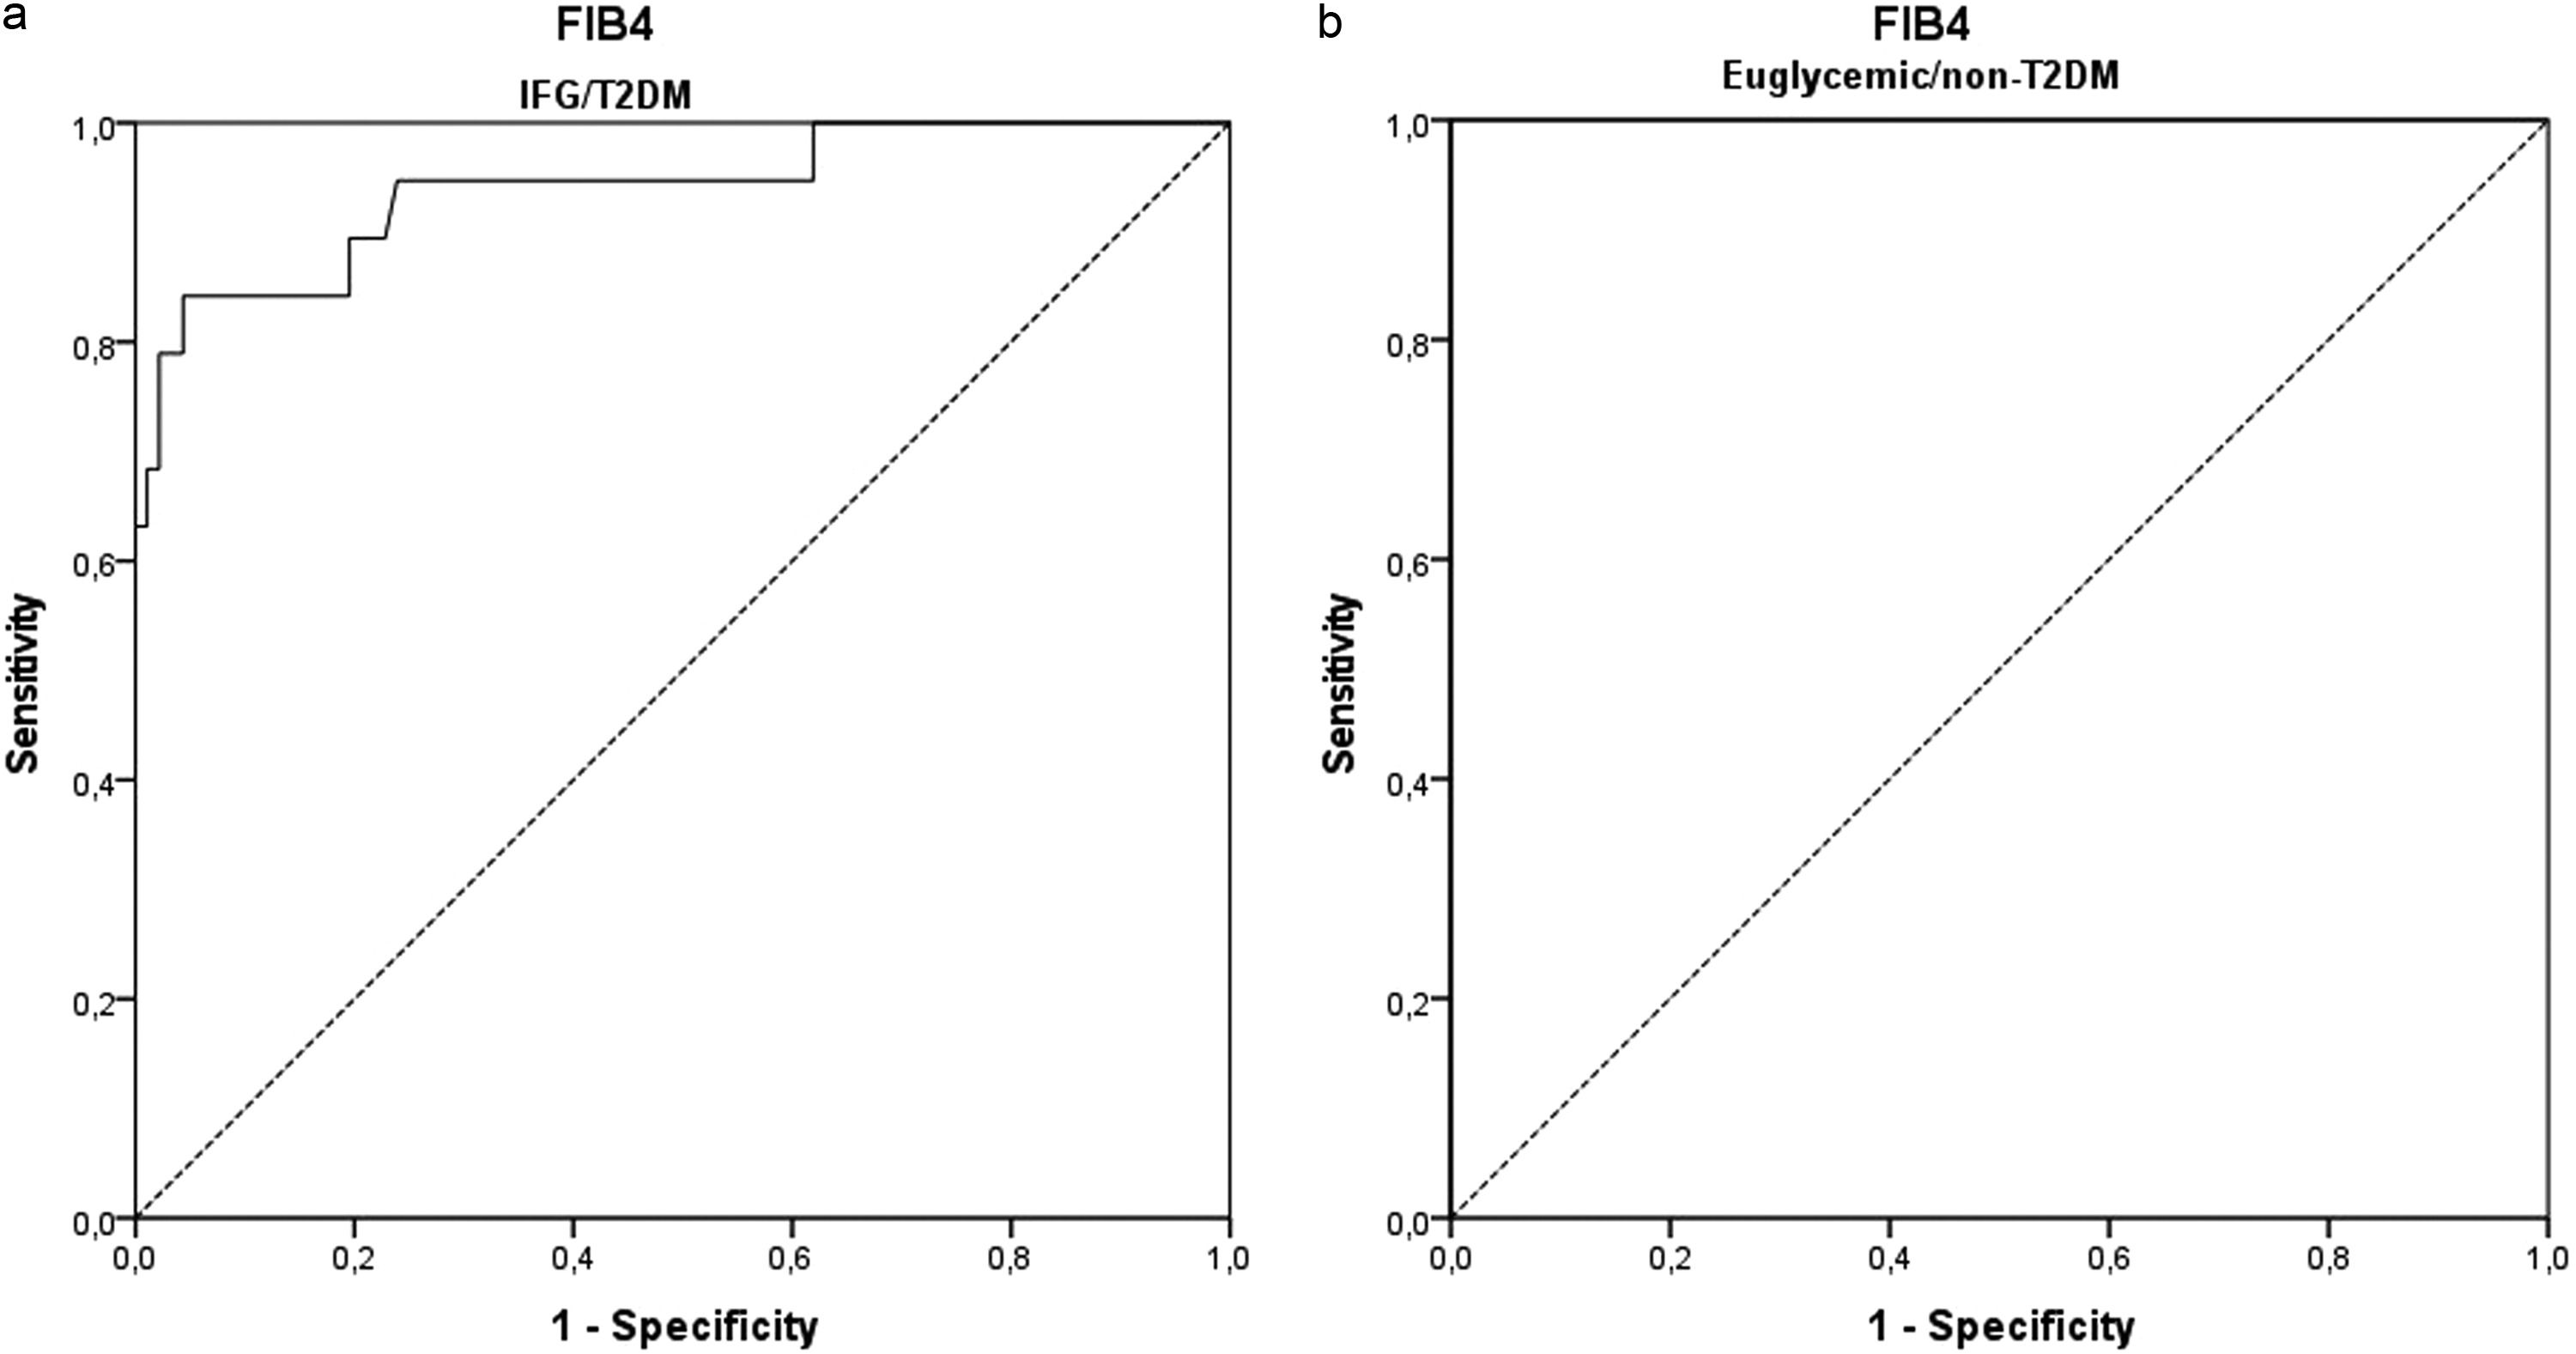
3.2ROC curve analysisThe ROC curves were developed for NFS and FIB-4 (Fig. 3) to determine the usefulness of these scores for predicting early fibrosis (F1-F2) to advanced fibrosis (F3-F4), the clinical question of interest. The areas under the ROC curve (AUROC, 95% CI) were greater for FIB-4 (0.948; 0.892–1.000) than that for NFS (0.938; 0.891–0.984). These data indicate that the two clinical scores studied can accurately predict patients at risk for developing liver fibrosis. The ROC curves were also developed to separate the groups of euglycemic and undiagnosed T2DM patients (euglycemic/non-T2DM) and patients with IFG and/or diagnosed with T2DM (IFG/T2DM). For patients with IFG/T2DM, the areas under the ROC curve (AUROC, 95% CI) were 0.932; 0.868–0.996 for NFS (Fig. 4) and 0.940; 0.871–1.000 for FIB-4 (Fig. 5).
3.3The clinical utility of the NAFLD fibrosis score and the FIB-4 score for identifying fibrosisThe sensitivity and specificity of the NFS and the FIB-4 scores and the ROC curves were evaluated to determine the cut-off points that could best discriminate between patients with fibrosis, with values of -0.835 for NFS and 1.505 for FIB-4. For NFS (cut-off = -0.835), sensitivity was 100%, and specificity was 70%, with a diagnostic accuracy of 73%. For FIB-4 (cut-off = 1.505), sensitivity was 85%, specificity was 86%, a diagnostic accuracy of 86%. When used together, NFS ≥ -0.835 and FIB-4 ≥ 1.505), sensitivity was 86%, and specificity was 92%, with a diagnostic accuracy of 91%, as shown in Table 2.
Analysis between the sensitivity and specificity of the proposed cutoff points and those already used in the general population
| Variables | Sensitivity (%) | Specificity (%) |
|---|---|---|
| NFS ≥ -0.835 | 100 | 70 |
| NFS ≥ -1.45 | 100 | 51 |
| FIB-4 ≥ 1.505 | 85 | 86 |
| FIB-4 ≥ 1.30 | 95 | 76 |
FIB-4, fibrosis-4 score; NFS, non-alcoholic fatty liver disease fibrosis score
The sensitivity and specificity of the NFS and the FIB-4 scores and the ROC curves were also analyzed, separating the groups of patients between those with euglycemic/non-T2DM and those with IFG/T2DM to determine the cut-off points that could best discriminate between the presence and absence of fibrosis in these groups, with values of -0.815 (euglycemic/non-T2DM) and -0.360 (IFG/T2DM) for NFS and 3.64 (euglycemic/non-T2DM) and 1.49 (IFG/T2DM) for FIB-4.
For the NFS in patients with euglycemic/non-T2DM (cut-off = -0.815), sensitivity was 100%, and specificity was 88%, with a diagnostic accuracy of 87%. In patients with IFG/T2DM (cut-off = -0.360), sensitivity was 84%, and specificity was 85%, with a diagnostic accuracy of 85%. When analyzing the cut-off point that would give 100% sensitivity in the latter group, a value of -0.835 was found, the same value found in the general sample but with lower specificity (62%).
For FIB-4 in patients with euglycemic/non-T2DM (cut-off = 3.64), sensitivity was 100%, and specificity was 100%, with a diagnostic accuracy of 100%. In patients with IFG/T2DM (cut-off point = 1.49), sensitivity was 84%, and specificity was 85%, with a diagnostic accuracy of 85%. When analyzing the cut-off point that would give 100% sensitivity in the latter group, a value of 0.985 was found, but with lower specificity (38%).
The sensitivity and specificity of the currently used cut-off points (NFS ≥ -1.45 and FIB-4 ≥ 1.30) were also analyzed to discriminate between patients with fibrosis in our general sample and to separate the groups of patients with euglycemic/non-T2DM and IFG/T2DM. The results were compared to the proposed cut-off points, as shown in Table 3. Only two patients (0.8%) were excluded due to a technical failure in the RME caused by iron overload, a number too small to interfere with the results found. Data related to 60 excluded patients are in Supplementary Data.
Analysis between the sensitivity and specificity of the proposed cutoff points and those already used, separating the groups of patients euglycemic/non-T2DM and IFG/T2DM.
FIB-4, fibrosis-4 score; IFG, impaired fasting glycemia; NFS, non-alcoholic fatty liver disease fibrosis score; T2DM, type 2 diabetes mellitus
For the validation cohort group, 289 participants were recruited. However, two (0.7%) patients were excluded due to a technical failure in the MRE caused by iron overload and 26 (9.0%) patients were excluded due to the lack of laboratory test results for the calculation of scores. Thus, the final sample included a total of 261 (90.3%) participants in this cohort. Data are shown in Fig. 2. The two cohorts have similar characteristics, both in terms of age and body composition, comorbidities, as well as the results of laboratory and imaging tests (Table 4). When we compared the sensitivity and specificity of both NFS and FIB-4 cut-offs in the two cohorts, the results were similar (Table 5).

 NAFLD Fibrosis Score and (B) FIB-4 Score for predicting liver fibrosis")
 patients euglycemic/non-T2DM and (B) IFG/T2DM. IFG, impaired fasting glycemia; T2DM, type 2 diabetes mellitus")
 patients euglycemic/non-T2DM and (B) IFG/T2DM. IFG, impaired fasting glycemia; T2DM, type 2 diabetes mellitus")
Demographics of the included patients of training and validation cohorts.
| Variables* | Training Cohort N = 183 | Validation Cohort N= 261 | p - value |
|---|---|---|---|
| Age (years) | 52.9 ± 12.4 | 53.6 ± 12.4 | 0.649 |
| Gender | |||
| Female | 92 (50.3) | 126 (48.3) | 0.856 |
| Male | 91 (49.7) | 135 (51.7) | |
| Weight (kg) | 87.1 ± 15.9 | 85.7 ± 15.9 | 0.244 |
| Height (m) | 1.67 ± 0.10 | 1.68 ± 0,10 | 0.959 |
| BMI (kg/m2) | 31.1 ± 4.3 | 30.5 ± 4.3 | 0.237 |
| Waist circumference (cm) | 102.9 ± 13.1 | 101.9 ± 12.8 | 0.275 |
| Type 2 diabetes mellitus | 46 (25.1) | 57 (21.8) | 0.499 |
| Impaired fasting glycemia | 111 (60.7) | 139 (53.5) | 0.338 |
| Hypertension | 86 (47.0) | 122 (46.7) | 0.869 |
| Dyslipidemia | 89 (48.6) | 131 (50.2) | 0.960 |
| Obesity | 107 (58.8) | 140 (53.8) | 0.404 |
| Metabolic syndrome | 85 (46.4) | 121 (46.4) | 0.960 |
| Alcohol consumption | |||
| Yes | 79 (43.2) | 117 (44.8) | 0.910 |
| No | 104 (56.8) | 144 (55.2) | |
| Glucose (mg/dl) | 105.4 ± 17.0 | 104.5 ± 17.5 | 0.344 |
| AST (U/l) | 32 (24 - 47) | 31 (24 - 47) | 0.440 |
| ALT (U/l) | 44 (30 - 69) | 41 (28 - 67) | 0.283 |
| Platelet count (X 109/l) | 242 ± 66 | 236 ± 65 | 0.400 |
| Albumin (g/dl) | 4.58 ± 0.36 | 4.59 ± 0.34 | 0.940 |
| Triglycerides (mg/dl) | 153.5 (113 - 208.5) | 143 (101 - 200) | 0.111 |
| HDL | 49.5 ± 13.8 | 50.0 ± 13.8 | 0.810 |
| NFS | -1.31 (-2.44 to - 0.49) | -1.21 (-2.36 to -0.50) | 0.860 |
| FIB-4 | 1.10 (0.85 to 1.45) | 1.15 (0.86 to 1.52) | 0.445 |
| PDFF (%) | 13.0 (8.6 - 19.3) | 10.8 (6.0 – 17.6) | 0.002 |
| Steatosis grade | |||
| Grade 1 | 110 (60.1) | 127 (48.7) | < 0.001 |
| Grade 2 | 36 (19.7) | 40 (15.3) | |
| Grade 3 | 37 (20.2) | 41 (15.7) | |
| R2# | 47.3 ± 15.6 | 47.2 ± 17.4 | 0.535 |
| kPa | 2.3 ± 1.0 | 2.4 ± 1.0 | 0.974 |
| Fibrosis grade | |||
| F0 | 162 (88.5) | 226 (77.8) | 0.892 |
| F1-F2 | 8 (4.4) | 13 (5.0) | |
| F2-F3 | 3 (1.6) | 3 (1.1) | |
| F3-F4 | 1 (0.5) | 1 (0.4) | |
| F4 | 9 (4.9) | 13 (5.0) |
Values are means ± standard deviations (SD), medians (IQR), or counts (%), as appropriate. Type 2 diabetes mellitus is defined as the treatment of previously diagnosed diabetes mellitus with antidiabetic drugs; impaired fasting glycemia, defined as fasting blood glucose of 100 mg/dL; hypertension, defined as the treatment of previously diagnosed hypertension; dyslipidemia, defined as the treatment of previously diagnosed dyslipidemia; and obesity, defined as a BMI ≥ 30 kg/m2. ALT, alanine aminotransferase; AST, aspartate aminotransferase; BMI, body mass index; FIB-4, fibrosis-4 score; HDL, high-density lipoprotein; kPa, kilopascal; NFS, non-alcoholic fatty liver disease fibrosis score; PDFF, proton density fat fraction; R2#, MR relaxometry of the liver (hepatic iron content).
Analysis between the sensitivity and specificity of the proposed cutoff points and those already used in the general population for the training and validation cohorts.
FIB-4, fibrosis-4 score; NFS, non-alcoholic fatty liver disease fibrosis score.
There has been an increasing interest in clinical research to reduce reliance on liver biopsy for the assessment of NAFLD severity since its prevalence has risen remarkably worldwide. In this regard, new techniques with reliable and highly accurate cohort points that can be used instead of liver biopsy are of fundamental importance in real-life medical practice and in clinical trials. Data obtained will surely guarantee diagnostic accuracy, reliability, and responsiveness of treatment outcomes. In this study, we have described new cut-offs points for the main clinical scores that would allow us not only to discriminate the presence or absence of fibrosis in patients with this clinical condition but also to help refine the indication of MRE sequence and further determine liver fibrosis since there are still no studies on this specific topic. The new proposed cut-off (NFS ≥ -0.835 and FIB-4 ≥ 1.505) showed better specificity in discriminating liver fibrosis than the currently used cut-off, with great sensitivity, mainly when used concomitantly, with a diagnostic accuracy of 91%. An ideal non-invasive test for the assessment of liver fibrosis should be sensitive and specific; therefore, the new cut-offs are consistent with this purpose.
Liver biopsy remains the gold-standard method for distinguishing simple steatosis from non-alcoholic steatohepatitis (NASH), assessing fibrosis and staging the disease [14,23,24]. However, this technique has some limitations. It is an invasive, high-cost procedure, often associated with discomfort [23]. Considering that it is generally safe, there is a risk of complications. Additionally, sampling bias can also affect the diagnosis and staging of NAFLD [23]. Given these limitations, several non-invasive methods and markers are under constant development to detect the presence of steatosis and to correctly diagnose the stage of liver fibrosis, reducing the number of liver biopsies [7,11,15]. To date, most published studies on these clinical scoring systems have considered only advanced fibrosis compared to hepatic biopsy. Angulo et al. developed and validated a non-invasive scoring system using clinical and laboratory variables, demonstrating its effectiveness in differentiating NAFLD patients with and without advanced fibrosis [11]. The application of this score makes liver biopsy unnecessary to identify advanced fibrosis in a substantial proportion of patients [11]. Subsequently, simple clinical algorithms were developed and validated for the identification of patients at risk of advanced fibrosis to guide a more aggressive approach to the treatment of this population [25]. In this sense, several non-invasive scoring systems have been proposed to differentiate the NAFLD stages, promoting adequate patient monitoring [26–28]. In clinical practice, NFS and FIB-4 scores are complementary approaches in the evaluation of patients with NAFLD. The discrepancy between the results obtained is an indication of a liver biopsy. Although clinically useful, the results obtained from these clinical scores may be influenced by hepatic and extrahepatic conditions (e.g., age, comorbidities, and prevalence of fibrosis or NASH), which can lead to inaccurate estimates in small subsamples of patients [27,29]. In these cases, the diagnostic value of simple clinical scores is still debatable. Additionally, the population of Latin America is highly heterogeneous due to genetic background, and it is of fundamental importance to study possible singularities of the results of fibrosis tests in this population [27]. With technological advances, image-based, non-invasive biomarkers of disease severity in NAFLD are emerging as a central resource for contemporary clinical practice as well as for clinical trials [30]. Vibration-controlled transient elastography and MRE are two pioneering techniques in imaging exams [30]. Recently, it was reported that the MRE technique had a better diagnostic performance in the detection of fibrosis compared to the transient elastography (FibroScan) results and to simple scores in patients with NAFLD [31]. A systematic review and meta-analysis were performed to investigate the diagnostic performance of APRI, FIB-4, and BARD score, NFS, FibroScan (M probe and XL probe), shear wave elastography (SWE) and MRE to predict significant fibrosis, advanced fibrosis and cirrhosis in patients with NAFLD [17]. It has been shown that the MRE and SWE techniques have the highest diagnostic accuracy for staging fibrosis. Additionally, it was observed that among the four simple non-invasive indices, NFS and FIB-4 probably offer the best diagnostic performance for detecting advanced fibrosis [17]. Our suggestion to consider MRE from the early stages of fibrosis is valid, as MRE is an accurate method for detecting and staging fibrosis with excellent intra- and inter-observer agreement and offers the possibility of early treatment in MAFLD patients without the need to submit the patient to an invasive procedure with inherent risks, such as liver biopsy [9,10,12,20,21]. However, further studies are needed to compare the diagnostic accuracy of these non-invasive methods for staging liver fibrosis.
The liver is one of the main organs that control metabolic homeostasis. Metabolic diseases such as obesity, T2DM, dyslipidemia, and NAFLD are connected through molecular-biochemical and immune mechanisms [14,32]. Additionally, insulin resistance is known to be associated with the development of NAFLD [32]. Cross-sectional studies demonstrate that the presence of hepatic steatosis, independent of adiposity, is associated with impaired insulin action in the liver, skeletal muscle and adipose tissue in both lean individuals and non-diabetic individuals with obesity [33–35]. Therefore, impaired insulin action and the presence of T2DM are associated with steatosis, and both factors can be considered early predictors of metabolic disorders, particularly in normal patients [34]. In this context, our study sample was divided into two groups: euglycemic/non-T2DM group and IFG/T2DM group; once impaired fasting glycemia/T2DM showed an increased risk of hepatic fibrosis, as diabetes risk and T2DM are closely associated with the severity of NAFLD, progression to NASH, advanced fibrosis and its complications, such as HCC [34,36]. Furthermore, there are no studies aiming to define specific cut-off points in these groups of patients. For IFG/T2DM group, the proposed new cut-off points (NFS ≥ -0.360 and FIB-4 ≥ 1.49) had a considerable increase in specificity for both NFS and FIB-4 when compared to current cut-offs. The FIB-4 also showed much greater specificity in discriminating patients with fibrosis from the euglycemic/non-T2DM group. The new cut-off point (≥ 3.64) was higher than the one currently used to predict advanced fibrosis (≥ 2.67), with 100% diagnostic accuracy. Although this analysis is innovative, the different cohort points observed in this study between euglycemic/non- T2DM and IFG/ T2DM patients were somehow expected since T2DM is a risk factor associated with NAFLD and advanced fibrosis [37,38]. Although the use of non-invasive methods for the assessment of fibrosis in patients with diabetes is recommended, there is still uncertainty about their use. In fact, NAFLD itself can be different in diabetics and non-diabetics, as some articles suggest. Even from an anatomopathological point of view, there are differences between NAFLD with and without T2DM. Therefore, it is not surprising that they may have different cut-off points [37,39,40]. Studies carried out in Brazil and India showed a high histological prevalence of NASH in diabetics, ranging from 63% to 78% [41,42]. In a primary healthcare setting, diabetic patients were shown to have a prevalence of advanced fibrosis of 7.1%, as assessed by MRE [38]. This finding emphasizes the importance of early initiation of concurrent screening for NAFLD and advanced fibrosis in diabetics in order to reduce liver-related complications and mortality in diabetics [37,38]. However, further studies are needed to address these issues in patients with NAFLD-related risk factors, using different non-invasive clinical prediction models and imaging techniques to define the baseline and screening algorithm in this population.
The presence of hepatic steatosis and fibrosis are common features of non-invasive imaging tests for the NAFLD assessment [21,24]. Our results propose new cut-off points for the main clinical scores used in the initial assessment of fibrosis in NAFLD to discriminate between the absence or presence of liver fibrosis both for the general population and for patients with and without IFG/T2DM and to indicate the assessment of hepatic fibrosis in patients who could benefit from further investigations with MRE, which is the most accurate non-invasive method for this purpose, but still not widely available, mainly due to its high cost. It should be noted that at the population level, most patients with NAFLD have simple steatosis and will not progress to more advanced stages of the disease [24]. However, the presence of any stage of fibrosis, even in the absence of severe fibrosis (stages 3-4), compared to patients without fibrosis, has been shown to be associated with increased mortality or liver transplantation rates in NAFLD patients [43]. In this sense, early diagnosis and screening of fibrosis and steatosis before progression to severe fibrosis and/or NASH may benefit patients with NAFLD [21,24]. Additionally, models for the economic evaluation of risk stratification in patients with NAFLD are a recent area of interest for research [44,45]. Indeed, the application of risk-stratification pathways in NAFLD can reduce costs [45,46]. The use of MR as an adjunct to transient elastography has the potential to reduce the number of liver biopsies by 66% [47].
MAFLD is a novel concept proposed by an international consensus in 2020 [2]. The additionally identified group with MAFLD (but not NAFLD) is characterized by metabolic dysfunction with steatosis and includes the presence of secondary causes for steatosis, such as viral hepatitis and excessive alcohol consumption [2]. Therefore, the diagnostic criteria used for NAFLD are significantly different from those used for MAFLD. In this study, in the validation cohort, we followed the diagnostic criteria for MAFLD when we recruited participants with alcohol consumption due to the high frequency of its association with NAFLD and because current studies have shown an association of even moderate consumption of alcohol with worsening of the hepatic fibrosis measures [48]. The inclusion of this population in the validation cohort can be considered a limitation in this study. However, this allows the results to be applied in real-life, as the association of risk factors is common in this population. It should be highlighted that some studies have shown that people diagnosed with NAFLD and/or MAFLD have similar clinical profiles. However, the increase in liver-related mortality among NAFLD patients is driven by insulin resistance and among MAFLD patients, it is primarily driven by alcoholic liver disease [49,50]. Furthermore, the MAFLD definition showed a higher fibrosis burden when compared to the NAFLD group and was better at identifying the group with fatty liver and significant fibrosis assessed by non-invasive tests [48,51]. In this study, there were no significant differences in demographic, laboratory, and clinical parameters between the two cohorts.
Regarding the patients excluded for not having hepatic steatosis, almost 30% had recent ultrasonography suggesting steatosis. This makes us question the great variability of accuracy for detecting hepatic steatosis by ultrasound and its rate of false positives, including for patients with iron overload. Therefore, further studies are necessary to determine more objective diagnostic criteria in the absence of more accurate methods, which are not widely available in clinical practice [52]. Another reason for the absence of steatosis in these patients was that many had already started clinical treatment for metabolic syndrome and steatosis before the exam, in addition to those who had metabolic disorders with increased risk of obesity, IFG, but without criteria for steatosis on liver MR.
The present study has some strengths and limitations. The strengths of this study are the large number of prospectively recruited patients and the fact that all exams were performed in the same medical center with great experience in MRE, using the same device, and analyzed by the same radiologist. In addition, laboratory tests were performed at a reliable local laboratory. The diagnosis of NAFLD and the staging of fibrosis by liver biopsy, which were not confirmed, can be considered a limitation of the present study. However, the implementation of this technique was beyond the general objectives of this study. Another limitation is the subjective nature of the assessment of alcohol consumption. Due to some issues related to how the exams were held in the hospital, the Alcohol Use Disorders Identification Test was not applied. Since this was a single-center study in a highly specialized setting, the generalizability of its findings in other clinical settings is unknown. Finally, this study lacks data on intra- or inter-observer agreement, as a single radiologist performed the analysis. However, the inter- and intra-observer variability in the interpretation of liver biopsy results is well-known, particularly in the classification of intermediate stages of fibrosis [20,21]. In these situations, the biopsy sample should be reviewed by at least two pathologists, as this method is not applicable to clinical practice in most cases [20,21].
5ConclusionIn conclusion, the study has shown that NFS and FIB-4 are useful tools to guide the indication for further liver evaluation in NAFLD and/or MAFLD patients using MRE in the early stages of fibrosis. This study has also demonstrated new cut-off points with better specificity and great sensibility to discriminate between the absence or presence of hepatic fibrosis both for the general population and for those patients with and without IFG/T2DM. However, further studies are needed to validate these findings.
CRediT authorship contribution statementLouise Torres: Conceptualization, Methodology, Formal analysis, Investigation, Data curation, Writing – original draft, Writing – review & editing. Alice Schuch: Conceptualization, Methodology, Formal analysis, Investigation, Data curation, Writing – original draft, Writing – review & editing. Larisse Longo: Conceptualization, Methodology, Formal analysis, Investigation, Data curation, Writing – original draft, Writing – review & editing. Bruna Bressan Valentini: Methodology, Formal analysis, Writing – review & editing. Gabriela Schneider Galvão: Methodology, Formal analysis, Writing – review & editing. Eduardo Luchese: . Carlos Pinzon: . Rodrigo Bartels: Methodology, Formal analysis, Writing – review & editing. Mário Reis Álvares-da-Silva: Conceptualization, Methodology, Formal analysis, Investigation, Data curation, Writing – original draft, Writing – review & editing.
This study is financed by the Research and Events Fund from the Hospital de Clínicas de Porto Alegre (FIPE) and Coordination for the Improvement of Higher Education Personnel (CAPES/PROAP).


