


Sarcopenia is one of the most common complications of cirrhosis, associated with an increased risk of morbidity and mortality. It is therefore necessary to perform a proper nutritional evaluation in these patients. Although CT scans are the gold standard for diagnosing sarcopenia, they are not widely used in clinical practice. There is thus a need to find indirect methods for identifying sarcopenia in patients with cirrhosis.
Material and methodsThis is a cross-sectional study consecutively including all cirrhotic outpatients who underwent CT scans.
ResultsA total of 174 patients met all the inclusion criteria and none of exclusion criteria. Fifty-five patients (31.6%) showed sarcopenia on CT scans. Multivariate analysis revealed that the factors that were independently associated with the presence of sarcopenia on CT scans were: male sex (OR 11.27, 95% CI 3.53–35.95; p<0.001), lower body mass index (BMI) (OR 1.22, 95% CI 1.11–1.34; p<0.001) and lower phase angle by bioelectrical impedance analysis (OR 2.83, 95% CI 1.74–4.6; p<0.001). With the variables identified from the multivariate study we developed a nomogram that allows ruling out the presence of sarcopenia. Our model rules out sarcopenia with an area under the receiver operating characteristic curve value of 0.8. The cutoff point of the probability to rule out sarcopenia was 0.6 (sensitivity 85%, specificity 73%, Youden index 0.58, PPV 82.5% and NPV 91.3%).
ConclusionSince CT scans involve exposure to radiation and their availability is limited, we propose using this nomogram as an indirect method to rule out sarcopenia in cirrhotic patients.
Sarcopenia is one of the most common complications of cirrhosis, associated with an increased risk of morbidity and mortality. It is therefore necessary to perform a proper nutritional evaluation in these patients. Since CT scans present issues of radiation exposure and limited availability, we propose using this nomogram as an indirect method to rule out sarcopenia.
In the last decade there has been increasing interest in severe muscle wasting, or sarcopenia, as a complication of liver cirrhosis. It has been recognized as an important issue in patients with chronic liver disease, [1] affecting 22–62% of patients with liver cirrhosis. [2–5] Several studies have shown that sarcopenia in liver cirrhosis is associated with higher mortality and has an impact on surgical and post-transplantation outcomes regardless of MELD score. [6] Also, the major life-threatening complications of cirrhosis including ascites, spontaneous bacterial peritonitis, hepatic encephalopathy and hepatorenal syndrome have all been shown to be affected by sarcopenia. [1] The pathogenesis of sarcopenia is multifactorial, resulting from a combination of impaired dietary intake, malabsorption, altered macronutrient and micronutrient metabolism and low physical activity. [7] In addition, frequent fasting and external factors, such as alcohol and infections may further contribute to malnutrition in those patients.
The gold standard for assessing sarcopenia in cirrhotic patients is the computed tomography (CT) scan. [8] However, it is not widely used in clinical practice due to its substantial time consumption, high cost, exposure to high levels of ionizing radiation, and because it requires the assistance of specially trained radiographers. [9,10] So, despite the importance of nutritional status in patients with liver cirrhosis there are no rigorously validated screening tools available for such patients. [11]
Bioelectrical impedance analysis is innocuous and easy to use. In addition, it is operator-independent and less expensive than CT scan and magnetic resonance imaging. It examines the resistance (R) and reactance (Xc) of an electric current through body tissues and predicts values of fat-free mass, fat mass, and intracellular and extracellular water. Moreover, the phase angle (PhA) obtained from bioelectrical impedance is a nutritional marker that reflects the integrity of cellular membranes and cell water distribution, which in nutritional terms translates into muscle and fat mass. Therefore, PhA values below the cutoff established for a population are considered diagnostic for muscle/fat mass depletion and malnutrition and are not affected by fluid overload. [12,13]
Due to the importance of performing a proper nutritional evaluation in patients with liver cirrhosis, we aimed to study an accessible and easy-to-use tool for predicting sarcopenia in these patients. To achieve this purpose, we performed a cross-sectional study in which all cirrhotic outpatients who underwent CT scans and a complete anthropometric evaluation were consecutively included. Finally, we evaluated the factors that were independently associated with the presence of sarcopenia on CT scan.
2Materials and methods2.1Study design and patientsBetween 2016 and 2019 we performed this single-center study at the Puerta de Hierro University Hospital. This is a cross-sectional study in which patients with liver cirrhosis were consecutively included upon receiving CT scans. The design was based on STROBE guidelines (Supplementary material). In our center, cirrhotic patients who are unsuitable for ultrasound examination receive surveillance scans for focal liver lesions, hepatocellular carcinoma, vascular disease, and pre-transplant evaluation. Moreover, in the last few years all patients in our center have been proposed a complete nutritional assessment based on anthropometry together with an evaluation of body composition using bioelectrical impedance analysis.
The inclusion criteria were age 18–85 years, evidence of liver cirrhosis by clinical or histological methods and CT scan received within 2 months of the in-office assessment. Inclusion was not restricted by the cause of liver cirrhosis, but patients were required to have hepatitis B virus infection under control, have been cured of hepatitis C virus infection and have undergone alcohol withdrawal at least 6 months before inclusion. This last condition was specifically evaluated by means of a directed anamnesis and the AUDIT-C test.
Exclusion criteria were chronic kidney failure or being on hemodialysis; history of respiratory or cardiovascular disease; coinfection with human immunodeficiency virus; previous liver or kidney transplant; a history of malignancy requiring chemotherapy or radiotherapy; hepatocellular carcinoma outside the Milan criteria; having a transjugular intrahepatic portosystemic shunt (TIPS); and unwillingness to participate in the study. Patients with contraindications for bioelectrical impedance analysis (such as patients with cardiac pacemakers, amputated limbs, aneurysm prostheses, or metal implants) were also excluded.
2.2Data collectionAll patients underwent a complete anthropometric evaluation including bioelectrical impedance analysis (DC430PMA, Tanita, Amsterdam, The Netherlands), CT scan and blood tests (including testosterone levels in men). All measurements were performed at the hepatology clinic in a standardized manner, by the same investigator and after overnight fasting.
Comorbidities, liver cirrhosis etiology and history of previous liver decompensation were collected. To improve the accuracy of the measurements, patients were asked to empty their bladders before the measurements and were dressed in light clothing, with no footwear. For the bioelectrical impedance analysis, patients removed any metallic objects and other items that might interfere with the scan. PhA was calculated using the following equation: PhA = arc-tangent (reactance (Xc)/resistance (R)) x (180°/π). [14] Total and visceral adipose tissue were also measured by bioelectrical impedance analysis. TANITA offers a visceral fat scale in which a rating between 1 and 12 indicates a healthy level of visceral fat and a rating between 13 and 59 indicates an excessive level of visceral fat.
Body mass index (BMI) was calculated as body weight (kg)/height squared (m2). Patients were classified into 4 groups based on BMI: low weight (BMI<18.5 kg/m2), normal weight (18.5 to 25 kg/m2), overweight (25 to 30 kg/m2) and obese (>30 kg/m2). [15] Waist circumference (WC) was measured in centimeters mid-way between the lower costal margin and the iliac crest at the end of normal exhalation. The average of two measurements was used in the analyses.[16] Muscle-related measurements included mid-arm circumference (MAC), measured in the nondominant arm at the mid-point between the acromion and the olecranon. The average of 3 measurements of MAC and triceps skin fold (TSF) was used to calculate arm muscle area and arm fat area according to Gurney and Jelliffe. [17] Measured arm muscle area and arm fat area were compared with reference values to classify patients by percentiles. [18] Mid-arm muscle circumference (MAMC) defined using the following formula: MAMC = MAC - (TSF x 0.314) was classified by sex. [19] MAMC was considered decreased when <19 in women and <21 in men.
The skeletal muscle index (cm2/m2) was determined from images obtained by abdominal CT scan. The total cross-sectional area (cm2) of skeletal muscles at the level of the third lumbar vertebra (L3) was normalized by the height squared of the patient (m2). [1] The area was calculated on CT imaging by a trained operator, using image-analysis software (ImageJ v.1.48). Sarcopenia was diagnosed using previously reported cutoff points (<50 cm2/m2 in men and <39 cm2/m2 in women). [1]
2.3Statistical analysisFor descriptive statistics, quantitative data were described as mean and standard deviation (SD) or median and range where appropriate. Qualitative data were described in percentages and counts. For bivariate analysis, quantitative variables were compared using Student's t-test. Non-parametric tests were used when normality or equality of variances was not observed. Categorical variables were compared using the Chi-square test and Cochran-Armitage test for trend or Fisher's exact test. Correlations between quantitative variables were assessed using Pearson or Spearman rank correlations, as appropriate.
A multivariate logistic regression analysis was used to find predictors for sarcopenia. Only variables with p<0.05 in the univariate analysis were included in the multivariate analysis, using a backward stepwise selection. In the multivariate analysis, 1 variable was included for every 10 events. The models were standardized, and the odds ratios (OR) estimated. Area under receiver operating characteristic curves (AUROC) were also reported. A nomogram was then built to calculate the probability of ruling out sarcopenia. Youden's index (highest sum of specificity and sensitivity) was used to determine the optimal threshold for the model.
Statistical analyses were performed with STATA version 16 (Stata Corporation, College Station, Texas) and p<0.05 was considered statistically significant.
2.4Ethical statementWritten informed consent was obtained from each patient included in the study and the study protocol conforms to the ethical guidelines of the 1975 Declaration of Helsinki as reflected in a priori approval by the Ethics Committee of the Hospital Universitario Puerta de Hierro-Majadahonda (PI 11.17).
3Results3.1Patient characteristics and prevalence of sarcopeniaAll patients with liver cirrhosis assessed at the Hepatology Clinic between 2016 and 2019 were consecutively included. Of 329 patients evaluated, 174 met all the inclusion criteria and none of exclusion criteria (Figure 1). Of these 174 patients, 71.3% were male with a mean age of 63 years (SD 10.1). The most common cause of cirrhosis was chronic hepatitis C virus infection (42.5%), followed by alcoholic liver disease (39.1%) and non-alcoholic steatohepatitis (NASH) (9.8%). The mean MELD score was 10.5 (SD 3.6) and 68.4% of patients were classified as Child-Pugh A. General characteristics are presented in Table 1. Mean skeletal muscle index was 50.5 cm2/m2 (SD 10.1) and 55 patients (31.6%) had sarcopenia. Muscle mass measured by abdominal CT scan was lower in women than in men (43.6 vs. 53.3 cm2/m2; p<0.001), and women showed a higher percentage of total body fat than men (43.7% vs. 31.4%; p<0.001).

General characteristics of patients
HCV: hepatitis C virus; NASH: non-alcoholic steatohepatitis; MAMC: mid-arm muscle circumference.
Table 2 shows the univariate analysis of the comparison between patients with sarcopenia and patients with preserved muscle mass. Although the skeletal muscle index decreased with age (r=-0.24; p=0.002) (Figure 2), there were no significant differences in the mean age of the patients (65 vs. 62 years; p=0.151). Sarcopenia was more prevalent in men than in women (36.3% vs. 20%; p=0.036).
Univariate analysis of analytical data
| Sarcopenia (n=55) | Preserved muscle mass (n=119) | p | |
|---|---|---|---|
| Age (y), mean (SD) | 65 (12.1) | 62 (9) | 0.151 |
| Age ≥ 65 years, n (%) | 27 (49.1) | 39 (32.8) | 0.039 |
| Sex (male), n (%) | 45 (81.8) | 79 (66.4) | 0.036 |
| Etiology, n (%) | 0.204 | ||
| HCV | 21 (38.2) | 50 (42) | |
| Alcoholic liver disease | 24 (43.6) | 44 (37) | |
| NASH | 2 (3.6) | 15 (12.6) | |
| MELD, mean (SD) | 11.9 (4.1) | 9.8 (3.2) | <0.001 |
| Child-Pugh A/B/C (%) | 58.2/27.3/14.6 | 73.1/23.5/3.4 | 0.024* |
| Body mass index (kg/m2), mean (SD) | 26 (4.8) | 30.7 (4.6) | <0.001 |
| MAMC, mean (SD) | 23.9 (3.7) | 26.3 (3.9) | 0.002 |
| Waist circumference (cm), mean (SD) | 99.8 (14) | 107.4 (13) | <0.001 |
| Phase angle (°), mean (SD) | 3.2 (0.9) | 4.2 (1.3) | <0.001 |
| Total body fat (%), mean (SD) | 33.1 (6.7) | 36.9 (7.5) | 0.002 |
| Visceral fat, mean (SD) | 14.4 (4.6) | 15.6 (4.9) | 0.121 |
| Proteins (g/dL), mean (SD) | 7.5 (0.7) | 7.4 (0.7) | 0.143 |
| Albumin (g/dL), mean (SD) | 4 (0.6) | 4.1 (0.6) | 0.069 |
| Creatinine (mg/dl), mean (SD) | 0.9 (0.3) | 0.9 (0.3) | 0.516 |
| Bilirubin (mg/dl), mean (SD) | 2.5 (4.2) | 1.3 (1.2) | 0.006 |
| INR (R.N.), mean (SD) | 1.4 (0.5) | 1.3 (0.3) | 0.052 |
| Testosterone (males, n=118) (ng/dL), mean (SD) | 414.6 (255.7) | 468 (238.4) | 0.259 |
| Low levels of testosterone (men, n=118), n(%) | 15 (35.7) | 13 (17.3) | 0.025 |
 and age SMI: skeletal muscle index")
Sarcopenic patients had more severe liver disease, with MELD scores being higher in patients with sarcopenia than in patients with preserved muscle mass (11.9 vs. 9.8; p<0.001). Furthermore, Child-Pugh scores B and C were more frequent among patients with sarcopenia (27.3% vs. 23.5% and 14.6% vs. 3.4%, respectively; p=0.024, Cochran-Armitage for trend). However, there was a low negative correlation between skeletal muscle index and MELD and Child-Pugh scores (r=-0.212 and r=-0.211, respectively; p<0.001).
The relationship between lower BMI and the presence of sarcopenia was statistically significant (26 vs. 30.7 kg/m2; p<0.001). Only 3 patients (1.7%) had a BMI ≤18.5 kg/m2 and all of these patients were diagnosed with sarcopenia on abdominal CT scan (p<0.030). The distribution of the presence of sarcopenia based on BMI is shown in Figure 3. There was a statistically significant relationship between MAMC and the presence of sarcopenia (23.9 vs. 26.3; p=0.002). In addition, patients with decreased MAMC presented sarcopenia more frequently than patients with normal MAMC (14.8 vs. 3.4%; p=0.019). Patients with sarcopenia had lower WC than patients with preserved muscle mass (99.8 vs. 107.4 cm; p<0.001).
, 23 normal weight patients (65.7%), 18 overweight patients (31.6%) and 11 obese patients (13.9%); Chi-squared for trend, p<0.001. BMI: body mass index.")
Regarding bioelectrical impedance analysis, patients with sarcopenia had a lower PhA than patients with preserved muscle mass (3.2° vs. 4.2°; p<0.001). When considering only patients with edema and/or ascites (n=43), PhA was still lower in patients with sarcopenia (2.3° vs. 3.4°; p=0.055). We found a positive correlation between skeletal muscle index and PhA regardless of the presence of ascites (r=0.57 for all, r=0.57 without ascites, r=0.46 with ascites; all p<0.001). Patients with sarcopenia had a lower percentage of total body fat than patients with preserved muscle mass (33.1% vs. 36.9%; p=0.002).
Regarding analytical data, patients with sarcopenia had lower albumin levels than patients without sarcopenia, although the difference was not statistically significant (4 vs. 4.1 g/dL; p=0.069). Furthermore, patients with sarcopenia presented higher levels of bilirubin (2.5 vs. 1.3 mg/dl; p=0.006). Finally, men with low testosterone levels presented sarcopenia more frequently (35.7% vs. 17.3%; p=0.025).
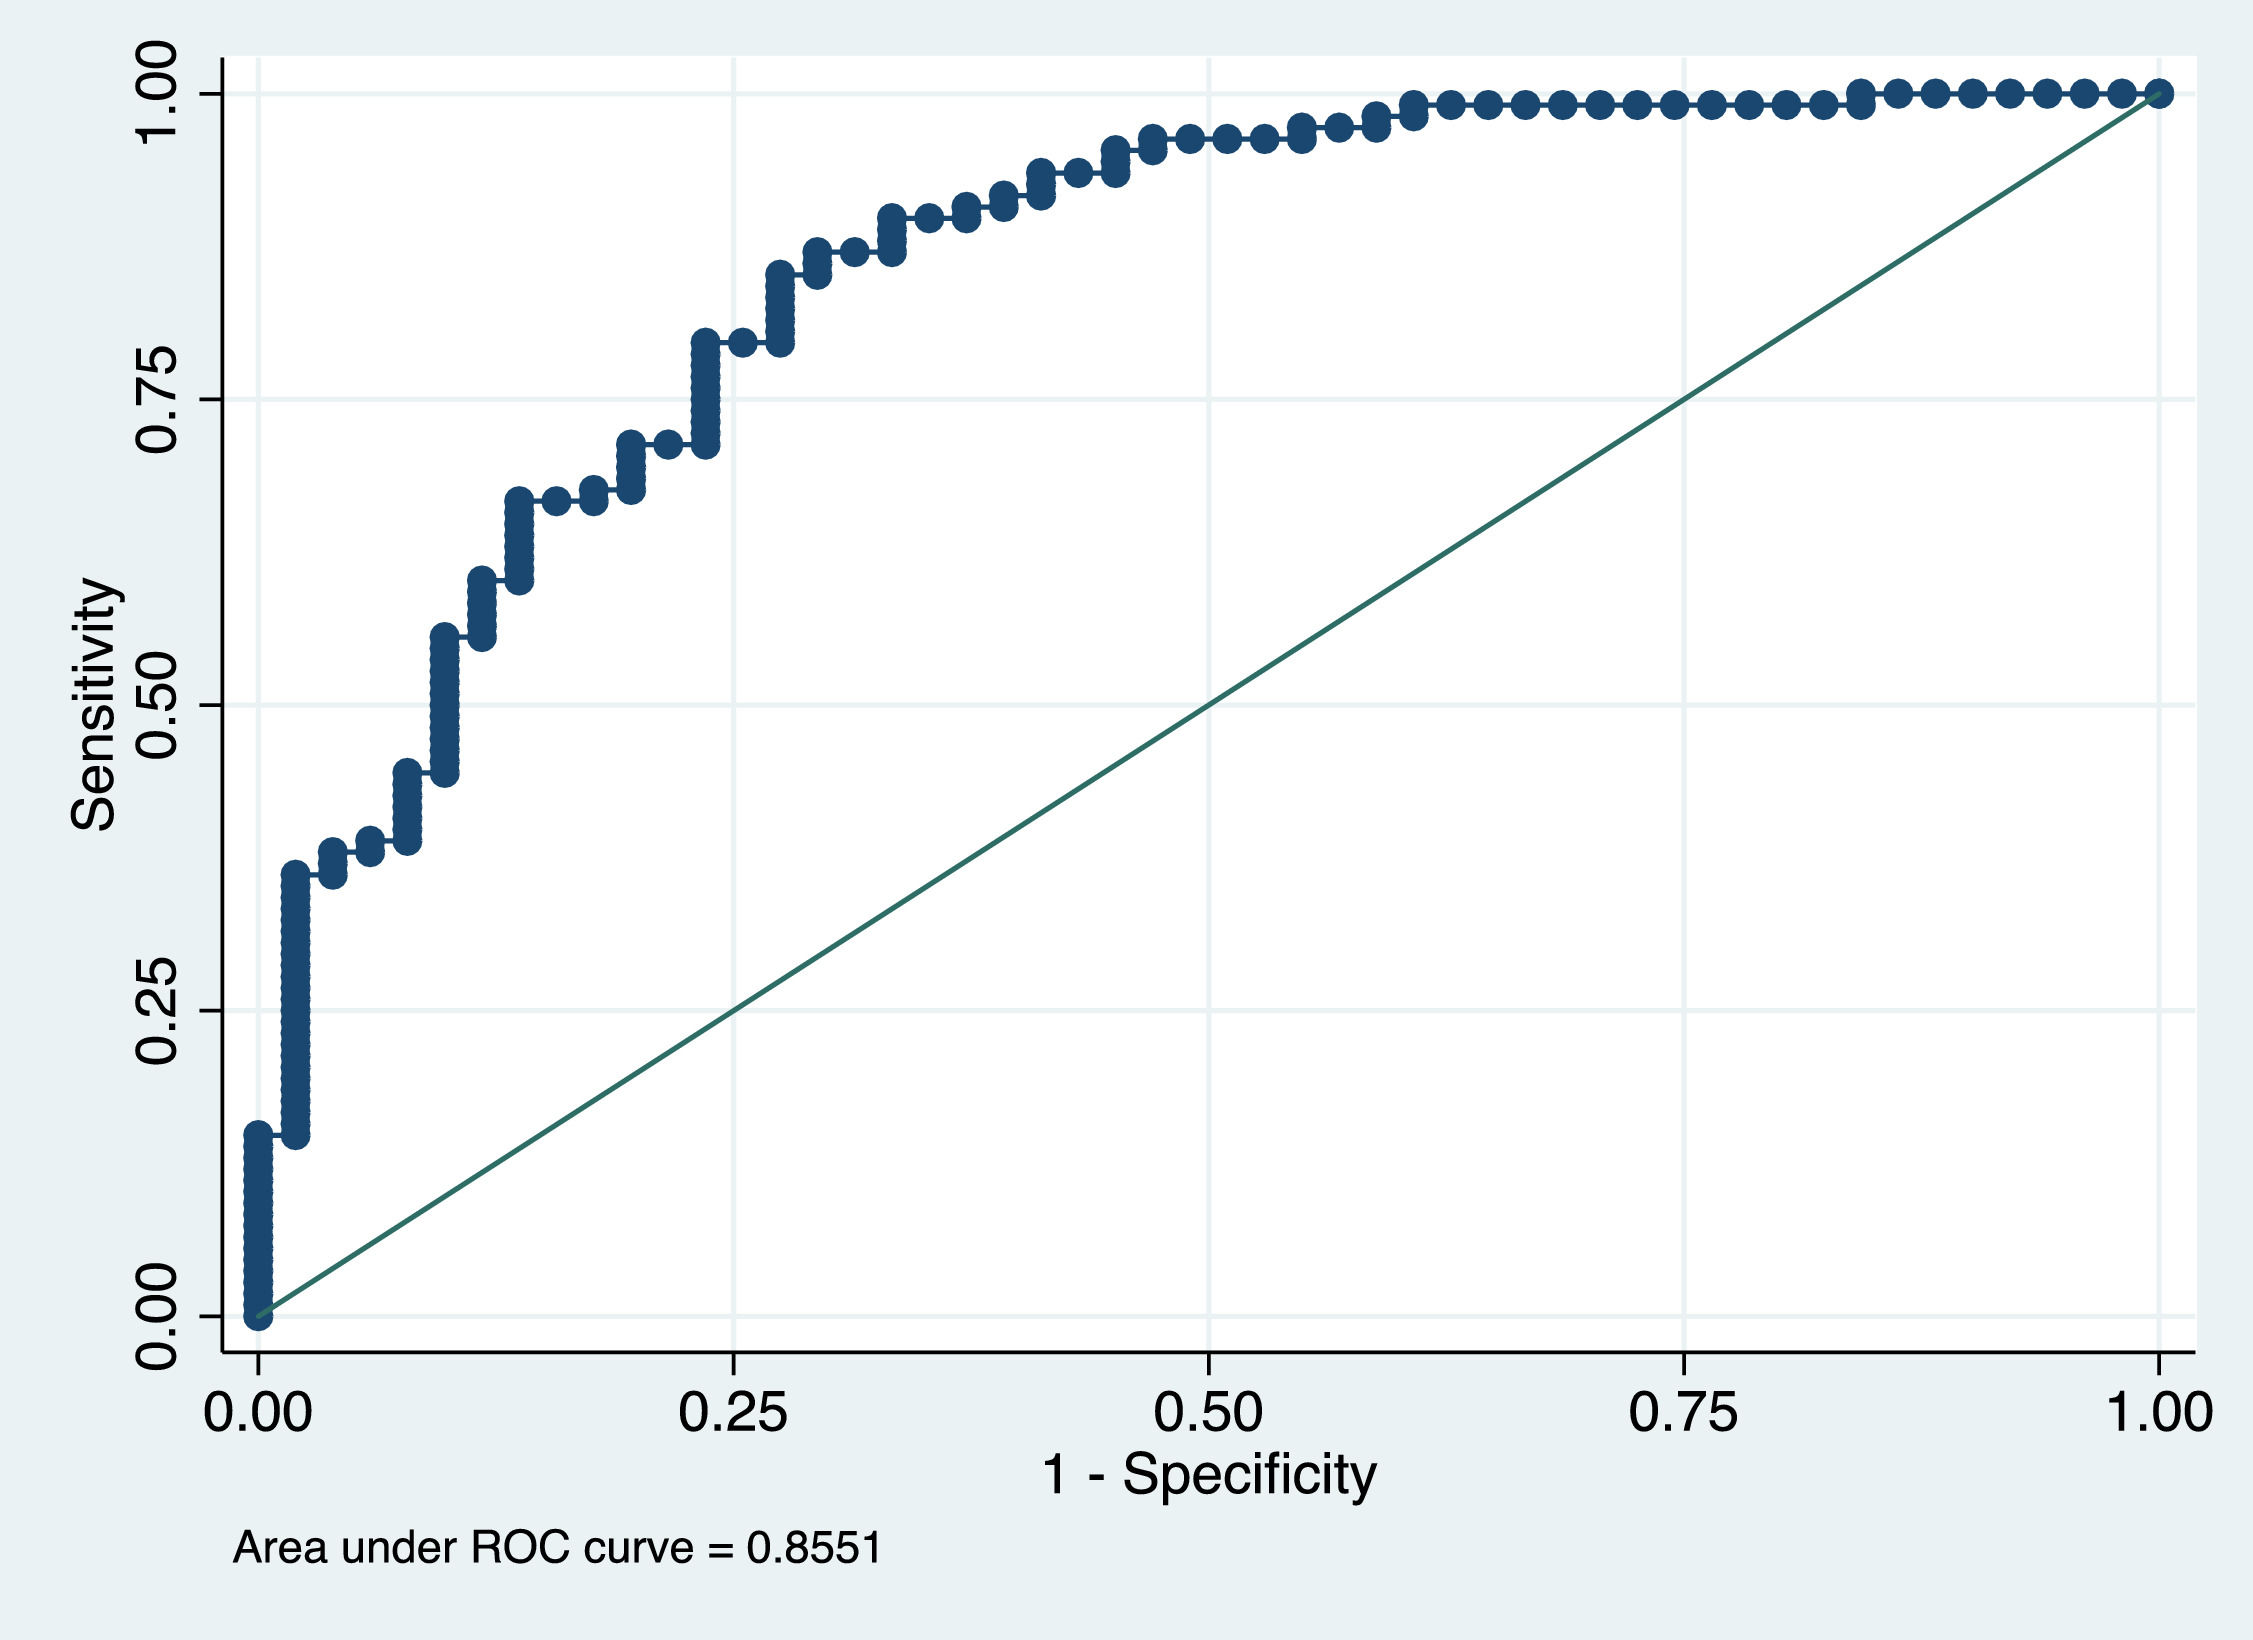
Factors that were independently associated with the presence of sarcopenia on CT scan were male sex, decreased BMI and lower PhA (Table 3). The AUROC curve of this model was 0.86 (Figure 4).
Multivariate regression analysis to rule out the presence of sarcopenia
The variables for the multivariate regression analysis were selected by backward elimination. For this we included all variables with p<0.05 in the univariate analysis (sex, Child-Pugh score, BMI, PhA, MAMC and WC). MELD score was not included because we were already using the Child-Pugh score, which includes bilirubin (variable with p<0.05). Percentage of total body fat was not included, since PhA was the bioimpedanciometry value that was best associated with the presence of malnutrition.

Using the variables identified from the multivariate logistic regression analysis we created a nomogram that allowed us to estimate the probability of ruling out the presence of sarcopenia in individual patients (Figure 5). The probability cutoff point to rule out sarcopenia was 0.6 (Table 4), with a sensitivity of 85% and a specificity of 73% (Youden index 0.58). Although 8.8% of patients with sarcopenia on abdominal CT were not detected using the proposed nomogram, 81.13% of patients were correctly classified and 57.9% of abdominal CT scans could have been avoided.

CT scans are the main method used to assess sarcopenia, given their wide availability as they are frequently performed for clinical purposes. However, there are some drawbacks when used specifically for body composition assessment, such as the fact that one must rely on incidental scans to obtain nutritional data, the need for specialized software and a trained technician not available in every center, as well as repeated exposure to radiation. Therefore, due to the high prevalence of sarcopenia, we designed a single-center study aimed to evaluate the clinical factors associated with the presence of sarcopenia by CT scan, and to build a simpler method capable of excluding the presence sarcopenia in outpatients with liver cirrhosis.
The prevalence of sarcopenia in our study was 31.6%, similar to previous studies in which imaging tests were used as a diagnostic method. [20] As the population ages, this contributes to the progressive worsening of sarcopenia. In our study, the skeletal muscle index decreased with age (r=-0.24; p=0.002). Nevertheless, there was no association between age and sarcopenia (p=0.151). This study confirmed the significant difference in the prevalence of sarcopenia between males and females (81.8% vs. 66.4%; p=0.036). The large difference between men and women with sarcopenia confirms results from previous work. [20] One explanation for these findings is based on testosterone promoting muscularity in males. [21,22] As in previous studies, in our study, men with low testosterone levels were diagnosed with sarcopenia more frequently than men with normal testosterone levels (35.7% vs. 17.3%; p=0.025). Another explanation is that women have greater adipose tissue stores (43.7% vs. 31.4% of total body fat; p<0.001) and can draw from these longer before developing sarcopenia. [23] On the other hand, in our study the presence of sarcopenia was not associated with the cause of liver cirrhosis (p=0.204). [24,25] This lack of association is probably due to the Mediterranean diet followed by these patients and that the patients had abstained from alcohol for at least 6 months at the time of the study.
It is known that skeletal muscle loss in cirrhosis worsens with the progression of liver disease. [26,27] Our study shows that sarcopenic patients had more severe liver disease. Patients with sarcopenia had higher MELD scores (11.9 vs. 9.8; p<0.001) and Child-Pugh scores B and C were also more frequent among patients with sarcopenia (27.3% vs. 23.5% and 14.6% vs. 3.4%, respectively; p=0.024). However, the correlations between skeletal muscle index and MELD/Child-Pugh scores were low (r=-0.212/r=-0.211, respectively; p<0.001).
Regarding anthropometric measures, patients with sarcopenia had lower WC and MAMC than patients with preserved muscle mass (99.8 vs. 107.4 cm and 23.9 vs.26.3, respectively; p<0.05). In our study we found that even though the BMI was lower in cirrhotic patients with sarcopenia (26 vs. 30.7 kg/m2; p<0.001), sarcopenia was not exclusively present in underweight patients and constitutes a hidden condition that can be present in cirrhotic patients with any BMI (Figure 3). Nevertheless, underweight patients (<18.5 kg/m2) should be considered at high risk of sarcopenia. [28] In our study all underweight patients (n=3) had sarcopenia.
Bioelectrical impedance analysis is an easy and reproducible method that has been used in clinical settings to quantify body composition in liver cirrhosis and can be repeated without concern for exposure to radiation. As in previous studies, patients with sarcopenia had a lower PhA than patients with preserved muscle mass (3.2° vs. 4.2°; p<0.001). [29–31] A main advantage of the use of PhA is that it can be applied even under unstable tissue hydration conditions, such as edema and/or ascites. [13,32] Therefore, in our study we analyzed the association between PhA and muscle mass including only patients with hydropic decompensation (n=43), finding that positive correlation between sarcopenia and PhA persisted regardless of the presence of ascites (p=0.055). Regarding body composition, patients with sarcopenia had lower percentages of total body fat than patients with preserved muscle mass (33.1% vs. 36.9%; p<0.001).
Regarding analytical data, there was a trend for lower albumin levels in patients with sarcopenia (4 vs. 4.1 g/dL; p=0.069). Because liver cirrhosis confounds the common measures of nutrition status, such as prothrombin time, albumin or transferrin, their utility in these patients is limited. [33] Therefore, since it is a measure of liver function, these findings are consistent with the association between albumin levels and MELD and Child-Pugh scores.
In the multivariate analysis, factors that were independently associated with the presence of sarcopenia on CT scan were male sex, decreased BMI and lower PhA. The AUROC curve of this model was 0.86 (Figure 5). These data correlate with recent studies conducted in cirrhotic patients on the waiting list for liver transplantation. [34] Mauro E. et al, [34] showed that the independent factors associated with the presence of sarcopenia were male sex, BMI, Child Pugh and the ratio creatinine/Cystatin C. In addition, Luengpradidgun L. et al, [35] showed that bioelectrical impedance analysis alone does not seem useful in screening these patients for sarcopenia.
Although CT scans allow precise quantification of muscle mass, [36] it is important to recognize that the high cost, the possible limited access to the equipment and concerns in terms of radiation exposure may limit the use of this technique for routine clinical practice. And because muscle mass and nutritional status are dynamic measures that can change very quickly, easily repeatable and reproducible assessments are required to track changes over time in clinical practice. This is why we have developed a nomogram based on sex, BMI and PhA as the easiest and most reliable way to begin sarcopenia case finding or screening in clinical practice (Figure 5). The cut-off point that rules out sarcopenia is a probability ≥ 0.6 (with a sensitivity of 85%, a specificity of 73% and a NPV of 91.3%), so the use of this nomogram correctly classifies 81.13% of patients and would allow monitoring changes over time in skeletal muscle mass in patients with liver cirrhosis.
It should be noted that of our cohort, 93% had Child-Pugh with disease severity A or B and only 24.7% had ascites or edema. Because muscle wasting and malnutrition are often clinically evident in Child-Pugh C patients and therefore may not require specialized testing for diagnosis, it is likely that bedside tools will have the most diagnostic relevance in Child-Pugh A and B patients.
The limitations of this study are that patients were from a single-third level referral center, so applicability to the general population could be limited, therefore further studies are needed to validate these results. On the other hand, there may be a selection bias, since the selection of patients with CT scans were performed according to clinical criteria.
5ConclusionsOur study confirms the high prevalence rate of sarcopenia in outpatients with liver cirrhosis. Numerous indirect methods have been used to quantify muscle wasting in cirrhotic patients; however, most of these methods either lack availability and/or their accuracy may be limited in the presence of fluid retention. Therefore cost, availability and ease of use can determine whether the techniques are better suited to clinical practice. The proposed nomogram thus constitutes a good resource for accessible identification of sarcopenia, which can be repeated without harm to patients.
Author's contribution- -
Marta Hernández-Conde: data analysis and interpretation, acquisition of data, statistical analysis and interpretation of data; manuscript preparation.
- -
Elba Llop: Study concept and design, acquisition of data, statistical analysis and interpretation of data; manuscript preparation.
- -
Lucía Gómez-Pimpollo and Enrique Van Den Brule: calculation of the area on abdominal CT scan.
- -
Santiago Blanco, Carlos Fernández Carrillo, Luis Rodríguez; Christie Perelló; Marta López-Gómez; José Luis Martínez-Porras; Natalia Fernández-Puga: data acquisition
- -
Ana Royuela: data analysis.
- -
José Luis Calleja Panero: concept and design, data analysis and interpretation; manuscript preparation; final drafting of the manuscript; study supervision.
All authors read and approved the final manuscript.
FundingThis research did not receive any specific grant from funding agencies in the public, commercial, or not-for-profit sectors.
Declaration of interestNone


