


In the normal practice of medicine a great deal of information is handled, an example of this is medical records. The first problem that the medical professional is faced with is that he/she has a large quantity of information, without necessarily knowing how best to summarise it. Thus, it is at this point of the epidemiological research that Statistics comes in. Statistics is a discipline which uses mathematical resources to organise and summarise a great deal of data obtained from reality, and infer conclusions with regard to such data.
With this series of articles we seek to introduce the clinician to the first steps in the use and handling of numerical data: to distinguish and classify the study variables, to show how to organise and tabulate the measurements obtained by means of the construction of frequency tables, to produce an image that can show results etc, graphically. All these mathematical concepts will be accompanied by practical examples in the field of allergology.
BASIC DEFINITIONSIndividuals or elements are those persons or objects which contain certain information that we wish to study; Population is the set of individuals or elements which meet certain common properties and Sample is a representative subset of a population. So that the sample represents the population, each and every one of the individuals of the population must have the opportunity to be considered for participation in the sample. For example: we wish to study the prevalence of atopy to house dust mites in children from 3 to 5 years of age in the Municipality of Murcia. Thus, the study population is formed by preschool age children in the municipality of Murcia, and from this population a representative sample will be extracted.
Variable is a characteristic or property of interest in the individuals or elements which form our population. For example, of the patients in an allergy clinic, one can study the number of patients allergic to house dust mites, how many have a family history of allergy, etc.
Depending on the characteristic to be studied, several types of variables can be distinguished:
- –
Qualitative Variable: is that characteristic which cannot be expressed in numbers and must be expressed in words. For example, gender or place of residence.
- –
Quantitative Variable: is any characteristic which can be expressed in numbers. For example, the number of siblings or height. Within this variable we can distinguish two types:
- a)
Discrete quantitative variable, this can only have a finite number of values. For example, the number of siblings.
- b)
Continual quantitative variable, this can take any value within a real interval. For example, the value FEV1.
- a)
Research work consists of a process in several phases, in this article we shall look at the conceptual and the design phases, with special emphasis on the latter.
Conceptual phase: this consists in thinking, commenting and discussing ideas that can constitute themes for research. In this phase the objective or objectives of the study are set out. A bibliographical review should be undertaken, in which a search will be made for studies published related to the research theme chosen. These steps will lead to the elaboration of a hypothesis, which can be defined as a prediction of the study's results.
The design and planning phase: in this phase the study population should be identified, and a sampling plan should be chosen which is appropriate to the variables to be studied.
SAMPLINGSampling1 is a tool used in scientific research. Its basic function is to determine which part of a reality being studied (population) should be examined, with the purpose of making inferences (deduce properties) on said population. The error made due to the fact that conclusions are obtained on this certain reality from the observation of only a part of it, is known as the sampling error.
Different reasons exist for studying samples rather than populations, one of which is that in the majority of occasions, the study of the whole population is not possible; another motive is that samples can be obtained more rapidly than populations, and speed can be an important factor when researching into the health of people. A further important limitation when carrying out a study is the budget available, and studying a sample is certainly a cheaper option.
Before considering the number of individuals required to constitute the sample, it is necessary to clearly define the characteristics that the subjects who will form it must possess, thus the inclusión and exclusión criteria must be defined, as well as the scope of the study population. The inclusion criteria are those characteristics which define the relevant population for the question to be investigated. If what one wishes to study are the risk factors for atopy in 3–4 year-old children, inclusion factors would be: to be atopic and to be within the age range. The exclusion criteria indicate subsets of individuals who fulfil the selection criteria but, because a high probability of dropout exists during the monitoring, or due to ethical barriers, these can interfere in the quality or in the interpretation of the data.
The two main options when selecting the study population are the patients of medical centres- hospitals or health centres- or from the general population. The patients of medical centres are easier to gather, but the factors which make subjects attend that centre can produce an undesirable selection, although there are occasions in which the ideal study population is precisely the hospital population, since there are ill people who can only be found in hospitals.
The other main option is to focus on the general population in their own homes. In the case of children, the ideal place is at school, considering the fact that in developed countries practically 100 % are in school. This type of sample usually produces greater working costs and has more participation problems.
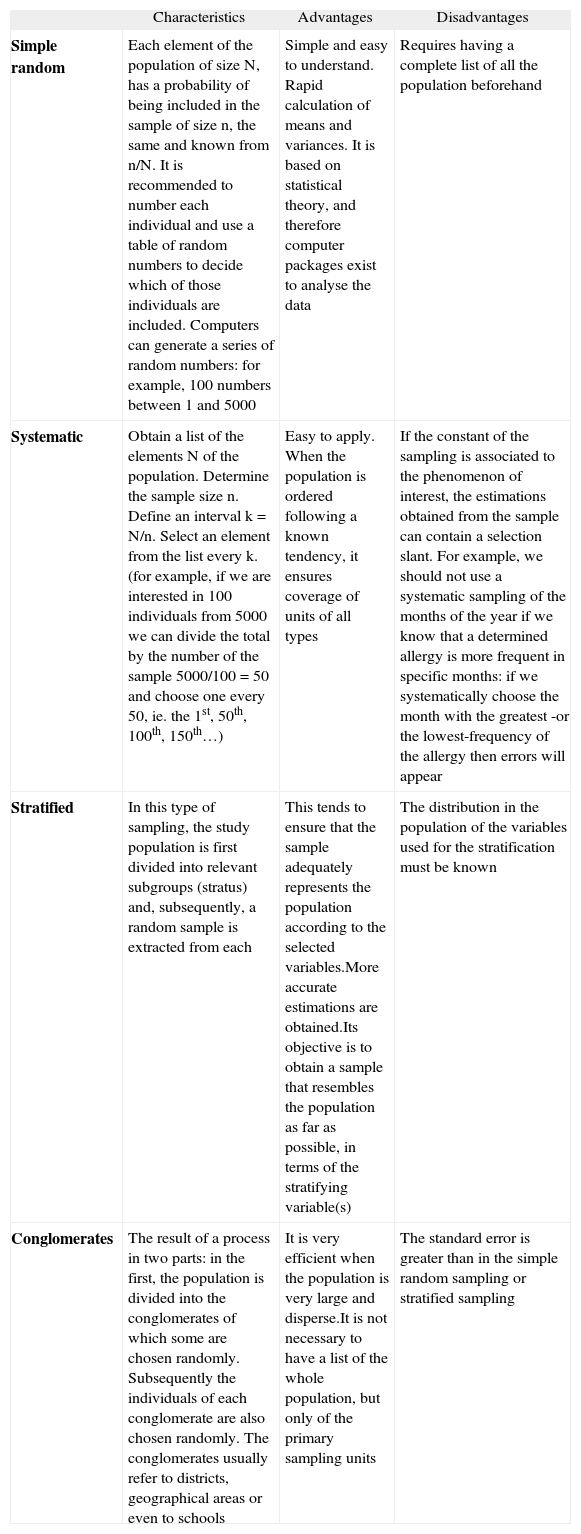
Different sampling methods exist and these can be seen in Table I.
Types of Sampling
| Characteristics | Advantages | Disadvantages | |
| Simple random | Each element of the population of size N, has a probability of being included in the sample of size n, the same and known from n/N. It is recommended to number each individual and use a table of random numbers to decide which of those individuals are included. Computers can generate a series of random numbers: for example, 100 numbers between 1 and 5000 | Simple and easy to understand. Rapid calculation of means and variances. It is based on statistical theory, and therefore computer packages exist to analyse the data | Requires having a complete list of all the population beforehand |
| Systematic | Obtain a list of the elements N of the population. Determine the sample size n. Define an interval k = N/n. Select an element from the list every k. (for example, if we are interested in 100 individuals from 5000 we can divide the total by the number of the sample 5000/100 = 50 and choose one every 50, ie. the 1st, 50th, 100th, 150th…) | Easy to apply. When the population is ordered following a known tendency, it ensures coverage of units of all types | If the constant of the sampling is associated to the phenomenon of interest, the estimations obtained from the sample can contain a selection slant. For example, we should not use a systematic sampling of the months of the year if we know that a determined allergy is more frequent in specific months: if we systematically choose the month with the greatest -or the lowest-frequency of the allergy then errors will appear |
| Stratified | In this type of sampling, the study population is first divided into relevant subgroups (stratus) and, subsequently, a random sample is extracted from each | This tends to ensure that the sample adequately represents the population according to the selected variables.More accurate estimations are obtained.Its objective is to obtain a sample that resembles the population as far as possible, in terms of the stratifying variable(s) | The distribution in the population of the variables used for the stratification must be known |
| Conglomerates | The result of a process in two parts: in the first, the population is divided into the conglomerates of which some are chosen randomly. Subsequently the individuals of each conglomerate are also chosen randomly. The conglomerates usually refer to districts, geographical areas or even to schools | It is very efficient when the population is very large and disperse.It is not necessary to have a list of the whole population, but only of the primary sampling units | The standard error is greater than in the simple random sampling or stratified sampling |
Each study has an ideal sample size2,3, which enables us to check what we wish to check with the safety and accuracy set by the researcher. Thus it is necessary to establish a good study hypothesis based on the research question.
Steps to follow:
- –
Select the statistical test according to the parameter to be estimated, proportion, mean average, or according to a hypothesis contrast, comparison of mean averages, comparison of proportions.
- –
For the contrast of hypothesis the null hypothesis should be posed (in which it is stated that no differences exist or that there is no association between the study variables) and the alternative hypothesis (this is the working hypothesis to be demonstrated by rejecting the null hypothesis)
- –
Estimate the parameter and its variability. If these are already known, previous data should be used, from pilot studies, studies by other researchers or to use in the case of estimating prevalence, 50 % as the worst estimation (which maximises the sample size).
- –
Establish the maximum acceptable error or accuracy. This is the difference between a statistic and its corresponding parameter, gives a clear notion of how far and with what probability an estimation based on a sample ranges from the value that would have been obtained by means of a complete census.
- –
Specify appropriate values for α and β.
- a)
Potency or power (1 – β): Probability of not committing a type II error, β error, that is to say, conclude that there is no difference between two variables or there is no association between them, when in reality there is. Ideally β is small and 1 – β large. The most commonly used values for β are 10 % and 20%.
- b)
Confidence level (α): Probability of committing a type I error, which is to reject the null hypothesis when it is true, habitually a value of 0.05 or 0.01 is used; or expressed differently (1 – α) × 100 = 95 % or 99% (complementan/ probability to the admitted error α).
- a)
Planning the size of the sample has the purpose of choosing a sufficient number of individuals in order to maintain α and β at an acceptably low level, without the study becoming too costly or difficult.
If the size of the sample n is increased, the quality of the estimation can be improved either by increasing the accuracy (decreasing the amplitude of the interval) or by increasing the safety (decreasing the error admitted, α and β)
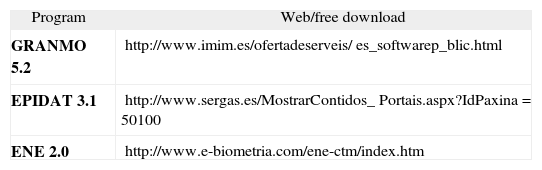
The objective of this article is not to provide formulas, which can be found in any book on sampling, but to establish the steps to follow to be able to do the different statistical calculations to carry out research. To that end, in Table II links are provided to free software, easily accessible on the Internet, to calculate the sample size. Below we provide a step by step example with the program GRANMO 5.2 (Figs. 1–4).


One seeks to see if there are differences between the mean value in the concentration of specific IgE in blood, between a group monosensitised to parietaria and another group monosensitised to house dust mites. To determine the sample size of the study, in Figure 2 the option Means is chosen from the menu bar. As can be seen in Figure 3, a drop down menu appears with different options, for our example the option of independent means is chosen, since we seek to compare a group of people allergic to house mites and another allergic to parietaria. Figure 4 shows the screen where all the necessary parameters for the sample calculation must be entered. A type I (α) error must be chosen as well as a type II (β) error, and a contrast type. The contrast type may be one-sided, that is to say the alternative hypothesis says that the mean in one group is greater than in the other, or vice versa, or two-sided (the most commonly used contrast), that the alternative hypothesis says that the means are different for the two groups. By default a value of 0.05 is selected for type I error; and 0.20 for type II error; and the two-sided contrast type. The box Reason, is the proportion of subjects between the two groups, if as in the example we want to have the same number of individuals in both groups we will write 1. It is necessary to know a standard deviation, for that the results of previous studies or of a pilot study can be used. The minimum difference to detect will be determined by the researcher. It is interesting to take into account in the size of the sample a possible proportion of dropouts, the greater that proportion is the greater the resulting sample size will be. Once all the boxes have been filled, click on the calculator button, and the result will appear in the box below; this can be saved or printed. The result is that accepting an alpha risk of 0.05 and a beta risk of 0.20 in a two-sided contrast, 371 subjects are required in the first group and 371 in the second in order to detect a difference equal to or greater than 0.9 units. A dropout rate of 1 % has been estimated.
For further detailed information on methodology consult the bibliography proposed.
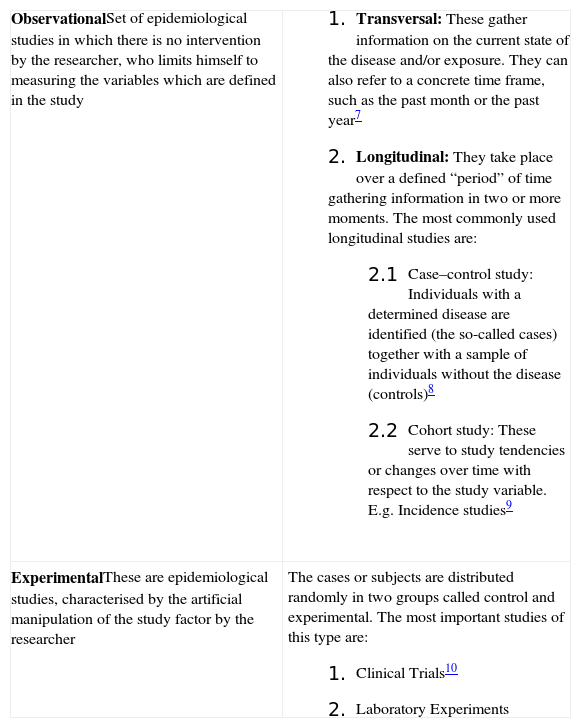
DESIGNSDepending what one seeks to investigate, and to a great extent, depending on the resources available to carry out the research, one type of study or another should be chosen. Table III explains the most commonly used studies4,5.
Types of study
| ObservationalSet of epidemiological studies in which there is no intervention by the researcher, who limits himself to measuring the variables which are defined in the study |
|
| ExperimentalThese are epidemiological studies, characterised by the artificial manipulation of the study factor by the researcher | The cases or subjects are distributed randomly in two groups called control and experimental. The most important studies of this type are:
|
When the researcher begins to design the questionnaire to gather data, there are several points to bear in mind to ensure that the information obtained is of good quality and is useful for the statistical processing which will subsequently be carried out:
- 1.
Types of questionnaires: telephone, self-administered, by letter, and in person by means of a surveyor. Self-administered and postal surveys are the cheapest as they do not require an interviewer. This method also favours anonymity, which increases the probability of obtaining true responses. Surveys that require an interviewer make a study more expensive, but the advantage of interviewers is that they minimise errors in the filling out of the questionnaires.
- 2.
Depending on the ethical implications of the content of the questionnaire, it may be necessary to attach an informed consent form. In Spain this informed consent is regulated by the Law 41/2002, of 14 November6.
- 3.
Special attention should be paid when formulating the questions; these can have open answers or closed answers. In open answer questions, sufficient space must be left for the interviewee to be able to write all he/she deems necessary. The problem arises in the subsequent processing of these responses, since it is difficult to summarise this information, a example is in the case of opinion questions, their use should be limited to research with a small sample size or to investigation in which the researcher has considerable time and resources available. Closed answer questions are the most frequently used since having standardised answers, that is to say by giving different options, it proves easy to summarise the information obtained, as for example:
Number of wheezing episodes in the past month,
- ¿
None
- ¿
One
- ¿
Two-three
- ¿
More than three
- ¿
- 4.
An identification number should be assigned to each questionnaire; this number should also appear in the data-base, to make it possible to check possible incoherencies in the data treatment phase.
- 5.
The first block of the questionnaire can be used for demographic data, such as name, if the questionnaire is not anonymous, age, place of birth, gender, address and telephone number (should one wish to contact the candidate to repeat the questionnaire). The following block is the “core questionnaire” where the relevant questions for the study hypothesis will be, and the rest of the questions that we wish to include as a complement will follow. The above is one way to structure a questionnaire, but is by no means the only way.
- 6.
The questionnaire must be designed taking into account the person who will answer it. If the questionnaire passes through an interviewer, that person should be instructed to ensure that he/she does not help the interviewee, since such help might influence the person's answers. Vocabulary used in the questionnaire must be chosen very carefully, so that it can be clearly understood.
- 7.
When designing a questionnaire the temptation exists to ask too many things, since as such an effort is being made and because of the cost, the best thing would be to ask about everything. It should not be forgotten that the sample size is calculated to estimate one concrete parameter in a determined population, for example: to see if there are differences in the mean in the FEV1 in asthmatics and non-asthmatics. In the questionnaire the variable ethnic group is also included, and later in the analysis process it is decided that it is interesting to see if there are differences as regards race, yet as in the sample design the distribution by race in the population has not been considered, it should not be forgotten that the results obtained for this will not be representative. A further reason for not including too many questions in the questionnaire is due to the length. If it is very long then it is possible that the interviewee refuses to participate in the study.
- 8.
Parallel to the questionnaire it is necessary to write a codification manual, which will be necessary for creating the data base. For example the possible answers shown in point 2 could be codified as follows:
None = 0
One = 1
Two-three = 2
More than three = 3
Missing = 9
In conclusion, in order to obtain good results at the end of the research it is vital to carry out correct planning of the work at the beginning: generate a good working hypothesis, define the study population well and extract a representative sample of this, taking into account the parameter or parameters to be estimated. At the same time a questionnaire must be designed which gathers all the information required and is adapted to the individuals to whom it is directed, thus it must be easily understood and not excessively long.
