


Satisfaction with life is a measure of protection in older adults. There lies the importance of providing quality instruments. The aim of the study was to evaluate the invariance of the life satisfaction scale (SWLS) in two samples of older adults in Spain and Peru.
MethodThe participants were 857 older adults in Spain (mean age=68.23 years, SD=5.93) and 336 older adults in Peru (average age=72.42, SD=7.07). All multi-group confirmatory factor analyzes were estimated in Mplus 8.0.
ResultsThe results indicate the presence of a strict invariance of the one-dimensional structure of the SWLS in samples of older adults in Spain and Peru, which allows for meaningful comparisons of latent means and covariances. Comparison of latent means showed small differences in the construct between the cultural groups.
ConclusionsThe SWLS is a valid instrument for intercultural comparisons between Spanish and Peruvian population. The measurement invariance assessment contributes to a better understanding of life satisfaction in populations from different cultural contexts.
La satisfacción con la vida es una medida de protección en los adultos mayores. Aquí radica la importancia de tener instrumentos de calidad para medirla. El objetivo de este estudio fue evaluar la invarianza de la Escala de Satisfacción con la Vida (SWLS) en 2 muestras de adultos mayores de España y Perú.
MétodoLos participantes fueron 857 adultos mayores españoles (edad media: 68,23 años y DT: 5,93) y 336 adultos mayores peruanos (edad media: 72,42 años y DT: 7,07). Todos los análisis factoriales multi-muestra se estimaron en Mplus 8.0.
ResultadosLos resultados indican la presencia de una invarianza estricta de la estructura unifactorial de la SWLS en muestras de adultos mayores de España y Perú, lo que permite realizar comparaciones adecuadas, tanto de medias latentes como de relaciones con otras variables. La comparación de las medias latentes mostró pequeñas diferencias en el constructo entre las 2 culturas.
ConclusionesLa SWLS es una escala válida para realizar comparaciones transculturales entre poblaciones peruanas y españolas. La evaluación de la invarianza de medida contribuye a entender mejor la satisfacción vital desde contextos culturales diferentes.
Life satisfaction is the cognitive dimension of subjective wellbeing,1 and it can be defined as the conscious evaluation a person does about his overall quality of life or about specific domains.2
Satisfaction with life has aroused the interest of gerontological research,3 becoming an important marker of successful aging4 related with psychological and physical health.5 Older adults less satisfied with their lives had an incremental risk of depression,6 suicidal attempts4 or general physical health problems.7 Additionally, life satisfaction has been shown a predictor of mortality and morbility.8
Considering this, it is common to use life satisfaction in population surveys across countries. For example, in the USA,9 life satisfaction measures have been used as an indicator of the effectiveness of health policies to impact the quality of life of different populations. Given this, it is important to have measures of satisfaction with life to monitor the impact of health promotion and prevention actions on older adults. These instruments must be quick and easy to apply, have evidence of validity and reliability, and be accepted by health professionals and old people.
Among the available instruments, the Satisfaction with Life Scale (SWLS),2 is a unidimensional short measure, employed in over 4000 research studies.10 It measures the overall assessment a person does on his life. Several validations of the scale have gathered evidence on reliability and validity in different countries and populations.11 In old adults, there has been evidence of the unidimensionality of the scale, with factor loadings ranging from .43 to .93 and reliability indexes ranging from .75 to .92.12–14 However, evidence of measurement invariance is necessary to make meaningful comparisons of groups, such as sex, age, marital status, race. A measurement invariant construct has the same meaning for all the groups to be compared. If there is no invariance, measurement is biased and this affects the validity of the conclusions derived from the comparisons.15 Therefore, establishing measurement invariance is previous to any other type of group comparisons.10
Several previous studies have studied the measurement invariance of the SWLS regarding sex,16 age,17 immigrant groups,18 or different countries and/or cultural groups.19–23 Nevertheless, the SWLS invariance studies between different countries are inconclusive. Studies showed strong measurement invariance between Russian and Americans students, but no within different samples in each country.21 When comparing adult samples in Argentina, México and Nicaragua, only partial invariance was achieved with intercepts from items 2 and 3 being different across countries.20 Studies that compared Chinese and American university students,24 Spanish and Portuguese adolescents,19 and adolescents from Brasil, Chile and Spain25 also pointed out invariance for four of the five items in the SWLS but not in the fifth one. Similar results were found when USA and Brasil's university students were analyzed23 with items 4 and 5 failing the invariance test. Studies offered evidence on partial invariance in adults between 50- and 79-years old form USA, Britain and Japan, with intercept of item 4 being variant across countries.22 Finally, others also found evidence for partial invariance of the SWLS for Chilean and Ecuadorian old adults, with factor loading of item 3 and intercepts of items 4 and 5 being different in the two countries.14
A recent study26 with the aim to identify and review research published between 1985 and 2016 on measurement invariance of the SWLS found that there is evidence to support the equivalence of the SWLS by gender, but not by age or cultural groups. Specifically, when several cultural groups are studied, there are difficulties to find nothing more than configural invariance, with one third of the studies found metric invariance and only one supported scalar invariance. Another study examined measurement invariance of the SWLS in 26 countries. This study found only found metric invariance across countries.27
The aforementioned studies suggest that the SWLS presents some cultural sensibility.14 In this sense, potential differences on life satisfaction among countries should be cautiously interpreted. These differences could well be attributable to item bias as well as to true group differences. All this justifies the need for careful analyses of cross-cultural equivalence of the SWLS for a better understanding of the universality of the construct.25 Therefore, the main aim of this study is to offer evidence on the measurement invariance of the SWLS in samples of old adults from countries with cultural differences, specifically Peru and Spain. Additionally, measurement invariance by sex and marital status was also tested.
MethodDesign, participants and procedureTwo samples were gathered of people 60 years old or older: One of them from Lima, Peru and the other one from Valencia, Spain. In Spain the sample size was 857. The participants had a mean age of 68.23 years (SD=5.93), with a minimum of 60 years and a maximum of 92. Of those, 69.2% were women. 28% were single, 5.8% divorced, 20.4 widows or widowers, and the remaining 45.7% married. In Peru, the sample size was 336 and mean age of 72.42 years (SD=7.07). 72.6% were women. With respect to marital status, 2.4% were single, 57.7% were married, 15.4% divorced and the remaining 23.5% widows or widowers.
InstrumentsSurveys in both countries included a variety of sociodemographic indices and psychological constructs. For the purposes of this research, the scale of interest is the satisfaction with life scale (SWLS),2 specifically, the Spanish version. The SWLS has five items assessing overall life satisfaction, using a likert-type response format, with five response options (1=totally disagree to 5=totally agree). The total scale score can therefore range from 5 to 25, where a higher score corresponds to a higher degree of satisfaction with life. The scale has been used on general population,28 children,29 older adults30 or people with various clinical problems.31 It has always been found to have a reliable one-factor structure.
Statistical analysesThe statistical analysis considered a series of Confirmatory Factor analyses (CFA). These CFAs were estimated in Mplus 8.0. Among the method of estimation available in the program WLSMV method was chosen as it works very well in absence of multivariate normality and with ordinal items as the ones in the scale. Missing data were dealt with Full FIML. Model fit was studied with the two best indices offered in this particular method of estimation, the Comparative Fit Index (CFI), the Tucker–Lewis Index (TLI), and the Root Mean Square Error of Approximation (RMSEA). A CFI/TLI above .90 (better if above .95) and RMSEA below .08 are usually employed to declare model fit reasonable. However, RMSEA has been shown to perform poorly in structural models with low degrees of freedom and/or simple models, as it happens with the CFAs in this research. Nevertheless, the RMSEA value is given because it allowed us to compare the relative fit of competitive models even if it does not perform well to test for the absolute fit of any given model. Parameter estimates were also carefully considered.
The CFAs were all one-factor models to represent the latent structure of the SWLS. Firstly, the one-factor model was estimated in both samples separately. Secondly, a standard invariance routine was employed in order to test for the invariance of factor loadings, intercepts, residuals, and factor means. First, a configural model is tested in which the one-factor structure is estimated in both groups at the same time but separately. Fit of this configural model is used as the baseline fit. Second, metric or weak invariance was tested to set the estimates for factor loadings to be the same in both countries. Third, scalar or strong invariance was tested, to test that the same estimates for the intercepts hold for both samples. Finally, a strict invariance test of equal residuals was also tested although it is not necessary for comparisons. The models in this sequence are nested and may be compared with two different rationales32: a formal statistical test and a modeling strategy. The statistical approach employs χ2 differences (Δχ2) to compare constrained to unconstrained models, with non-significant values suggesting multi-group equivalence or invariance. This approach has been criticized for been too powerful to detect trivial differences, especially with relative large samples.15,32 Therefore, a modeling approach has been advocated with CFI differences<.01 or .05 employed as cut-off criteria to accept the more parsimonious model.15,32 If a more parsimonious model evinces adequate levels of practical fit, then the sets of equivalences are considered a reasonable approximation to the data.
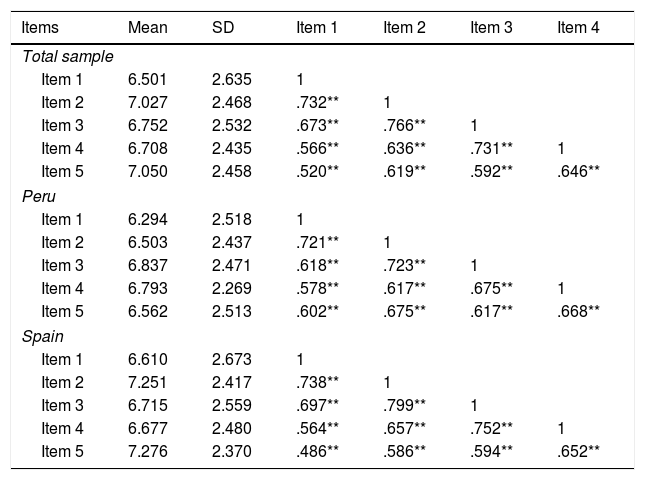
ResultsTable 1 shows the descriptive statistics and item correlations for Spanish and Peruvians samples, as well as for both of them together. The alphas for the total sample (αtotal=.903, IC95%: .89–.91) and for the two samples (αSpain=.925, IC95%: .92–.93; αPeru=.902, IC95%: .88–.92) were very good.
Items’ means, standard deviations (SD), and correlation matrices for the total sample and Peruvian and Spanish participants.
| Items | Mean | SD | Item 1 | Item 2 | Item 3 | Item 4 |
|---|---|---|---|---|---|---|
| Total sample | ||||||
| Item 1 | 6.501 | 2.635 | 1 | |||
| Item 2 | 7.027 | 2.468 | .732** | 1 | ||
| Item 3 | 6.752 | 2.532 | .673** | .766** | 1 | |
| Item 4 | 6.708 | 2.435 | .566** | .636** | .731** | 1 |
| Item 5 | 7.050 | 2.458 | .520** | .619** | .592** | .646** |
| Peru | ||||||
| Item 1 | 6.294 | 2.518 | 1 | |||
| Item 2 | 6.503 | 2.437 | .721** | 1 | ||
| Item 3 | 6.837 | 2.471 | .618** | .723** | 1 | |
| Item 4 | 6.793 | 2.269 | .578** | .617** | .675** | 1 |
| Item 5 | 6.562 | 2.513 | .602** | .675** | .617** | .668** |
| Spain | ||||||
| Item 1 | 6.610 | 2.673 | 1 | |||
| Item 2 | 7.251 | 2.417 | .738** | 1 | ||
| Item 3 | 6.715 | 2.559 | .697** | .799** | 1 | |
| Item 4 | 6.677 | 2.480 | .564** | .657** | .752** | 1 |
| Item 5 | 7.276 | 2.370 | .486** | .586** | .594** | .652** |
The one – factor solution fitted the data well when it was tested separately in both samples (Spain: χ25=211.7, p<.001, CFI=.986, TLI=.973, RMSEA=.222 [.197–.248]; Peru: χ25=51.20, p<.001, CFI=.990, TLI=.980, RMSEA=.166 [.126–.208]). Once an adequate fit in both samples was achieved, the set of increasingly constrained multi-group models were estimated and tested.
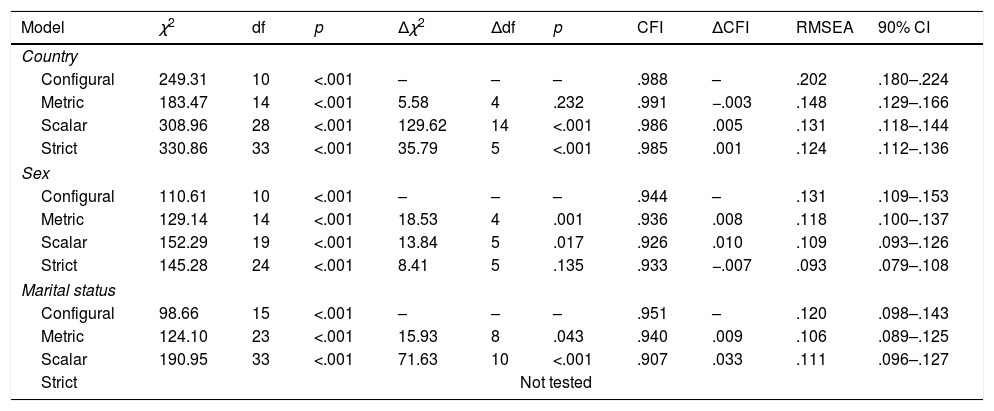
Table 2 shows goodness-of-fit indices for the sequence of models and their differences to the less restricted model in the sequence. First, measurement invariance by country was tested. The configural model fitted the data well, according to CFI and TLI, and therefore it can be used as a baseline model. When factor loadings are set to equality across samples all fit indices improved, and the chi-square differences were not statistically significant. Therefore, metric invariance is guaranteed. Then scalar invariance was calculated and fit indices were again good, there were improvements in both TLI and RMSEA, and a very minor deterioration in the CFI. Although, the chi-square difference test was statistically significant, overall we consider that scalar invariance is tenable. Exactly the same happened when residuals were constrained to equality: TLI and RMSEA showed improvements and the CFI deteriorated minimally, with a chi-square difference statistically significant. Overall, we consider that the SWLS has been shown to be strictly invariant for the samples of Spain and Peru. Similarly, measurement invariance by sex was tested, and the fit indices are presented in Table 2. Results were very similar to those by country and therefore strict measurement invariance by sex is guaranteed. Finally, measurement invariance by marital status was tested (three groups: singles, widowhood/divorced, and married). In this case, metric invariance held but there was no evidence of scalar invariance. CFI differences were large and chi-square differences statistically significant. Therefore, strict invariance was not tested. The SWLS may be considered metric invariant by marital status but not scalar invariant.
Set of nested models to test for measurement invariance.
| Model | χ2 | df | p | Δχ2 | Δdf | p | CFI | ΔCFI | RMSEA | 90% CI |
|---|---|---|---|---|---|---|---|---|---|---|
| Country | ||||||||||
| Configural | 249.31 | 10 | <.001 | – | – | – | .988 | – | .202 | .180–.224 |
| Metric | 183.47 | 14 | <.001 | 5.58 | 4 | .232 | .991 | −.003 | .148 | .129–.166 |
| Scalar | 308.96 | 28 | <.001 | 129.62 | 14 | <.001 | .986 | .005 | .131 | .118–.144 |
| Strict | 330.86 | 33 | <.001 | 35.79 | 5 | <.001 | .985 | .001 | .124 | .112–.136 |
| Sex | ||||||||||
| Configural | 110.61 | 10 | <.001 | – | – | – | .944 | – | .131 | .109–.153 |
| Metric | 129.14 | 14 | <.001 | 18.53 | 4 | .001 | .936 | .008 | .118 | .100–.137 |
| Scalar | 152.29 | 19 | <.001 | 13.84 | 5 | .017 | .926 | .010 | .109 | .093–.126 |
| Strict | 145.28 | 24 | <.001 | 8.41 | 5 | .135 | .933 | −.007 | .093 | .079–.108 |
| Marital status | ||||||||||
| Configural | 98.66 | 15 | <.001 | – | – | – | .951 | – | .120 | .098–.143 |
| Metric | 124.10 | 23 | <.001 | 15.93 | 8 | .043 | .940 | .009 | .106 | .089–.125 |
| Scalar | 190.95 | 33 | <.001 | 71.63 | 10 | <.001 | .907 | .033 | .111 | .096–.127 |
| Strict | Not tested | |||||||||
Note: df=degrees of freedom; Δ=differences.
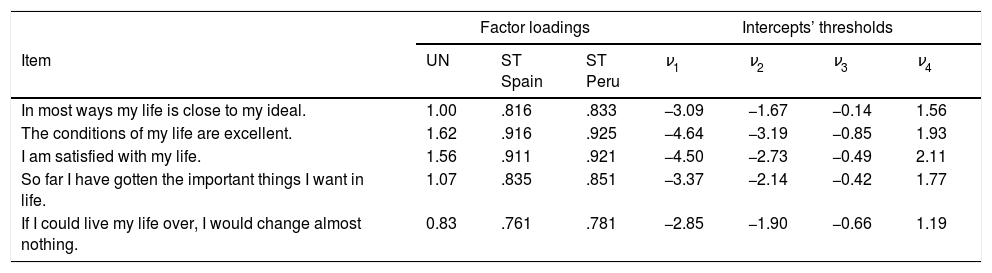
Unstandardized and standardized factor loadings and intercepts in the retained model are presented in Table 3. Unstandardized loadings and intercepts are fixed to the same estimates in both samples. Standardized factor loadings are not the same as they also depend on the variances. Nevertheless, all of them are large, which indicates a clear one-factor structure for the scale, and extremely similar in both samples. Given that, the scale can be considered strictly invariant mean comparisons are meaningful, and they can be made at the latent level. For this the mean of one sample is set to zero and the mean estimated for the other sample is the difference between the samples. In this case Peruvian mean life satisfaction was the reference sample, and we found that indeed there were significant differences between the two means of life satisfaction. Specifically, life satisfaction had a larger average in Spain than in Peru (α=0.238, p=.015, d=.158). However, as it can be seen in the effect size associated to this mean difference, the effect may be considered small.
Unstandardized and standardized factor loadings and intercepts’ thresholds.
| Factor loadings | Intercepts’ thresholds | ||||||
|---|---|---|---|---|---|---|---|
| Item | UN | ST Spain | ST Peru | ν1 | ν2 | ν3 | ν4 |
| In most ways my life is close to my ideal. | 1.00 | .816 | .833 | −3.09 | −1.67 | −0.14 | 1.56 |
| The conditions of my life are excellent. | 1.62 | .916 | .925 | −4.64 | −3.19 | −0.85 | 1.93 |
| I am satisfied with my life. | 1.56 | .911 | .921 | −4.50 | −2.73 | −0.49 | 2.11 |
| So far I have gotten the important things I want in life. | 1.07 | .835 | .851 | −3.37 | −2.14 | −0.42 | 1.77 |
| If I could live my life over, I would change almost nothing. | 0.83 | .761 | .781 | −2.85 | −1.90 | −0.66 | 1.19 |
Note: UN=unstandardized estimates (constrained to equality in the two samples); ST=standardized estimates.
Satisfaction with life is a measure of protection in older adults.4,6,7 There lies the importance of providing instruments to measure this construct quickly, easily but with enough evidence of psychometric quality.
Among the instruments that allow measuring satisfaction, the SWLS2 stands out, as a brief measure of five items and a great deal of evidence of its psychometric quality and usefulness has already been gathered.11,33 One main area of psychometric interest is the measurement invariance of instruments as the absence of measurement bias is a key aspect for meaningful comparisons among groups.
As part of this evidence, some studies have tried to prove gender or age invariance of the SWLS. However, results on countries measurement invariance can be considered inconclusive,21 pointing out that the possible differences could be attributed to the response to particular items of the SWLS.1
Thus, the current article analyzes the cross-cultural equivalence of the SWLS, being the first study that evaluates the measurement invariance of the SWLS in samples of older adults from Spanish-speaking countries of Europe (Spain) and South America (Peru). Therefore, it tries to support the cross-cultural use of the satisfaction with life construct, as measured with the SWLS.23
The results indicate a reliability of the SWLS scores in the Peruvian and Spanish sample, which is in the same direction as that reported by other SWLS studies in Spanish-speaking older adults.13,14 This suggests that the SWLS offers consistent and very good results in terms of internal consistency across different countries.11
Our results have also found that strict invariance of the SWLS held across the two Spanish-speaking countries studied. It seems like, despite the different levels of education in the countries, types of government and social dynamics, the interpretations of the quality of life indexes are similar and valid in both groups. Specifically, configural invariance suggests that older adults in both countries conceptualize life satisfaction with the same one-factor dimensionality. Metric invariance offers evidence that a change in life satisfaction produces the same change in SWLS for both groups. Additionally, scalar invariance indicates that mean differences between the two countries at the observed level agree with mean differences at the latent level. Finally, strict invariance points out that the error of measurement in the SWLS is the same for Spain and Peru.
The results on measurement invariance for Spain and Peru results do not coincide with others that report the presence of a partial invariance of the SWLS in different countries.17,21–25 This may be due to cultural experiences being more similar between older adults in Peru and Spain rather than in other cultural groups. Additionally, while other studies analyzed different translations of the SWLS, in this study the same Spanish translation was used in both countries. Therefore, it is important to guarantee the comparability of the SWLS with an adequate translation process.34
Although not a main aim of the research, additional information on measurement invariance by sex and marital status has been offered. The SWLS was strictly invariant by sex, but only metric invariant by marital status. These results show the presence of a single factor through all groups studied, and that old adults in both countries regardless of their marital status conceptualize life satisfaction in the same way. Regarding sex, strict invariance shows that the SWLS measures exactly the same, with the same error, in men and women. Other studies, with participants of different ages have shown that it is difficult to achieve strict invariance by sex in the SWLS. For example results by Atienza et al.35 showed that factor loadings and residuals were not invariant in Spanish secondary education students. Apparently age may well have something to do with these invariance differences, although results are not conclusive.16 Unfortunately, these studies cannot be directly compared with our results, given that they were performed in adolescents. Finally, there is evidence for metric invariance by marital status, which makes impossible to make meaningful mean comparisons in the SWLS for these populations.
Since our study found strict invariance by country, we proceeded to compare the latent means of life satisfaction between countries. There were differences between Spanish and Peruvian older adults, with a higher satisfaction with life in the case of Spanish old people, although the size of the effect suggests that this difference is small. This would be related to a balanced approach to intercultural studies of well-being that takes into account their differences and similarities, and not only the latter.36
Current research has some limitations. First, the incidental sampling design. There is no repeated assessment of people's life satisfaction and therefore the longitudinal invariance has not been established. Unfortunately, data following the same person over the years is seldom considered in studies of the relationship between subjective well-being and aging. Second, the size of the Peruvian sample (N=336) was smaller than the Spanish sample (N=857). For this type of studies, a similar sample size of the comparison groups is ideal.37
However, the factorial validity is as expected with a clear one factor solution, and a very high internal consistency. Moreover, when it comes to measurement invariance, the SWLS was found to be strictly invariant, and therefore all sort of comparisons between the two countries are tenable. Results pointed that the SWLS is a valid instrument for intercultural comparisons between these groups, and it offers indirect evidence for comparisons with other Spanish-speaking countries of the same cultural background. The measurement invariance assessment contributes to a better understanding of life satisfaction in populations from different cultural contexts and, in addition, provides researchers with useful information for the adequate choice of indicators with valid and reliable properties.20
Conflicts of interestNo potential conflicts of interest were disclosed.
