
To update the metric properties of a perceived quality questionnaire for patients admitted to hospital medical departments, to determine the level of patient satisfaction achieved, and to identify the variables which predict satisfaction.
MethodsSelf-administered questionnaire completed at home following patient discharge, using a questionnaire prepared by the authors on a sample of 7207 users of medical departments in 9 public hospitals during the years 2006–2009. A principal component analysis with varimax rotation was performed. Reliability was assessed using internal consistency coefficient. An analysis was made of the compliance with each indicator reported by respondents. A logistic regression analysis was performed to determine the perceived quality dimensions which predicted overall patient satisfaction.
ResultsThe results of the reliability analysis indicated good coefficients for interpersonal manner (0.94) and professional competence (0.85) dimensions, and moderate values for the other dimensions (comfort 0.55, information 0.38, and organisation 0.37). Factor analyses showed single factors in each of the perceived quality dimensions, with a percentage of explained variance greater than 35% for information, interpersonal manner, professional competence, and comfort, and less than 30% for organisation. The dimensions which predicted satisfaction were interpersonal manner of healthcare staff, professional competence, and information.
ConclusionsThe metric properties of the questionnaire used have been updated, yielding a valid and reliable questionnaire for assessing patient satisfaction in quality management programmes, both for internal purposes and for conducting external comparisons.
A positive relationship was obtained between the level of patient satisfaction and level of professional competence, interpersonal manner of healthcare staff, and information received.
Revisar las propiedades métricas de un cuestionario de calidad percibida de los servicios médicos hospitalarios, determinar el nivel de satisfacción de los usuarios e identificar los indicadores de calidad predictores de satisfacción.
MétodosSe ha utilizado un cuestionario autoadministrado en el domicilio al alta del paciente. La muestra fue de 7.207 usuarios de servicios médicos en 9 hospitales públicos desde 2006 a 2009. Se analizó la fiabilidad (consistencia interna) de las dimensiones de calidad percibida y su validez interna usando análisis de componentes principales. Finalmente, se realizó un análisis de regresión logística para determinar las dimensiones de calidad que mejor predecían la satisfacción del paciente.
ResultadosLas dimensiones de trato y competencia profesional mostraron altos coeficientes de fiabilidad (0,94 y 0,85, respectivamente), para el resto de dimensiones los valores fueron moderados (0,37 a 0,55). El análisis de componentes principales indicó que las diferentes dimensiones de calidad (trato, competencia profesional, información, confort y organización) son unidimensionales, explicando cada una de ellas más de un 35% de la varianza, excepto para organización, que fue próxima al 30%. El trato recibido por el usuario, la competencia profesional percibida y la información fueron las dimensiones de calidad que mejor pronosticaron la satisfacción del paciente.
ConclusionesEl cuestionario de calidad percibida mostró adecuadas propiedades métricas, siendo válido y fiable para la valoración de la satisfacción del paciente en los programas de gestión de la calidad, tanto con fines internos como para la realización de comparaciones externas.
Information on the degree of satisfaction and perceived quality reported by health service users and their families is useful for improving the organisation of healthcare, and serves as a starting point for improving service quality.1–4 Patient satisfaction forms part of health centre outcomes and is an essential element in the evaluation of these organisations. Hence, the dimension of patient satisfaction with care received is included in all healthcare quality assessment models.
However, patient satisfaction is a complex variable4 and there is no general consensus on the factors with which it is associated. In a systematic review5 of over 3000 articles, the authors concluded that satisfaction is a relative concept, a reflection of patient assessments of the quality of care they received compared to subjective standards, which can be influenced by previous health status, severity of illness or other factors such as age. They also indicated inconsistent influence of gender, race, socioeconomic or educational level on patient satisfaction. Furthermore, satisfaction is a multidimensional concept which varies according to the type of care provided and which requires the use of different tools for the different areas of health care.6
Of the various methods available to determine the degree of satisfaction with health services, questionnaires are most commonly used.5 Among their advantages, questionnaires can be administered to any group of people, information about past events can be retrieved, a large amount of information can be collected in a short time and they are relatively inexpensive.7
However, most of the questionnaires used to measure perceived quality and patient satisfaction did not provided data about metric characteristics (reliability and validity).8 In others it is necessary to update their metric properties, this is a necessary procedure since the characteristics of the target population may change over time. In addition, many of the questionnaires used to measure both perceived quality and inpatient satisfaction are the same for all patients, regardless of the illness that has resulted in their hospital admission or the unit in which they are cared for. Thus, patients admitted to medical services present characteristics that differentiate them from patients admitted to other hospital units,9,10 since they are older,11 usually present comorbidity12–15 and have a longer average stay and a higher possibility of readmission.
The aim of this study was to update the metric properties of a perceived quality questionnaire used in the Hospital Medical Services,16 determine the degree of patient satisfaction with the care received and the variables related with patient satisfaction.
Material and methodsParticipantsThe study population comprised the total number of patients discharged from the medical service of the nine general hospitals run by the Murcian Health Service (MHS) over the period 2006–2009, from which a sample of 7207 cases was extracted. The MHS is the public body responsible for the provision of health services in the Autonomous Region of Murcia that, located in the south-east Spain had, at the time of the study, a reference population of 1,446,109 inhabitants and nine general hospitals. The size of these nine hospitals were from 97 to 863 beds. Of the nine, one had more than 500 beds (large hospital), 4 had a medium size (200–500 beds) and the other four had less than 200 (small).
From 2006 to 2009, data was collected four times a year, once every three months. In order to identify cases, a period of between one and three weeks each quarter, depending on the size of the hospital, was selected. A stratified random start systematic sampling, not proportional to hospital size, was conducted.
QuestionnaireWe used the EMCA (Assessing and Improving Healthcare Quality) questionnaire to measure satisfaction and perceived quality during patient hospitalisation in medical services. This questionnaire was developed following the methodology used by the Picker Institute (Boston, USA),17 which includes an exploration with focus groups in order to identify those relevant aspects to patients admitted to hospital.
The statements were formulated in accordance with recommendations for questionnaire design.18 Subsequently, a pilot study and preliminary validation was performed using patients for different regions in Spain.
Three different questionnaires were developed: one for patients admitted for surgery services, another for women admitted to give birth, and the last, which was the focus of this research, a specific questionnaire to explore the opinions of patients admitted to Hospital Medical Services.
The questionnaire for measuring perceived quality and satisfaction of patients admitted to medical services included five perceived quality dimensions: interpersonal manner, information, professional competence, organisation and comfort. It consisted of fifty-one items on perceived quality, one item to determine overall assessment of satisfaction using a 10-point response scale from 0 to 10 (from very dissatisfied to very satisfied) and four items referring to patient profile (age, gender, educational level and previous hospital admissions).16
To facilitate understanding and self-completion of the tool, the order of the questions followed the sequence of the care process itself (admission, length of stay and discharge).
Data collectionThe patient received the questionnaire at home, accompanied by a cover letter, within ten days of discharge. Patients returned the completed questionnaire using a postage-paid envelope. To increase the response rate, two reminder letters were sent 10 and 20 days after the questionnaire had initially been posted. The response rate was 34.92%.
Data analysesA total of 2517 questionnaires were received. Of this total 1789 (71%) were excluded from the psychometric analysis because their items answers were incomplete. The possible existence of sample selection bias was assessed by comparing the mean age and gender final sample distribution with respect to the initial sample. Given the large sample size, the magnitude of the mean difference using Cohen's d test 19 was calculated. Furthermore, univariate descriptive analyses of the sociodemographic variables were conducted.
In order to assess dimensional structure principal component analysis with varimax rotation was carried out. This analysis provided information on internal questionnaire validity. Reliability was calculated using Chronbach's internal consistency coefficient.
Then we calculated the percentage of compliance with the perceived quality variables by dividing the number of positive responses for each variable by the total number of responses received for each. An indicator was considered satisfactory according to whether the respondent answered “yes” or “no”, or in the case of multiple choice items, indicated the extreme value of the statements, namely “always”, “never” or “very good”. Also composite measures for each of the dimensions obtained in the factor analysis, using the opportunity model, as the sum of positive responses to the items in each dimension divided by the sum of the answers to those same items 20 were calculated. Lastly, a logistic regression analysis in order to determine the perceived quality dimensions that best predicted overall patient satisfaction was performed. Since our aim was to determine the level of quality perceived by very satisfied users, patients were classified into two categories: patients who reported a very high level of satisfaction (score of 9 or above for the overall satisfaction criterion item) and other patients (score of 8 or below). In order to control for confounding factors, the model also included sociodemographic variables, previous hospital admissions and hospital size (large, medium and small).
Statistical analysis of the data was performed using SPSS 19.0.21 In all cases, results were considered statistically significant when the probability value was less than or equal to 0.05.
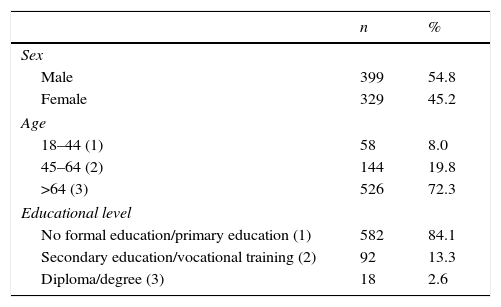
ResultsThe mean age of study participants was 70.2 years old, 45.2% were female and 84.1% didn’t had studies or had completed primary education (Table 1).
Comparing the sociodemographic characteristic of analysed sample with the initial sample, no significant differences were found for gender distribution. However, statistical significant differences were found for age (p<0.001), although the effect size was small (Cohen's d<0.20) indicating that the differences were negligible.
Dimensional structure analysisUsing the Kaiser–Meyer–Olkin (KMO) index of sampling adequacy, a value of 0.89 for Information dimension, 0.93 for Interpersonal Manner, 0.86 for professional competence, 0.59 for organisational dimension and 0.70 for comfort were obtained, indicating that the data were suitable for performing factor analyses. Bartlett's sphericity test results were statistically significant for each of the dimensions (p<0.001).
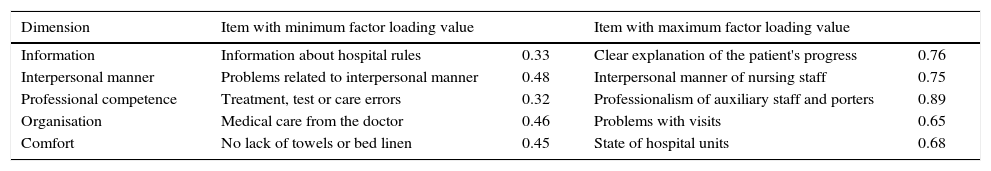
The factor analysis results for the 12 items related to Information showed that a single factor explained 36.35% of the total variance (eigenvalue=4.36). This dimension included statements that referred to the information received at the time of admission, during stay in the emergency department and on arrival at the ward, easily understood answers to questions directed at medical or nursing staff, explanations of the patient's condition during his or her stay on the ward given to the patient or his or her companions and discharge information. The 17 items related to interpersonal manner variable, were grouped into a single factor explained 39.79% of the variance (eigenvalue=6.77). This dimension comprised statements that referred to issues related to respect for privacy, absence of discriminatory treatment and kindness. Moreover, the 8 items related to professional competence were grouped into a single factor explained 50.68% of the total variance (eigenvalue=4.05). This dimension included statements referring to the professionalism of all categories of hospital staff, absence of care errors and approaches to pain relief. The five items for the dimension of organisational, which referred to compliance with rules, shifts and visits, revealed a single factor structure explaining 29.14% of the total variance (eigenvalue=1.46). Lastly, the five items related to comfort were grouped into a single factor which explained 36.13% of the total variance (eigenvalue=1.81). The items in this dimension referred to the condition of the premises and the comfort of the hospital's medical services.
The minimum and maximum factor loadings for each of the dimensions are shown in Table 2.
Range of factor loadings.
| Dimension | Item with minimum factor loading value | Item with maximum factor loading value | ||
|---|---|---|---|---|
| Information | Information about hospital rules | 0.33 | Clear explanation of the patient's progress | 0.76 |
| Interpersonal manner | Problems related to interpersonal manner | 0.48 | Interpersonal manner of nursing staff | 0.75 |
| Professional competence | Treatment, test or care errors | 0.32 | Professionalism of auxiliary staff and porters | 0.89 |
| Organisation | Medical care from the doctor | 0.46 | Problems with visits | 0.65 |
| Comfort | No lack of towels or bed linen | 0.45 | State of hospital units | 0.68 |
The internal consistency coefficient established by Cronbach's alpha coefficient31 for each of the dimensions was 0.83 (information), 0.90 (interpersonal manner), 0.85 (professional competence), 0.37 (organisational) and 0.55 (comfort).
Cronbach's alpha coefficient for all questionnaire items was 0.94.
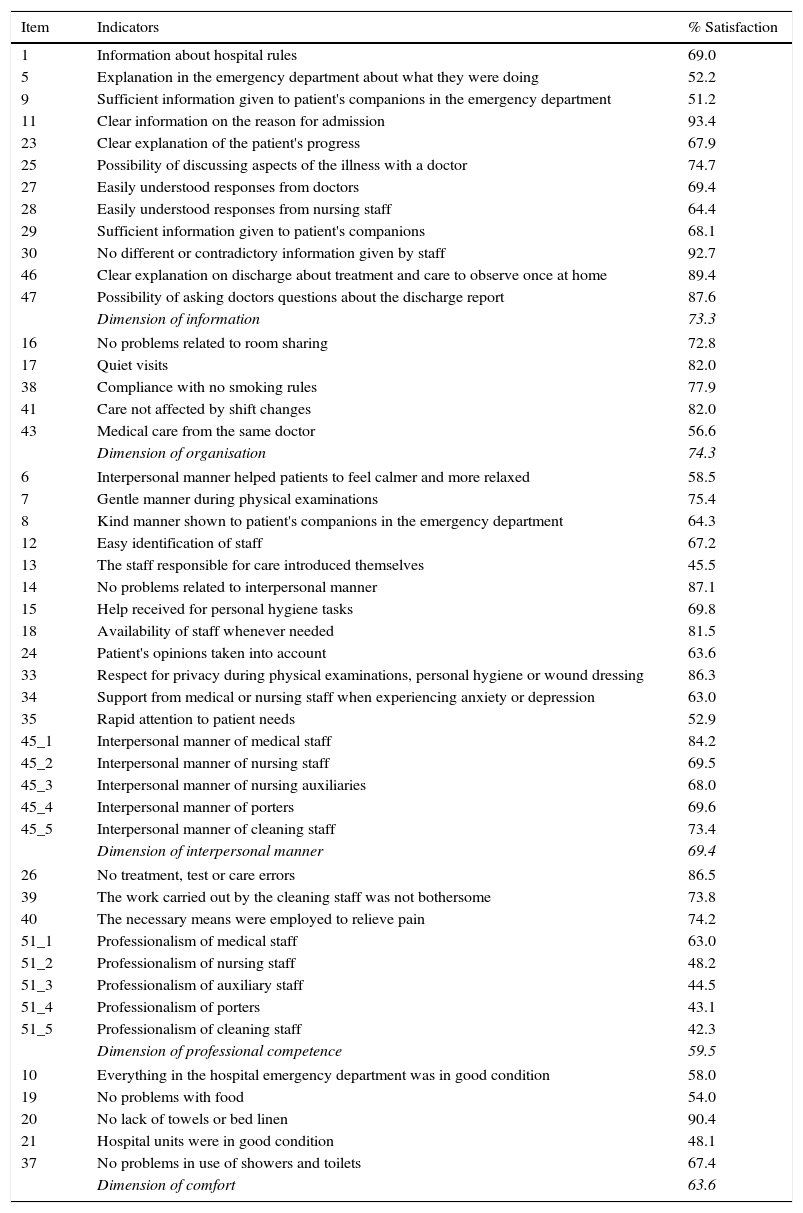
Percentage of compliance with perceived quality itemsThe percentages of compliance obtained for each dimension ranged from 74.3% for the dimension of organisational to 59.5% for the professional competence dimension (see Table 3). Percentages for each item ranged between 93.4% (clear information about the reason for admission) to 42.3% (professionalism of cleaning staff).
Percentage of satisfaction by item and dimension.
| Item | Indicators | % Satisfaction |
|---|---|---|
| 1 | Information about hospital rules | 69.0 |
| 5 | Explanation in the emergency department about what they were doing | 52.2 |
| 9 | Sufficient information given to patient's companions in the emergency department | 51.2 |
| 11 | Clear information on the reason for admission | 93.4 |
| 23 | Clear explanation of the patient's progress | 67.9 |
| 25 | Possibility of discussing aspects of the illness with a doctor | 74.7 |
| 27 | Easily understood responses from doctors | 69.4 |
| 28 | Easily understood responses from nursing staff | 64.4 |
| 29 | Sufficient information given to patient's companions | 68.1 |
| 30 | No different or contradictory information given by staff | 92.7 |
| 46 | Clear explanation on discharge about treatment and care to observe once at home | 89.4 |
| 47 | Possibility of asking doctors questions about the discharge report | 87.6 |
| Dimension of information | 73.3 | |
| 16 | No problems related to room sharing | 72.8 |
| 17 | Quiet visits | 82.0 |
| 38 | Compliance with no smoking rules | 77.9 |
| 41 | Care not affected by shift changes | 82.0 |
| 43 | Medical care from the same doctor | 56.6 |
| Dimension of organisation | 74.3 | |
| 6 | Interpersonal manner helped patients to feel calmer and more relaxed | 58.5 |
| 7 | Gentle manner during physical examinations | 75.4 |
| 8 | Kind manner shown to patient's companions in the emergency department | 64.3 |
| 12 | Easy identification of staff | 67.2 |
| 13 | The staff responsible for care introduced themselves | 45.5 |
| 14 | No problems related to interpersonal manner | 87.1 |
| 15 | Help received for personal hygiene tasks | 69.8 |
| 18 | Availability of staff whenever needed | 81.5 |
| 24 | Patient's opinions taken into account | 63.6 |
| 33 | Respect for privacy during physical examinations, personal hygiene or wound dressing | 86.3 |
| 34 | Support from medical or nursing staff when experiencing anxiety or depression | 63.0 |
| 35 | Rapid attention to patient needs | 52.9 |
| 45_1 | Interpersonal manner of medical staff | 84.2 |
| 45_2 | Interpersonal manner of nursing staff | 69.5 |
| 45_3 | Interpersonal manner of nursing auxiliaries | 68.0 |
| 45_4 | Interpersonal manner of porters | 69.6 |
| 45_5 | Interpersonal manner of cleaning staff | 73.4 |
| Dimension of interpersonal manner | 69.4 | |
| 26 | No treatment, test or care errors | 86.5 |
| 39 | The work carried out by the cleaning staff was not bothersome | 73.8 |
| 40 | The necessary means were employed to relieve pain | 74.2 |
| 51_1 | Professionalism of medical staff | 63.0 |
| 51_2 | Professionalism of nursing staff | 48.2 |
| 51_3 | Professionalism of auxiliary staff | 44.5 |
| 51_4 | Professionalism of porters | 43.1 |
| 51_5 | Professionalism of cleaning staff | 42.3 |
| Dimension of professional competence | 59.5 | |
| 10 | Everything in the hospital emergency department was in good condition | 58.0 |
| 19 | No problems with food | 54.0 |
| 20 | No lack of towels or bed linen | 90.4 |
| 21 | Hospital units were in good condition | 48.1 |
| 37 | No problems in use of showers and toilets | 67.4 |
| Dimension of comfort | 63.6 | |
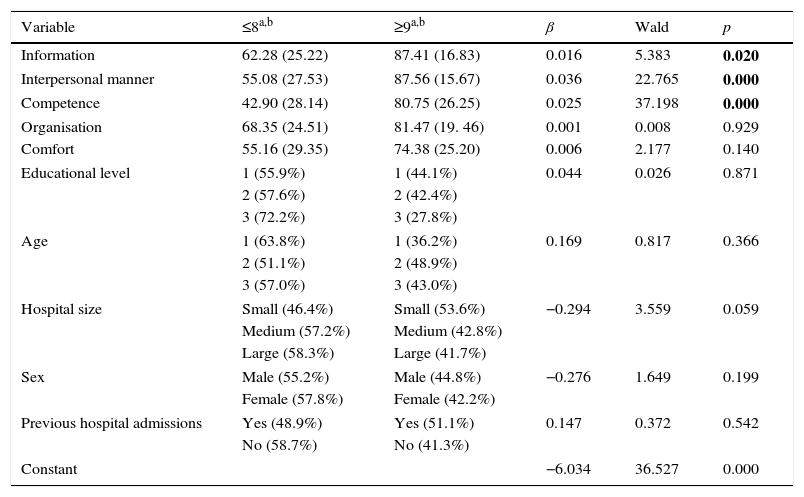
Mean overall satisfaction on a scale of 0–10 was 7.99, with 43.6% of patients giving a score of 9–10. In order to determine the variables that best predicted the degree of satisfaction of hospitalised patients, a logistic regression analysis was performed, using patient satisfaction as the dependent variable and the perceived quality dimensions (information, interpersonal manner, professional competence, organisational and comfort), socio-demographic variables (educational level, age and gender of the patient), previous admissions to hospital and hospital size (large, medium and small) as independent variables.
The overall fit of this model was statistically significant (Chi-square=324.39, df=10, p<0.01; Nagelkerke's R2=0.523) and it correctly classified 80.5% of cases. Information, interpersonal manner and professional competence variables were statistically significant, whilst Hospital size was partially significant (see Table 4).
Results of logistic regression analysis.
| Variable | ≤8a,b | ≥9a,b | β | Wald | p |
|---|---|---|---|---|---|
| Information | 62.28 (25.22) | 87.41 (16.83) | 0.016 | 5.383 | 0.020 |
| Interpersonal manner | 55.08 (27.53) | 87.56 (15.67) | 0.036 | 22.765 | 0.000 |
| Competence | 42.90 (28.14) | 80.75 (26.25) | 0.025 | 37.198 | 0.000 |
| Organisation | 68.35 (24.51) | 81.47 (19. 46) | 0.001 | 0.008 | 0.929 |
| Comfort | 55.16 (29.35) | 74.38 (25.20) | 0.006 | 2.177 | 0.140 |
| Educational level | 1 (55.9%) | 1 (44.1%) | 0.044 | 0.026 | 0.871 |
| 2 (57.6%) | 2 (42.4%) | ||||
| 3 (72.2%) | 3 (27.8%) | ||||
| Age | 1 (63.8%) | 1 (36.2%) | 0.169 | 0.817 | 0.366 |
| 2 (51.1%) | 2 (48.9%) | ||||
| 3 (57.0%) | 3 (43.0%) | ||||
| Hospital size | Small (46.4%) | Small (53.6%) | −0.294 | 3.559 | 0.059 |
| Medium (57.2%) | Medium (42.8%) | ||||
| Large (58.3%) | Large (41.7%) | ||||
| Sex | Male (55.2%) | Male (44.8%) | −0.276 | 1.649 | 0.199 |
| Female (57.8%) | Female (42.2%) | ||||
| Previous hospital admissions | Yes (48.9%) | Yes (51.1%) | 0.147 | 0.372 | 0.542 |
| No (58.7%) | No (41.3%) | ||||
| Constant | −6.034 | 36.527 | 0.000 | ||
The final model including these four significant variables correctly classified 80.4% of cases (Chi-square=350. 02, df=4, p<0.01).
DiscussionIn this study, the metric properties of a questionnaire aimed at assessing patients’ perceptions of the care received in hospital medical services were revised. Reliability and construct validity were analysed, obtaining updated data about dimensionality questionnaire. These perceived quality dimensions were one-dimensional.
Cronbach's alpha coefficients were very satisfactory for most scales. Reliability coefficients were high for the dimensions of information, interpersonal manner and professional competence, and thus the overall score obtained with this questionnaire will serve to conduct comparisons between different hospital medical services, which is one of the objectives of its use. The value obtained for the organisational dimension was low compared to that obtained in the study by Granado et al. for the factor measuring “Administrative Quality”.22 This difference could be due to the fact that the response scale used in the study by Granado had a greater score range, as each item presented 10 response categories. The internal consistency of the comfort dimension was moderate. Thus, in view of the results, a larger number of items should be included to assess both the comfort and the organisational dimensions of hospital medical services.
The metric properties of the EMCA questionnaire, aimed at measuring satisfaction and perceived quality during hospitalisation in medical services, have shown to be valid and reliable for assessing these attributes, thus overcoming the methodological shortcomings of other instruments.6 The use of the EMCA questionnaire in other settings will enable external comparisons and benchmarking among hospitals.
The sample of cases analysed in this study, obtained from an acceptable response rate similar to that reported in the literature,23,24 came from a 4-year time series collected in nine public hospitals. The sample can therefore be considered representative, and ensures the generalisability of the results.
The overall value of 7.99 obtained for global satisfaction was high, and is similar to that reported in most of the literature, from classic studies such as the meta-analysis conducted by Hall and Dornan in 1998,25 to the most recent research.24,26
An analysis of the results for composite indicators of perceived quality revealed that the organisational and Information dimensions obtained the highest percentage of compliance satisfaction. In the case of the organisational dimension, this was due to high scores for aspects related to shift changes, continuity of care and management of visits, whilst for the dimension of information it was due to high scores for indicators related to clarity of information about the reason for admission, absence of contradictory information from staff, clear explanations of the treatment and care to be observed by the patient at home and the opportunity to ask doctors questions concerning the discharge report.
By contrast, the dimensions with the lowest percentage of compliance were comfort, mainly influenced by low scores for food and the general conditions of inpatient units, interpersonal manner and most especially the dimension of professional competence, which obtained the lowest level of compliance due to low scores for the professionalism of nursing and non-healthcare staff. However, a multivariate analysis revealed that these two dimensions, professional competence and interpersonal manner, together with Information, were the only ones which presented a statistically significant relationship with degree of satisfaction.
We coincided with most authors in considering information as one of the main determinants of satisfaction with inpatient care.27–30 The dimension of interpersonal manner, in particular as regards nursing staff, is also considered by several authors as an important determinant of satisfaction.23,27,30–32 As for organisational dimension, it is difficult to conduct a comparison of the results with respect to its influence on satisfaction, mainly due to the different components that are grouped together to form this dimension. With the exception of a few studies,2,30 and in contrast to the present study, this dimension is not usually considered an important predictor of satisfaction.
As in other studies, professional competence also appeared in this study as a determinant of satisfaction, although mainly in reference to the medical staff and almost always associated with the information received.27,28,30,33–35 However, other authors 23 have reported that the best predictor of satisfaction is treatment outcome, whereas Information has very little influence.
In this study a no statistically significant associations between sociodemographic variables and satisfaction level were found. These findings are similar to those obtained by authors such as Bjertnaes et al.,26 and different from those reported in other studies23,27,36 where statistically significant associations were found between satisfaction and age, gender and/or educational level.
In this paper we did not find any association between previous hospital admissions to the same centre and satisfaction, although some authors such as Quintana27 have reported that patients who have been admitted on earlier occasions tend to show a more critical attitude and present lower levels of satisfaction. It is necessary consider that satisfaction is a variable that usually shows a ceiling effect, that should be considered in future studies analysing the degree of insastifacción.
A potential limitation of this study was not to obtain patients’ opinions on the outcome of their hospitalisation, which has prevented an assessment of its influence on satisfaction with healthcare. It would be interesting to include items that inquire about reason for admission and outcome.
To conduct a metric analysis of the questionnaire, only those respondents who had completed all items were selected. Consequently, information corresponding to patients with missing data was not included in the multivariate analysis, which could suggest the existence of a possible selection bias in the results obtained. However, the lack of statistically significant differences with respect gender and the small effect size for age differences between the initial sample and the studied sample, indicate that the existence of such a bias can be virtually ruled out.
Another possible limitation of the study was that no information was collected regarding participants’ prior health status, a variable that other studies have shown can influence the degree of satisfaction expressed.1,37
In conclusion, the metric properties of the questionnaire used have been updated. The reliability values and percentage of explained variance were acceptable for all the dimensions analysed.
A valid and reliable questionnaire for assessing satisfaction in quality management programmes, both for internal purposes and for conducting external comparisons was obtained. This questionnaire is useful for clinicians and managers, enabling them to prioritise areas for intervention, those dimensions with greater room for improvement or those which have a greater impact on satisfaction.
A positive relationship between the degree of patient satisfaction and level of professional competence, interpersonal manner of healthcare staff and information received was found.
Conflict of interestThe authors declare no conflict of interest.