


Gastric adenocarcinoma is associated with Helicobacter pylori infection. The transition to a carcinogenic process is preceded by glandular atrophy and serum levels of pepsinogen I and II (PGI and PGII) correlate with this type of gastric lesions. Possible associations of serum PG levels in relation to the frequency of serological activity against H. pylori antigens were studied. Serum samples from patients with gastric pathology associated with H. pylori (n=26) and asymptomatic individuals as controls (n=37) were used. Seroactive antigens were identified by immunoblot using a protein extract of H. pylori. The antibody titers anti-H. pylori and the concentration of PGs in serum was determined by ELISA. Thirty-one seroactive antigens were identified, nine of which exhibited a differential frequency between both groups (116.7, 68.8, 61.9, 54.9, 45.6, 38.3, 36.5, 33.8 and 30.1kDa) and only 3 were related to altered levels of PGs in serum. In the control group, the seropositivity of the 33.8kDa antigen was related to an increase in PGII, while the 68.8kDa antigen was related to normal PG values (decreased PGII and elevated PGI/PGII levels) indicating that seropositivity to this antigen could be a protective factor to gastric pathology. The seropositivity of the 54.9kDa antigen was related to altered values of PGs indicative of inflammation and gastric atrophy (increased in PGII and decreased in PGI/PGII). The identification of serum alterations in pepsinogen levels related to seropositivity to H. pylori 33.8, 54.9 and 68.8kDa antigens sets a precedent for further study as possible prognostic serological biomarkers.
El adenocarcinoma gástrico se asocia con la infección por Helicobacter pylori. La transición a un proceso de carcinogénesis está precedida por atrofia glandular, y los niveles séricos de pepsinógeno I y II (PGI y PGII) se correlacionan con este tipo de lesiones gástricas. El objetivo del trabajo fue estudiar posibles asociaciones de los niveles de pepsinógenos (PG) en suero en relación con la frecuencia de actividad serológica hacia antígenos de H. pylori. Se utilizaron muestras de suero de pacientes con patología gástrica asociada a H. pylori (n=26) y de individuos asintomáticos como controles (n=37). Los antígenos seroactivos se identificaron mediante inmunoblot utilizando un extracto proteico de H. pylori. Los títulos de anticuerpos anti-H. pylori y la concentración de PG en suero se determinaron por ELISA. De los 31 antígenos seroactivos identificados, 9 presentaron una frecuencia diferencial entre ambos grupos (116,7; 68,8; 61,9; 54,9; 45,6; 38,3; 36,5; 33,8 y 30,1kDa) y solo 3 se relacionaron con niveles alterados de PG en suero. En el grupo control, la seropositividad del antígeno de 33,8kDa se relacionó con un aumento de PGII, mientras que el antígeno de 68,8kDa se relacionó con valores normales de PG (PGII disminuido y PGI/PGII elevado), sugiriendo que la seropositividad a este antígeno podría ser un factor protector frente a patologías gástricas. La seropositividad del antígeno de 54,9kDa se relacionó con valores alterados de PG indicadores de inflamación y atrofia gástrica (aumento de PGII y disminución de PGI/PGII). La identificación de alteraciones séricas en los niveles de pepsinógeno relacionadas con la seropositividad a los antígenos de 33,8; 54,9 y 68,8kDa de H. pylori sienta un precedente para futuros estudios como posibles biomarcadores serológicos pronósticos.
The origin of various diseases present at the gastric and duodenal level can be related to multiple factors, whether genetic or environmental, including stress and diet, among others42. However, in the last four decades, gastric colonization of the bacterium Helicobacter pylori has become the factor most strongly associated with the development of gastric pathologies such as various types of gastritis, peptic ulcers, mucosa-associated lymphoid tissue lymphoma (MALT-lymphoma) and gastric adenocarcinoma2,4,22. This last pathology is related to the higher mortality rate associated with H. pylori. Studies indicate that the relative risk of developing gastric cancer is 2–3 times higher in individuals infected with the bacteria compared to uninfected people38. Worldwide, gastric cancer is an important oncologic problem, recently being considered the fifth most frequent malignancy and the third cause of death related to cancer, with around 780000 annual deaths related to this disease worldwide30.
The evolutionary course for the development of gastric cancer was initially characterized before the discovery of H. pylori and later, through multiple studies, it was correlated with the presence of the bacterium in the gastric mucosa15,34. The process begins with the transformation of the normal mucosa to the development of chronic superficial gastritis (non-atrophic gastritis) caused by gastric colonization of the bacterium and characterized by high secretory glandular activity that generally causes conditions of hyperchlorhydria27. Some individuals with chronic superficial gastritis show a transition from chronic superficial gastritis to the development of glandular atrophy (chronic atrophic gastritis), characterized by loss of parietal cells and subsequent reduction in acid secretion14. The feedback mechanisms for the reduction of HCl generated by glandular atrophy can cause the alteration of the levels of some gastric hormones. Particularly, the elevation of the hormone gastrin is established as an important risk factor for malignancy due to its mitogenic effect on gastric mucosal cells that promotes hyperplasia of these cells31,35.
Pepsin is an important gastric hydrolytic enzyme formed from a family of inactive polypeptide precursors called pepsinogens. According to their physical and electrophoretic characteristics, pepsinogens are classified into 2 main types, pepsinogen I (PGI) and pepsinogen II (PGII)5. Both zymogens are expressed in the human stomach by chief cells and mucosal neck cells. However, while PGI presents an expression restricted only to the gastric cells mentioned above, PGII is produced by cells of other anatomical portions of the stomach such as cardia, pylorus and duodenal cells of Brunner's glands18. Pepsinogens are mainly excreted into the stomach lumen although about 1% of the total proenzyme produced enters the bloodstream. There are multiple studies that show that serum levels of PGI and PGII correlate with pathological conditions present in the stomach such as chronic atrophic gastritis and intestinal metaplasia6. During these pathologies, it has been identified that the PGI/PGII ratio in serum is altered as a consequence of the modification of the number of gastric cells that produce both zymogens20. In the case of advanced glandular atrophy, a decrease in PGI has been identified as a consequence of the destruction of the cells that produce this proenzyme, and an increase in PGII due to the replacement of principal cells by Brunner's glands that produce PGII1.
Immunoenzymatic diagnostic methods such as immunoblot are widely used in serological epidemiological studies because they are non-invasive procedures36. Using the immunoblot analysis, various studies have made it possible to identify the correlation between the development of gastroduodenal pathologies and seropositivity toward specific H. pylori antigens32. Non-cardiac gastric carcinoma has been identified as a pathology that presents a high association with CagA protein seropositivity with more significant correlations by the immunoblot analysis with respect to other methodologies26. However, the association of alterations in serum pepsinogen levels as indicator parameters of gastric mucosal involvement and formation of atrophic lesions have not been sufficiently studied in correlation with seropositivity toward specific bacterial antigens. In the present study, an analysis was carried out to determine possible correlations in the development of gastroduodenal diseases caused by H. pylori with serological markers such as PGI and PGII levels and seroactivity toward H. pylori antigens using a total protein extract of the bacterium.
MethodologySubjectsThe study considered individuals over 18 years of age who attended the Endoscopy Unit of Clinic 10 of the IMSS in the city of Aguascalientes, Mexico. The patient group included individuals whose clinical history and endoscopic analyses (UGI Endoscopy) determined the existence of gastric pathology associated with H. pylori infection. The patient group was subclassified into individuals with and without glandular atrophy, determined by histopathological analyses performed on biopsies of the gastric body and pyloric antrum collected during endoscopy. Glandular atrophy was defined as the loss of normal (native) glands, accompanied by the presence of fibrosis and fibromuscular proliferation in the lamina propria. The control group included asymptomatic individuals to the existence of gastric diseases related to H. pylori infection, identified by the clinical history and endoscopic analysis of the volunteers. Individuals who had received H. pylori eradication treatment or the administration of proton pump inhibitor drugs in the last 6 weeks were not included in the study. All the individuals included in the study signed an informed consent letter. The study adhered to the Declaration of Helsinki and was approved by the Bioethics Committee of the Autonomous University of Aguascalientes CIB-UAA-26.
Collection of serological samplesBlood samples were collected by venipuncture in the forearm. After allowing coagulation for 2–5h at room temperature, the sample was centrifuged and serum specimens were stored at −70°C until use.
H. pylori protein extractOne clinical isolate of H. pylori cagA+ bacteria was used, previously characterized by biochemical tests (urease and catalase), Gram stain and molecular analysis for PCR amplification of ureC and cagA19,33. The bacteria were grown on 8% sheep blood agar plates at 37°C for 72h in a microaerophilic atmosphere. The soluble protein extract was obtained by sonication in phosphate buffered saline (PBS, pH 7.4), 1% triton X-100 and a mixture of protease inhibitors (EDTA 1mM, PMSF 1mM, aprotinin 0.6μM and leupeptin 2μM), the insoluble material was removed by centrifugation. In the supernatant obtained, the protein concentration was quantified by the Bradford method with reading at 595nm in a spectrophotometer (7305-Jenway) and the protein extract was stored at −70°C until use.
Determination of anti-HP antibodies by the ELISA assayThe 96-well ELISA plates were sensitized with H. pylori protein extract (9μg/ml) in carbonate buffer pH 9.6 (7.3mM Na2CO3, 17.4mM NaHCO3) for 24h (4°C), then washed 4 times with PBS. It was blocked for 1h with 100μl/well PBS-Tween 3% powdered milk, then 50μl of the serum sample (1:200 dilution) were added and incubated at 37°C for 1h, followed by 4 washes with PBS. A volume of 50μl of anti-IgG conjugated to alkaline phosphatase (Cat. 6760, AbCam) in 1:300 dilution was added to the plate with incubation at 37°C for 1h, followed by 4 washes with PBS. For development, p-nitrophenyl phosphate tablets (Cat. N9389, Sigma) were used according to the manufacturer's instructions. The plate was read in an ELISA reader (ELX800, Biotek) at 405nm. The cutoff point to determine serological positivity to H. pylori was based on the formula: Cutoff=Xneg+0.13Xpos, where Xneg corresponds to the absorbance present in the negative control serum (newborn serum) and Xpos, absorbance of the positive control serum12. The cutoff obtained was applied to discriminate serological positivity in both populations, such as a parameter related to the interaction of bacterial infection with the individual.
Polyacrylamide gel electrophoresis and immunoblotThe protein extract of H. pylori (170μg) was loaded into a comb with a wide well (6cm) and was separated by vertical 10% polyacrylamide gel electrophoresis (SDS-PAGE) and subsequently electrotransferred to a PVDF membrane (Inmobilon, Merck Millipore) for 24h. The membrane was cut into strips and stored at −20°C to be used individually later. To perform the immunoblot, the membrane strips were blocked for 24h with TBS (buffer Tris–HCl saline pH 7.5) with 1% milk powder, followed by 3 washes with TTBS (TBS at 0.2% Tween 20) to later incubate for 2h with agitation in TBS 1% milk with the serum samples from each individual in 1:500 dilution. Subsequently, 3 washes were performed with TTBS followed by a 2-h incubation in TBS at 1% milk with the anti-IgG antibody conjugated with alkaline phosphatase (Cat. AB6760, AbCam) at 1:9000 dilution. Three washes were performed with TTBS and the BCIP/NBT chromogenic substrate (Cat. B-5655, Sigma) was added to the manufacturer's instructions for the development and identification of bands. The dilutions of the antibodies (primary/secondary) used in the study were optimized based on the absence of bands using a negative control serum for H. pylori (newborn individual serum).
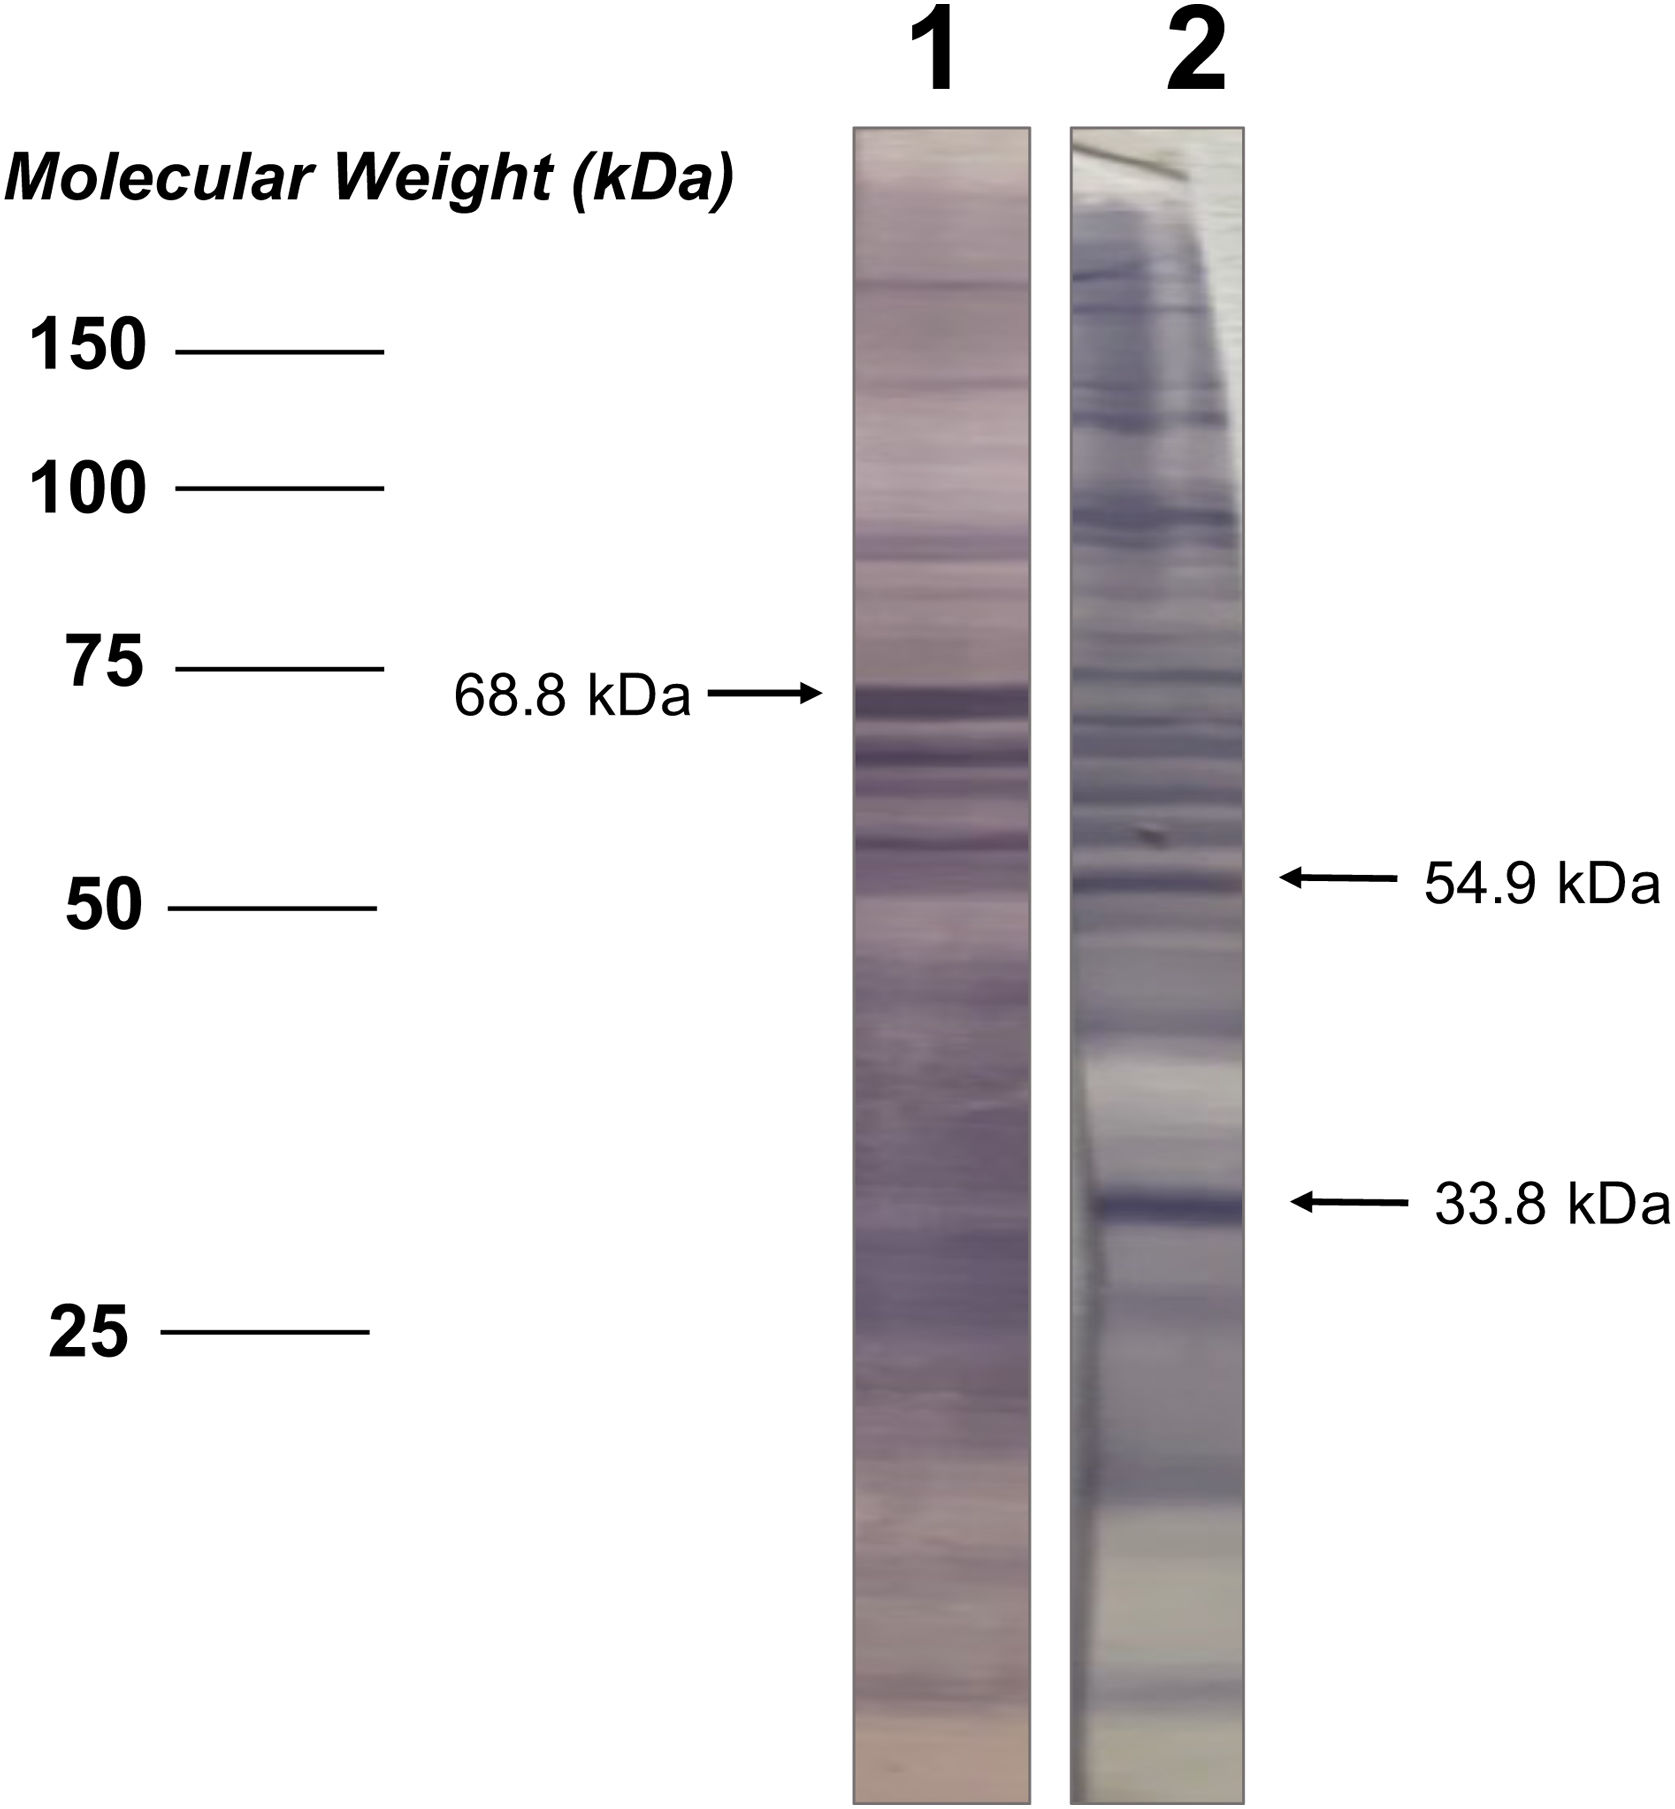
Analysis of seroactive antigens in the immunoblotThe bands in the immunoblot strips from each serum sample were considered seroactive antigens and were manually measured to determine their corresponding molecular weight (kDa), performing a linear regression analysis between the distances of each band and the weight marker included in the electrophoretic migration (Fig. 1). In order to eliminate serological reactivity toward very low frequency antigens from the study and improve the statistical analysis of seroactive antigens, those immunoblot bands that were present in 5 or fewer individuals in both the patient and the control group were not considered.
Determination of pepsinogen I and II in serum. Results show a control individual (1) seropositive for SAA of 68.8kDa (arrow on the left) as well as a patient (2) with seropositivity for SAA of 54.9 and 33.8kDa (arrows on the right).")
The analysis was performed applying an antigen capture ELISA protocol using commercial assays for the quantification of both pepsinogens (Cat. RAB0722 and RAB0723, Sigma-Aldrich). The manufacturer's instructions were followed considering a dilution of the serological samples of 1:10 in PBS.
Statistic analysisThe comparisons between continuous variables were made using the Student's t-test and one-way ANOVA followed by Dunnett's multiple comparison. Categorical variables were represented as percentage and simple frequency, and were analyzed using the Fisher's exact test. The binary regression analysis to determine the odds ratio (OR) was performed using the McNemar's method. For statistical calculations, Prisma GraphPad Software (ver6.0c) and QuickCalcs (www.graphpad.com) were used. Spearman's bivariate correlation analysis was performed by applying the formula: ρ=1−(6∑d2)/n(n2−1)16. The correlation was considered either positive/negative and either high/moderate/low (high, ρ value of 0.7–0.9; moderate, ρ value of 0.5–0.7; low ρ value <0.5; no association ρ value <0.1) according to the scale described by Mukaka17.
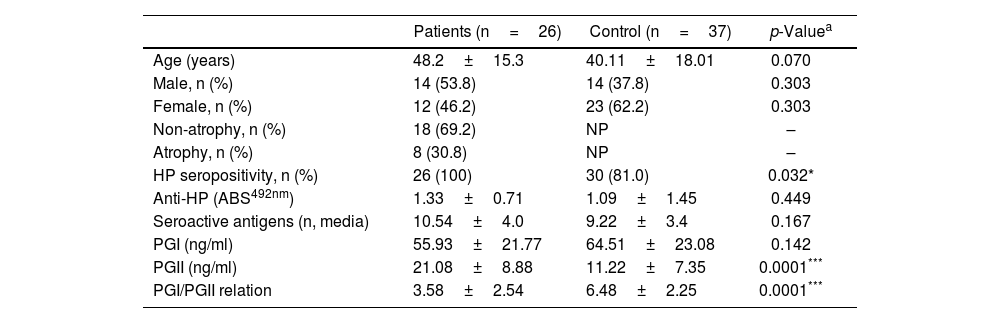
ResultsDescription of the populations studiedThe characteristics of the studied populations are indicated in Table 1. The gender comparison between the individuals included in the group of patients with gastroduodenal pathology and the control group indicated an equivalent male–female ratio between the groups (p=0.303). Similarly, the average age between both populations did not show a significant difference (p=0.070). Within the patient population, it was identified that 30.8% of the subjects presented manifestation of glandular atrophy.
Characteristics of the study population and comparisons between the groups of patients with gastric pathology and the control group.
| Patients (n=26) | Control (n=37) | p-Valuea | |
|---|---|---|---|
| Age (years) | 48.2±15.3 | 40.11±18.01 | 0.070 |
| Male, n (%) | 14 (53.8) | 14 (37.8) | 0.303 |
| Female, n (%) | 12 (46.2) | 23 (62.2) | 0.303 |
| Non-atrophy, n (%) | 18 (69.2) | NP | – |
| Atrophy, n (%) | 8 (30.8) | NP | – |
| HP seropositivity, n (%) | 26 (100) | 30 (81.0) | 0.032* |
| Anti-HP (ABS492nm) | 1.33±0.71 | 1.09±1.45 | 0.449 |
| Seroactive antigens (n, media) | 10.54±4.0 | 9.22±3.4 | 0.167 |
| PGI (ng/ml) | 55.93±21.77 | 64.51±23.08 | 0.142 |
| PGII (ng/ml) | 21.08±8.88 | 11.22±7.35 | 0.0001*** |
| PGI/PGII relation | 3.58±2.54 | 6.48±2.25 | 0.0001*** |
The determination of anti-H. pylori by ELISA cut-off analysis identified that the total number of individuals in the patient group was seropositive for the bacterium, while in the control group this positivity was present in 80% of the individuals (p=0.032) (Table 1). However, the antibody titer evaluated by optical density readings showed that the average absorbance values in the patient and control populations were statistically equivalent (p=0.449) (Table 1).
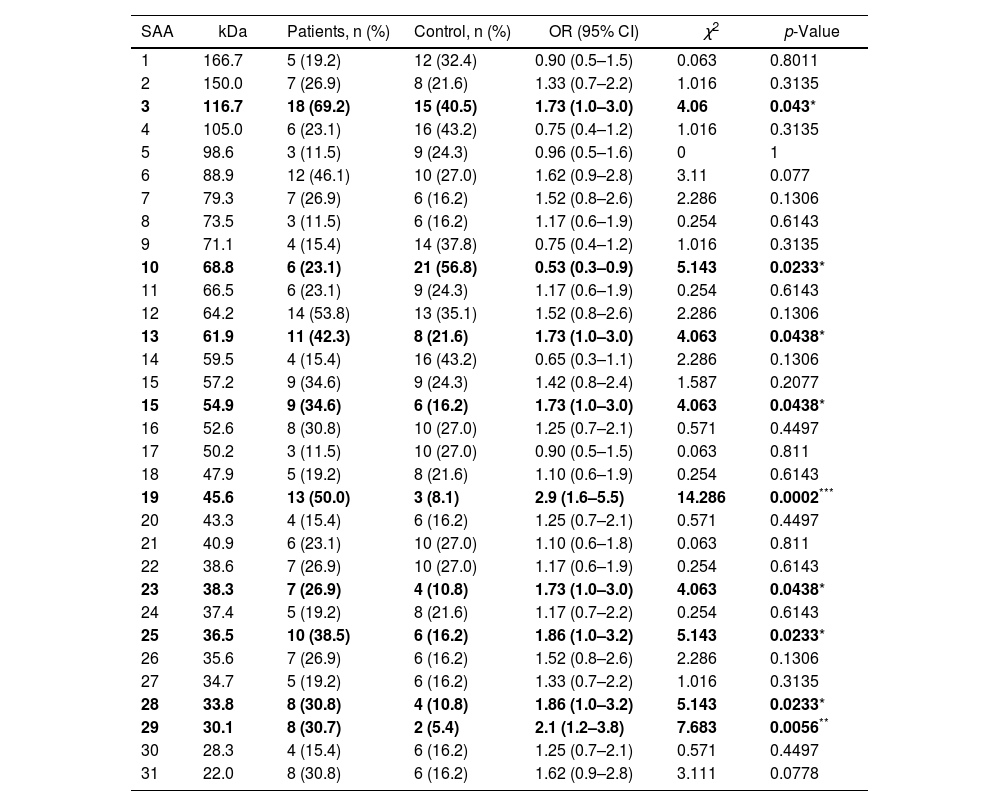
Additionally, the serological samples from the study groups were used to identify the existence of seroactive antigens toward H. pylori through an immunoblot analysis. The average number of seroactive antigens identified for each individual in the patient group was similar to the control group (p=0.167) (Table 1). When the molecular weights of the bands obtained in the immunoblot typing of the seroactive antigens corresponding to all the individuals analyzed in both groups were considered, a total of 31 different antigens were identified (Table 2). Through a frequency analysis, it was determined that 9 of the identified seroactive antigens exhibited a significant differential frequency between both study groups (Table 2). Finding that in 8 of them (116.7, 61.9, 54.9, 45.6, 38.3, 36.6, 33.8 and 30.1kDa) there was a significantly higher frequency in the group of patients in relation to the control group (p<0.05) and with an odd ratio greater than 1.7 (1.70, 1.73, 1.73, 2.93, 1.73, 1.86, 1.86 and 2.1 OR, respectively). In contrast, only the 68.8kDa seroactive antigen was more frequent in the control group (0.537 OR; p=0.023).
Frequency of seroactive antigens (SAA) identified in the patient and control groups by the immunoblot analysis.
| SAA | kDa | Patients, n (%) | Control, n (%) | OR (95% CI) | χ2 | p-Value |
|---|---|---|---|---|---|---|
| 1 | 166.7 | 5 (19.2) | 12 (32.4) | 0.90 (0.5–1.5) | 0.063 | 0.8011 |
| 2 | 150.0 | 7 (26.9) | 8 (21.6) | 1.33 (0.7–2.2) | 1.016 | 0.3135 |
| 3 | 116.7 | 18 (69.2) | 15 (40.5) | 1.73 (1.0–3.0) | 4.06 | 0.043* |
| 4 | 105.0 | 6 (23.1) | 16 (43.2) | 0.75 (0.4–1.2) | 1.016 | 0.3135 |
| 5 | 98.6 | 3 (11.5) | 9 (24.3) | 0.96 (0.5–1.6) | 0 | 1 |
| 6 | 88.9 | 12 (46.1) | 10 (27.0) | 1.62 (0.9–2.8) | 3.11 | 0.077 |
| 7 | 79.3 | 7 (26.9) | 6 (16.2) | 1.52 (0.8–2.6) | 2.286 | 0.1306 |
| 8 | 73.5 | 3 (11.5) | 6 (16.2) | 1.17 (0.6–1.9) | 0.254 | 0.6143 |
| 9 | 71.1 | 4 (15.4) | 14 (37.8) | 0.75 (0.4–1.2) | 1.016 | 0.3135 |
| 10 | 68.8 | 6 (23.1) | 21 (56.8) | 0.53 (0.3–0.9) | 5.143 | 0.0233* |
| 11 | 66.5 | 6 (23.1) | 9 (24.3) | 1.17 (0.6–1.9) | 0.254 | 0.6143 |
| 12 | 64.2 | 14 (53.8) | 13 (35.1) | 1.52 (0.8–2.6) | 2.286 | 0.1306 |
| 13 | 61.9 | 11 (42.3) | 8 (21.6) | 1.73 (1.0–3.0) | 4.063 | 0.0438* |
| 14 | 59.5 | 4 (15.4) | 16 (43.2) | 0.65 (0.3–1.1) | 2.286 | 0.1306 |
| 15 | 57.2 | 9 (34.6) | 9 (24.3) | 1.42 (0.8–2.4) | 1.587 | 0.2077 |
| 15 | 54.9 | 9 (34.6) | 6 (16.2) | 1.73 (1.0–3.0) | 4.063 | 0.0438* |
| 16 | 52.6 | 8 (30.8) | 10 (27.0) | 1.25 (0.7–2.1) | 0.571 | 0.4497 |
| 17 | 50.2 | 3 (11.5) | 10 (27.0) | 0.90 (0.5–1.5) | 0.063 | 0.811 |
| 18 | 47.9 | 5 (19.2) | 8 (21.6) | 1.10 (0.6–1.9) | 0.254 | 0.6143 |
| 19 | 45.6 | 13 (50.0) | 3 (8.1) | 2.9 (1.6–5.5) | 14.286 | 0.0002*** |
| 20 | 43.3 | 4 (15.4) | 6 (16.2) | 1.25 (0.7–2.1) | 0.571 | 0.4497 |
| 21 | 40.9 | 6 (23.1) | 10 (27.0) | 1.10 (0.6–1.8) | 0.063 | 0.811 |
| 22 | 38.6 | 7 (26.9) | 10 (27.0) | 1.17 (0.6–1.9) | 0.254 | 0.6143 |
| 23 | 38.3 | 7 (26.9) | 4 (10.8) | 1.73 (1.0–3.0) | 4.063 | 0.0438* |
| 24 | 37.4 | 5 (19.2) | 8 (21.6) | 1.17 (0.7–2.2) | 0.254 | 0.6143 |
| 25 | 36.5 | 10 (38.5) | 6 (16.2) | 1.86 (1.0–3.2) | 5.143 | 0.0233* |
| 26 | 35.6 | 7 (26.9) | 6 (16.2) | 1.52 (0.8–2.6) | 2.286 | 0.1306 |
| 27 | 34.7 | 5 (19.2) | 6 (16.2) | 1.33 (0.7–2.2) | 1.016 | 0.3135 |
| 28 | 33.8 | 8 (30.8) | 4 (10.8) | 1.86 (1.0–3.2) | 5.143 | 0.0233* |
| 29 | 30.1 | 8 (30.7) | 2 (5.4) | 2.1 (1.2–3.8) | 7.683 | 0.0056** |
| 30 | 28.3 | 4 (15.4) | 6 (16.2) | 1.25 (0.7–2.1) | 0.571 | 0.4497 |
| 31 | 22.0 | 8 (30.8) | 6 (16.2) | 1.62 (0.9–2.8) | 3.111 | 0.0778 |
Approximate molecular weight (kDa) is shown. The SAA with a significant differential percentage frequency between both groups is indicated in bold letters. Statistical comparison was performed using the McNemar's test, indicating the odds ratio (OR), confidence interval (95% CI) and Chi square (χ2) values. *p<0.05, **p<0.01, ***p<0.001 were considered statistically significant values.
In order to discover a possible relationship between the presence of glandular atrophy and serological reactivity toward the 9 previously identified antigens with differential frequency, a comparison of their frequency was conducted between the subgroups of patients with atrophy and those without atrophy (Table 3). This analysis revealed that only 5 showed a differential frequency (68.8, 61.9, 36.5, 33.8 and 30.1kDa), which was related to a greater presence in patients without glandular atrophy.
Frequency of seroactive antigens (SAA) in the subpopulations of patients with atrophy and without atrophy.
| SAA (kDa) | Patients | p-Value | ||
|---|---|---|---|---|
| Total | Atrophy | Non-atrophy | ||
| 116.7 | 18 | 6 | 12 | 1.000 |
| 68.8 | 6 | 0 | 6 | 0.002** |
| 61.9 | 11 | 2 | 9 | 0.008** |
| 54.9 | 9 | 3 | 6 | 0.364 |
| 45.6 | 13 | 4 | 9 | 0.115 |
| 38.3 | 7 | 4 | 3 | 1.000 |
| 36.5 | 10 | 2 | 8 | 0.002** |
| 33.8 | 8 | 1 | 7 | 0.010* |
| 30.1 | 8 | 0 | 8 | 0.0002*** |
The number of patients positive for seroactive antigens (SAA) in the total number of patients and within the atrophy and non-atrophy subgroups is indicated. Statistical comparison was determined using Fisher's exact test; *p<0.05, **p<0.01, ***p<0.001 were considered statistically significant values.
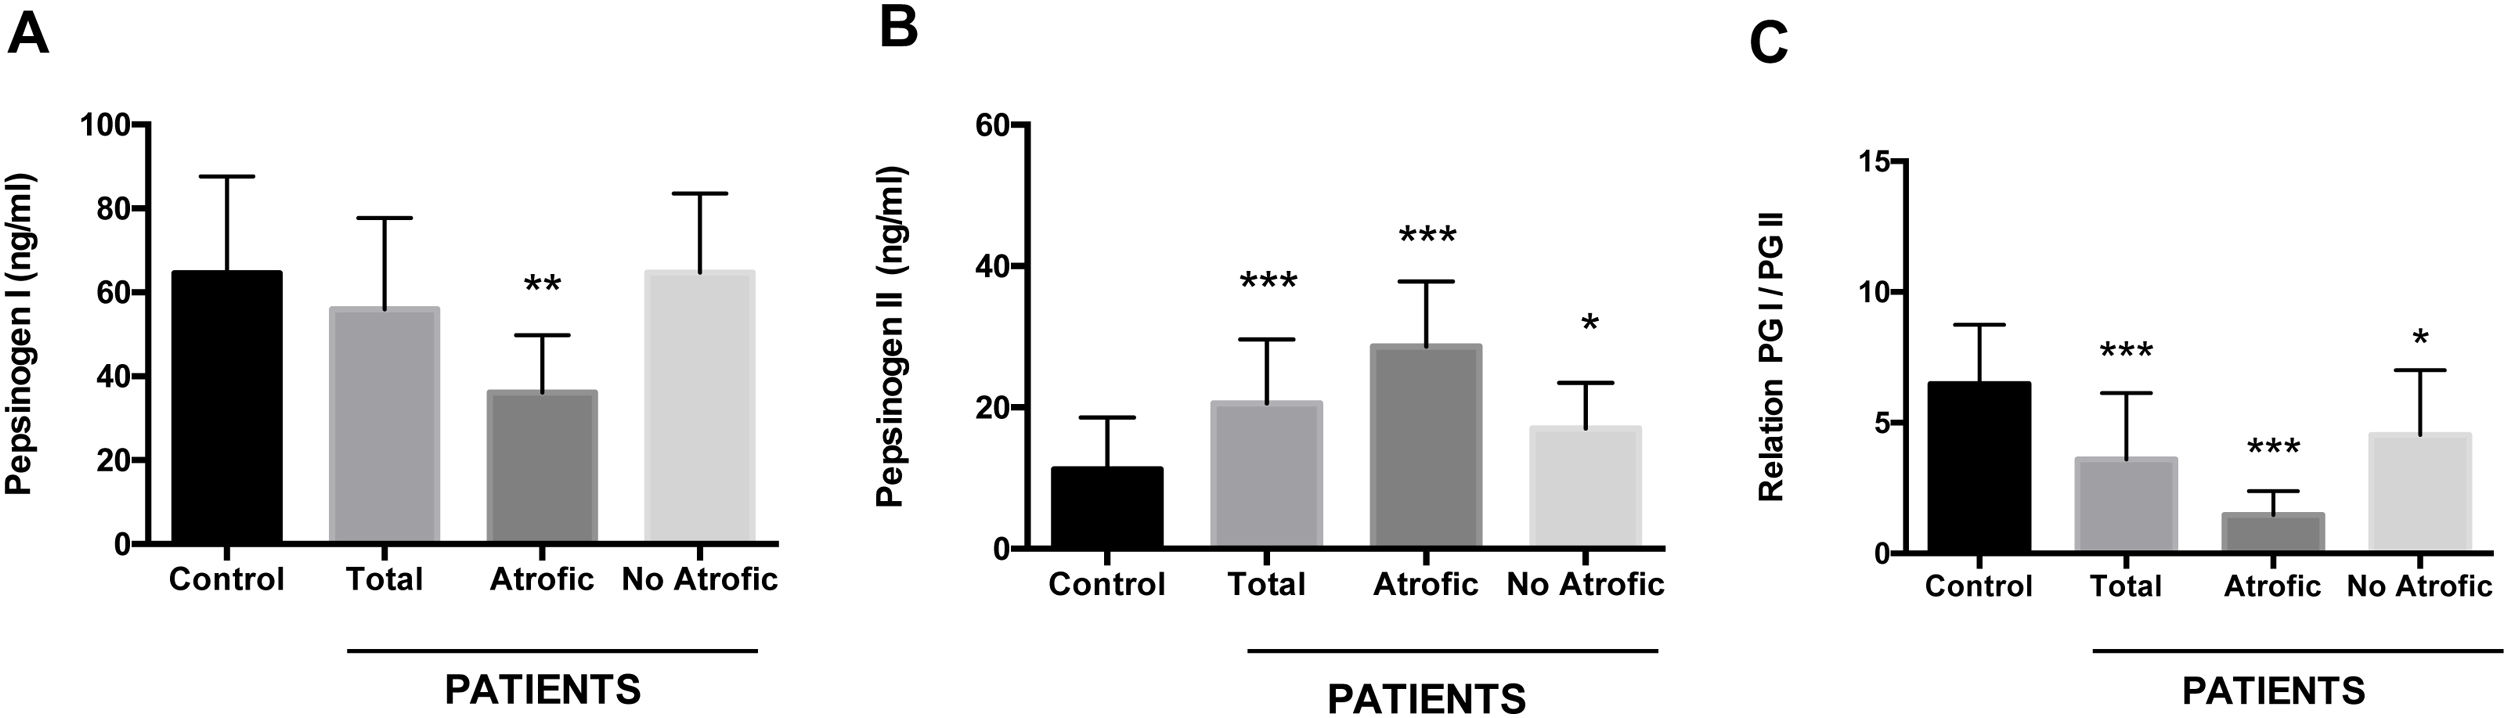
Using an antigen-capture ELISA assay, the serum concentration of gastric zymogens PGI and PGII was determined in both populations. In the case of PGI, the serum levels of the individuals from both the patient and control groups showed statistically equivalent average values (p=0.142) (Table 1). The average level of PGII was significantly higher in the patient group (21.08±8.88ng/ml) compared to the control group (11.22±7.35ng/ml) (p=0.0001). The average PGI/PGII ratio was considerably higher in the control group compared to the patients (6.48±2.25 and 3.58±2.54ng/ml, respectively, p=0.0001) (Table 1). To analyze the relationship of the levels of gastric zymogens in relation to the presence of glandular atrophy in the patient population, these were classified into atrophy and non-atrophy subgroups. It was found that the subgroup of patients with atrophy was the only one that showed a significantly lower average level of PGI compared to the control group (36.14±13.65 and 64.51±23.08ng/ml, respectively, p=0.005) (Fig. 2A). The mean serological concentration of PGII in the control individuals (11.22±7.35ng/ml) was significantly lower than that observed for the atrophy and non-atrophy subgroups (28.65±9.15 and 17.0±6.48ng/ml, respectively, p<0.0001) (Fig. 2B). The mean PGI/PGII ratio in both patient subgroups was lower relative to controls (6.48±2.25) (Fig. 1C), highlighting that the lowest PGI/PGII ratio identified was observed in individuals with glandular atrophy (1.46±0.91), being statistically lower than the mean value in patients without atrophy (4.53±2.47) (p=0.0026) (Fig. 2C).
 and total patients (n=26) as well as for the subgroups of patients with atrophy (n=8) and without atrophy (n=18). (A) Pepsinogen I, (B) pepsinogen II, and (C) pepsinogen I/pepsinogen II ratio (PGI/PGII). ANOVA, Dunnett's multiple comparison test was used to distinguish the level of significance based on *p<0.05, **p<0.01 and ***p<0.001 compared to the control group. The mean value±standard deviation is represented.")
Serum concentration of pepsinogens determined by antigen capture ELISA. Results are indicated for control group (n=37) and total patients (n=26) as well as for the subgroups of patients with atrophy (n=8) and without atrophy (n=18). (A) Pepsinogen I, (B) pepsinogen II, and (C) pepsinogen I/pepsinogen II ratio (PGI/PGII). ANOVA, Dunnett's multiple comparison test was used to distinguish the level of significance based on *p<0.05, **p<0.01 and ***p<0.001 compared to the control group. The mean value±standard deviation is represented.
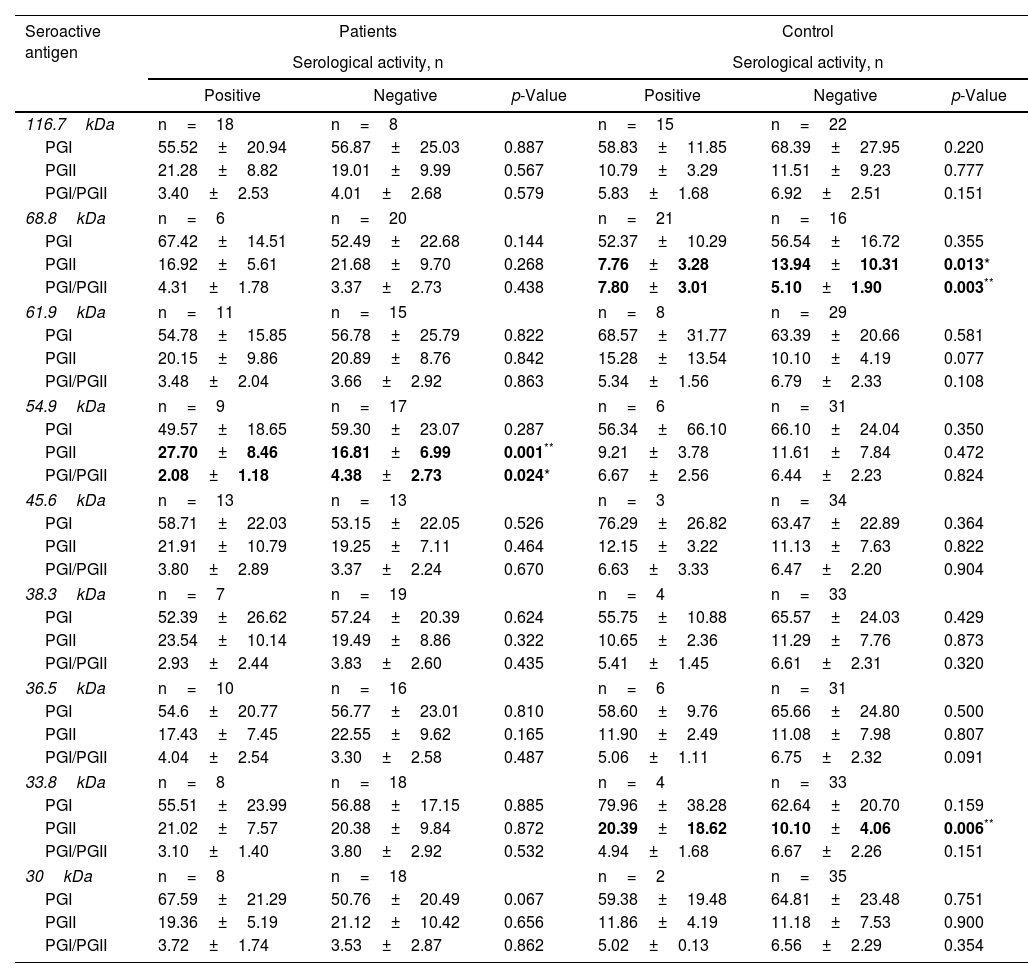
Subsequently, it was sought to know if the serological activity toward the 9 differential antigens was related to alterations in the levels of pepsinogens in serum. For which purpose, the average levels of PGs present in seropositive and seronegative individuals for each seroactive antigen in both study groups were compared (Table 4). Seropositivity toward the 68.8kDa antigen was related in the control group with a decrease in PGII levels in relation to seronegative individuals (7.76±3.28 vs 13.94±10.31, p=0.013) as well as with an increase in the PGI/PGII ratio (7.80±3.01 vs 5.10±1.90, p=0.003). In the patient group, the 54.9kDa seroactive antigen was associated with a highly significant increase in PGII in relation to seronegative patients (27.70±8.46 vs 16.81±6.99, p=0.0018) and a decrease in the PGI/PGII ratio (2.08±1.83 vs 4.38±2.73, p=0.024). Control individuals with serological activity toward the 33.8kDa antigen were associated with a highly significant increase in PGII (20.39±18.62 vs 10.10±4.06, p=0.0064). Serological activity toward the remaining antigens (116.7, 61.9, 45.6, 38.3, 36.5 and 30.1kDa) was not related to differences in pepsinogen levels between seropositive and seronegative individuals for both groups.
Relationship of serological activity of seroactive antigens with changes in the level of concentration of pepsinogens in serum.
| Seroactive antigen | Patients | Control | ||||
|---|---|---|---|---|---|---|
| Serological activity, n | Serological activity, n | |||||
| Positive | Negative | p-Value | Positive | Negative | p-Value | |
| 116.7kDa | n=18 | n=8 | n=15 | n=22 | ||
| PGI | 55.52±20.94 | 56.87±25.03 | 0.887 | 58.83±11.85 | 68.39±27.95 | 0.220 |
| PGII | 21.28±8.82 | 19.01±9.99 | 0.567 | 10.79±3.29 | 11.51±9.23 | 0.777 |
| PGI/PGII | 3.40±2.53 | 4.01±2.68 | 0.579 | 5.83±1.68 | 6.92±2.51 | 0.151 |
| 68.8kDa | n=6 | n=20 | n=21 | n=16 | ||
| PGI | 67.42±14.51 | 52.49±22.68 | 0.144 | 52.37±10.29 | 56.54±16.72 | 0.355 |
| PGII | 16.92±5.61 | 21.68±9.70 | 0.268 | 7.76±3.28 | 13.94±10.31 | 0.013* |
| PGI/PGII | 4.31±1.78 | 3.37±2.73 | 0.438 | 7.80±3.01 | 5.10±1.90 | 0.003** |
| 61.9kDa | n=11 | n=15 | n=8 | n=29 | ||
| PGI | 54.78±15.85 | 56.78±25.79 | 0.822 | 68.57±31.77 | 63.39±20.66 | 0.581 |
| PGII | 20.15±9.86 | 20.89±8.76 | 0.842 | 15.28±13.54 | 10.10±4.19 | 0.077 |
| PGI/PGII | 3.48±2.04 | 3.66±2.92 | 0.863 | 5.34±1.56 | 6.79±2.33 | 0.108 |
| 54.9kDa | n=9 | n=17 | n=6 | n=31 | ||
| PGI | 49.57±18.65 | 59.30±23.07 | 0.287 | 56.34±66.10 | 66.10±24.04 | 0.350 |
| PGII | 27.70±8.46 | 16.81±6.99 | 0.001** | 9.21±3.78 | 11.61±7.84 | 0.472 |
| PGI/PGII | 2.08±1.18 | 4.38±2.73 | 0.024* | 6.67±2.56 | 6.44±2.23 | 0.824 |
| 45.6kDa | n=13 | n=13 | n=3 | n=34 | ||
| PGI | 58.71±22.03 | 53.15±22.05 | 0.526 | 76.29±26.82 | 63.47±22.89 | 0.364 |
| PGII | 21.91±10.79 | 19.25±7.11 | 0.464 | 12.15±3.22 | 11.13±7.63 | 0.822 |
| PGI/PGII | 3.80±2.89 | 3.37±2.24 | 0.670 | 6.63±3.33 | 6.47±2.20 | 0.904 |
| 38.3kDa | n=7 | n=19 | n=4 | n=33 | ||
| PGI | 52.39±26.62 | 57.24±20.39 | 0.624 | 55.75±10.88 | 65.57±24.03 | 0.429 |
| PGII | 23.54±10.14 | 19.49±8.86 | 0.322 | 10.65±2.36 | 11.29±7.76 | 0.873 |
| PGI/PGII | 2.93±2.44 | 3.83±2.60 | 0.435 | 5.41±1.45 | 6.61±2.31 | 0.320 |
| 36.5kDa | n=10 | n=16 | n=6 | n=31 | ||
| PGI | 54.6±20.77 | 56.77±23.01 | 0.810 | 58.60±9.76 | 65.66±24.80 | 0.500 |
| PGII | 17.43±7.45 | 22.55±9.62 | 0.165 | 11.90±2.49 | 11.08±7.98 | 0.807 |
| PGI/PGII | 4.04±2.54 | 3.30±2.58 | 0.487 | 5.06±1.11 | 6.75±2.32 | 0.091 |
| 33.8kDa | n=8 | n=18 | n=4 | n=33 | ||
| PGI | 55.51±23.99 | 56.88±17.15 | 0.885 | 79.96±38.28 | 62.64±20.70 | 0.159 |
| PGII | 21.02±7.57 | 20.38±9.84 | 0.872 | 20.39±18.62 | 10.10±4.06 | 0.006** |
| PGI/PGII | 3.10±1.40 | 3.80±2.92 | 0.532 | 4.94±1.68 | 6.67±2.26 | 0.151 |
| 30kDa | n=8 | n=18 | n=2 | n=35 | ||
| PGI | 67.59±21.29 | 50.76±20.49 | 0.067 | 59.38±19.48 | 64.81±23.48 | 0.751 |
| PGII | 19.36±5.19 | 21.12±10.42 | 0.656 | 11.86±4.19 | 11.18±7.53 | 0.900 |
| PGI/PGII | 3.72±1.74 | 3.53±2.87 | 0.862 | 5.02±0.13 | 6.56±2.29 | 0.354 |
The average PG levels with a significant difference between seropositive and seronegative groups of patients and controls are indicated in bold letters. The average concentration of PGI and PGII (ng/ml) is shown, as well as the average value of the PGI/PGII ratio present in seropositive or seronegative individuals for each of the indicated seroactive antigens. The statistical comparison of means was carried out using the Student's t-test; *p<0.05 and **p<0.01 were considered statistically significant.
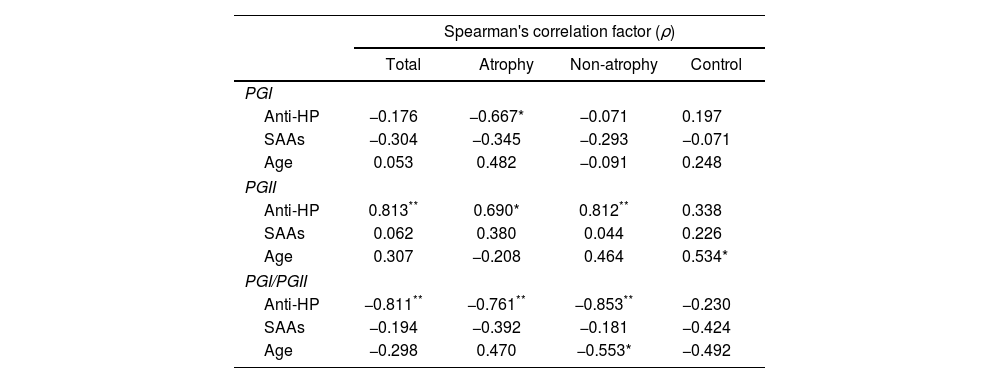
Finally, a bivariate Spearman's analysis was performed on the total number of patients and subgroups of patients with and without atrophy to discover possible correlations between pepsinogen levels and anti-H. pylori antibody titers, number of seroactive antigens and age (Table 5). The levels of PGI exhibited a moderate inverse correlation only with the anti-H. pylori values of absorbance (ABS) in individuals with atrophy (ρ=−0.670). The serum concentration of PGII had a high positive correlation with anti-H. pylori ABS in the total number of patients (ρ=0.813) and in the subgroup without atrophy (ρ=0.812) as well as a moderate correlation in the patients with atrophy (ρ=0.690). This zymogen also correlated positively with age, but only in the control group (ρ=0.534). The PGI/PGII ratio showed high inverse correlations with anti-H. pylori ABS in all the patients, with or without atrophy (ρ=−0.811, −0.761 and −0.853, respectively) contrasting with the low association present in the control. Age in the subgroup of patients without atrophy had a moderate inverse correlation (ρ=−0.553) with the PGI/PGII ratio.
Bivariate correlation analysis of serum pepsinogen levels.
| Spearman's correlation factor (ρ) | ||||
|---|---|---|---|---|
| Total | Atrophy | Non-atrophy | Control | |
| PGI | ||||
| Anti-HP | −0.176 | −0.667* | −0.071 | 0.197 |
| SAAs | −0.304 | −0.345 | −0.293 | −0.071 |
| Age | 0.053 | 0.482 | −0.091 | 0.248 |
| PGII | ||||
| Anti-HP | 0.813** | 0.690* | 0.812** | 0.338 |
| SAAs | 0.062 | 0.380 | 0.044 | 0.226 |
| Age | 0.307 | −0.208 | 0.464 | 0.534* |
| PGI/PGII | ||||
| Anti-HP | −0.811** | −0.761** | −0.853** | −0.230 |
| SAAs | −0.194 | −0.392 | −0.181 | −0.424 |
| Age | −0.298 | 0.470 | −0.553* | −0.492 |
The Spearman's correlation factor (ρ) of PG levels with respect to anti-H. pylori (anti-HP) antibody titers, number of seroactive antigens (SAAs) and age, for all patients (total), subgroups of patients with atrophy (atrophy), patients without atrophy (non-atrophy) and control group is indicated. Considering ρ with high association +/− (**), moderate association +/− (*) and low +/− or no association (no indication) according to the tabulation indicated in the methodology.
The levels of gastric zymogens PGI and PGII in serum are important indicators of the integrity and functionality of the gastric mucosa13. In our study, the lowest mean PGI values were found in the subpopulation of patients classified as having glandular atrophy. Several previous studies indicate that low levels of this zymogen (<50ng/ml) together with a low pepsinogen ratio (PGI/PGII<4) can be considered important diagnostic markers of atrophic glandular disorders44. However, recent studies show that the decrease in PGI concentration associated with a low PGI/PGII ratio may be a parameter with a more specific prognostic value for the identification of malignant processes such as intestinal metaplasia3. Alterations in the gastric mucosa are related to elevated PGII levels (>12ng/ml) together with a low pepsinogen ratio, but it is also considered a marker of active inflammation at this site9,37. In our study, the mean values of these two parameters considering the total number of patients and the subgroups with and without atrophy were consistent with the existence of alteration and inflammation of the gastric mucosa, contrary to what was observed in the control individuals whose average serological levels of PGII and pepsinogen ratio were within the normal range. The low PGI/PGII ratio has been shown to be one of the main serological markers for the diagnosis of atrophic gastritis29. Consistent with the above, the subgroup of patients classified endoscopically with atrophic mucosa in our study exhibited the lowest values of this relationship, being significantly lower with respect to the subgroup of patients without atrophy and the control population.
Altered levels of pepsinogens in blood in association with anti-H. pylori antibody titers have also been used as prognostic markers of risk for the development of gastric pathologies, including the generation of carcinogenesis. These findings have even made it possible to establish gastric cancer risk criteria considering these markers40. In order to search for potential complementary indicators related to the humoral response to the bacterium, the existence of H. pylori seroactive antigens related to gastric pathology associated with the bacterium was studied. The immunoblot analysis performed for our study populations identified a total of 31 different antigens with serological reactivity to the bacterium. Previous analyzes have identified equivalent amounts of serologically active anti-H. pylori. In a study through two-dimensional gels and using serum from infected individuals, 29 seroactive antigens were identified10. Of the seroactive antigens identified in our study, it was shown that nine exhibited a differential frequency between both groups. According to the calculated theoretical molecular weight, five of these antigens (116.7, 61.9, 38.3, 36.6 and 30.1kDa) show a molecular weight close to bands that are usually analyzed in commercial protocols for serological diagnosis of H. pylori by immunoblot, which include the molecules CagA (116kDa), UreB (61kDa), UreA (30kDa) and the 37 and 35kDa proteins41. An important serological marker of bacterial infection is vacuolating cytotoxin A (89kDa)43. Seroactivity was identified toward an antigen (88.7kDa) with a size similar to that reported for this cytotoxin; however, its frequency was equivalent between both groups (p=0.07), probably due to the high seropositivity toward H. pylori in the individuals of the control group. Despite the fact that the VacA protein is considered an important pathogenic factor of the bacterium, the equivalent serological reactivity in both groups toward an antigen similar in size to VacA could be explained by the existence of polymorphisms in various regions of the vacA gene that generates strains with different degrees of pathogenicity, a situation that was not determined in our study8. The differential seroactivity identified for the 33.8, 45.6, 54.9 and 68.8kDa antigens was of interest as they are molecules that are not included as specific diagnostic markers of infection. However, previous works report a humoral response to H. pylori proteins (33, 34, 45 and 54kDa) of a size equivalent to 3 of these seroantigens that are associated with gastroduodenal pathologies caused by this bacterium23–25,28. Although these antigens are related to gastric pathologies associated with H. pylori, they have not been shown to be specific indicators of gastric colonization of the bacterium to be included as markers of infection. The lack of specificity with H. pylori infection could perhaps be a consequence of possible cross-responses with antigens from other bacteria. Antibodies against antigens from the periodontal bacterium Campylobacter rectus and other important pathogens have shown cross antigenicity with the 54kDa protein of H. pylori7,23.
Since the modification of the levels of pepsinogens in serum is a risk condition for the development of gastric pathologies, it was of interest to find that the serological positivity of three antigens identified with differential seropositivity (33.8, 68.8 and 54.9kDa) in the two groups of study were related to alterations in the PG levels. The increase in the level of PGII related to the seroactivity of the 33.8kDa antigen in the control group may not be as relevant as a pathological marker, since it has been reported that the alteration in only some of the pepsinogens without being linked to changes in the PGI/PGII relationship has less diagnostic value for pathologies such as atrophic gastritis3,9. The humoral response to the 68.8kDa antigen could act as a potential serological factor linked to protection against the development of gastroduodenal pathologies. This considering its higher frequency in the control group in relation to the patients (OR=0.53) and that its seropositivity also in the control group was associated with PGII levels and PGI/PGII ratio in ranges of higher normality than the average levels of seronegative individuals. Since there are no previous reports that identify the 68.8kDa antigen as an immunodominant antigen of H. pylori, it is important to study it further to find out if it could be useful for prognostic purposes. Although the identity of the 68.8kDa antigen is unknown, the serological activity toward this antigen could be related to the neutralization of the proinflammatory activity of the bacterium, as is the case of outer membrane proteins that directly or through the functional activation of the Type IV Secretion System of H. pylori are linked to inflammatory processes39. The serological activity toward the 54.9kDa antigen was the only one in the group of patients that was related to altered values of pepsinogens indicative of processes of inflammation and atrophy of the gastric mucosa, since patients seropositive to this antigen showed increased average levels of PGII and a lower mean PGI/PGII ratio compared to seronegative patients. The identification of the serological activity of this antigen as a possible pathological marker in our study is consistent with pioneering work on the humoral immune response to H. pylori, which shows that serum IgG antibodies against the Hp54K (54kDa) protein of H. pylori homologous to chaperonins of the cpn60 family present in various bacteria, correlates with the severity of inflammation in gastric mucosa both in acute and chronic inflammation in patients21. It is of interest to further study the seroactivity toward this antigen as a serological parameter that could be associated with the enhancement of inflammatory processes that could affect the gastric mucosa during H. pylori infection, improving the prognostic indicators of damage.
Since glandular atrophy is an important factor related to the promotion of neoplastic processes, an attempt was made to relate it to the serological reactivity of the 9 identified antigens. Although none of the seroactive antigens exhibited higher frequencies related to the subgroup of patients with glandular atrophy, the frequency of 5 of them, including the 68.8kDa antigen, occurred more frequently in individuals without atrophy. This result supports the possibility that serological activity toward the 68.8kDa antigen could be considered a protective factor against the development of severe gastric pathologies. However, this analysis did not find a correlation with the alterations in the PGs previously identified for the seroactivity of the 54.9kDa antigen, a situation possibly related to the low number of samples studied from patients with atrophy.
Finally, the Spearman's bivariate analysis revealed the potential correlation between serum levels of pepsinogens and various parameters of the population studied. The anti-H. pylori antibody titer was the factor that presented the highest correlations with respect to the pepsinogen levels in the group of patients including the subgroups of patients with and without atrophy. This result confirms the observations that have been previously made in multiple works that indicate that the high concentration of antibodies against the bacterium linked to altered levels of pepsinogens is a relevant parameter for the serological diagnosis of various gastric pathologies11.
In conclusion, given that the humoral response to H. pylori together with the serological analysis of pepsinogen levels are important markers related to gastric mucosal damage, the identification in this study of serum alterations in pepsinogen levels related to seropositivity to antigens 33.8, 54.9 and 68.8kDa of H. pylori generates a precedent to deepen their study as possible prognostic serological markers. However, a weakness of our work was the analysis of a small number of samples limited to a single geographic region. Considering the diversity of gastric pathologies associated with H. pylori, to confirm the results obtained in our study, it is necessary to analyze populations with a much larger number of individuals, as well as the inclusion of samples from different geographic regions to also consider ethnic and environmental factors.
FundingThis work was carried out with the support of the Autonomous University of Aguascalientes through the Basic Biomedical Research Program (Institutional Project PIBB-19-5).
Conflicts of interestNone declared.
