


A novel microbiological system in microtiter plates consisting of five bioassays is presented for the detection and classification of antibiotic residues in milk. The bioassays were optimized for the detection of beta-lactams (Bioassay B: Geobacillus stearothermophilus), macrolides (Bioassay M: Bacillus megaterium with fusidic acid), tetracyclines (Bioassay T: B. megaterium with chloramphenicol), quinolones (Bioassay Q: Bacillus licheniformis) and sulfamides (Bioassay QS: B. licheniformis with trimethoprim) at levels near the maximum residue limits (MRL). The response of each bioassay was interpreted visually (positive or negative) after 4–5.5h of incubation. The system detects and classifies beta-lactams (5μg/l of amoxicillin, 4μg/l of ampicillin, 36μg/l of cloxacillin, 22μg/l of amoxicillin, 3μg/l of penicillin, 114μg/l of cephalexin, 89μg/l of cefoperazone and 116μg/l of ceftiofur), tetracyclines (98μg/l of chlortetracycline, 92μg/l of oxytetracycline and 88μg/l of tetracycline), macrolides (33μg/l of erythromycin, 44μg/l of tilmicosin and 50μg/l of tylosin), sulfonamides (76μg/l of sulfadiazine, 85μg/l of sulfadimethoxine, 77μg/l of sulfamethoxazole and 87μg/l of sulfathiazole) and quinolones (94μg/l of ciprofloxacin, 98μg/l of enrofloxacin and 79μg/l marbofloxacin). In addition, the specificity values were high for B, T, Q (99.4%), M (98.8%) and QS (98.1%) bioassays. The control of antibiotics through this system can contribute to improving the quality and safety of dairy products.
Se presenta un novedoso sistema microbiológico en placas de microtitulación compuesto por 5 bioensayos para la detección y clasificación de residuos de antibióticos en leche. Los bioensayos fueron optimizados para la detección de betalactámicos (bioensayo B: Geobacillus stearothermophilus), macrólidos (bioensayo M: Bacillus megaterium con ácido fusídico), tetraciclinas (bioensayo T: Bacillus megaterium con cloranfenicol), quinolonas (bioensayo Q: Bacillus licheniformis) y sulfamidas (bioensayo QS: Bacillus licheniformis con trimetoprima), a niveles cercanos a los límites máximos de residuos (LMR). La respuesta de cada bioensayo se interpretó visualmente (positiva o negativa) después de 4 a 5,5h de incubación. El sistema detecta y clasifica betalactámicos (5μg/l de amoxicilina, 4μg/l de ampicilina, 36μg/l de cloxacilina, 22μg/l de amoxicilina, 3μg/l de penicilina, 114μg/l de cefalexina, 89μg/l de cefoperazona y 116μg/l de ceftiofur), tetraciclinas (98μg/l de clortetraciclina, 92μg/l de oxitetraciclina y 88μg/l de tetraciclina), macrólidos (33μg/l de eritromicina, 44μg/l de tilmicosina y 50μg/l de tilosina), sulfamidas (76μg/l de sulfadiacina, 85μg/l de sulfadimetoxina, 77μg/l de sulfametoxazol y 87μg/l de sulfatiazol) y quinolonas (94μg/l de ciprofloxacina, 98μg/l de enrofloxacina y 79μg/l de marbofloxacina). Además, los valores de especificidad fueron altos para los bioensayos B, T, Q (99,4%), M (98,8%) y QS (98,1%). El control de residuos de antibióticos mediante este sistema puede contribuir a mejorar la calidad e inocuidad de los productos lácteos.
Various pathologies of milk-producing cattle, such as mastitis, metritis, pneumonia, enteritis and lameness26, are treated with penicillins6, ceftiofur16, oxytetracycline5,24, tylosin and enrofloxacin15, respectively.
Residues of these molecules could remain in the milk and cause adverse effects on consumer health, such as hypersensitivity reactions, allergy and resistance development17,22,8,1. In addition, the presence of these substances can delay acidification of fermented products, inhibit starter cultures and alter some properties involved in cheese ripening3,4.
In order to prevent the risks of antibiotic residues in milk, the European Community has established the maximum residue limits (MRL) and the procedures for their determination by Regulation EC 470/200910 and Regulation EC 37/201011. Furthermore, in the USA, the Food and Drug Administration has determined the levels of tolerance of antibiotic residues in milk for consumer protection12.
Several screening tests have been developed for the control of antibiotic residues at permitted levels. In surveillance programs of veterinary drug residues, microbiological methods are widely used23, because they are inexpensive, allow large number of samples and do not require microbiology-trained staff. Moreover, these methods have detection limits similar to the MRL for beta-lactams, tetracyclines and sulfamides in milk; however, they do not detect residues of other antibiotics such as macrolides and quinolones14,2.
Thus, Nagel et al.20 proposed bioassays that use several bacteria-tests with specific sensitivity for different groups of antibiotics used in the disease treatment of dairy cattle. These bioassays integrate a Microbiological System with dichotomous responses (positive – negative) of easy interpretation in a maximum time of 6h. This detection metodology detects and classifies residues in four antibiotic groups (beta-lactams, tetracyclines, sulfonamides and quinolones), but with cross-specificity to some macrolides (tylosin, tilmicosin, erythromycin) and aminoglycosides (neomycin).
Therefore, the aim of this study was to evaluate a Microbiological System in microtiter plates (SMmp) to detect and classify antibiotic residues in five groups (beta-lactams, tetracyclines, sulfonamides, quinolones and macrolides) to provide a dichotomous response (positive or negative) in less than 6h, to be used routinely by milk quality control laboratories.
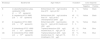
Materials and methodsDesign of a microbiological system in microtiter plates (MSmp)With the purpose of detecting and classifying antibiotic residues in milk, a microbiological system consisting of five bioassays was designed. This System is constituted by Bioassay B (beta-lactams), Bioassay T (tetracyclines), Bioassay M (macrolides), Bioassay Q (quinolones) and Bioassay QS (quinolones and sulfonamides). Table 1 shows culture media, concentration of sensitivity-enhancing agents, spore concentration of bacteria-tests, indicators, pH, incubation conditions for each bioassay that integrates the MSmp.
Composition of bioassays that integrate the microbiological system evaluated
| Bioassays | Bacteria test | Agar medium | Incubation | Color response | |
|---|---|---|---|---|---|
| Negative | Positive | ||||
| B | G. stearothermophilus subsp. calidolactis C 953 (2×10⁶spores/ml) | Brilliant black (100mg/l) toluidine blue (270mg/l), pH 8.2 | 64°C, 4h | Yellow | Black |
| T | B. megaterium ATCC 9885 (2.8×10⁸spores/ml) | Brilliant black (200mg/l) toluidine blue (10mg/l), pH 8.5, chloramphenicol (2000μg/l) | 45°C, 5h | Yellow | Black |
| M | B. megaterium ATCC 9885 (2.8.×108spores/ml) | Brillant black (200mg/l) toluidine blue (10mg/l), pH 8.0, fusidic acid (200μg/l) | 45°C, 5h | Yellow | Black |
| Q | B. licheniformis ATCC 14580 (4.2×10¹⁰spores/ml) | Triphenyl tetrazolium (200mg/l) toluidine blue (10mg/l), pH 7.0 | 45°C, 5.5h | Pink | Blue |
| QS | B. licheniformis ATCC 14580 (4.2×10¹⁰spores/ml) | Triphenyl tetrazolium (200mg/l) toluidine blue (10mg/l), pH 7.0, trimethoprim (100μg/l) | 45°C, 5.5h | Pink | Blue |
B: beta-lactams; T: tetracyclines; M: macrolides; Q: quinolones; QS: quinolones-sulfamides.
Mueller Hinton Agar (38g/l, Biokar®, Ref. 10272, France) fortified with glucose (10g/l, Sigma Aldrich®, Ref. G8270, USA) was used and sterilized at 121°C for 15min. Then, each bioassay was added with redox indicators, spores of specific microorganisms, and sensitivity-improving substances (chloramphenicol, fusidic acid or trimethoprim), as described in Table 1. Subsequently, 100μl of medium was dispensed into each of the 96 wells of the microtiter plate with an electronic dispenser (Eppendorf Research® Pro, Hamburg, Germany) and then, the plates were heat-sealed with aluminum foil coated with polypropylene and stored in a refrigerator (4°C) until use.
Antibiotic solutions and fortified samplesFor the preparation of antimicrobial solutions, standard antibiotics from Sigma Chemical Co. (St. Louis, MO, USA) were used. Aqueous solutions for each antibiotic were prepared in 10ml volumetric flasks at a concentration of 1000mg/l at the time of analysis to avoid possible alteration of molecules and/or their properties.
Dose–response curvesThe dose–response curves were constructed for eight beta-lactams (amoxicillin, ampicillin, cloxacillin, oxacillin, penicillin ‘G’, cefoperazone, ceftiofur and cephalexin), three tetracyclines (chlortetracycline, oxytetracycline and tetracycline), three macrolides (erythromycin, tylosin and tilmicosin), three quinolones (ciprofloxacin, enrofloxacin and marbofloxacin), four sulfonamides (sulfadiazine, sulfadimethoxine, sulfamethoxazole and sulfathiazole) and three aminoglycosides (kanamycin, neomycin and streptomycin), according to the Codex Alimentarius guidelines9.
For this purpose, 16 replicas of 12 concentrations were tested to obtain negative results in the first two concentrations and positive results in the last two concentrations tested. Then, 50μl milk samples fortified with antibiotics were added to each bioassay well. The microplates were sealed with adhesive film and incubated under conditions of time and temperature to allow the color change of the control samples (Table 1).
Interpretation of resultsBioassay responses were visually interpreted by three specialists independently. Each analysis was classified in terms of “positive” or “negative” when there were at least two coincident results.
Milk samples not containing or containing antibiotics at concentrations lower than the method detection limit will allow the growth of the test bacterium, accompanied by a change in the potential redox of the culture medium, manifested by a change in the coloration of the redox indicators. Thus, Bioassays B, M and T, which contained brilliant black and toluidine blue, changed to yellow (negative result), whereas Bioassays Q and QS, which contained triphenyltetrazolium and toluidine blue, changed to pink (negative result) after incubation (Table 1).
Conversely, when a milk sample contains antibiotic residues at levels above the detection limit of each molecule for a bioassay, it will not allow the growth of the microorganism, and thus there will be no change in the redox potential and the original color of the bioassay will remain. Thus, the persistence of the black color in Bioassays B, T and M indicated the presence of antibiotics in milk, whereas the persistence of the blue color in Bioassays Q and QS also indicated the presence of antibiotics in milk.
Calculation of detection limitsThe frequencies of positive results were analyzed according to the following logistic regression model (StatGraphics Centurion X, 2007)25:
where: Lij=logistic linear model; [Pij]=logit [Pp/(1−Pp)]: (probability of a “positive” response/probability of a “negative” response), β0 and β1=parameters calculated by the logistic model; [ATB]i=antibiotic concentration (i=1, 2,..., 12 levels); and ɛij=residual error.
The detection limits were calculated as the concentration producing 95% of positive frequencies7,9.
Specificity of each bioassayA total of 160 milk samples from Holstein Friesian cows 60–90 days postpartum with normal values of chemical composition (protein: 2.10–5.75g/100ml, fats: 2.38–6.03g/100ml, lactose: 3.63–5.17g/100ml, total solids: 9.31–12.86g/100ml), Bacterial Colony Count (BCC: 13.000–99.000/ml) and Somatic Cell Count (SCC: 2.000–392.000/ml) were used according to the Codex Alimentarius9. The chemical composition, SCC and BCC were determined using Milko Scan FT-120 (Foss Somatic, USA), Fossomatic 90 (Foss Electric, USA) and BactoScan 8.000S (Foss Electric, USA), respectively. Milk samples were analyzed with the five bioassays (B, T, M, Q and QS) in triplicate. For this purpose, 50μl of milk samples was added in each single well of each bioassay and then incubated in a water floating bath at a temperature-time for each bioassay (Table 1). Samples were analyzed simultaneously by the Delvotest® SP method (DSM, Delft, the Netherlands), which is considered a reference method. Then, specificity (%) was calculated using the following mathematical equation:
Results and discussionDetection limits of the bioassays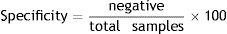
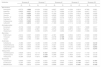
Table 2 shows the results obtained by applying the logistic regression model for the 24 antibiotics tested with each of the five bioassays (B, T, M, Q and QS). The adjustments obtained by the logistic regression model were good, since the concordance coefficients were between 98.7% and 99.4%.
Coefficients calculated by the Logistic regression model for the dose–response curve
| Antibiotics | Bioassay B | Bioassay T | Bioassay M | Bioassay Q | Bioassay QS | |||||
|---|---|---|---|---|---|---|---|---|---|---|
| β0 | β1 | β0 | β1 | β0 | β1 | β0 | β1 | β0 | β1 | |
| Beta-lactams | ||||||||||
| Amoxycillin | −6.3773 | 1.9392 | −4.9124 | 0.0545 | −4.9057 | 0.0537 | −9.1554 | 0.0219 | −8.7600 | 0.0261 |
| Ampicillin | −8.8622 | 3.0737 | −6.1354 | 0.0937 | −6.1772 | 0.0924 | −4.7193 | 0.0384 | −4.4617 | 0.0377 |
| Cloxacillin | −11.836 | 0.4084 | −5.1654 | 0.0335 | −5.1424 | 0.0389 | −9.1554 | 0.0219 | −8.3468 | 0.0206 |
| Oxacillin | −16.313 | 0.8706 | −4.8035 | 0.0339 | −4.8032 | 0.0325 | −7.2449 | 0.0267 | −7.2674 | 0.0259 |
| Penicillin “G” | −15.299 | 5.5301 | −10.916 | 0.0752 | −10.955 | 0.0724 | −5.0872 | 0.1476 | −5.0768 | 0.1456 |
| Cephalexin | −9.7361 | 0.1112 | −4.8526 | 0.0120 | −4.8602 | 0.0117 | −10.237 | 0.0151 | −10.364 | 0.0153 |
| Cefoperazone | −5.9080 | 0.0995 | −4.8658 | 0.0033 | −4.8596 | 0.0032 | −6.3529 | 0.0129 | −6.3398 | 0.0127 |
| Ceftiofur® | −4.2313 | 0.0616 | −11.861 | 0.0239 | −11.859 | 0.0233 | −7.1114 | 0.0128 | −7.1498 | 0.0127 |
| Aminoglycosides | ||||||||||
| Kanamycin | −18.733 | 0.0026 | −15.398 | 0.0246 | −15.332 | 0.0259 | −7.3300 | 0.0017 | −7.8288 | 0.0017 |
| Neomycin | −10.903 | 0.0099 | −2.9801 | 0.0061 | −2.9754 | 0.0064 | −8.8972 | 0.0002 | −8.9971 | 0.0002 |
| Streptomycin | −12.197 | 0.0045 | −13.685 | 0.0276 | −13.537 | 0.0262 | −11.057 | 0.0002 | −10.906 | 0.0002 |
| Macrolides | ||||||||||
| Erythromycin | −6.5414 | 0.0337 | −5.6254 | 0.0907 | −4.1801 | 0.2181 | −5.5534 | 0.0079 | −5.5484 | 0.0080 |
| Tilmicosin | −5.7655 | 0.0262 | −6.6341 | 0.0901 | −4.0196 | 0.1428 | −10.822 | 0.0146 | −10.819 | 0.0141 |
| Tylosin | −4.6664 | 0.1454 | −7.4681 | 0.0998 | −3.0152 | 0.1198 | −8.7288 | 0.0205 | −8.7291 | 0.0209 |
| Sulfamides | ||||||||||
| Sulfadiazine | −10.884 | 0.0007 | −14.268 | 0.0060 | −14.188 | 0.0059 | −12.282 | 0.0102 | −16.282 | 0.2123 |
| Sulfadimethoxine | −16.567 | 0.0023 | −18.394 | 0.0103 | −18.321 | 0.0102 | −11.982 | 0.0096 | −21.825 | 0.2541 |
| Sulfamethoxazole | −15.294 | 0.0044 | −14.895 | 0.0074 | −14.961 | 0.0075 | −13.912 | 0.0120 | −15.912 | 0.2052 |
| Sulfathiazole | −19.432 | 0.0051 | −13.701 | 0.0054 | −13.698 | 0.0055 | −11.709 | 0.0119 | −23.709 | 0.2707 |
| Tetracyclines | ||||||||||
| Chlortetracycline | −4.6026 | 0.0012 | −13.119 | 0.1637 | −9.3559 | 0.0576 | −11.647 | 0.0137 | −11.723 | 0.0134 |
| Oxytetracycline | −10.811 | 0.0072 | −8.6151 | 0.1258 | −10.999 | 0.0691 | −7.3439 | 0.0121 | −7.3774 | 0.0123 |
| Tetracycline | −18.384 | 0.0124 | −7.4310 | 0.0809 | −10.174 | 0.0591 | −7.1065 | 0.0088 | −7.1163 | 0.0085 |
| Quinolones | ||||||||||
| Ciprofloxacin | −6.3695 | 0.0337 | −15.356 | 0.0521 | −15.329 | 0.0518 | −7.0710 | 0.1060 | −7.0712 | 0.1097 |
| Enrofloxacin | −12.297 | 0.0037 | −3.9754 | 0.0064 | −3.9535 | 0.0067 | −7.9332 | 0.1106 | −7.9877 | 0.1112 |
| Marbofloxacin | −7.3085 | 0.0015 | −3.9744 | 0.0066 | −3.9986 | 0.0067 | −6.5049 | 0.1091 | −6.5235 | 0.1035 |
B: beta-lactams; T: tetracyclines; M: macrolides; Q: quinolones; QS: quinolones-sulfonamides. β0 and β1: parameters calculated by the logistic model.
β1 coefficient values in bold for the same group of antibiotics indicate greater bioassay sensitivity compared to other bioassays of MSmp.
Coefficient β1 indicates the slope of the dose–response curve. Higher values of this coefficient indicate good sensitivity of the bacteria-test to detect antibiotics in milk. Bioassay B had a higher coefficient β1 for beta-lactam antibiotics (between 0.0616 and 5.5301) in addition to tylosin (0.1458) and neomycin (0.0099). Bioassay T showed high values of β1 for the three tetracyclines studied (β1Chlortetracycline=0.1637; β1Oxitetracycline=0.1258; β1Tetracycline=0.0809). Bioassay M had high values of this coefficient for macrolides (β1Erythromycin=0.2181; β1Tilmicosin=0.1425; β1Tylosin=0.1198). Bioassay Q showed similar coefficients β1 for the three quinolones (between 0.1060 and 0.1106), and bioassay QS (with trimethoprim) also exhibited high coefficients β1 for sulfonamides (between 0.2052 and 0.2707).
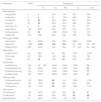
The detection limits (DL) calculated for each molecule by the logistic regression model and the respective MRL9 are summarized in Table 3. For beta-lactams, Bioassay B showed detection limits (DL) similar to their MRL (amoxicillin: 5μg/l, ampicillin: 4μg/l, cloxacillin 36μg/l, oxacillin: 22μg/l, penicillin ‘G’ 3μg/l, cephalexin 114μg/l, cefoperazone: 89μg/l, ceftiofur: 116μg/l). By contrast, in Bioassays M, T, Q and QS, beta-lactams had to be present in milk at levels above 5 MRL to produce positive results.
Detection limits (μg/l) of microbiological system in microplates
| Antibiotics | MRLa | Bioassays | ||||
|---|---|---|---|---|---|---|
| B | TC | MC | Q | QS | ||
| Beta-lactams | ||||||
| Amoxycillin | 4 | 5 | 150 | 140 | 550 | 540 |
| Ampicillin | 4 | 4 | 97 | 100 | 200 | 190 |
| Cloxacillin | 30 | 36 | 242 | 208 | 550 | 550 |
| Oxacillin | 30 | 22 | 229 | 250 | 380 | 390 |
| Penicillin “G” | 4 | 3 | 184 | 200 | 54 | 55 |
| Cephalexin | 100 | 114 | 650 | 670 | 870 | 870 |
| Cefoperazone | 50 | 89 | 2360 | 2500 | 720 | 730 |
| Ceftiofur® | 100 | 116 | 500 | 500 | 780 | 795 |
| Aminoglycosides | ||||||
| Kanamycin | 100 | 8300 | 620 | 590 | 5900 | 6020 |
| Neomycin | 1500 | 1400 | 460 | 450 | 59300 | 59500 |
| Streptomycin | 200 | 3400 | 490 | 500 | 70100 | 69200 |
| Macrolides | ||||||
| Erythromycin | 40 | 280 | 94 | 33 | 1070 | 1100 |
| Tilmicosin | 50 | 350 | 106 | 44 | 700 | 760 |
| Tylosin | 50 | 52 | 104 | 50 | 450 | 400 |
| Sulfamides | ||||||
| Sulfadiazine | 100 | 18100 | 2400 | 2400 | 1500 | 76 |
| Sulfadimethoxine | 100 | 8200 | 1800 | 1800 | 1500 | 85 |
| Sulfamethoxazole | 100 | 4100 | 1900 | 1900 | 1400 | 77 |
| Sulfathiazole | 100 | 4400 | 2500 | 2500 | 1200 | 87 |
| Tetracyclines | ||||||
| Chlortetracycline | 100 | 5900 | 98 | 214 | 1060 | 1100 |
| Oxytetracycline | 100 | 1800 | 92 | 202 | 850 | 840 |
| Tetracycline | 100 | 1700 | 88 | 222 | 1200 | 1100 |
| Quinolones | ||||||
| Ciprofloxacin | 100 | 4100 | 290 | 300 | 94 | 91 |
| Enrofloxacin | 100 | 4000 | 590 | 560 | 98 | 98 |
| Marbofloxacin | 75 | 6800 | 1050 | 1100 | 79 | 77 |
B: beta-lactams; TC: tetracyclines; MC: macrolides; Q: quinolones; QS: quinolones-sulfonamides.
The detection limits for beta-lactams calculated in Bioassay B (Table 3) were lower than those reported by Nagel et al.20 for a bioassay in microtiter plates using Geobacillus stearothermophilus (4μg/l of penicillin, 14μg/l of amoxicillin, 8μg/l of ampicillin, 49μg/l of cloxacillin, 25μg/l of oxacillin, 190μg/l of ceftiofur, 190μg/l of cephalexin and 140μg/l of cefoperazone). For assays in Petri dishes using G. stearothermophilus, Nouws et al.21 reported lower detection levels (2μg/l of penicillin, 3μg/l of amoxicillin, 2μg/l of ampicillin, 15μg/l of cloxacillin, 20μg/l of oxacillin, 30μg/l of ceftiofur, 45μg/l of cephalexin, 30μg/l of cefoperazone). Similarly, Gaudin et al.13 reported DL that were similar to those obtained in this work (Table 3) in Petri dishes (12–16μg/l of penicillin “G”, 6–5μg/l of ampicillin, 16μg/l of amoxicillin, 50μg/l of cloxacillin, 30μg/l of oxacillin, 125μg/l of ceftiofur, 80μg/l of cefoperazone and 30μg/l of cephalexin).
With respect to Bioassay T, it should be noted that the DL obtained were similar to the MRL (100μg/l) for chlortetracycline (98μg/l) and oxytetracycline (92μg/l) and slightly higher for tetracyclines (128μg/l) due to the improvement in sensitivity of B. megaterium with chloramphenicol29. However, Bioassay M using the same microorganism without the addition of chloramphenicol showed positive results when tetracyclines were present at greater levels than 2 times the MRL (Table 3).
The detection limits of tetracyclines for Bioassay T (Table 3) were slightly lower than those calculated by Nagel et al.18,20 when using a bioassay with B. cereus spores in microtiter plates (chlortetracycline: 330μg/l, oxytetracycline: 110μg/l, tetracycline: 110μg/l). In previous studies, Tumini et al.28 found detection limits that were similar to those obtained in this work for a bioassay containing B. pumilus (chlortetracycline 117μg/l, oxytetracycline: 142μg/l, tetracycline: 105μg/l).
For assays in Petri dishes, Nouws et al.21 obtained values lower than those calculated in this work when using B. cereus after 18h incubation (10μg/l of chlortetracycline, 30μg/l of oxytetracycline and 30μg/l of tetracycline). Tsai and Kondo27 and Gaudin et al.13 reported higher levels than those calculated in this study (Table 3) when using assays in Petri dishes (chlortetracycline: 100–200μg/l, oxytetracycline: 200–250μg/l, tetracycline: 200–250μg/l).
With regard to macrolides, Bioassay M presented adequate detection limits for erythromycin (33μg/l), tilmicosin (49μg/l) and tylosin (50μg/l). The sensitivity to these compounds can be attributed to the incorporation of fusidic acid in the culture medium containing B. megaterium spores30. Conversely, macrolides must be present in milk at concentrations between 2 and 3 times the MRL to produce positive results in bioassay T (Table 3).
The detection limits of macrolides obtained by using Bioassay M (Table 3) were higher than those reported by Nouws et al.21 for erythromycin (10μg/l) and tilmicosin (6μg/l) but lower than those reported for tylosin (100μg/l) when using Kocuria rhizophila in Petri dishes. Moreover, Gaudin et al.13 estimated similar DL for erythromycin (20–30μg/l) and tilmicosin (25–50μg/l) and higher ones for tylosin (150–200μg/l) in a method in Petri dishes containing the same microorganism. However, both Nouws et al.21 and Gaudin et al.13 obtained a response after 18–24h of incubation.
The residues of quinolones in milk were detected by Bioassays Q and QS, with DL similar to the MRL for ciprofloxacin (Q: 94μg/l QS: 91μg/l), enrofloxacin (Q and QS: 98μg/l) and marbofloxacin (Q: 87μg/l QS: 91μg/l) due to the good sensitivity of B. licheniformis for quinolones31.
For quinolone residues, the DL of bioassays Q and QS (Table 3) were lower than those reported by Nagel et al.20 when using a bioassay in microtiter plates containing B. subtilis spores (150μg/l of ciprofloxacin, 160μg/l of enrofloxacin and 160μg/l of marbofloxacin). By using bioassays in Petri dishes containing Escherichia coli cells and after 24h of incubation, Nouws et al.21 (4μg/l of enrofloxacin and 5μg/l marbofloxacin) and Gaudin et al.13 detected low concentrations of quinolones in milk (10μg/l of ciprofloxacin, 20μg/l of enrofloxacin and 30μg/l of marbofloxacin).
For sulfonamides, the addition of trimethoprim into the culture medium containing B. licheniformis spores (Bioassay QS) significantly improved the detection of sulfadiazine (76μg/l), sulfadimethoxine (85μg/l), sulfamethoxazole (77μg/l) and sulfathiazole (87μg/l) with respect to bioassay Q without trimethoprim (Table 3).
The detection limits for sulfonamides in milk calculated when using Bioassay QS (Table 3) were lower than those reported by Nagel et al.20 for sulfadiazine (160μg/l), sulfadimethoxine (260μg/l), sulfamethoxazole (120μg/l) and sulfathiazole (110μg/l) when using a bioassay with B. subtilis and trimethoprim in the culture medium. However, in an assay in Petri dish with B. subtilis spores and requiring 18–24h of incubation, Nouws et al.21 obtained lower levels for residues of sulfadiazine (30μg/l) and sulfadimethoxine (20μg/l) than those reported in Table 3, while Gaudin et al.13 obtained higher detection limits for sulfadiazine (100μg/l), sulfadimethoxine (175μg/l), sulfamethoxazole (100μg/l) and sulfathiazole (1000μg/l).
Specificity of the bioassaysThe results of specificity for each bioassay are detailed in Table 4. It can be observed that bioassays B, T and Q had high specificity (99.4%), as determined by the Delvotest® SP method, and that the specificity of bioassays M (98.8%) and QS (98.1%) was slightly lower than that of the other methods. It should be noted that Nagel et al.18,19 and Tumini et al.28 reported specificities between 99.0–99.5% (B. cereus), 95.8–98.9% (B. subtilis) and 97.9–98.9% (B. pumilus) respectively when optimizing microbiological methods in microtiter plates.
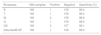
Cross-specificity of the five-bioassay systemIn order to simultaneously visualize the detection profiles of the five bioassays for the 24 antibiotics studied, we constructed Figure 1. The radial diagram was constructed in logarithmic scale due to the large amplitude in the range of the detection system (Table 3) since the DL were between 3μg/l (penicillin with bioassay B) and 70100μg/l (streptomycin with bioassay Q). In addition, a logarithmic relative scale was chosen in terms of the MRL for each molecule (Log DL/MRL) because it allows to visualize the similarity or discrepancy between the DL and MRL of each antibiotic. In this diagram, circle 1 corresponds to Log DL/MRL=0.1 values (the bioassay detects antibiotics below MRL levels), circle 2 corresponds to Log DL/MRL=1 (limits equivalent to LMR detection), circle 3 indicates Log DL/MRL=10 MRL and circle 4 indicates Log DL/MRL=100 MRL (the bioassay does not detect the antibiotic).
 for microbiological five-bioassay system. Circle 1=0.1 MRL, Circle 2=MRL, Circle 3=10 MRL and Circle 4=100 MRL.")
It can be observed that Bioassay B (blue line) detected the eight beta-lactam antibiotics, as well as tylosin and neomycin; Bioassay T (red line) detected the three tetracyclines and neomycin; Bioassay M (green line) detected the three macrolides and neomycin; Bioassay Q (black line) detected only the three quinolones, and Bioassay QS (purple line) detected the four sulfonamides and the three quinolones. It is also noted that kanamycin and streptomycin were not detected by any of the five bioassays.
In summary, a simple visual analysis of the color of each bioassay easily allows to classify an antibiotic residue into five categories. The simultaneous detection of quinolones (two bioassays), tylosin (two bioassays) and neomycin (three bioassays) provide a tool to ensure the presence of residues, thereby improving food security.
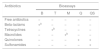
Antibiotic classification by the five-bioassay systemTable 5 summarizes the visual interpretation of the results obtained by the simultaneous analysis of the five bioassays. Responses are visually observed by the color change in each method. For Bioassays B, T and M, the yellow color indicates a negative result, whereas the black color indicates a positive result. For bioassays Q and QS, the pink color indicates a negative result, whereas blue indicates a positive result.
Interpretation of results of the microbiological system in microplates
| Antibiotics | Bioassays | ||||
|---|---|---|---|---|---|
| B | T | M | Q | QS | |
| Free antibiotics | − | − | − | − | − |
| Beta-lactams | +a | − | − | − | − |
| Tetracyclines | − | +b | − | − | − |
| Macrolides | − | − | +b | − | − |
| Quinolones | − | − | − | + | + |
| Sulfonamides | − | − | − | − | + |
B: beta-lactams; T: tetracyclines; M: macrolides; Q: quinolones; QS: quinolones-sulfonamides.
The presence of beta-lactams in milk was visualized by the persistence of the original black color in Bioassay B. Tetracycline residues were observed by the persistence of the black color in bioassay T, whereas macrolide residues were observed by the persistence of the black color in bioassay M. Sulfonamides were observed by the persistence of the original blue color in bioassay QS, while quinolone residues were evidenced by the persistence of the original blue color in bioassays Q and QS.
Table 5 shows that neomycin residues were evidenced by the persistence of the original colors of bioassays B, T and M, while tylosin residues were evidenced by the persistence of the original colors of bioassays B and M (Table 3). Finally, it should be noted that the milk samples that produced color change in the five bioassays were classified as negative samples either because they had no antibiotic or the antibiotics were below the detection limits of each bioassay.
ConclusionThe microbiological system in microtiter plates consisting of Bioassays B (G. stearothermophilus), Bioassays T (B. megaterium), Bioassays M (B. megaterium and fucsidic acid), Bioassays Q (B. licheniformis) and Bioassays QS (B. licheniformis and trimetoprim) can detect a large amount of antibiotic residues in milk and allows to classify residues in beta-lactams, tetracyclines, macrolides, quinolones and sulfonamides. This system provides a simple dichotomous colorimetric response with visual interpretation and allows to analyze a large number of samples in a short period of incubation (4–5.5h).
The simultaneous use of five bioassays represents a more efficient and rigorous control mechanism than the use of a single-bioassay microbiological system. Indeed, the routine implementation of this system in quality control microbiological laboratories may contribute to improving food security. Furthermore, in contrast to microbiological systems in Petri dishes, which should be used immediately after preparation, this microbiological system designed in a microtiter plate format heat-sealed with aluminized paper and containing sporulated bacteria allows the marketing, refrigerated transport and storage in a refrigerator at 4°C in the laboratory before being used. In the future, new bioassays using microorganisms with specific sensitivity to aminoglycosides should be developed to improve the detection profile and classification of antibiotic residues in milk.
Conflict of interestThe authors declare that they have no conflicts of interest
FundingThis research work was carried out as part of the CAI+D’16 Projects (PIC 50420150100113LI, Res. HCS 128/17, Universidad Nacional del Litoral, Santa Fe, Argentina).
